 |
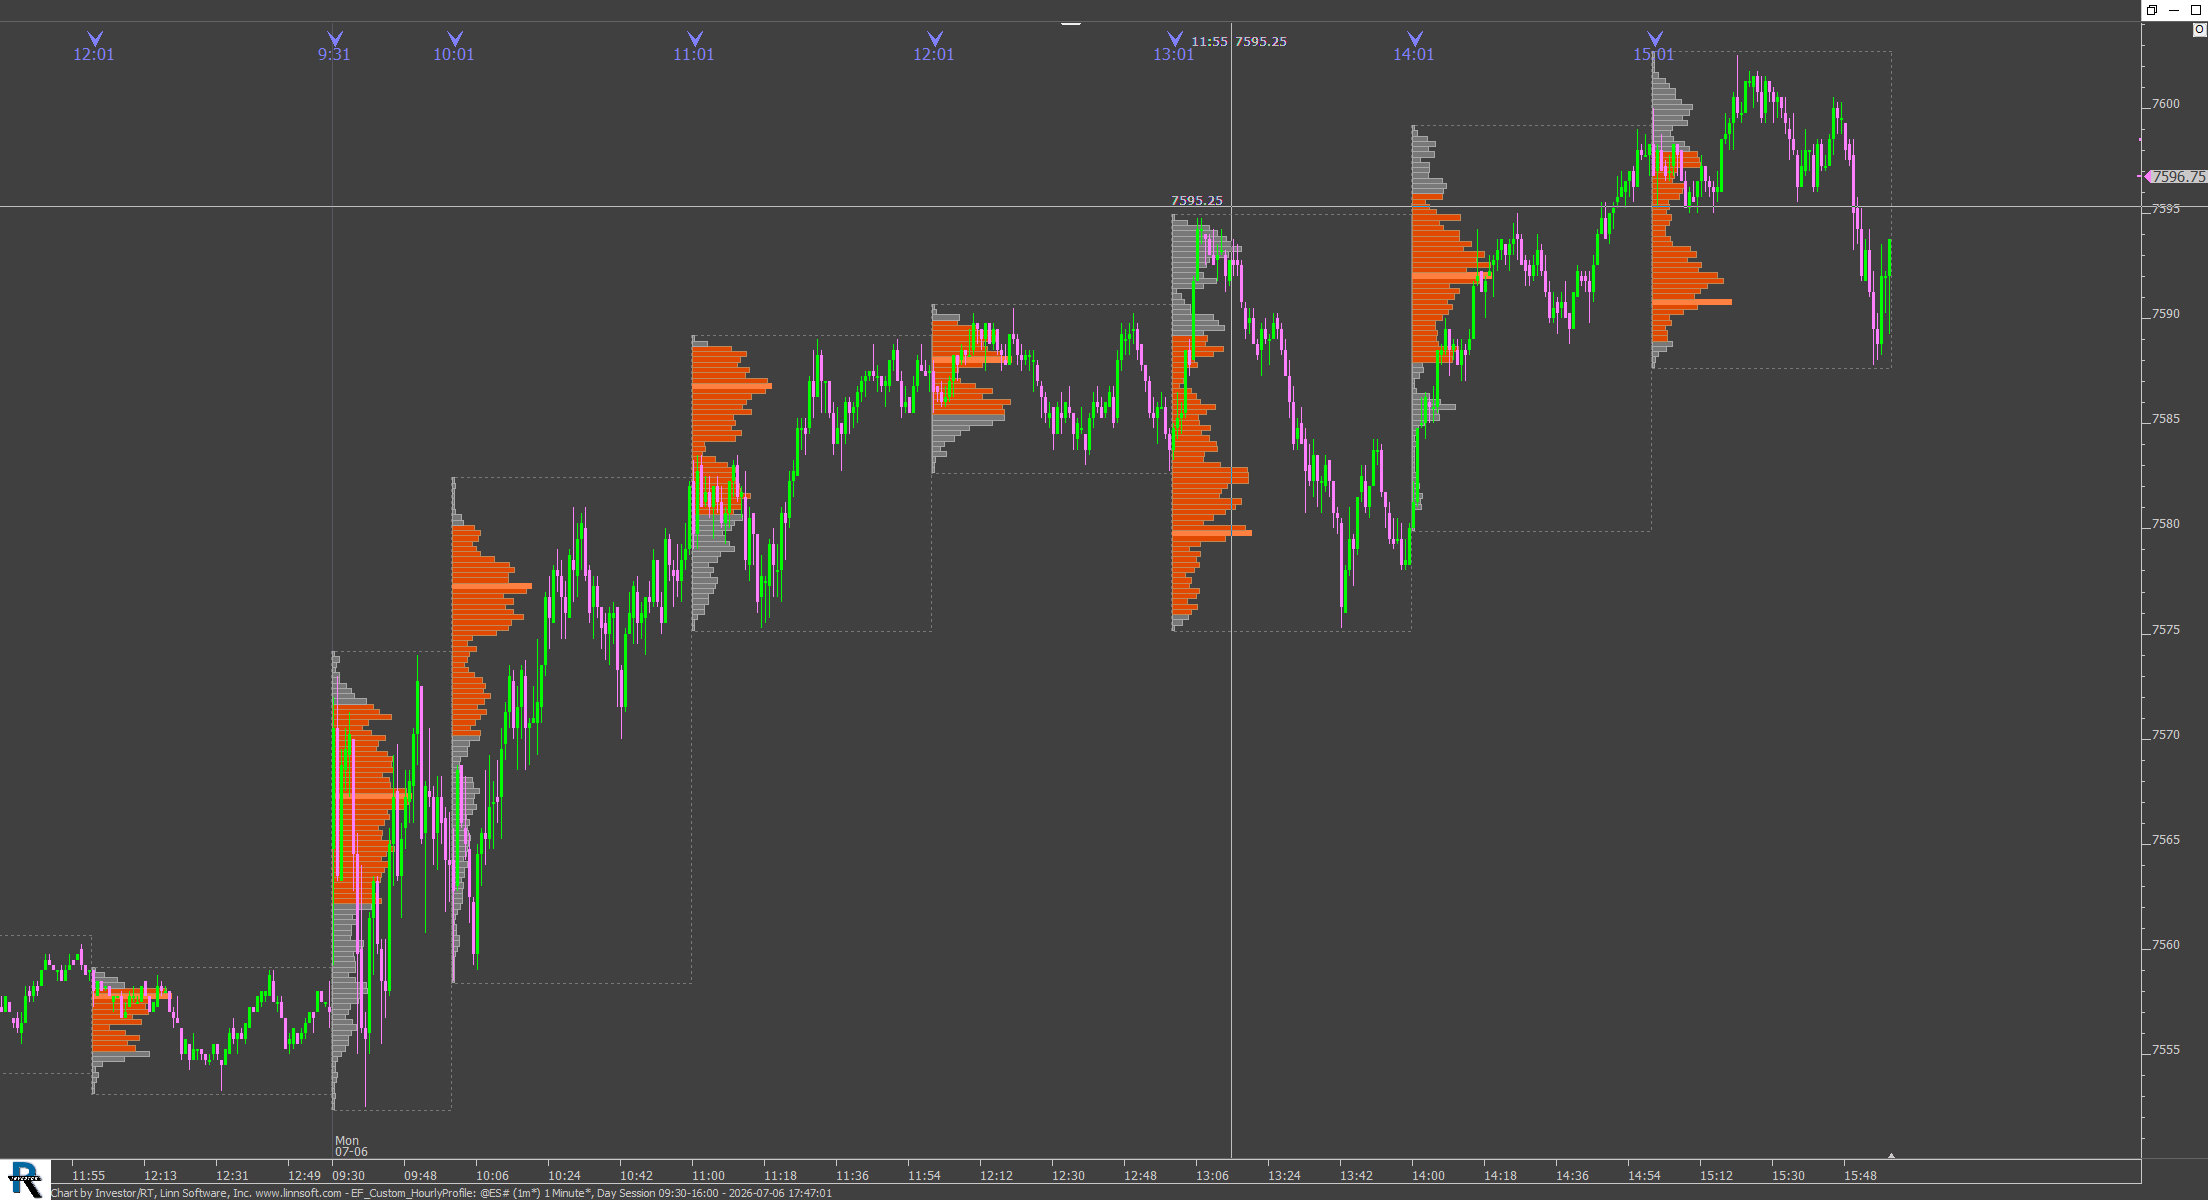
EF Custom HourlyProfile (@ES#) Eddy [totalcount]
1 week 1 hour ago
Using the Position token, a custom signal is creating to return a true value on the first bar of the session and at the start of every hour so that a custom profiles, with such start time, may be... |
View |
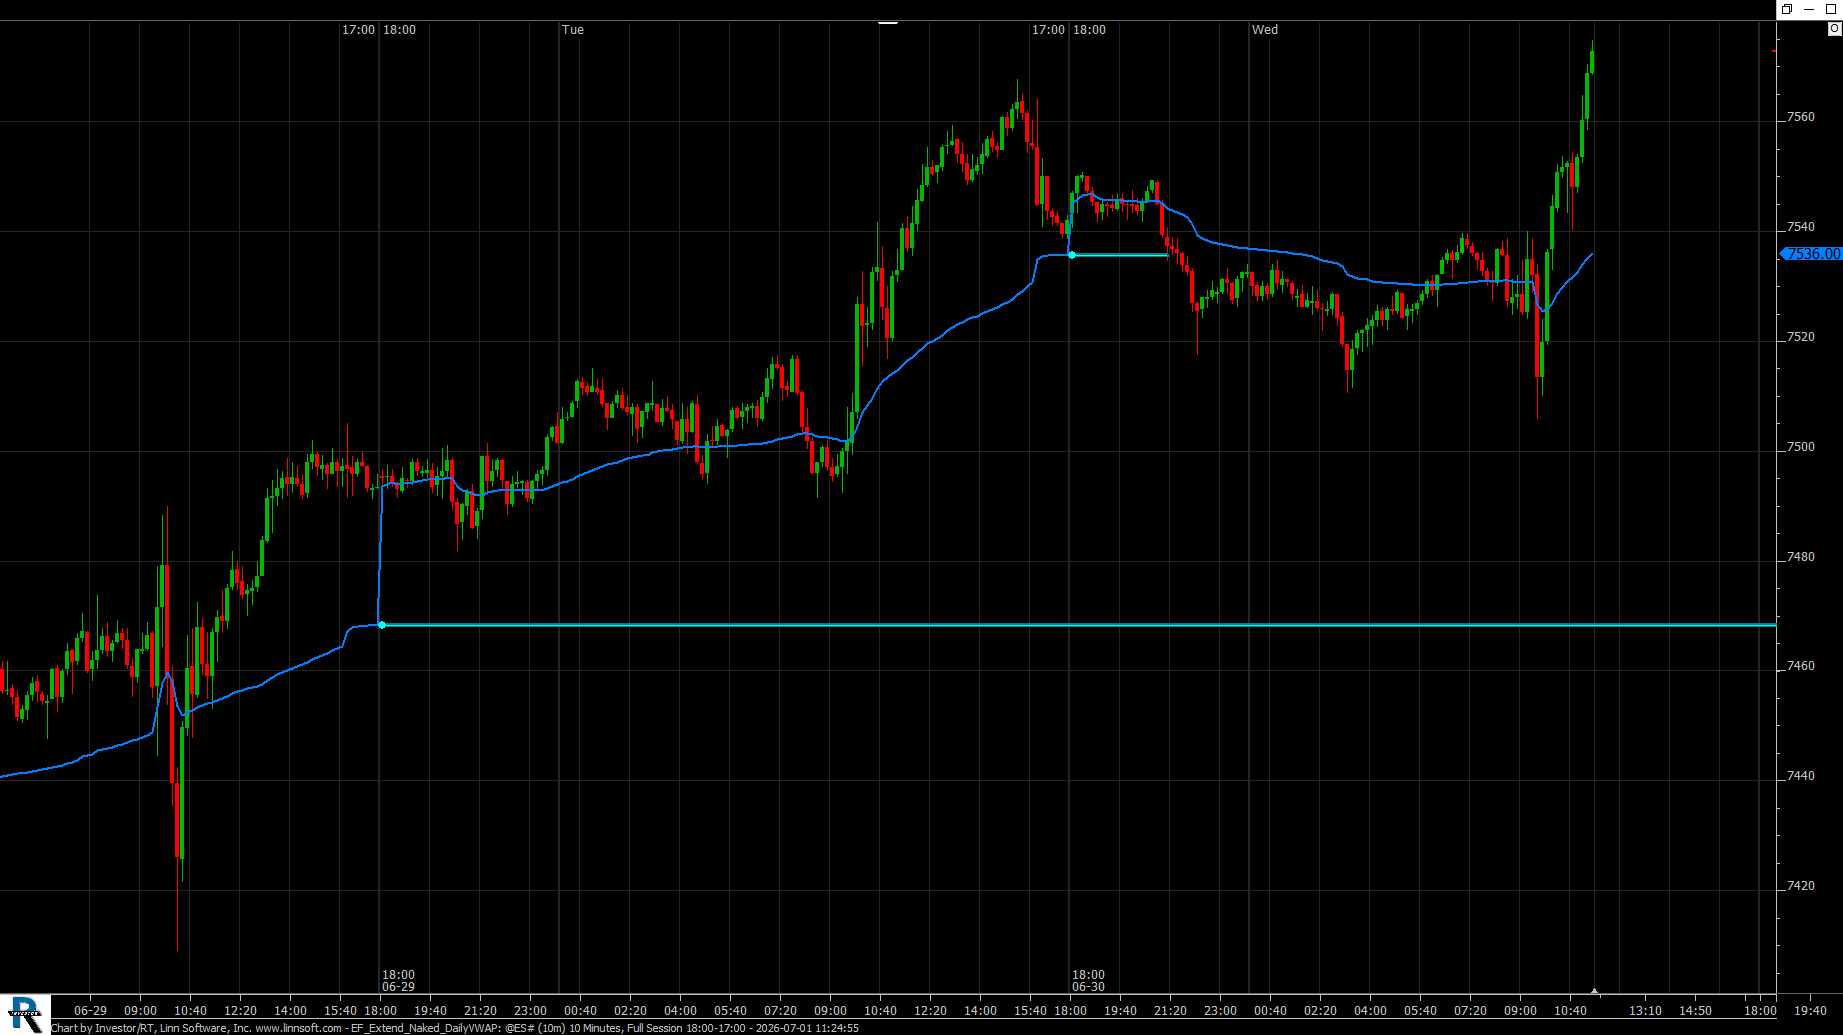 |
EF Extend Naked DailyVWAP (@ES#) Eddy [totalcount]
1 week 5 days ago
Using the Custom Indicator Naked line feature to extend the prior day VWAP on an intraday chart. This chart was uploaded by Investor/RT 16.1.1 showing symbol: @ES#. |
View |
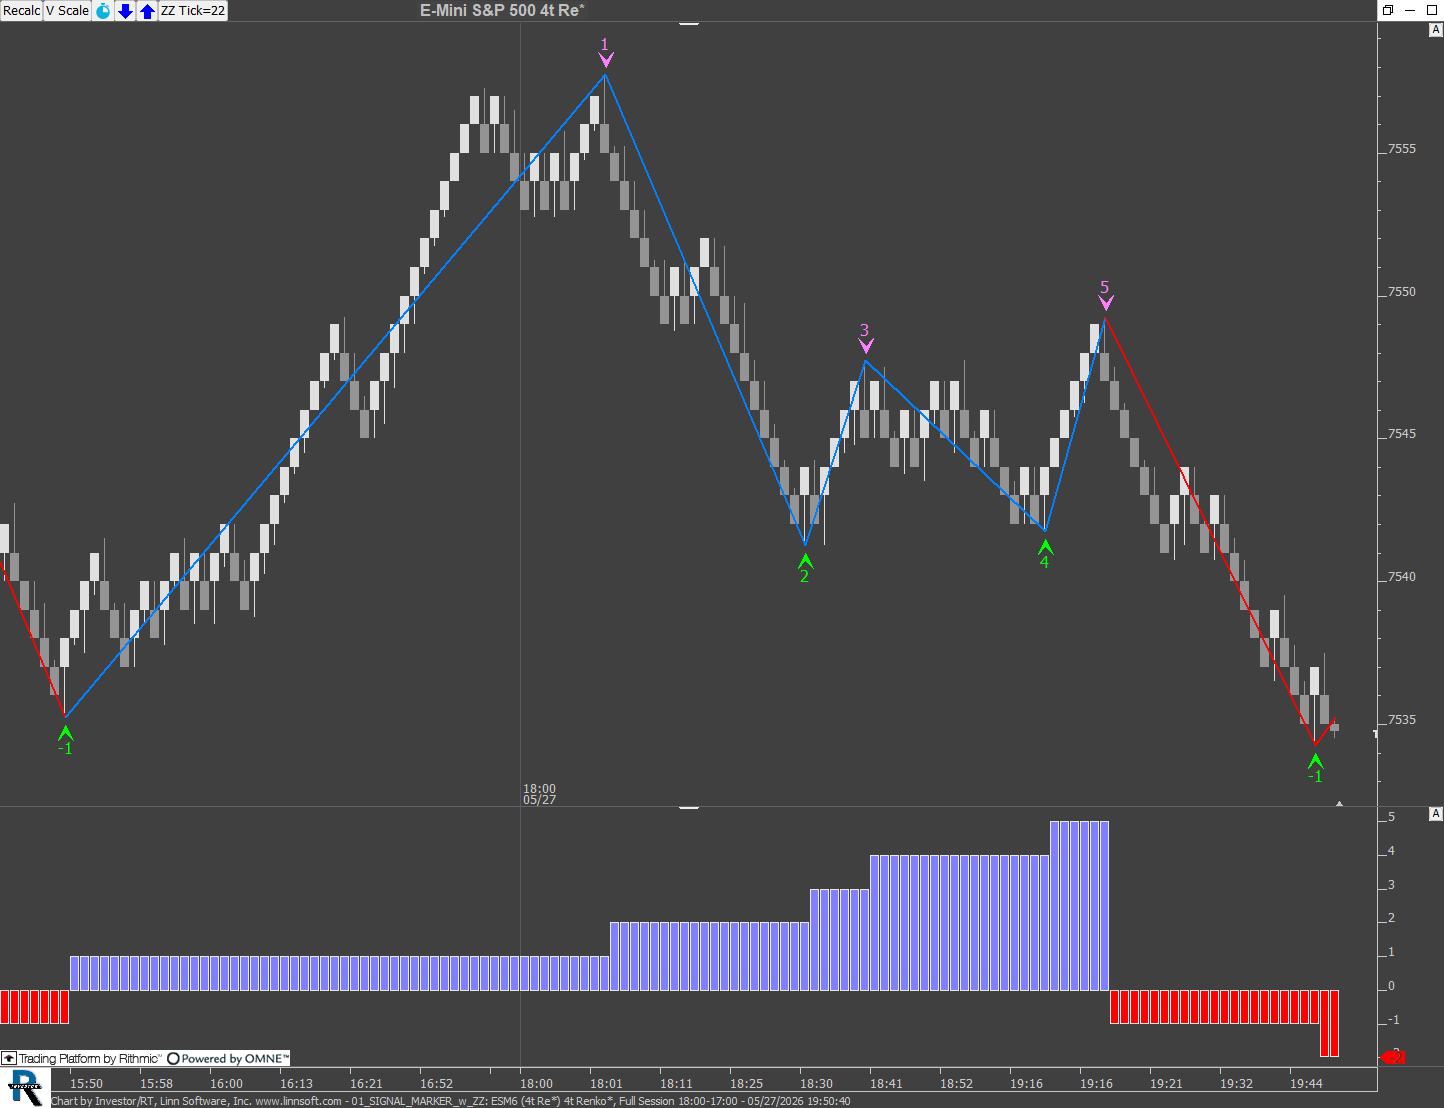 |
01 SIGNAL MARKER w ZZ (ESM6) Eddy [totalcount]
1 month 2 weeks ago
Example of ALL:ALL display/compute settings (required for Signal marker or CI with ZZO tokens). This chart was uploaded by Investor/RT 16.1.1 showing symbol: ESM6. |
View |
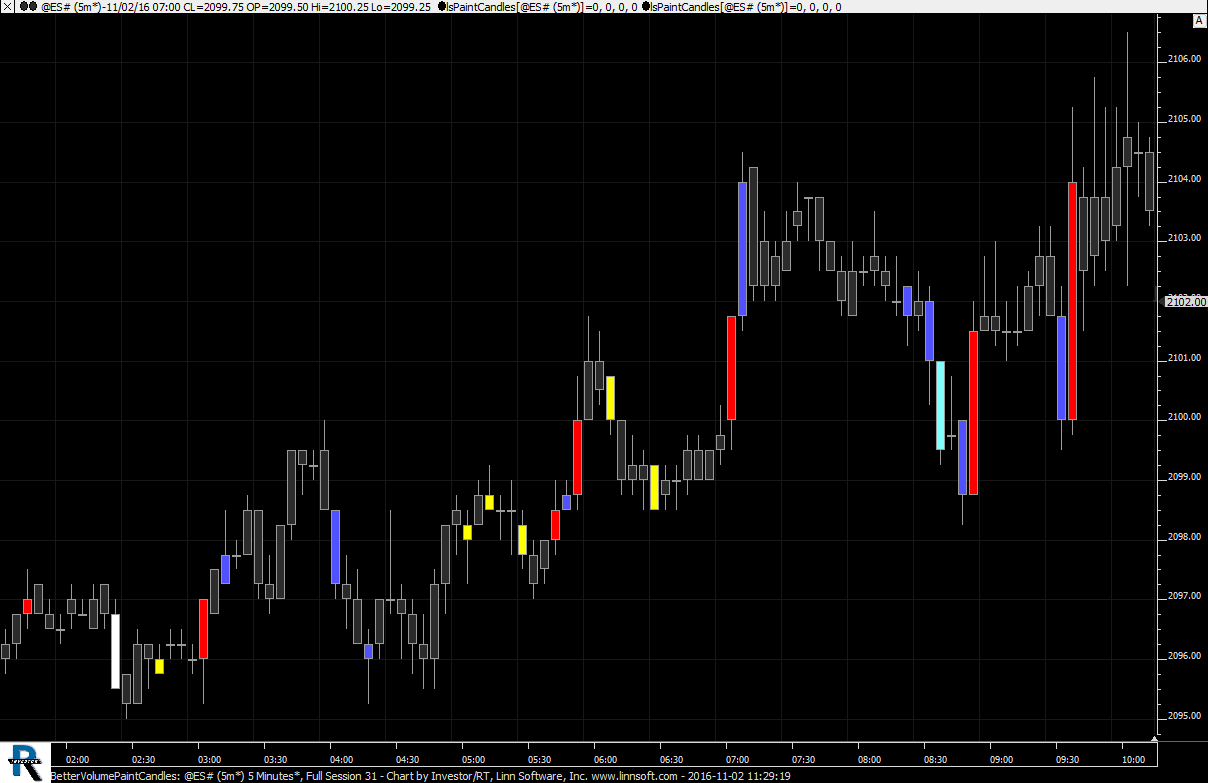 |
BetterVolumePaintCandles (@ES#) cpayne [totalcount]
9 years 8 months ago
Better Volume with Paint Candles. This chart was uploaded by Investor/RT 12.6.7 showing symbol: @ES#. |
View |
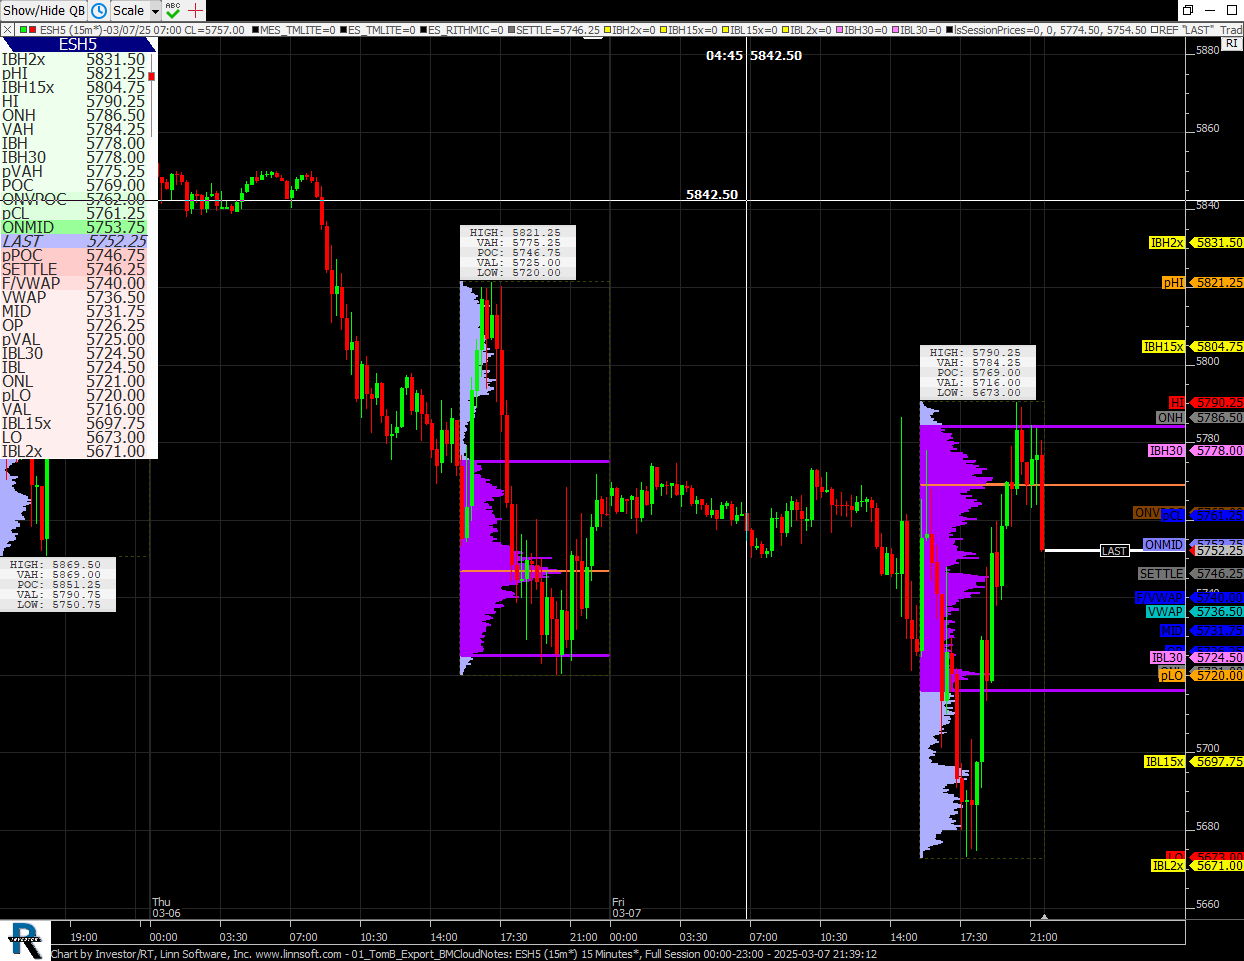 |
01 TomB Export BMCloudNotes (ESH5) Eddy [totalcount]
1 year 4 months ago
Tom B Traders Lab - Export to Bookmap Cloud Notes. This chart was uploaded by Investor/RT 16.1.1 showing symbol: ESH5. |
View |
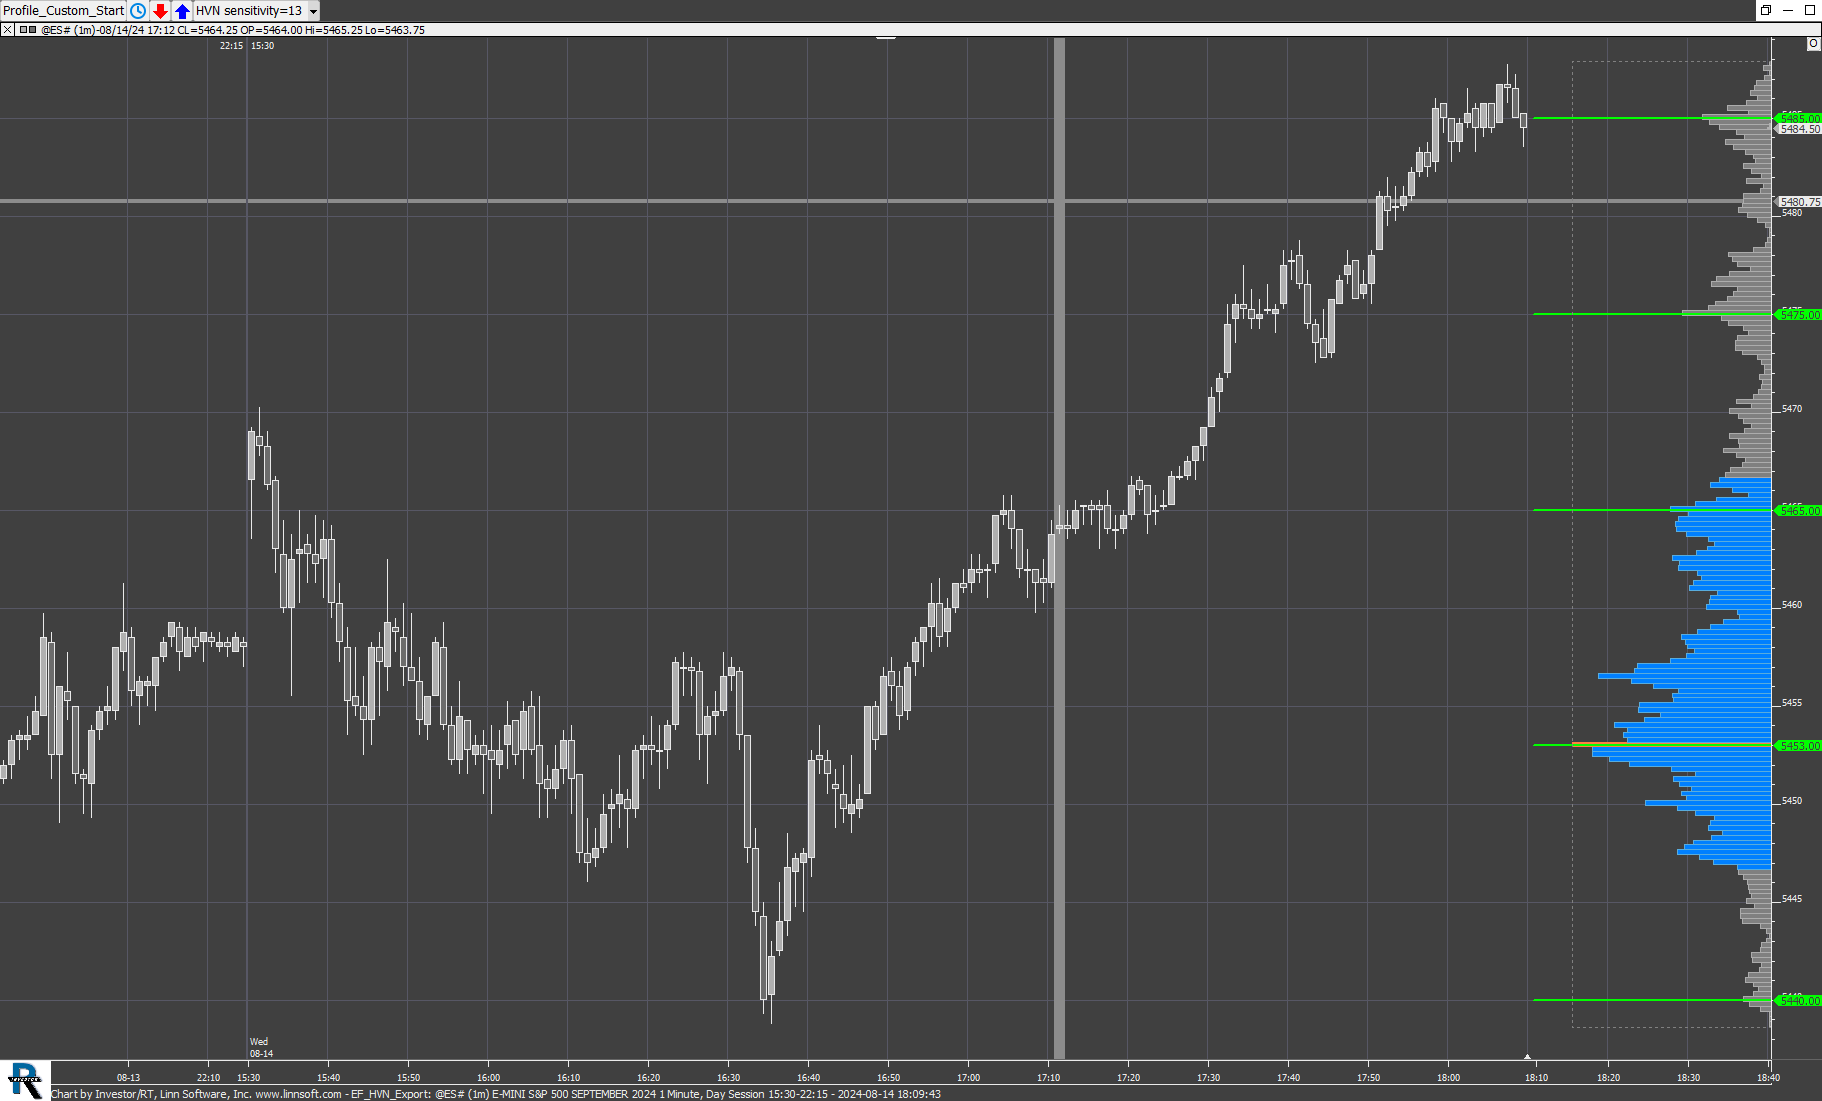 |
EF HVN Export (@ES#) Eddy [totalcount]
1 year 11 months ago
HVN value Export with Sensitivity controlled through a C variable. This chart was uploaded by Investor/RT 15.1.26 showing symbol: @ES#. |
View |
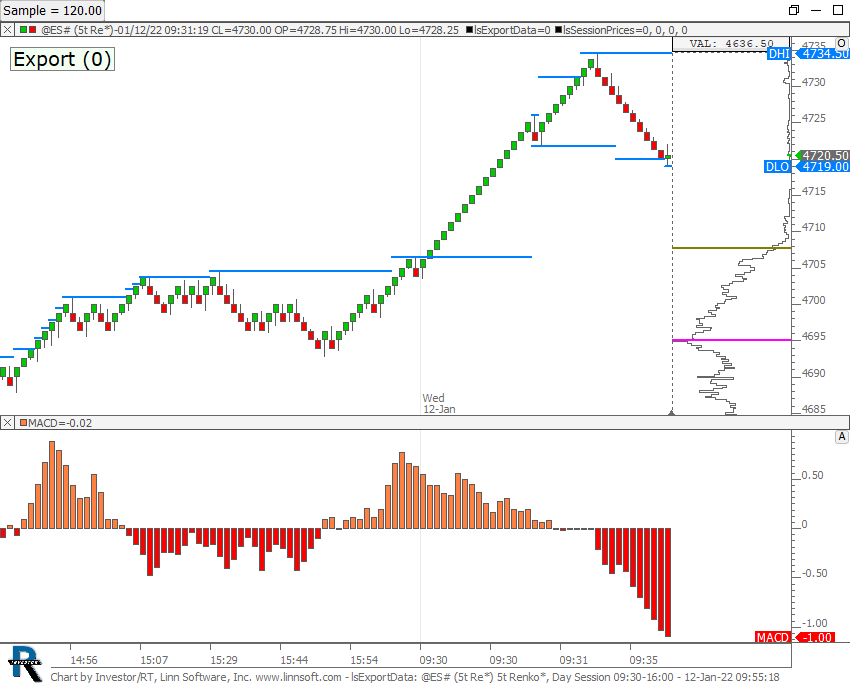 |
lsExportData (@ES#) cpayne [totalcount]
4 years 6 months ago
ExportData (RTX) Sample. This chart was uploaded by Investor/RT 15 showing symbol: @ES#. |
View |
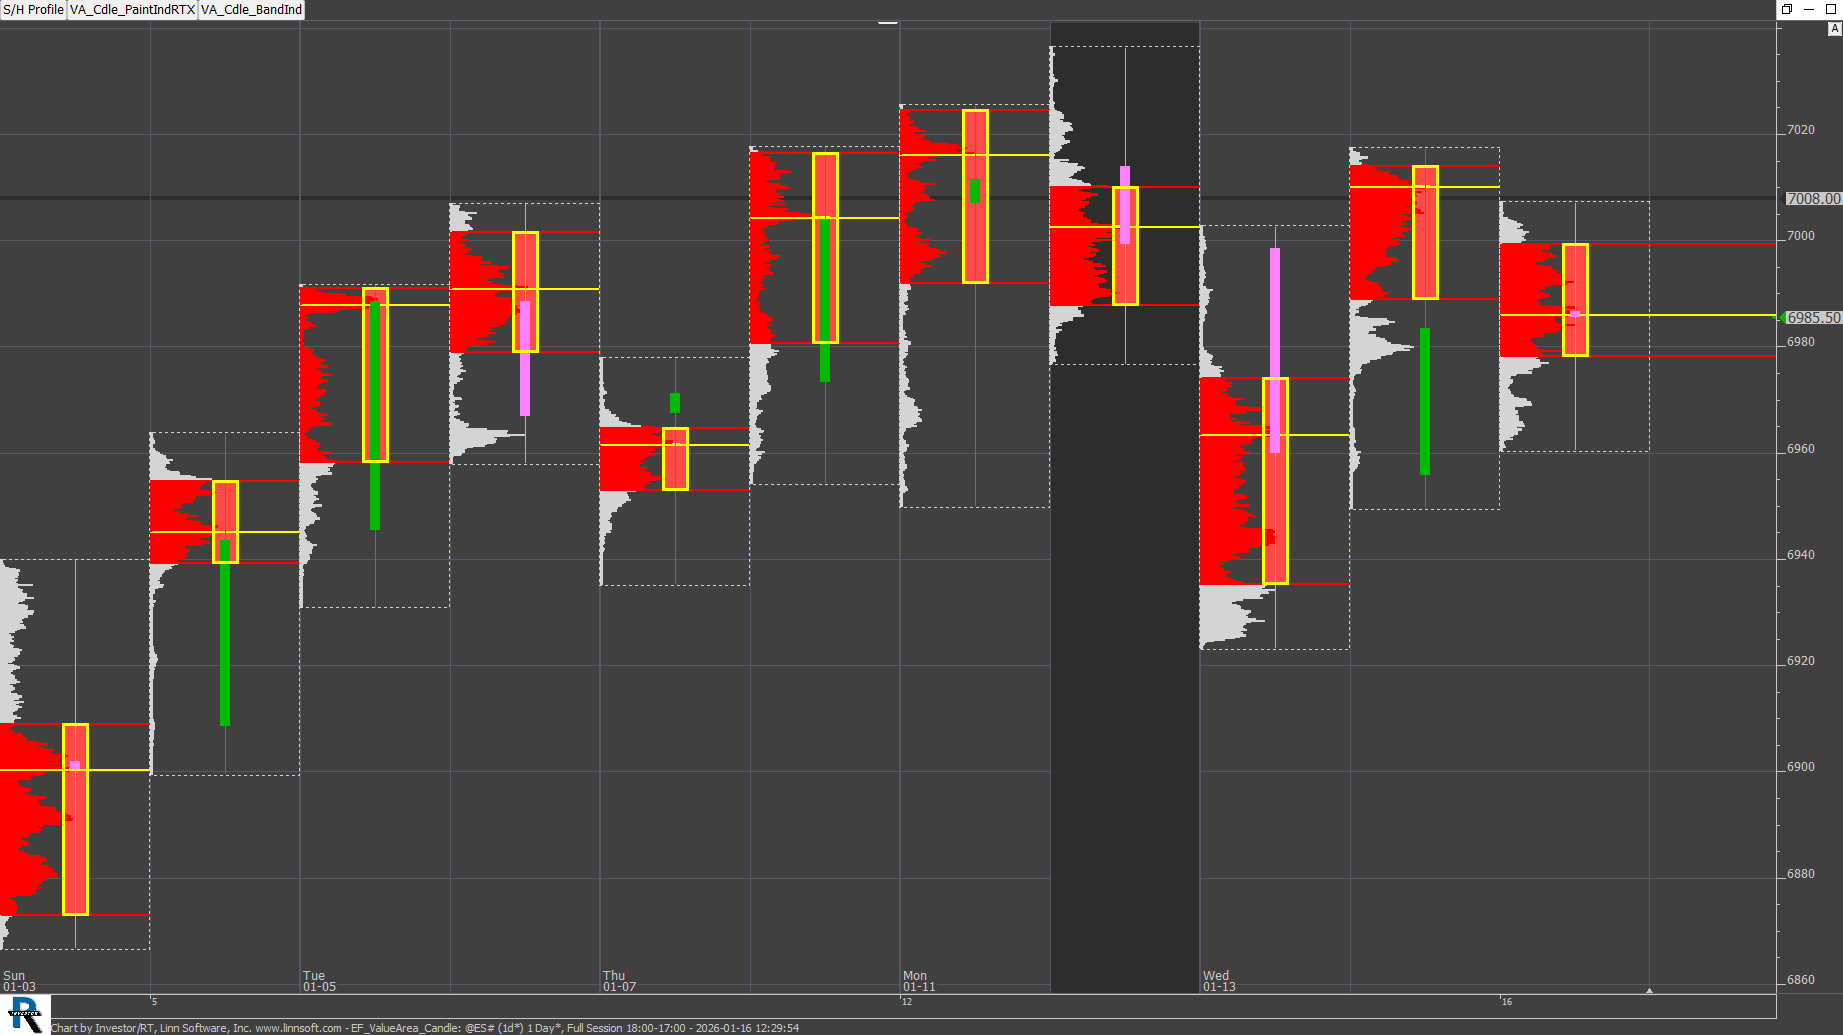 |
EF ValueArea Candle (@ES#) Eddy [totalcount]
5 months 4 weeks ago
Creating A "Value Area" Candle with the Paint Indicator RTX. This chart was uploaded by Investor/RT 16.1.1 showing symbol: @ES#. |
View |
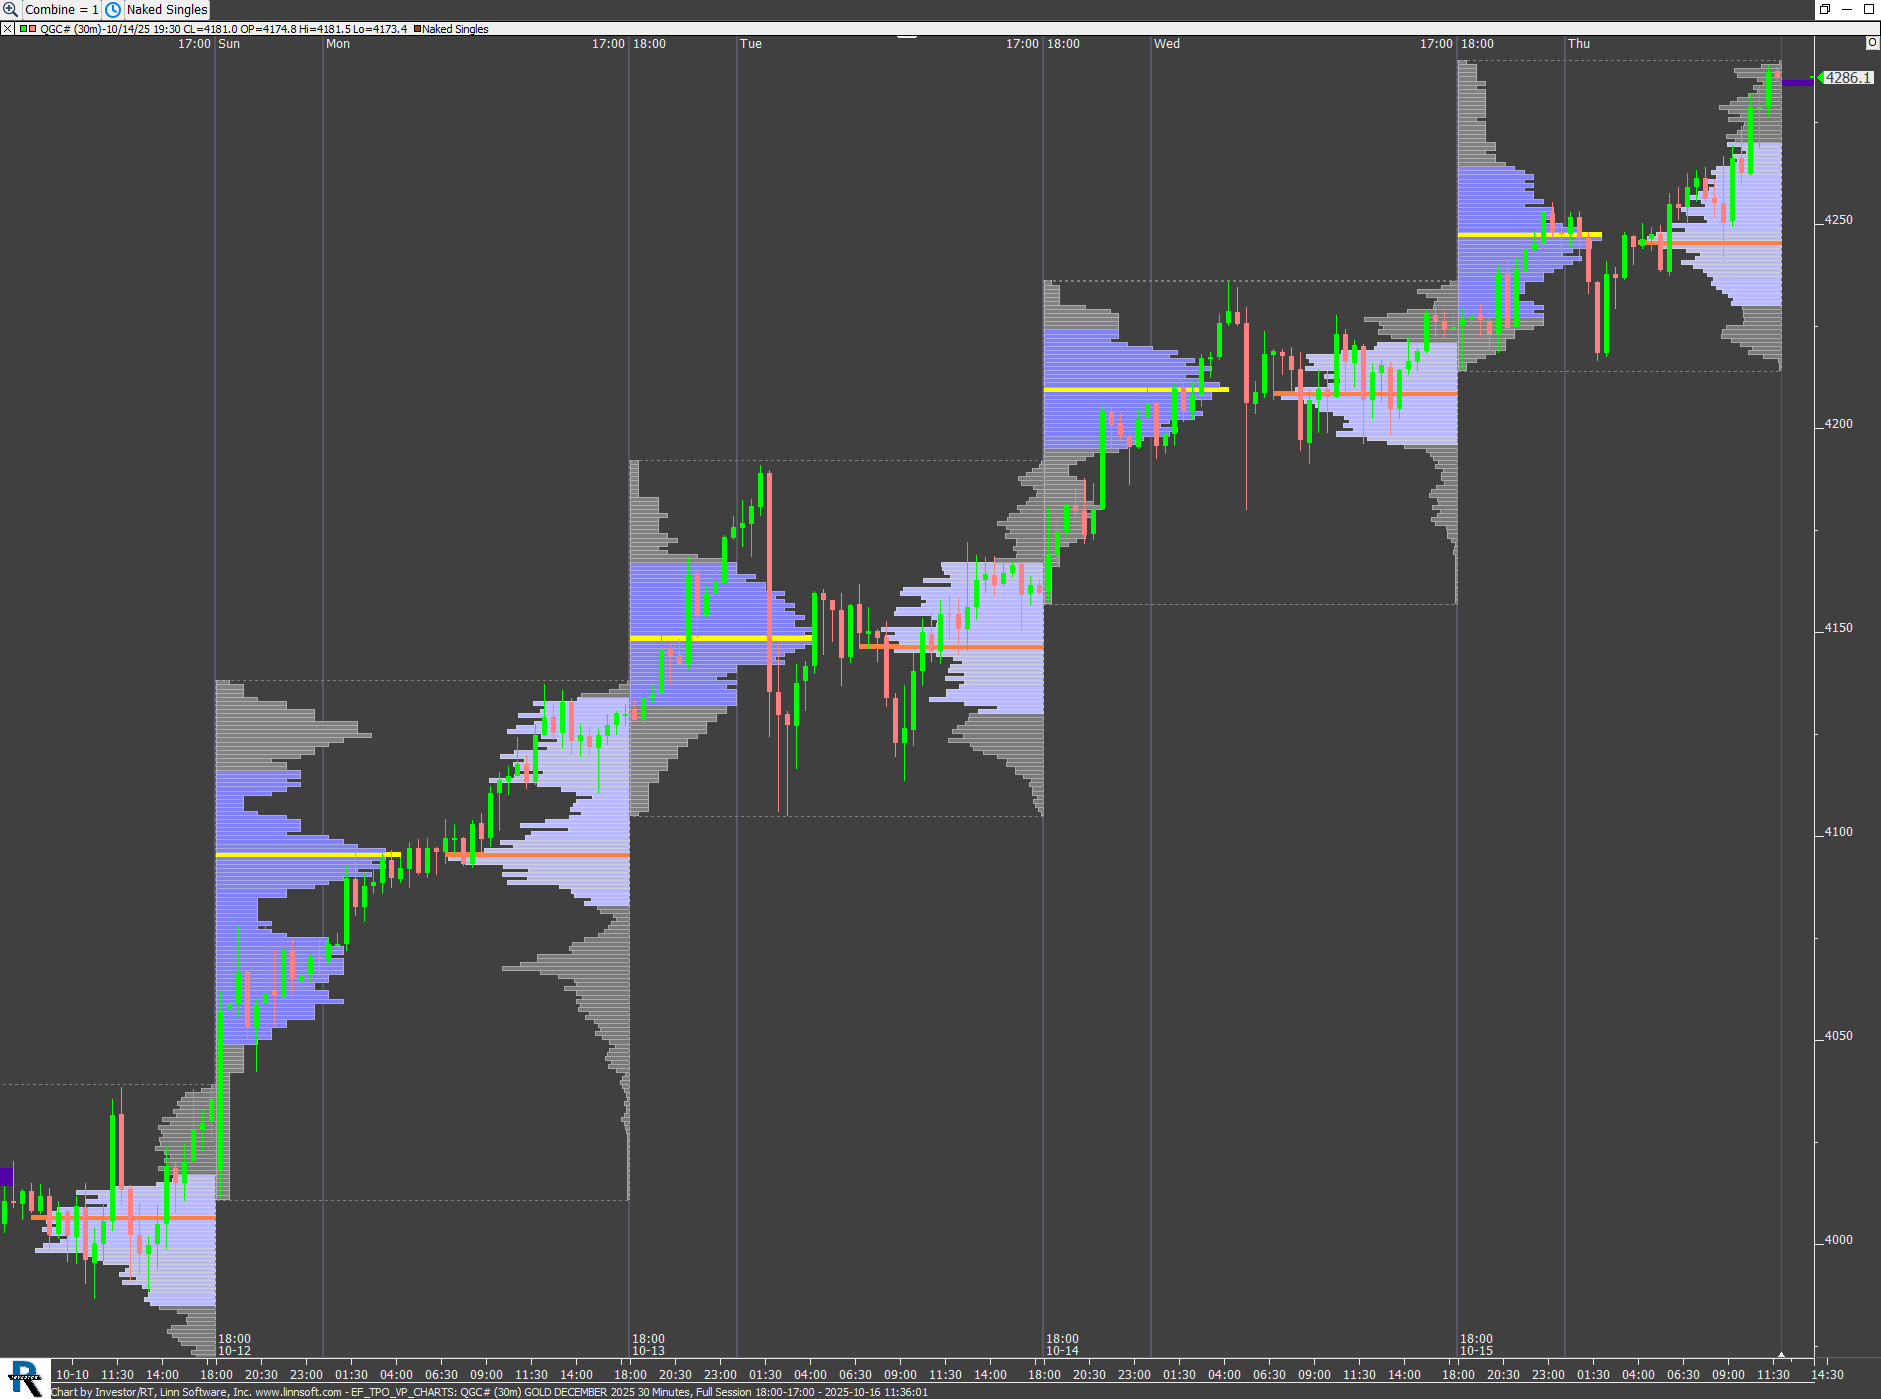 |
EF TPO VP CHARTS (QGC#) Eddy [totalcount]
9 months 7 hours ago
TPO and Volume Profile on the same 30 minute charts - A Combine (set C#1) button controls the price per row input and another button adds naked singles. |
View |
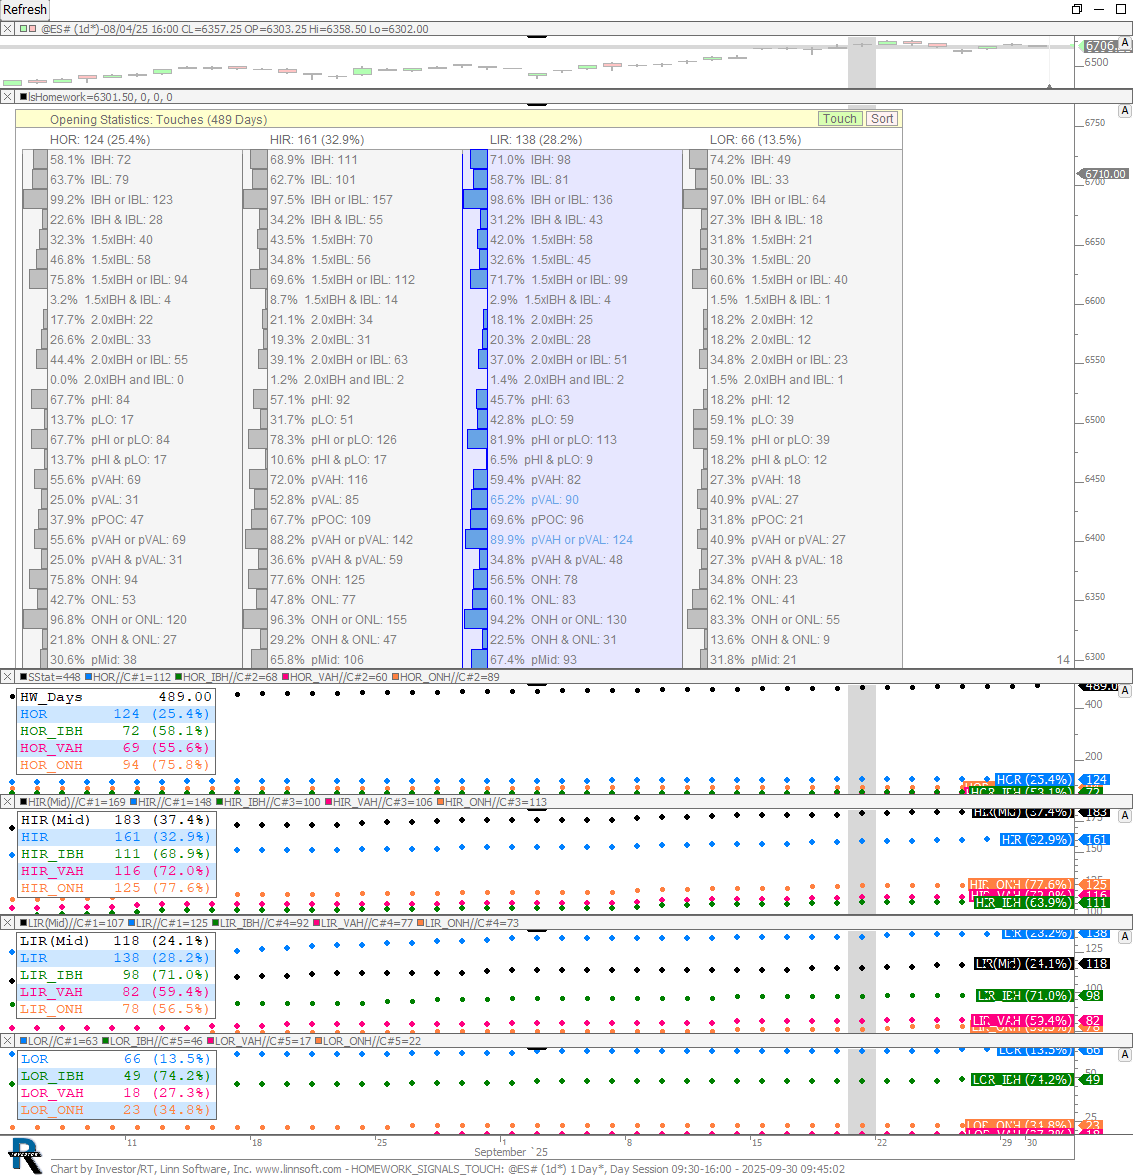 |
HOMEWORK SIGNALS TOUCH (@ES#) Eddy [totalcount]
9 months 2 weeks ago
Example of the Signal Statistics indicators used to generate some of the Homework statistics: HOR/HIR/LIR/LOR breakdown and the subsequent IBH / VAH and ONH statistics (in the "TOUCH"... |
View |
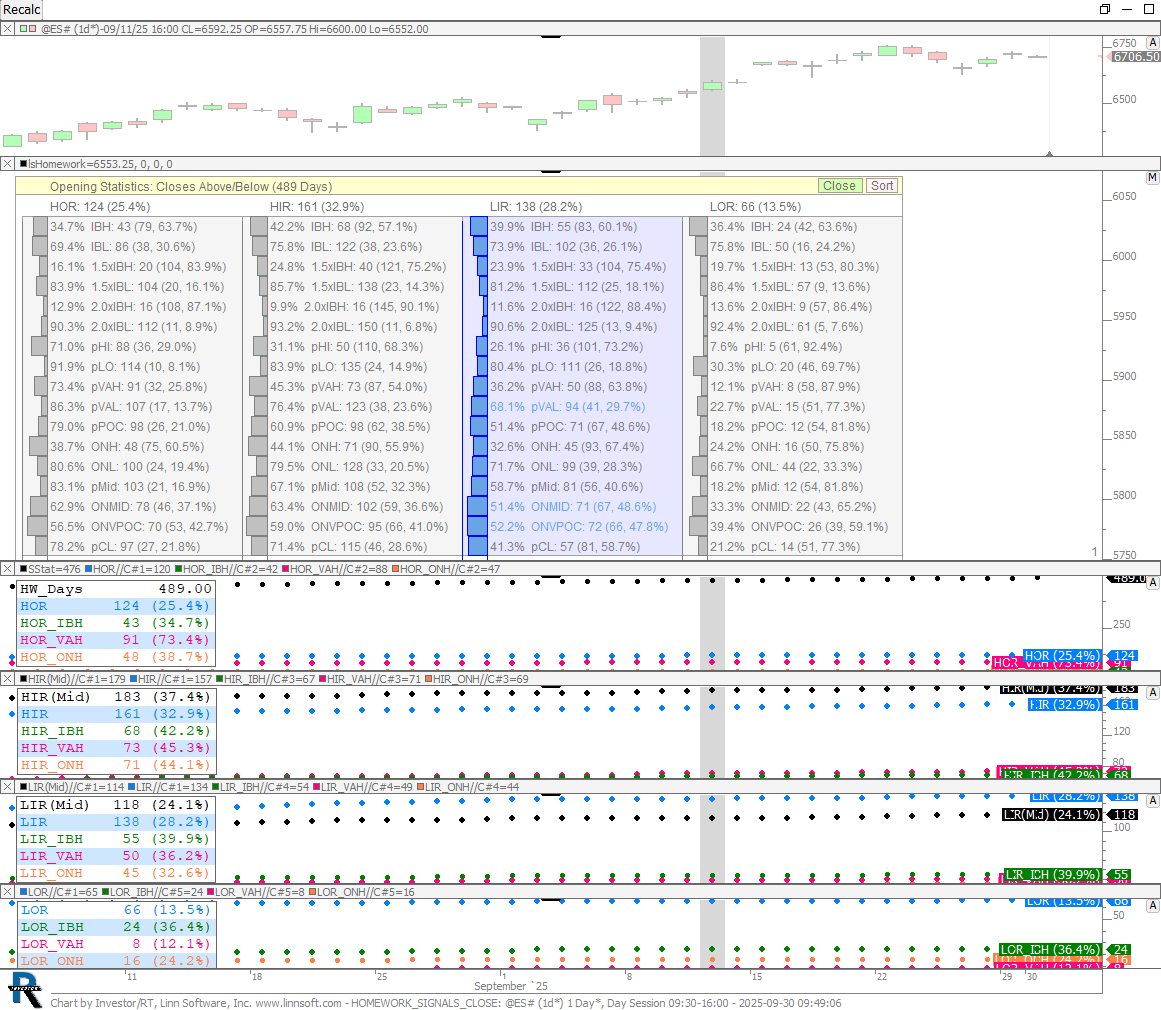 |
HOMEWORK SIGNALS CLOSE (@ES#) Eddy [totalcount]
9 months 2 weeks ago
Example of the Signals Statistics indicators used to generate some of the Homework statistics: HOR/HIR/LIR and LOR breakdown and the subsequent IBH / VAH and ONH statistics (in the "CLOSE"... |
View |
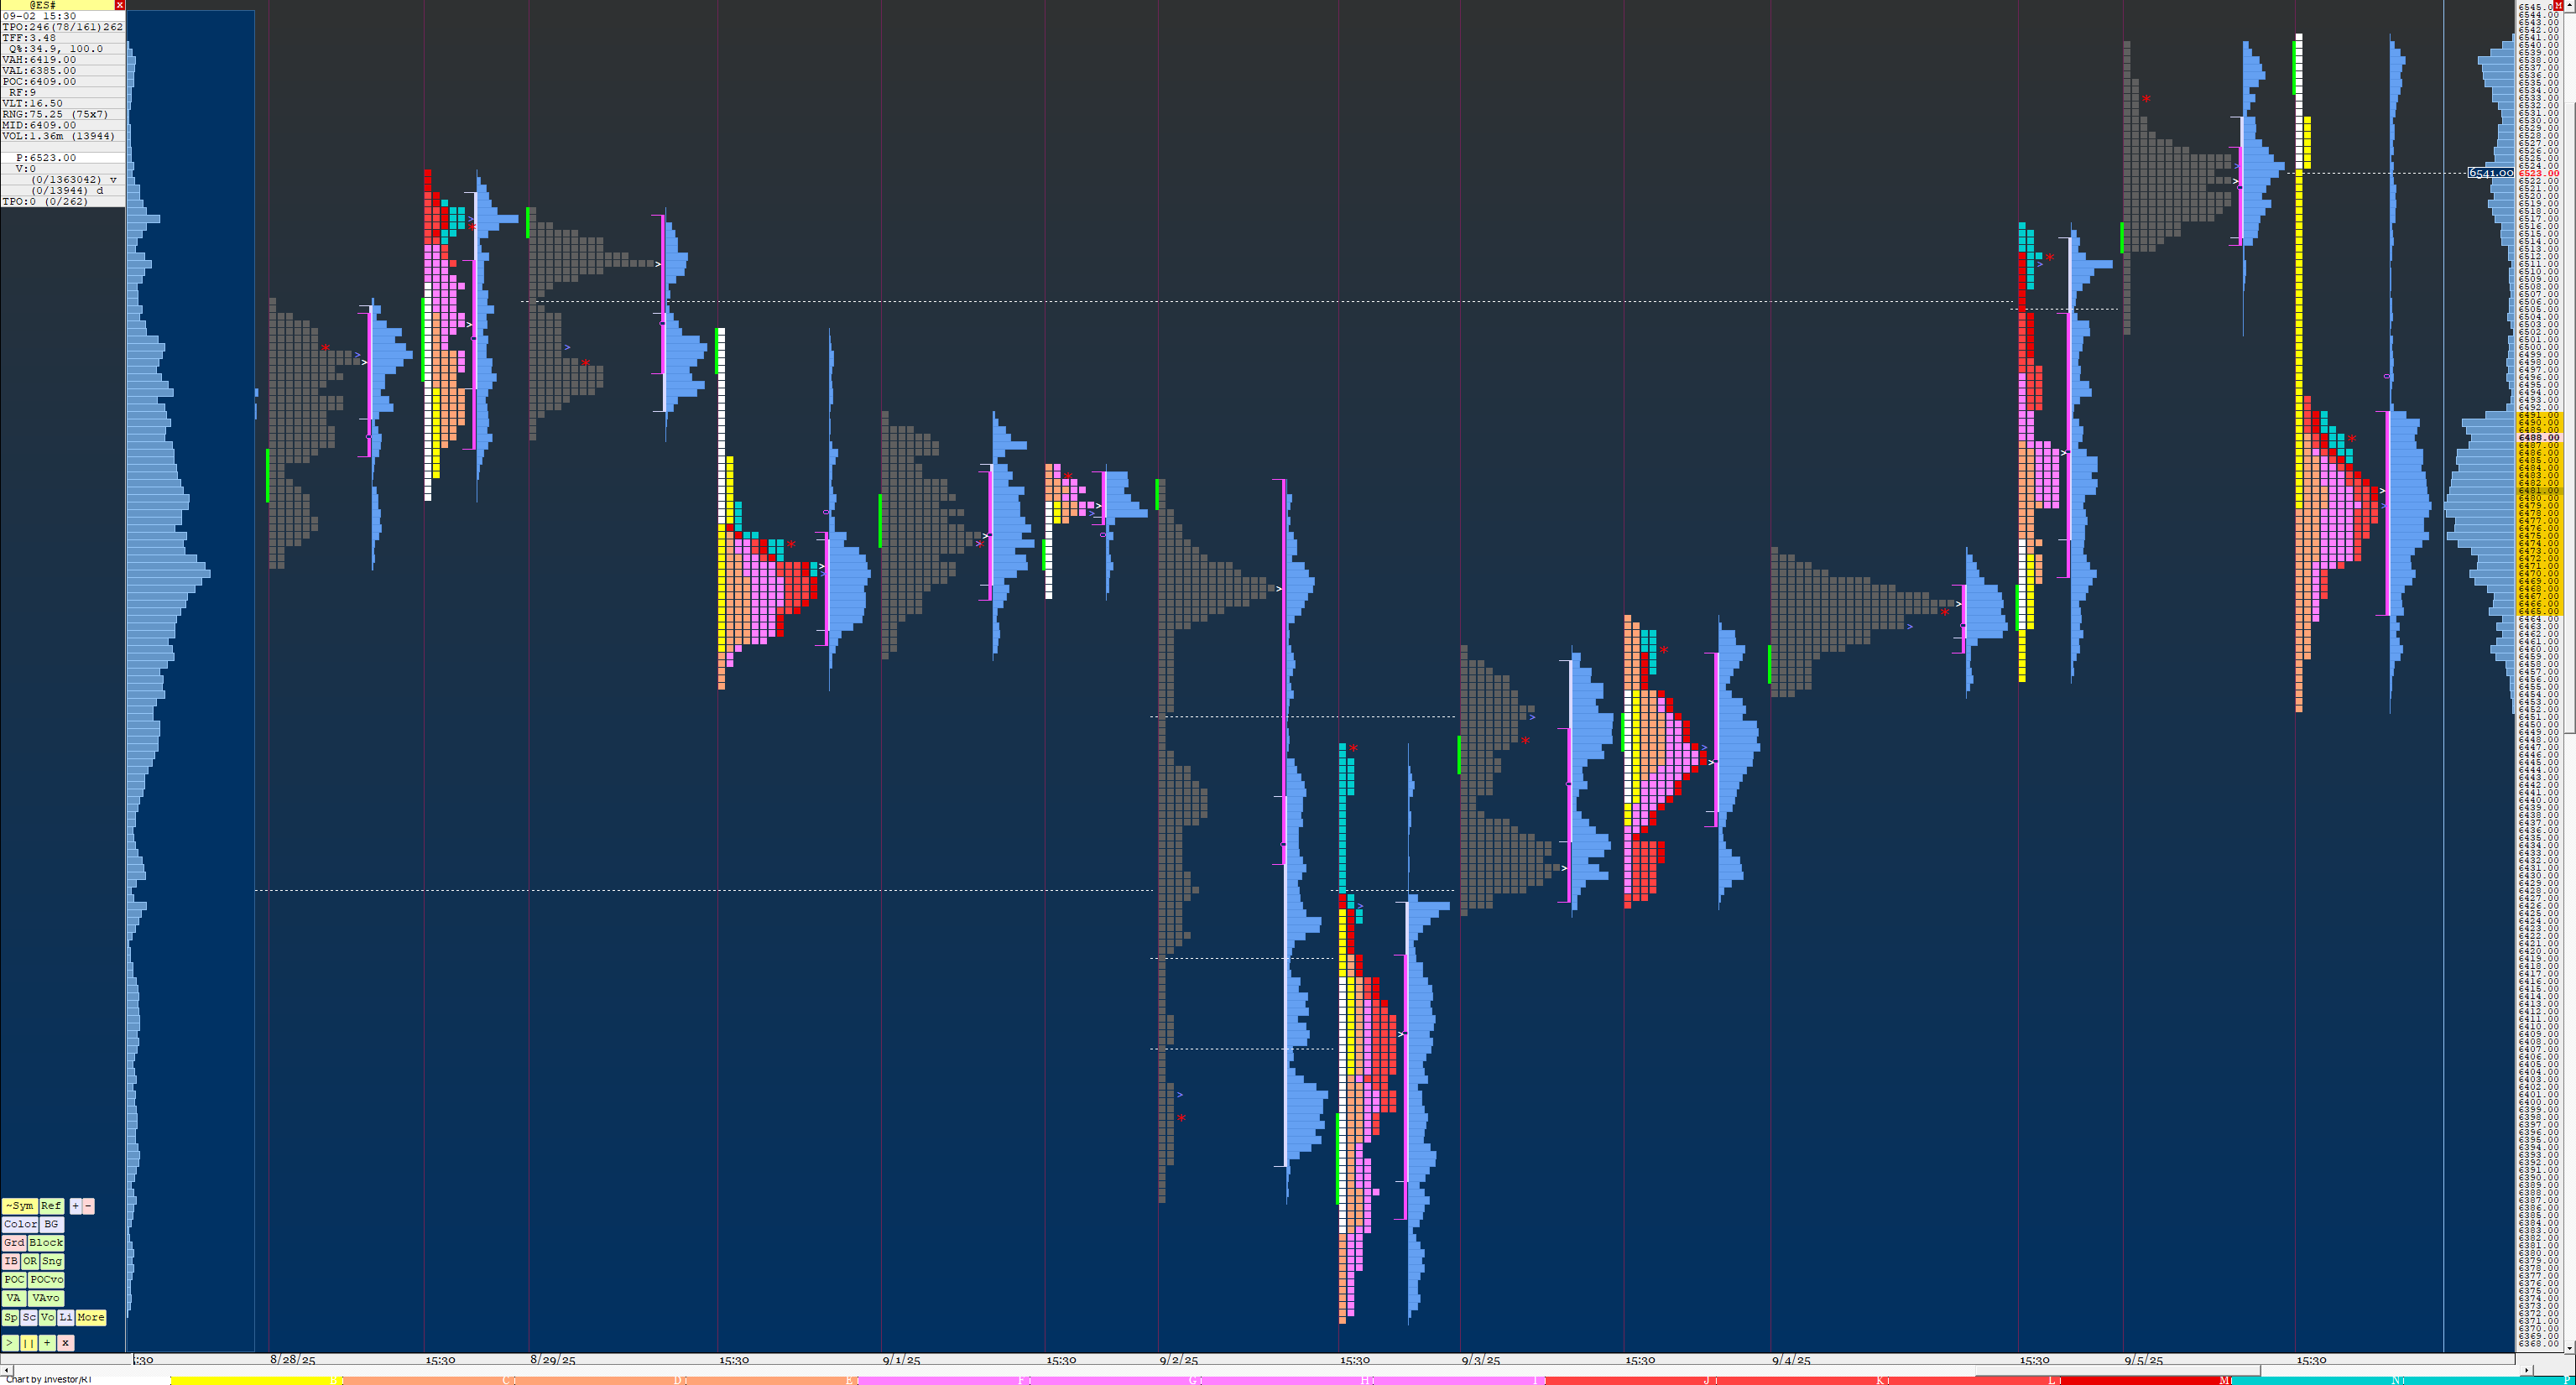 |
TPO SplitSession Block V (@ES#) Eddy [totalcount]
10 months 1 week ago
TPO Split Session profile with darker blocks for the Overnight Session and custom colors for the day session. |
View |
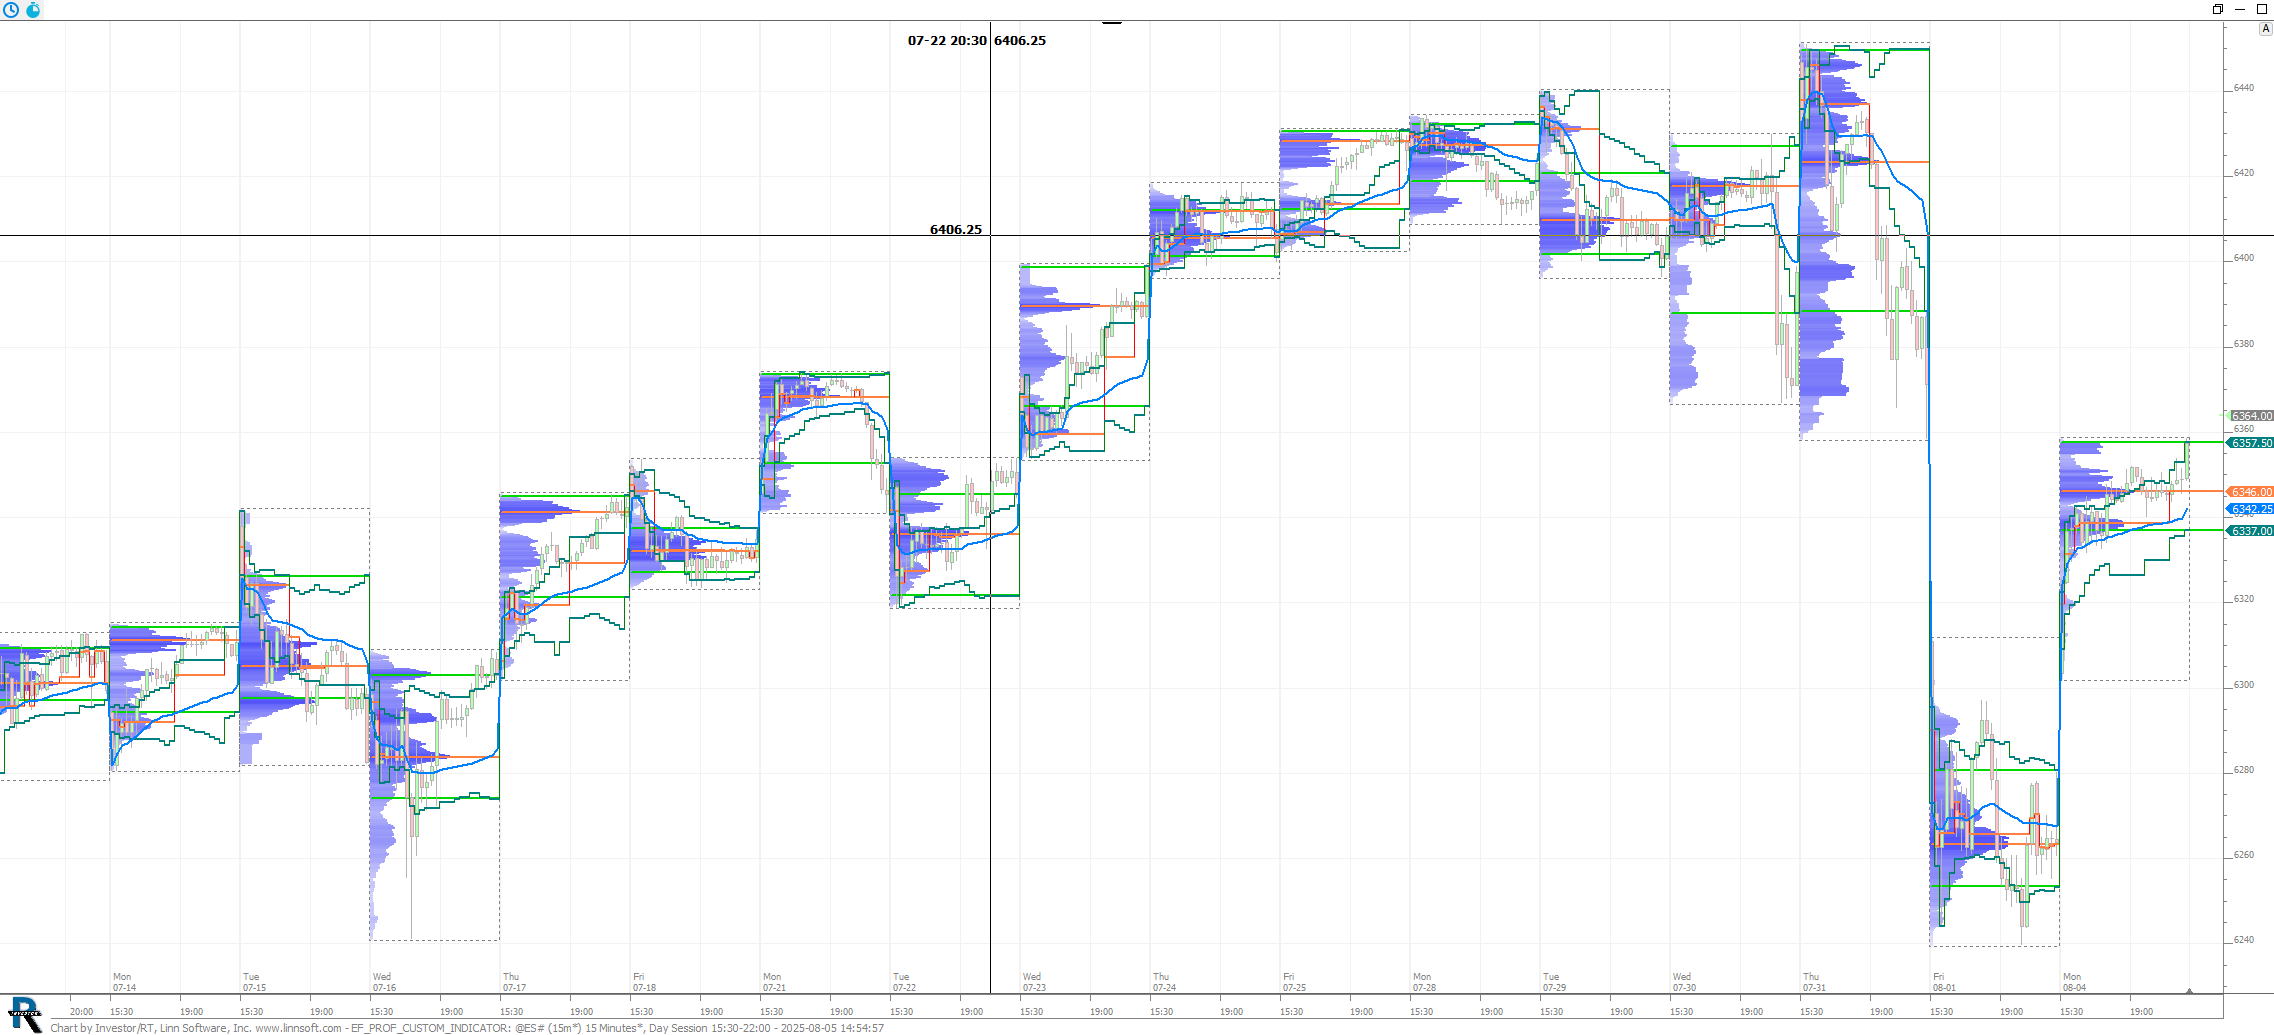 |
EF PROF CUSTOM INDICATOR (@ES#) Eddy [totalcount]
11 months 1 week ago
Custom indciators using the PROF token for displaying the developing VPOC, VAL and VAH. This chart was uploaded by Investor/RT 15.2.10 showing symbol: @ES#. |
View |
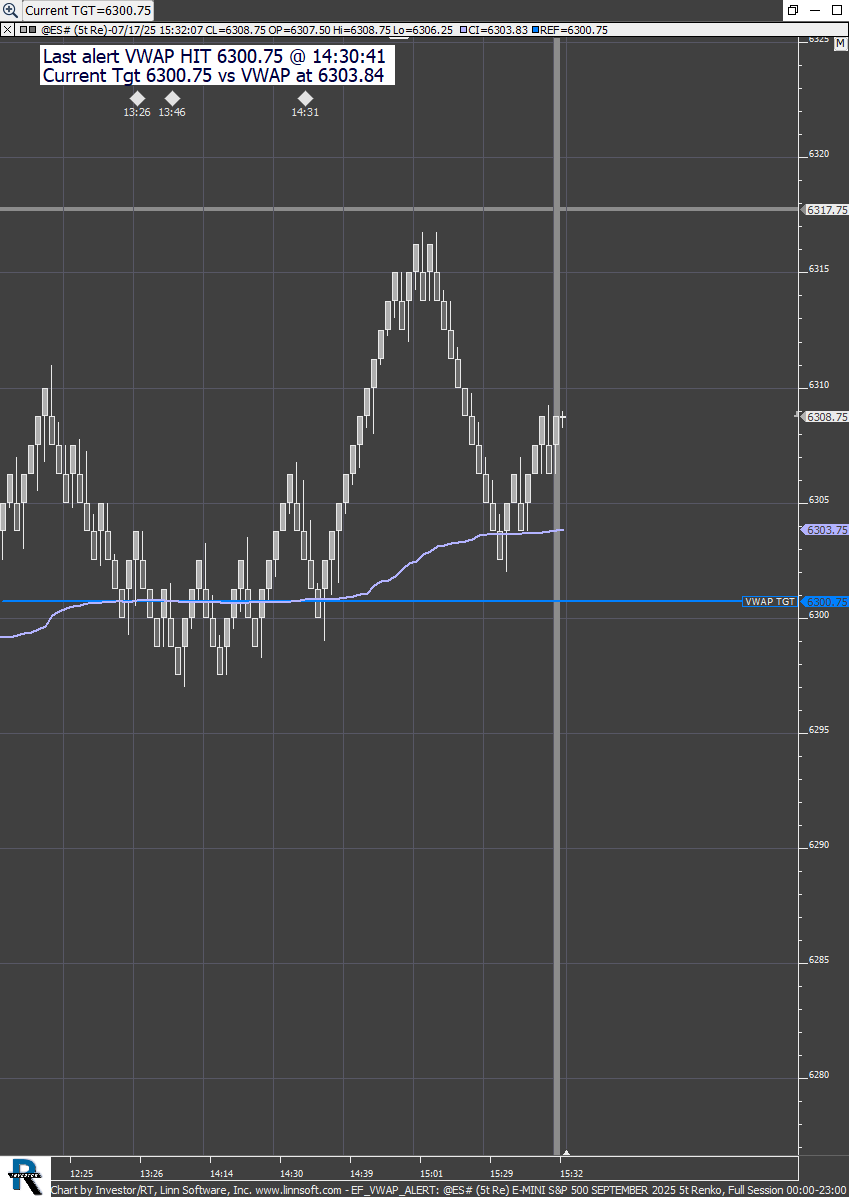 |
EF VWAP ALERT (@ES#) Eddy [totalcount]
12 months 1 day ago
Using a Signal marker to create an alert when ever the daily VWAP value is crossing a level introduced through a Reference line attached to the V50 variable - A message alert is stored in the T2... |
View |
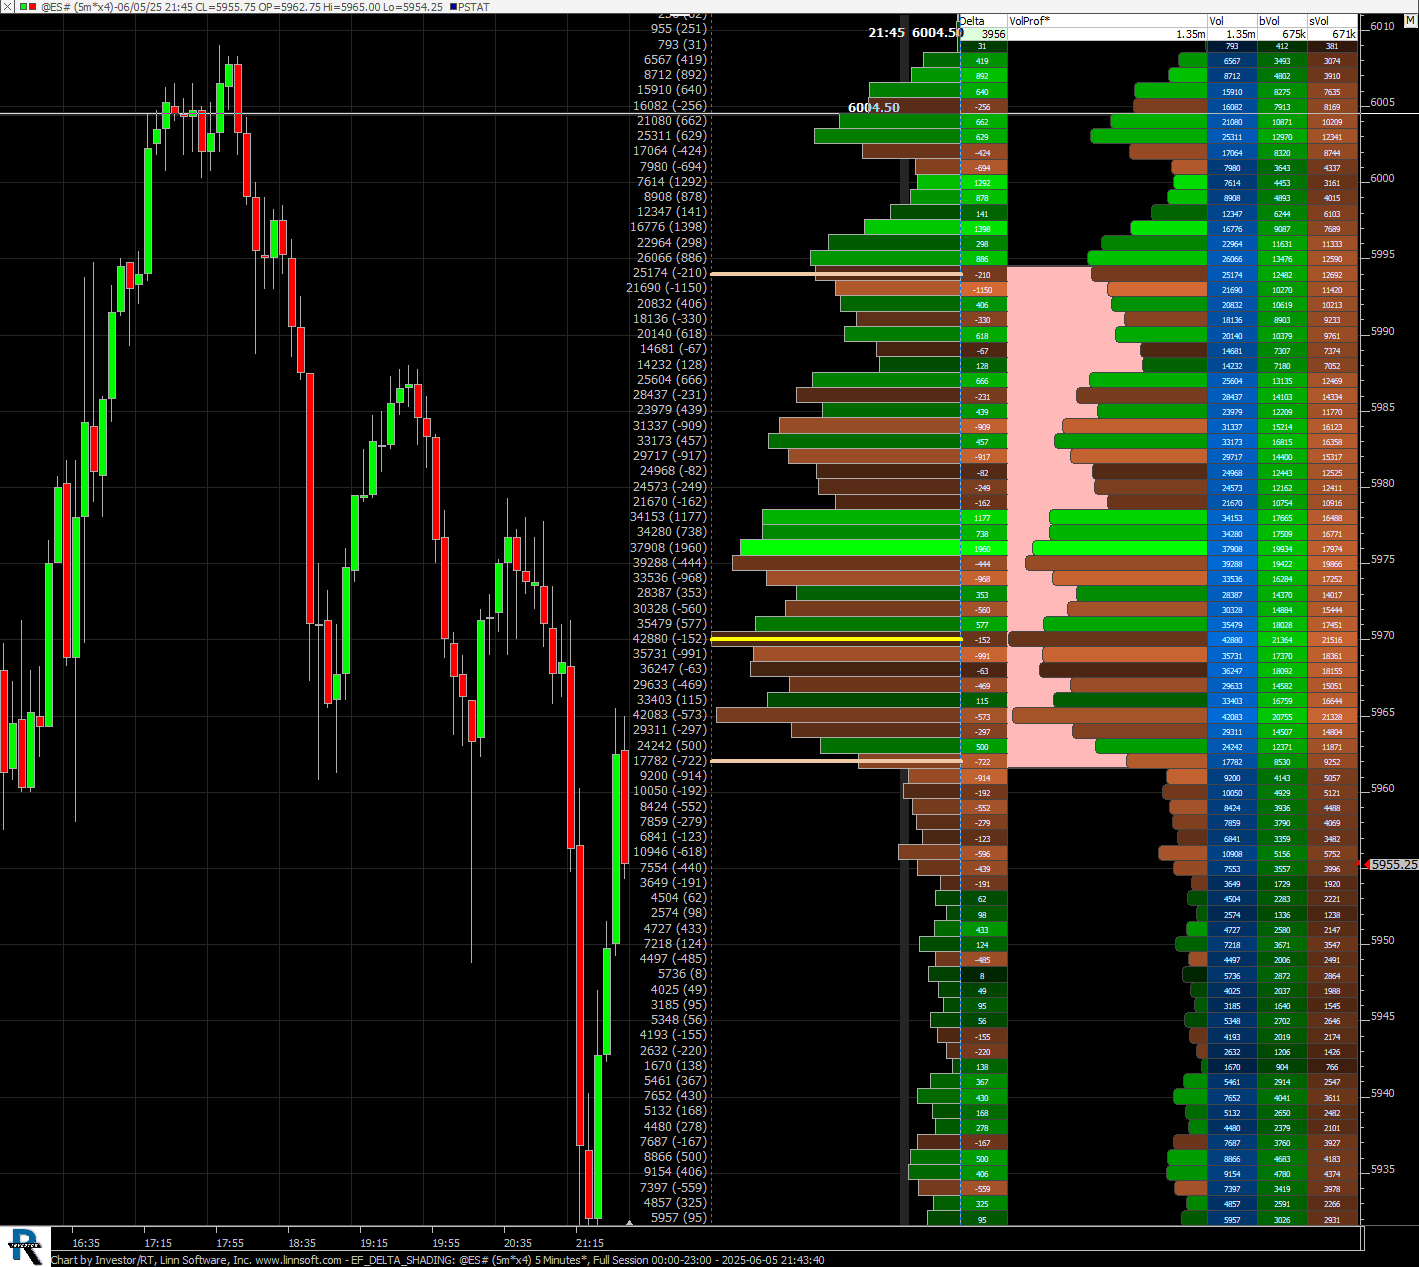 |
EF DELTA SHADING (@ES#) Eddy [totalcount]
1 year 1 month ago
Delta shading option for Profile (with price statistics). This chart was uploaded by Investor/RT 15.2.4 showing symbol: @ES#. |
View |
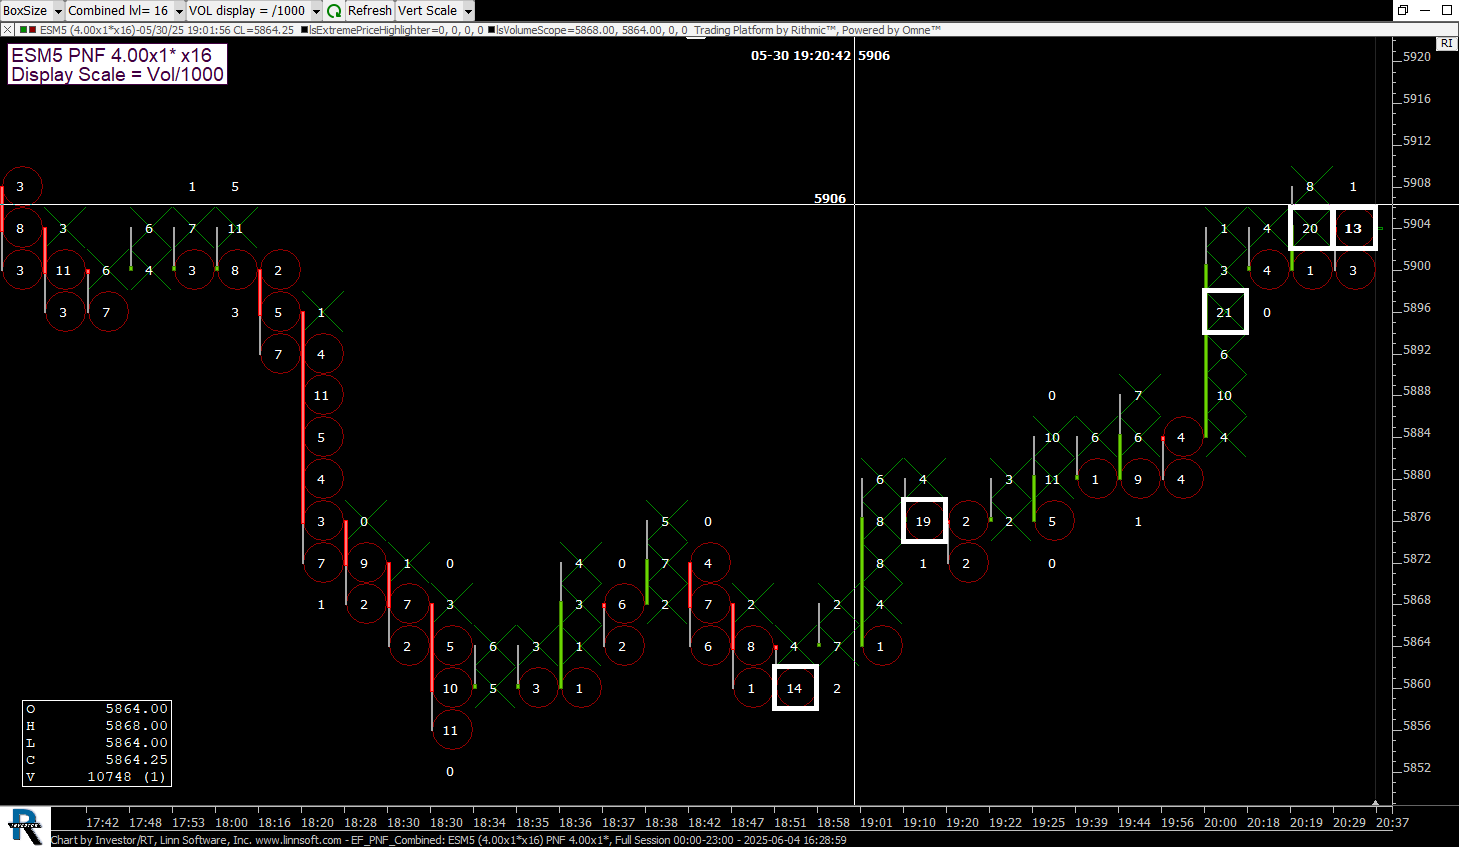 |
EF PNF Combined (ESM5) Eddy [totalcount]
1 year 1 month ago
Using the footprint indicator together with the Combining Every X price levels feature. This chart was uploaded by Investor/RT 15.2.4 showing symbol: ESM5. |
View |
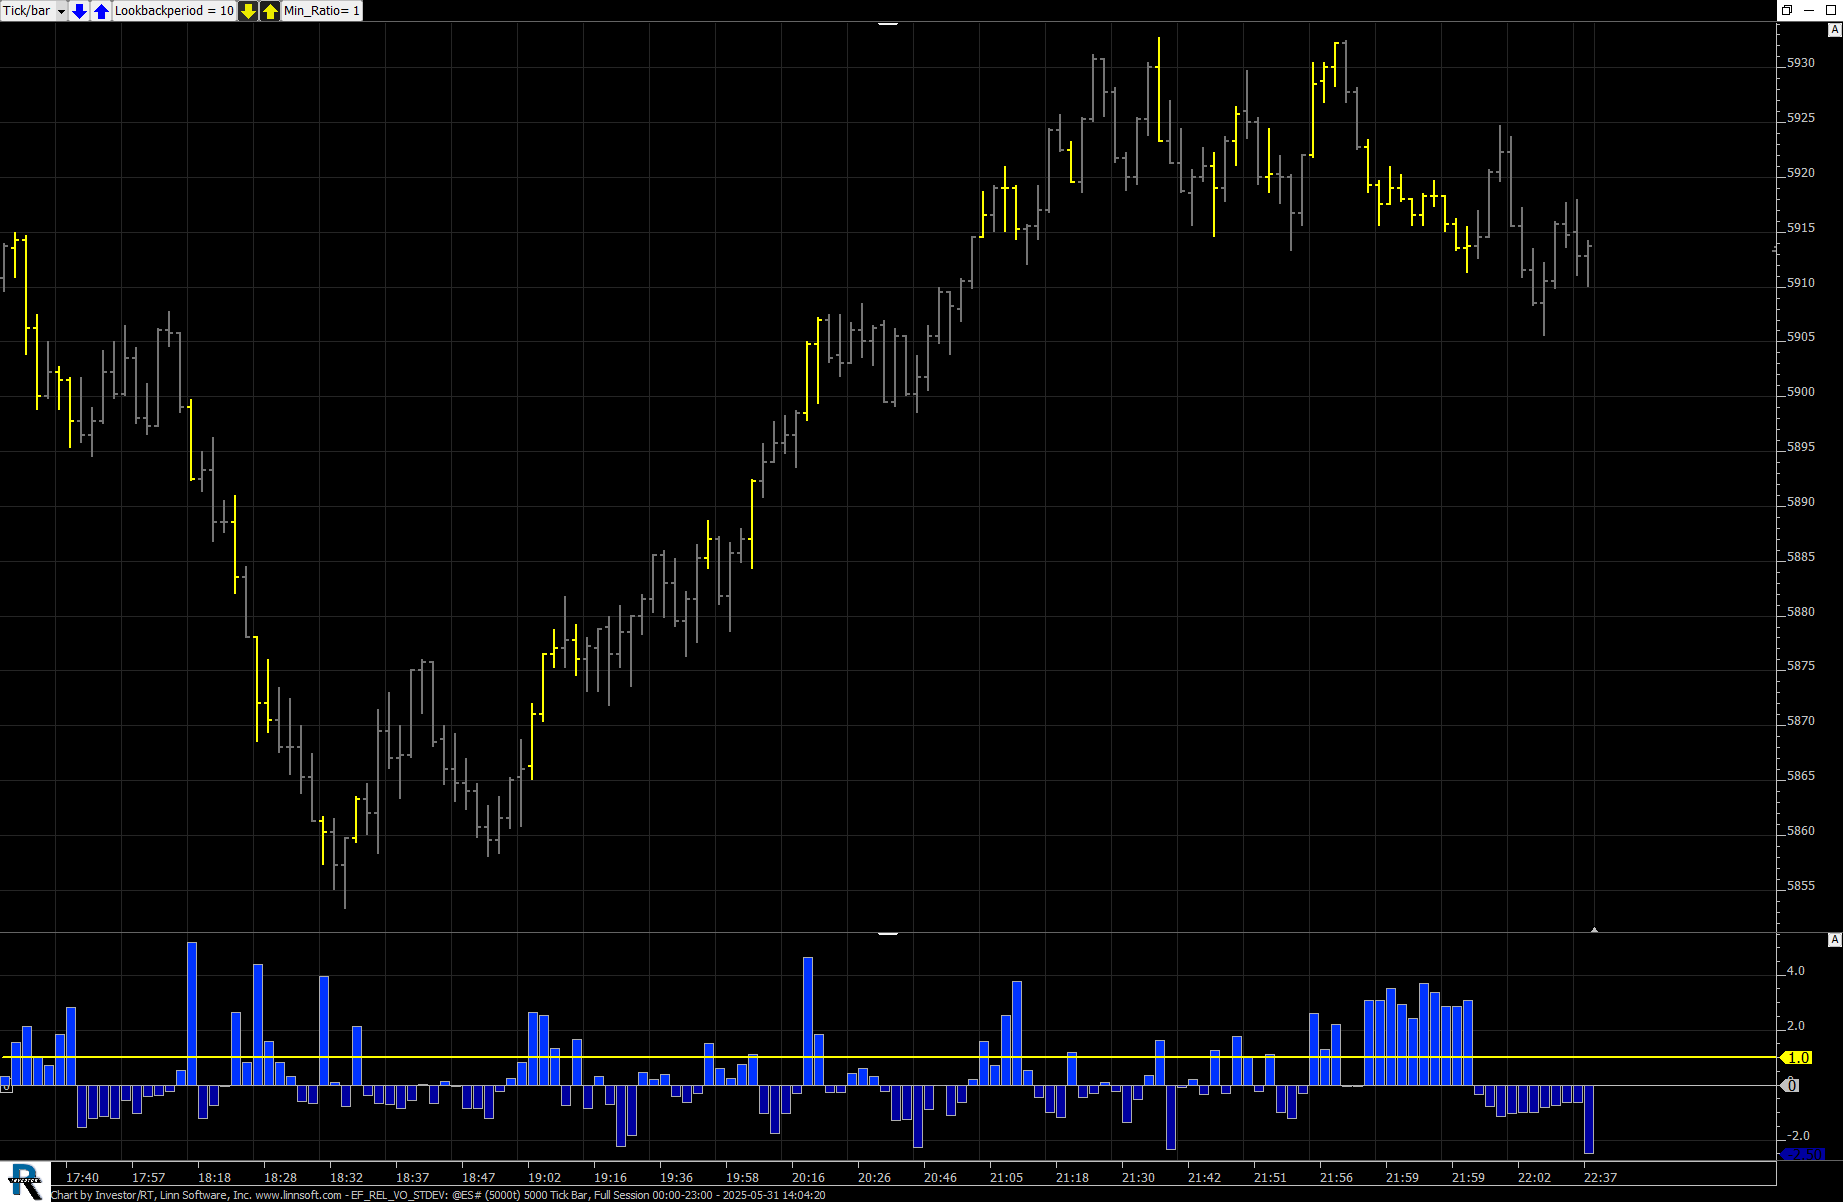 |
EF REL VO STDEV (@ES#) Eddy [totalcount]
1 year 1 month ago
Painting bar based on the Relative Volume standard deviation : C1 button do control the lookback period while C2 is the minimum ratio for painting bar. |
View |
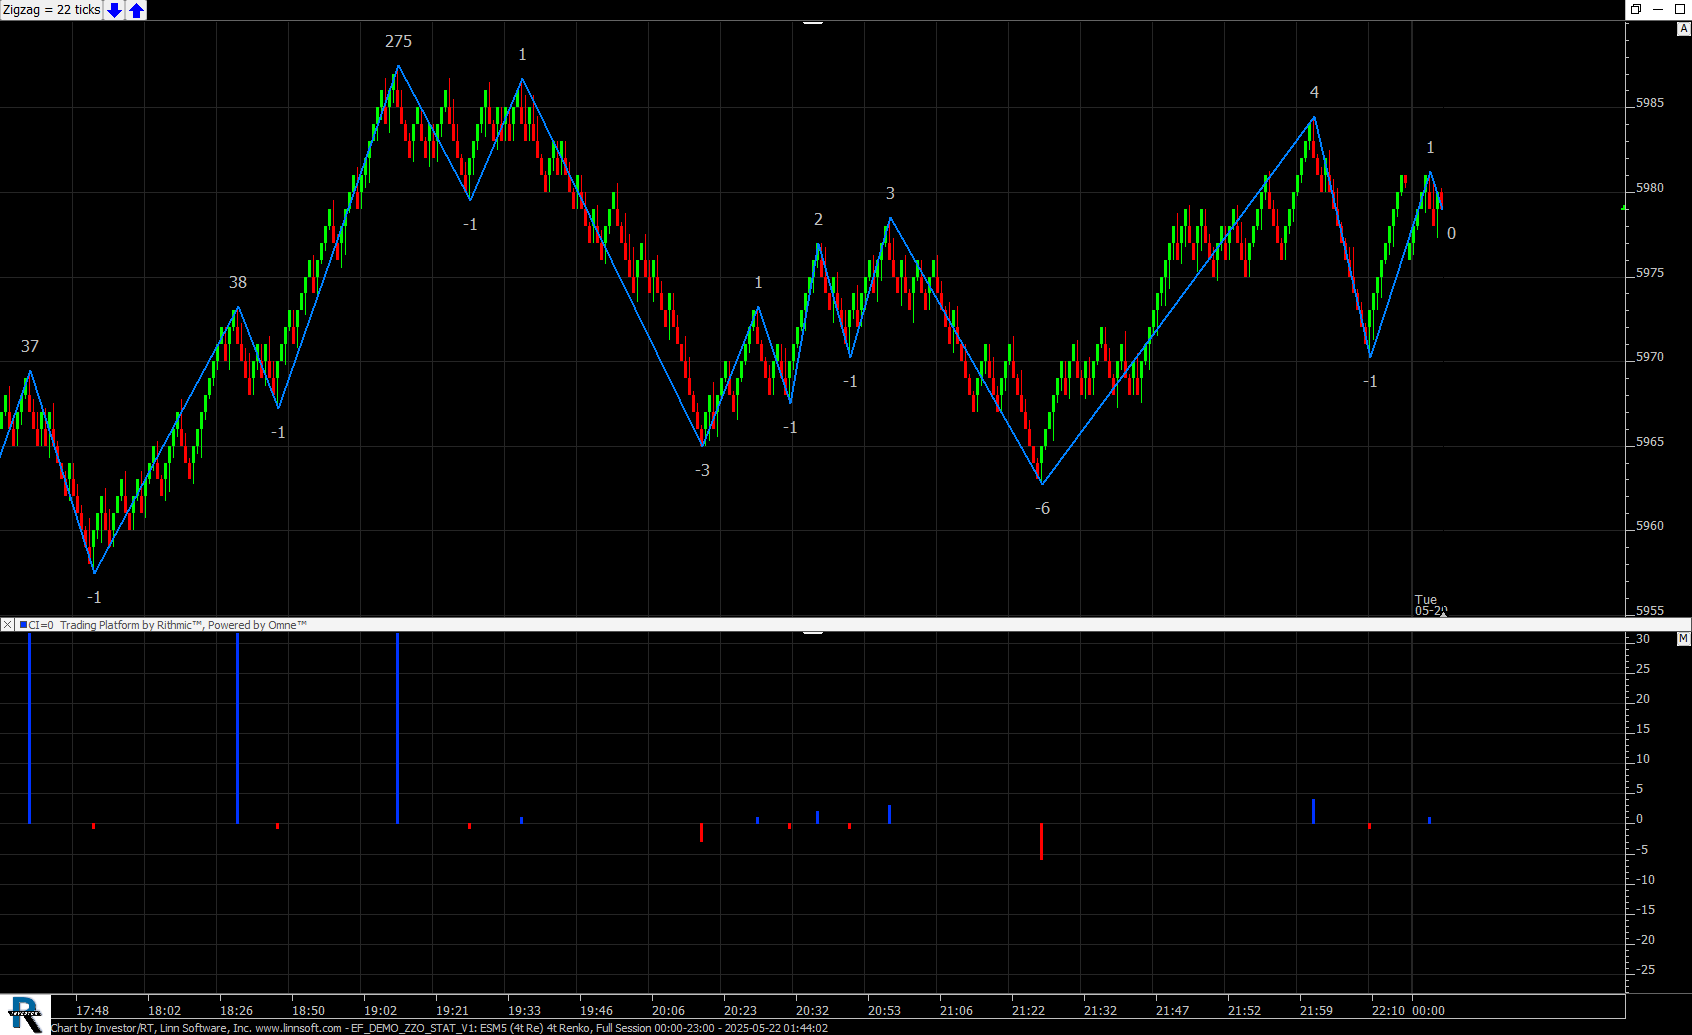 |
EF DEMO ZZO STAT V (ESM5) Eddy [totalcount]
1 year 1 month ago
Answering to the question : how many up waves (resp. dn) I have to go back to find a wave with an higher High (resp. lower low) than the current one. |
View |
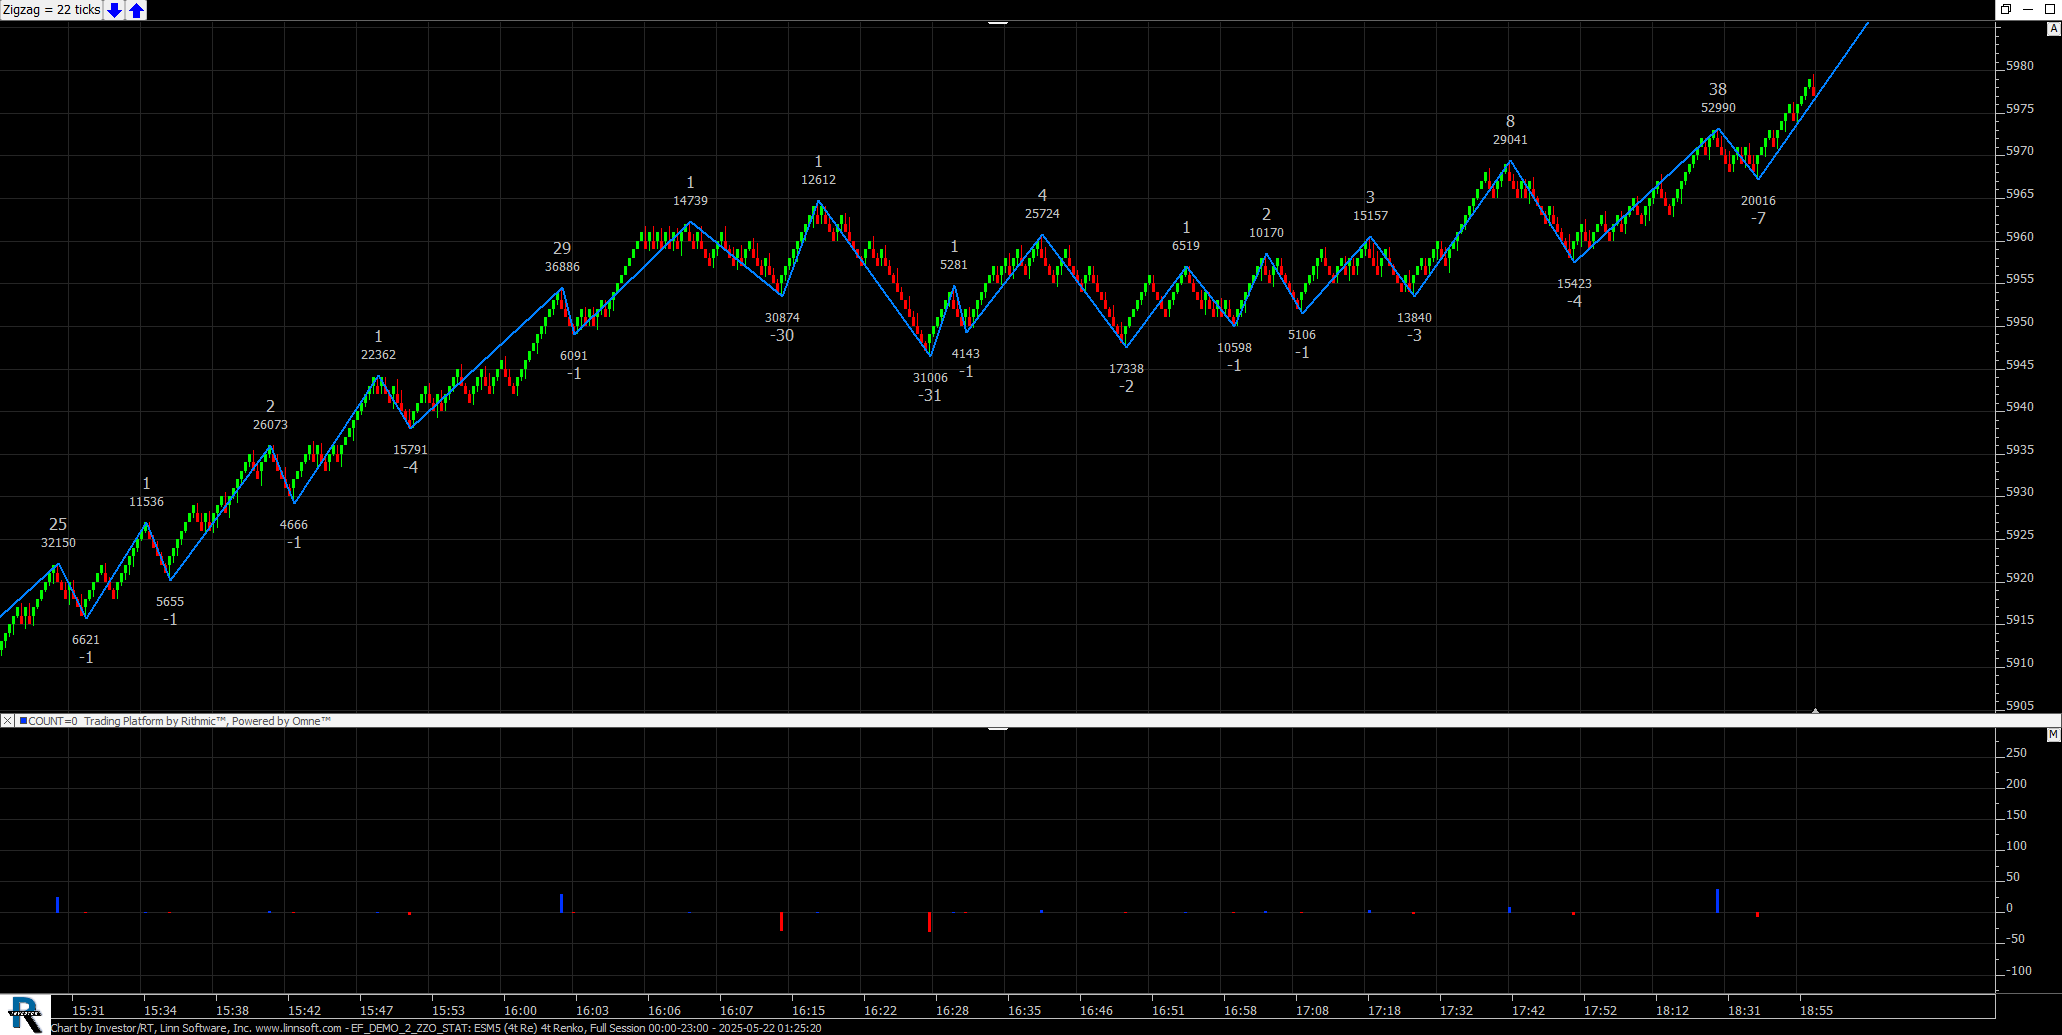 |
EF DEMO 2 ZZO STAT (ESM5) Eddy [totalcount]
1 year 1 month ago
Answering to the question : how many waves with up volume (resp. Low) I have to go back to find a wave with an higher volume (resp. lower) than the current one. |
View |
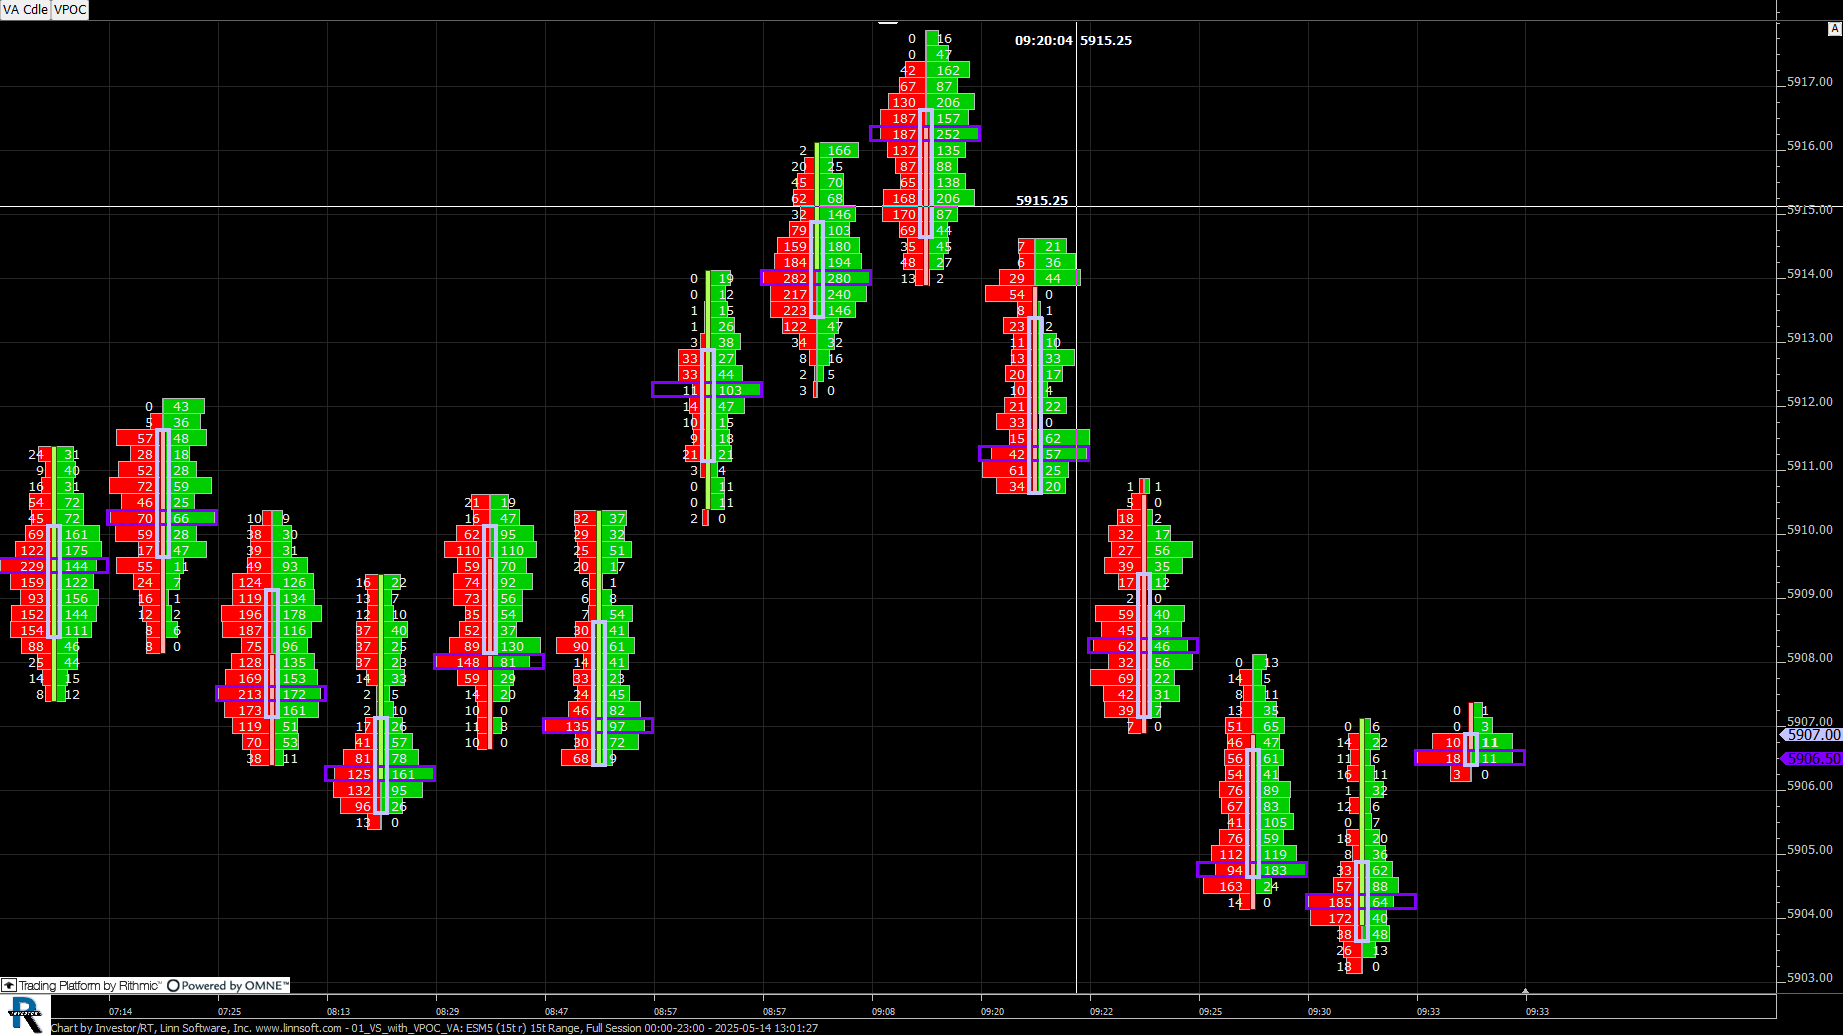 |
01 VS with VPOC VA (ESM5) Eddy [totalcount]
1 year 2 months ago
Using the Volume Price Statistics indicator (and PaintIndicator) to display the VPOC and Value Area Zone on top of Volumescope candles. |
View |
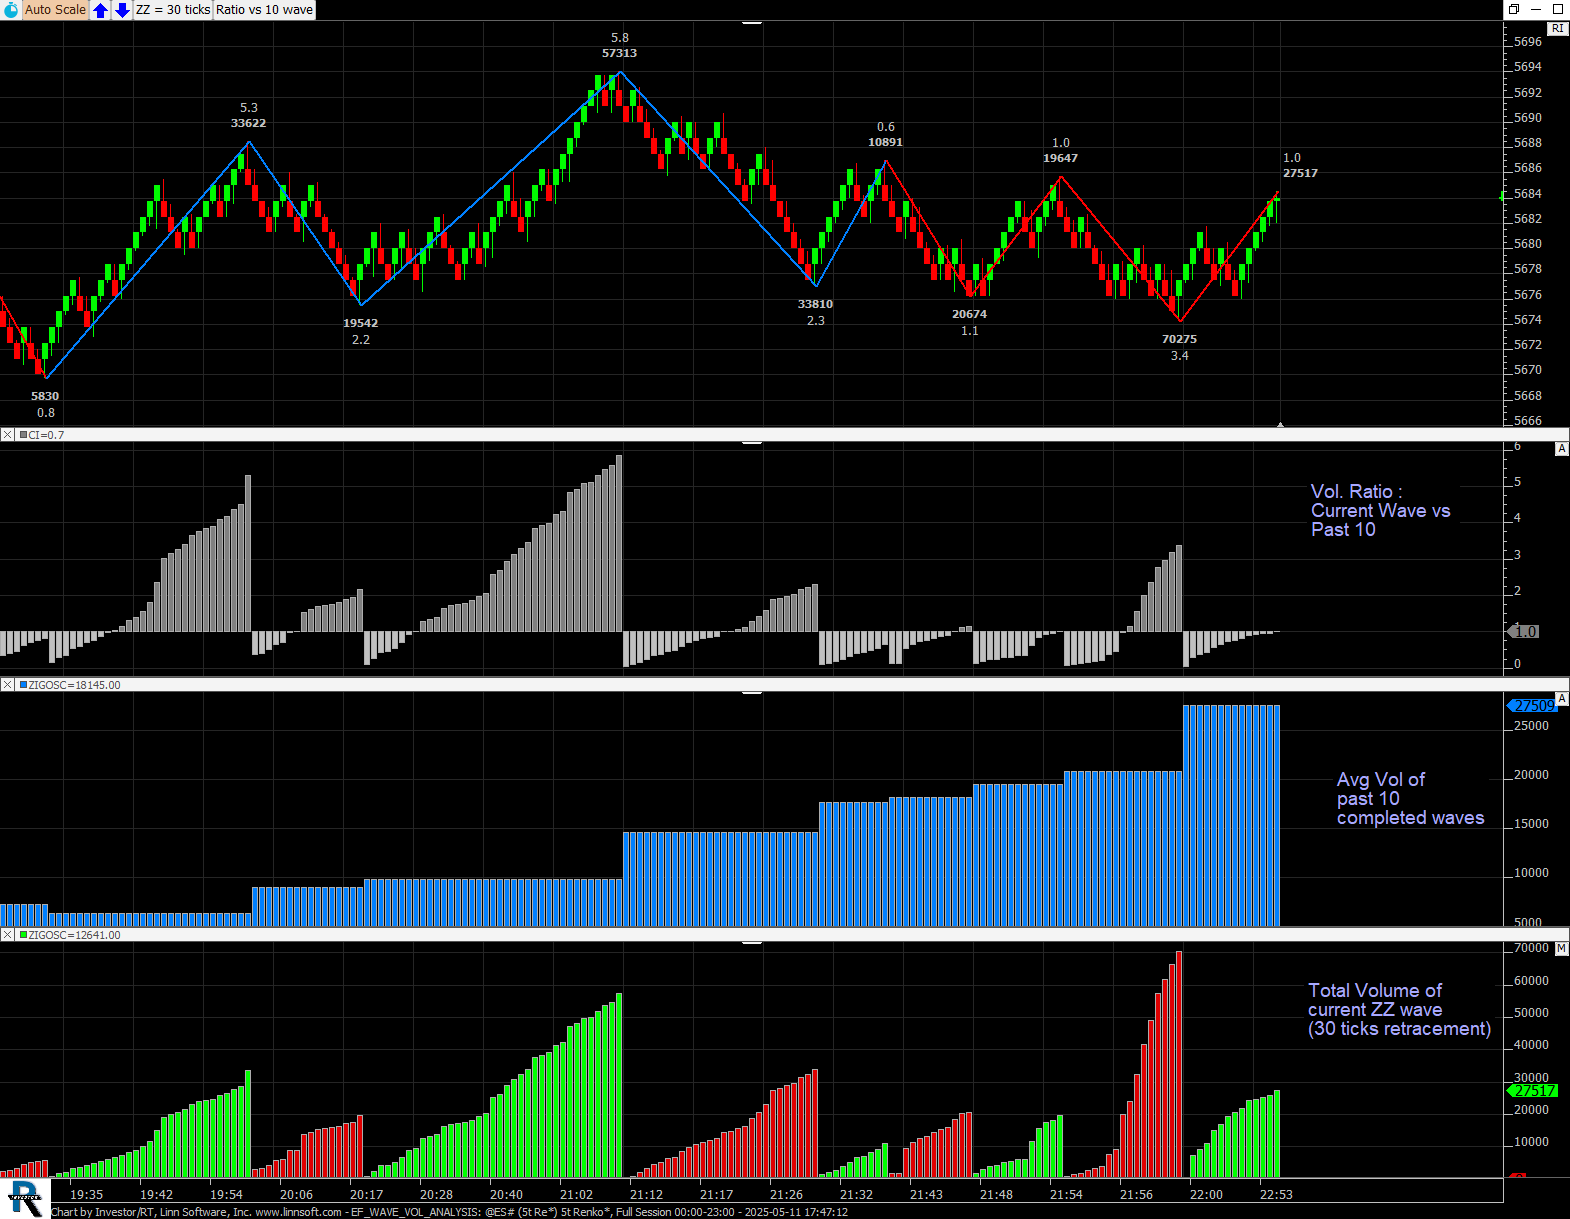 |
EF WAVE VOL ANALYSIS (@ES#) Eddy [totalcount]
1 year 2 months ago
Showcasing the use of Zigzag Oscillator token to calculate the volume ratio of an ongoing zigzag leg vs the avg vol of the past X legs. |
View |
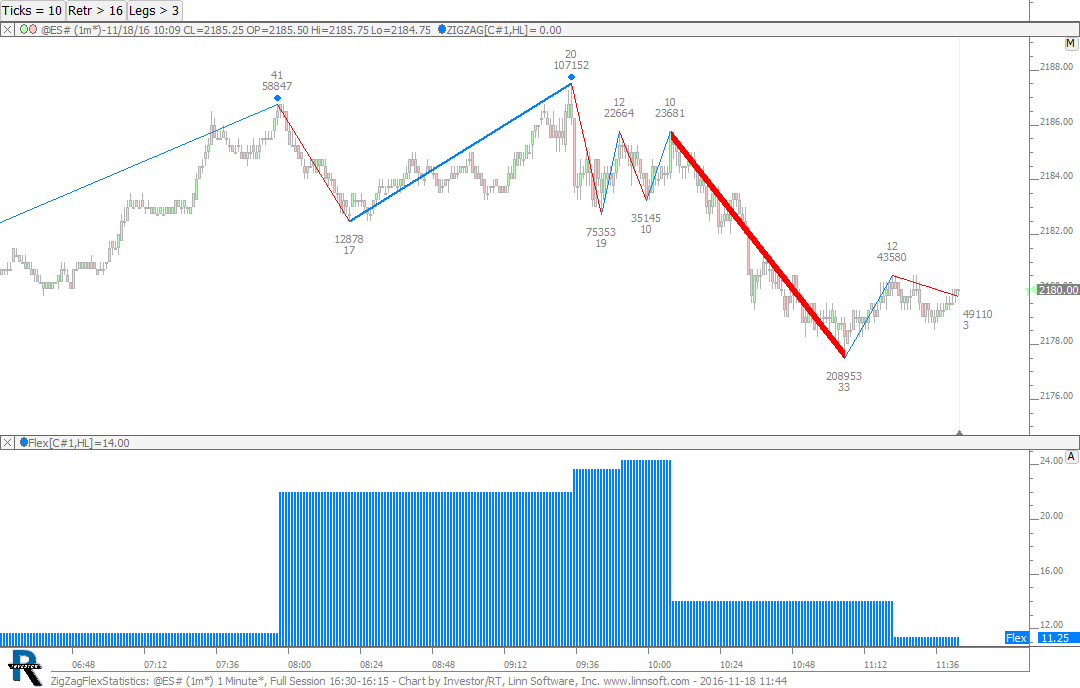 |
ZigZagFlexStatistics (@ES#) cpayne [totalcount]
9 years 7 months ago
Zig Zag Oscillator Flex Statistics. This chart is explained in the video Zig Zag Oscillator: Flex Statistics. |
View |
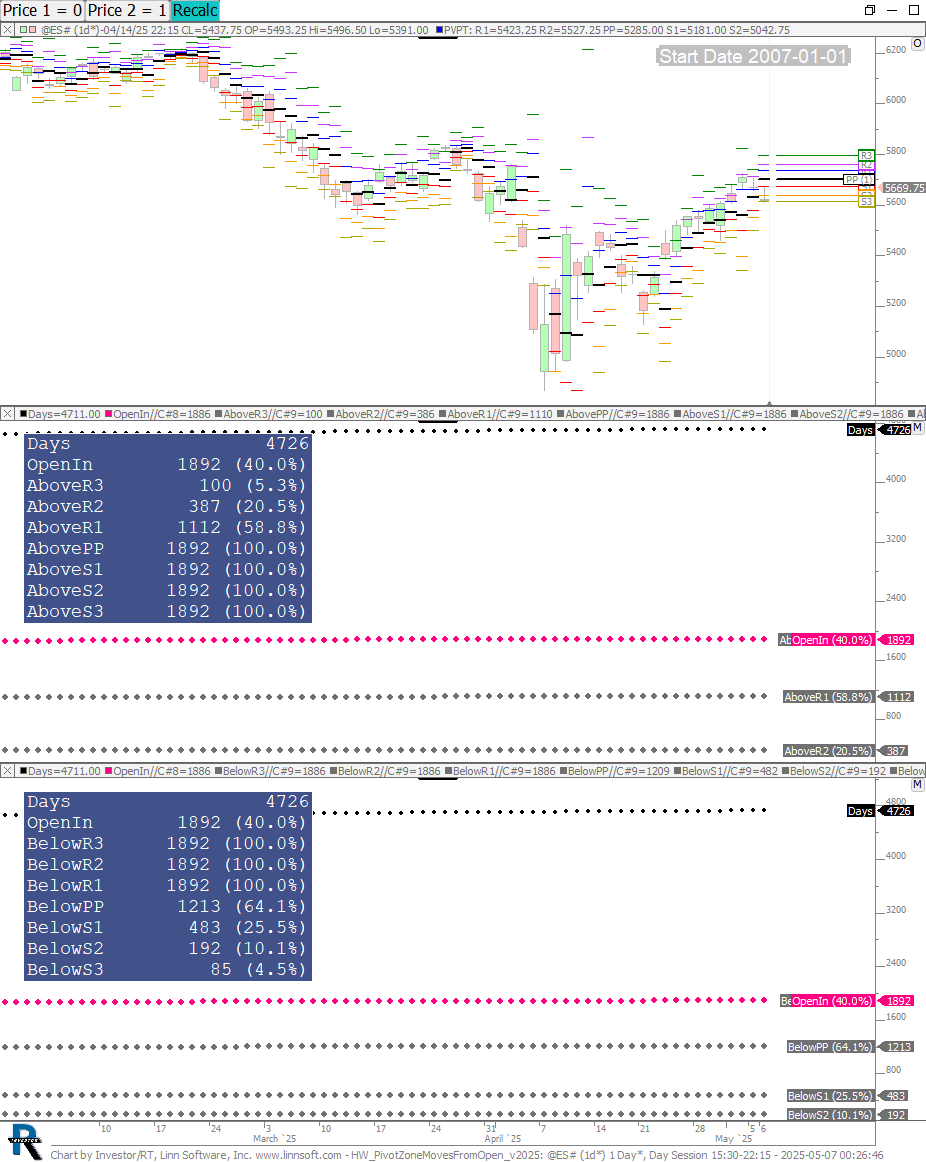 |
HW PivotZoneMovesFromOpen v (@ES#) Eddy [totalcount]
1 year 2 months ago
https://www.linnsoft.com/topic/movement-between-pivot-point-levels. |
View |
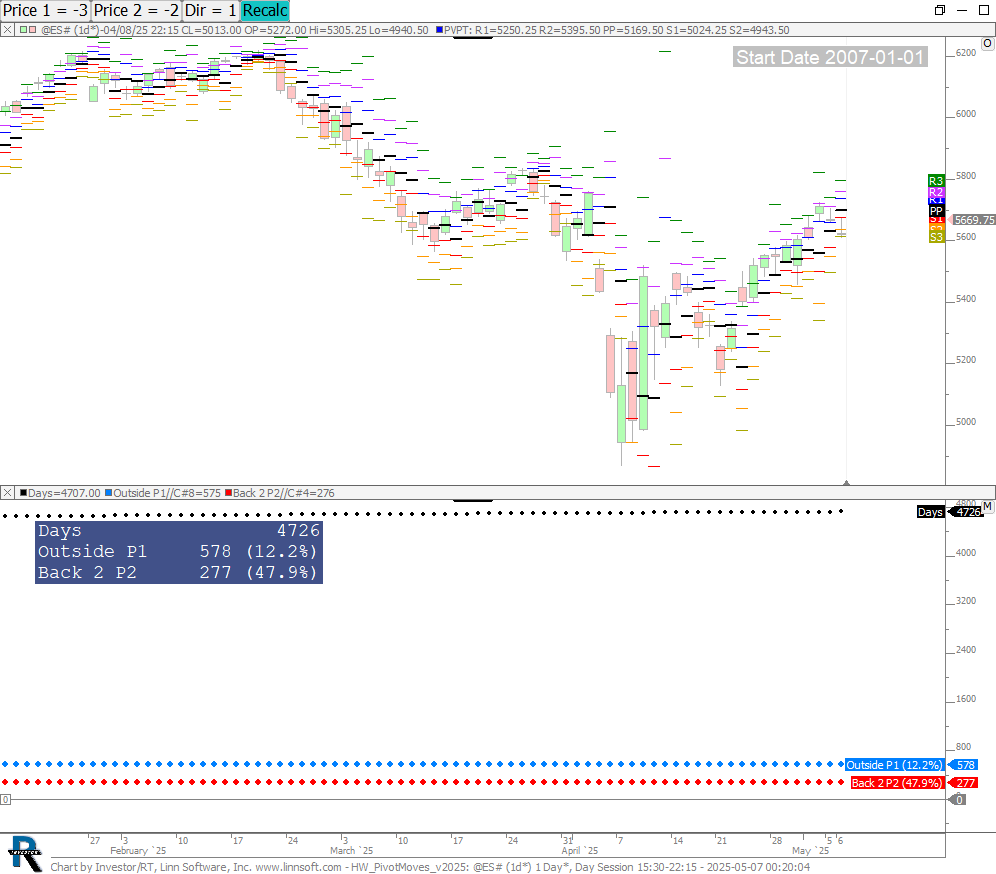 |
HW PivotMoves v (@ES#) Eddy [totalcount]
1 year 2 months ago
https://www.linnsoft.com/topic/movement-between-pivot-point-levels. |
View |
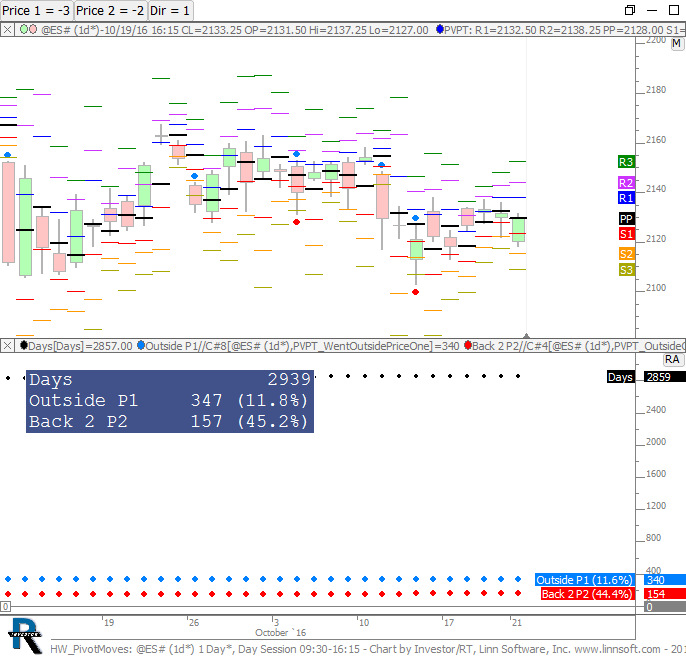 |
HW PivotMoves (@ES#) cpayne [totalcount]
9 years 4 months ago
Analyze Moves Between Any Two Pivot Levels. This chart was uploaded by Investor/RT 12.7.1 showing symbol: @ES#. |
View |