fibonacci

Triangles: Using Fibonacci Extension and Zig Zag

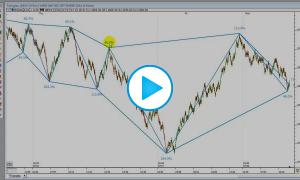
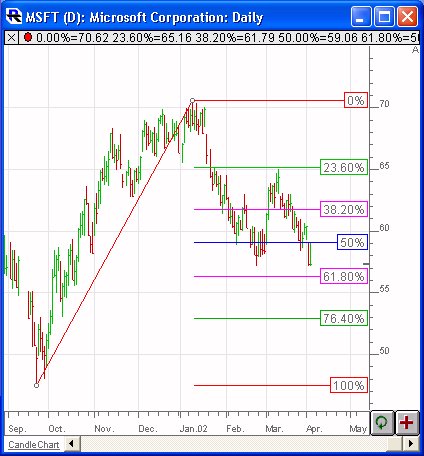
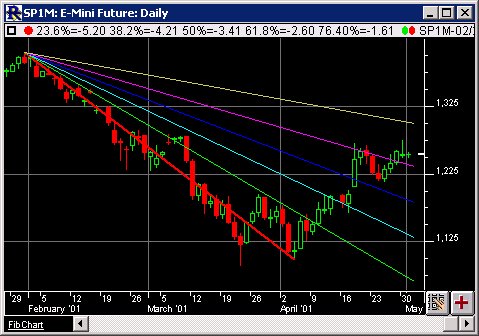
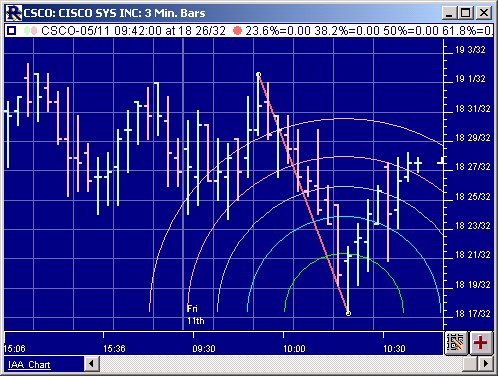
This video demonstrates two options for drawing triangles in Investor/RT. First it demonstrates how to draw automated triangles based on price moves using the Zig Zag Indicator. These triangles have the option of being automatically labeled with the retracement of the previous move, among other options. Then the Fibonacci Extensions drawing tool is used to demonstrate how to draw custom individual triangles. These triangles have the option of drawing lines of various retracement levels automatically. These tools can help identify and quantify harmonic patterns.

Fibonacci Retracements (FIBR)

The Fibonacci Retracement / Expansion study is a very flexible tool in Investor/RT, allowing for drawing of both retracement and expansion lines, based on either price (horizontal), time (vertical), both. The Fibonacci trendline endpoints can be automated, can be user specified, can snap to extreme prices, or can even be set automatically to any custom value using a scan. Over 16 custom retracement/expansion levels can be drawn with each instance of the study. The price retracements can be based on either % levels, or absolute price ($).

Fibonacci Extensions

The Fibonacci Extensions tool is similar to the Fibonacci Retracements tool. The Fibonacci Extensions indicator requires a third point. The extensions and retracement levels are drawn from this third point, but based upon the distance between the first two points. A common use of this tool is to first connect two points that represent the endpoints of a major trend (or wave). Then choose the third point to be the endpoint of a retracement of that trend.

Fibonacci Projections

Fibonacci Projections, or Fan Lines, are displayed by drawing a trendline between two extreme points, for example, a trough and opposing peak. Then an "invisible" vertical line is drawn through the second extreme point. Three trendlines are then drawn from the first extreme point so that they pass through the invisible vertical line at the Fibonacci levels of 23.6 %, 38.2 %, 50.0 %, 61.8 %, 76.4%, or whatever customized levels you prefer.

Fibonacci Arcs

Fibonacci Arcs are displayed by first drawing a trendline between two extreme points, for example, a trough and opposing peak The arcs are drawn, centered on the second extreme point, so they intersect the trendline at the Fibonacci levels specified. The interpretation of Fibonacci Arcs involves anticipating support and resistance as prices approach the arcs. A common technique is to display both Fibonacci Arcs and Fibonacci Fan Lines and to anticipate support/resistance at the points where the Fibonacci studies cross.