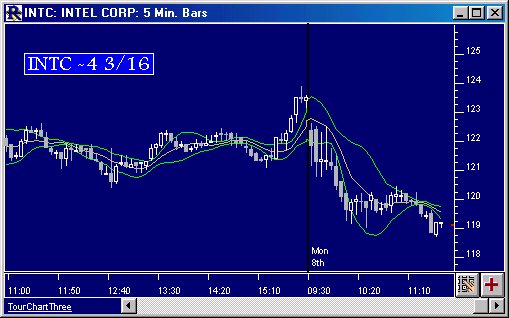
Moving Average Ribbons Chart (RTX)
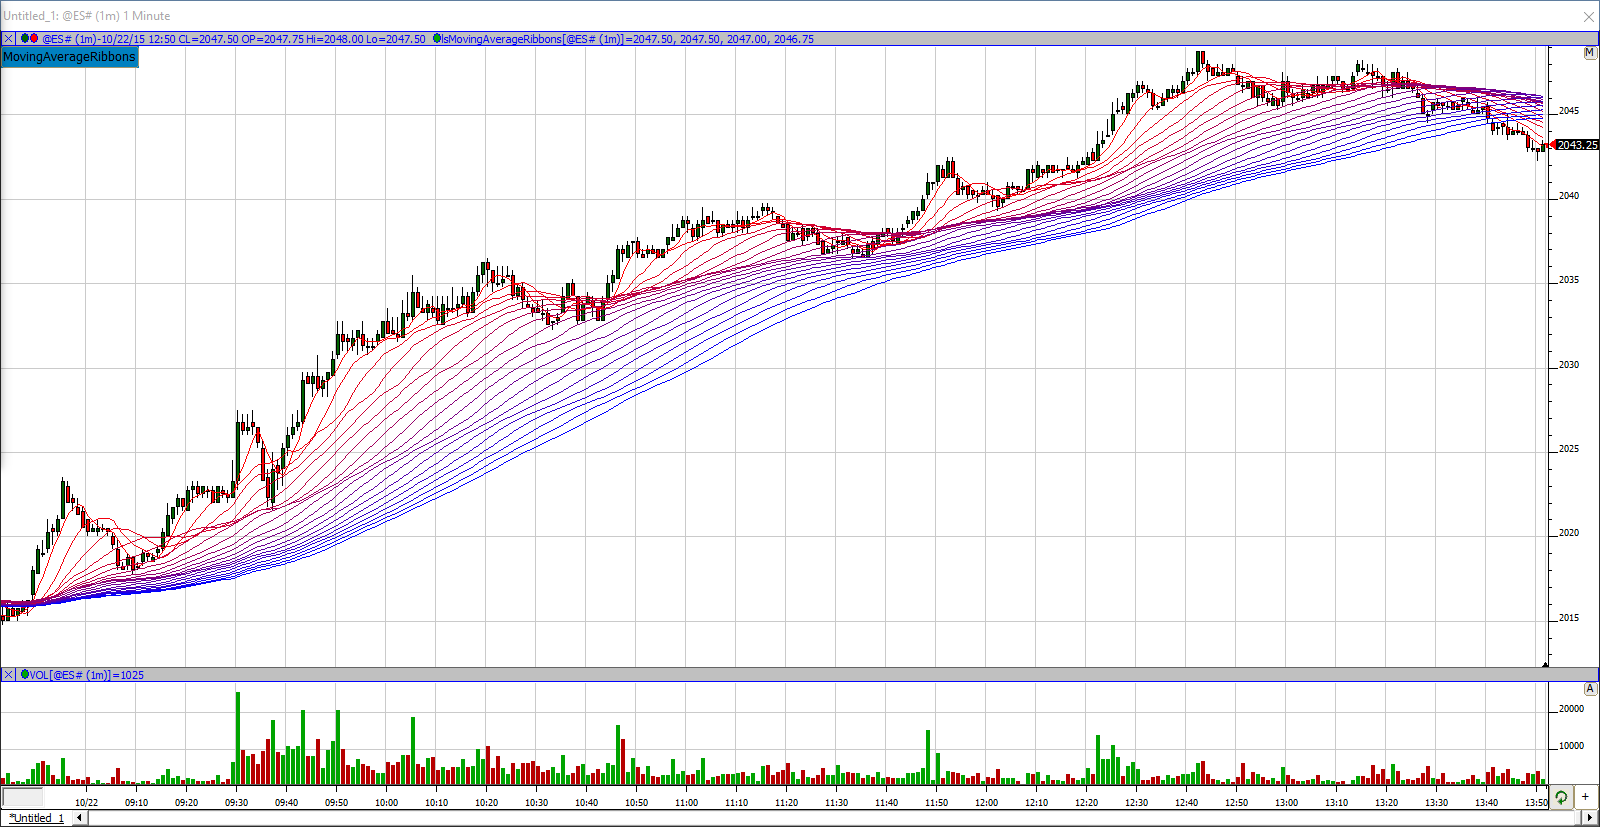
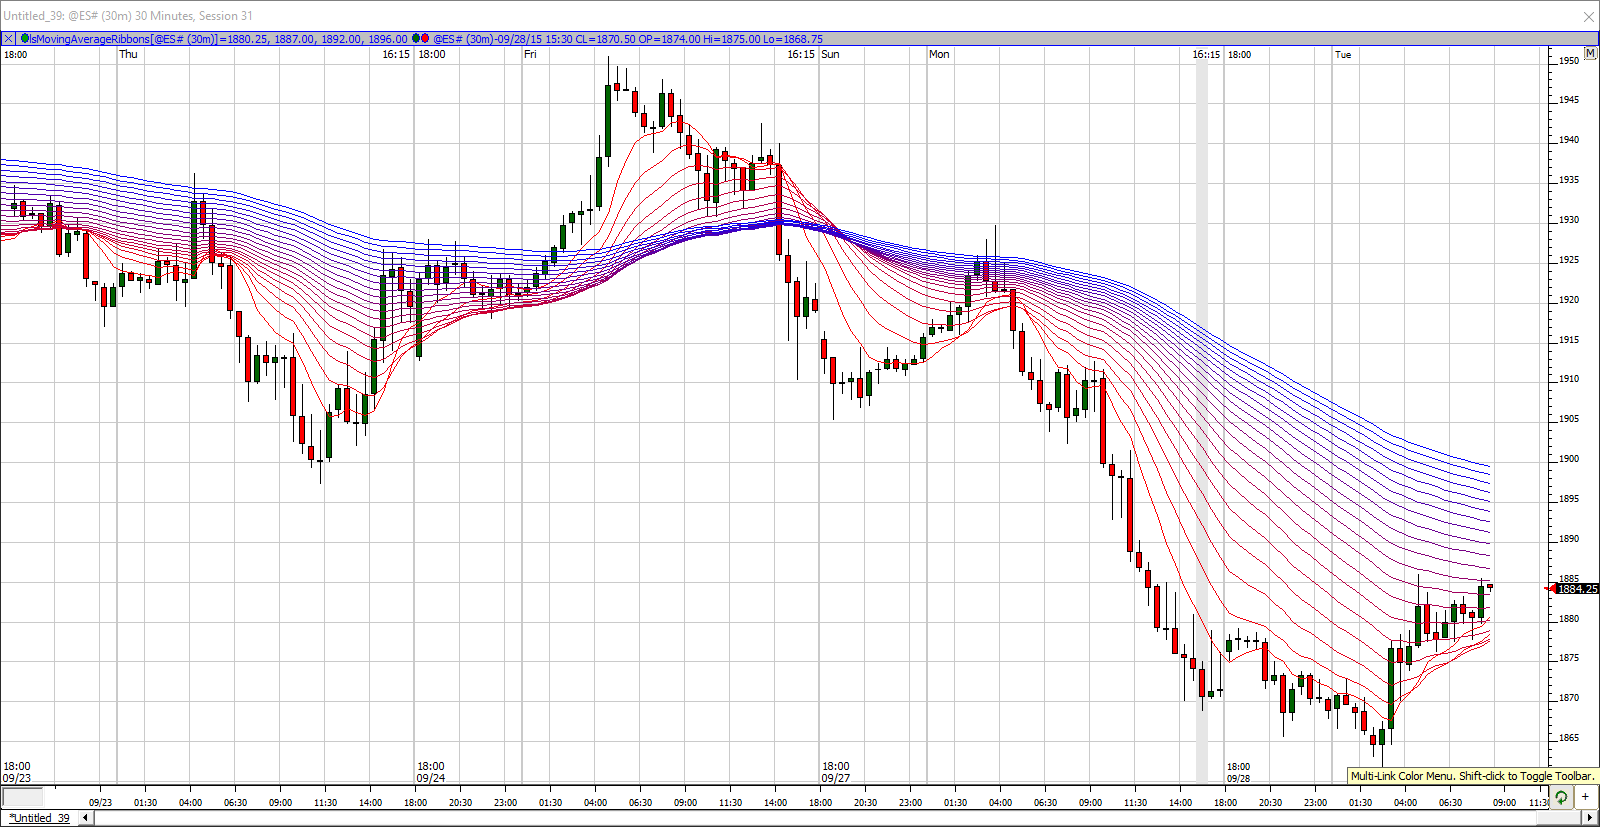
The Moving Average Ribbons Indicator allows users to set an initial Moving Average Period (Period Start) along with the desired number of Moving Average Lines (Lines) and the amount that each subsequent Moving Average should be incremented as it is added to the chart (Period Inc.). The general interpretation of this Indicator is that when all the averages are moving in the same direction, the trend is said to be strong. Reversals are confirmed when the averages crossover and head in the opposite direction.
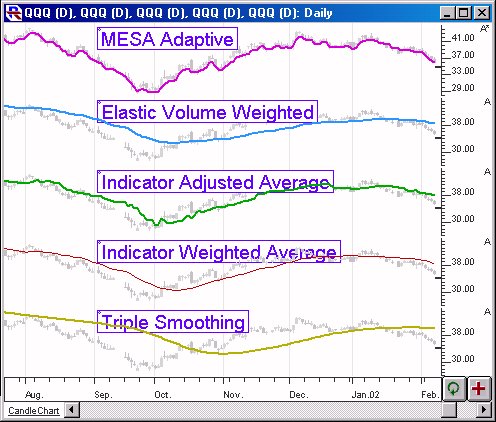
Moving averages provide different options for smoothing data. Data is smoothed in order to help reduce the effect of bar-to-bar price fluctuations and help identify longer term emerging trends. A moving average reveals the general direction and strength of a stock's price trend over a given period. The term "Moving" is used to refer to the fact that the window of bars that we are considering remain fixed in width (Period) but moves forward with subsequent bar. Some of the averaging methods however are not so much "Moving" as they are "Cumulative" (exponential for one).
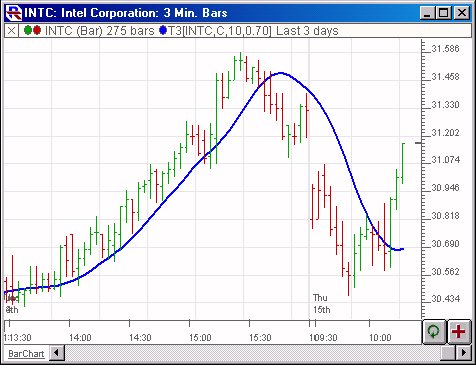
T3 is an adaptive moving average. It tracks the time series more aggressively when making large moves. It is discussed in the Stocks and Commodities article "Smoothing Techniques For More Accurate Signals" V16:1 (33-37).
Moving average channels use a moving average of price to create an envelope above and below the moving average line at a user specified number of standard deviations. The point of this study is to create a channel which represents support and resistance at its outer bounds based on the moving average. As always, the period of the moving average should match the trading time horizon of interest to the user. As price moves above its n-period moving average, a bullish indication is noted. Conversely, a price move below its x-period moving average is a bearish event.
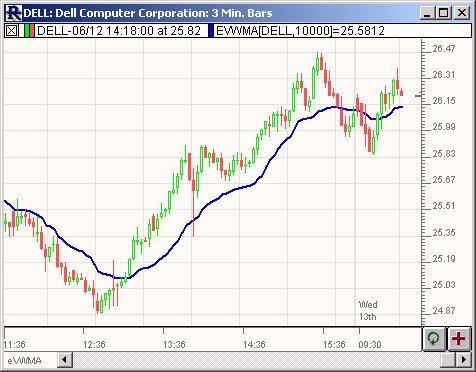
eVWMA is a statistical measure using the volume to define the period of the moving average. It incorporates volume information in a natural and logical way. The eVWMA can be looked at as an approximation to the average price paid per share. The ability to "Use Average Volume" as your volume period, makes this indicator both symbol-independent and timeframe independent. This allows the use to switch both timeframe and symbol without having to change the volume period.
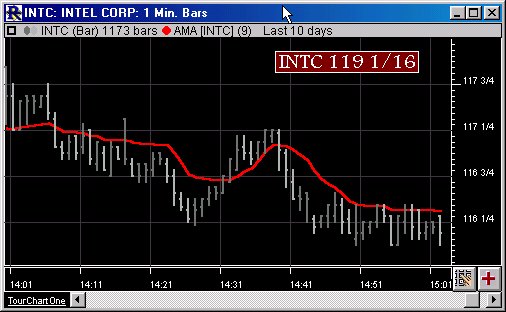
The adaptive moving average moves slowly when prices are moving sideways and moves swiftly when prices move swiftly. The basic rule is to buy when the AMA turns up, and sell when the AMA turns down.
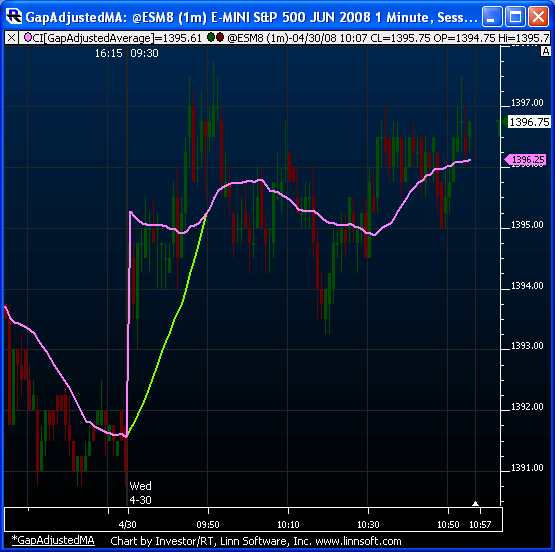
This chart plots a gap-adjusted moving average in pink. This moving average is implemented with a custom indicator and therefore requires the pro version of Investor/RT. This is a 20 period simple average. Notice the red line meets up with the standard 20 period simple MA on the 20th bar of the session.
The syntax of the custom indicator follows: