Periodicity Options
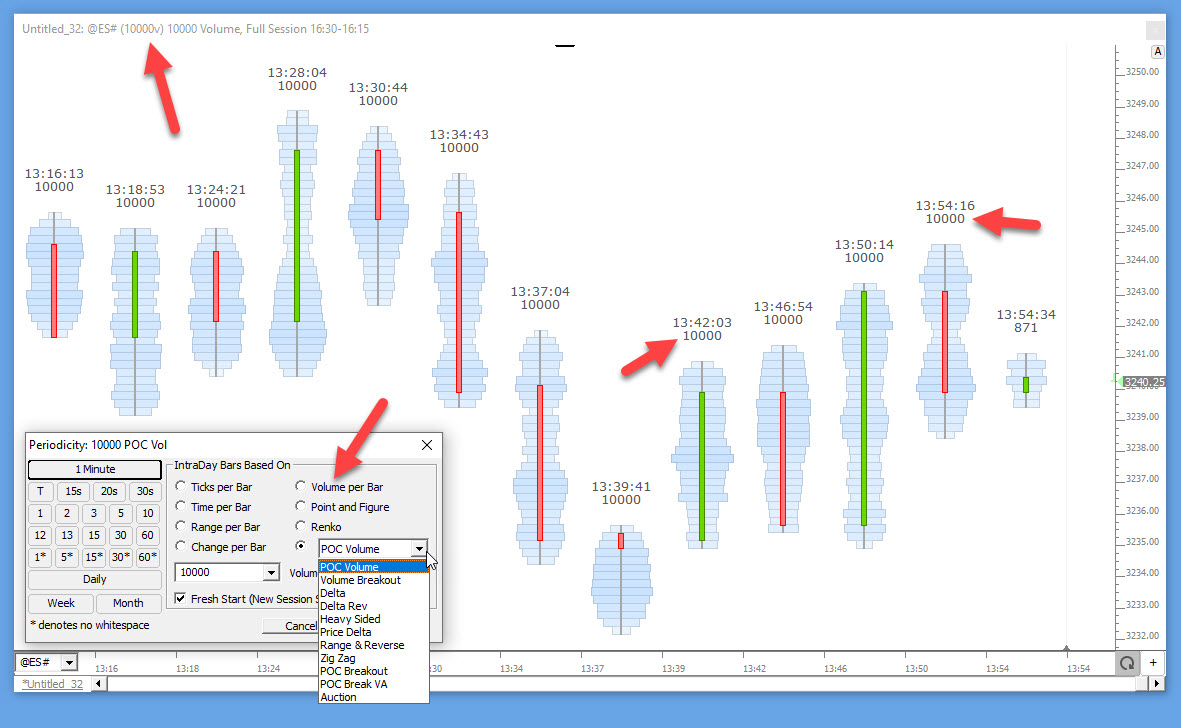
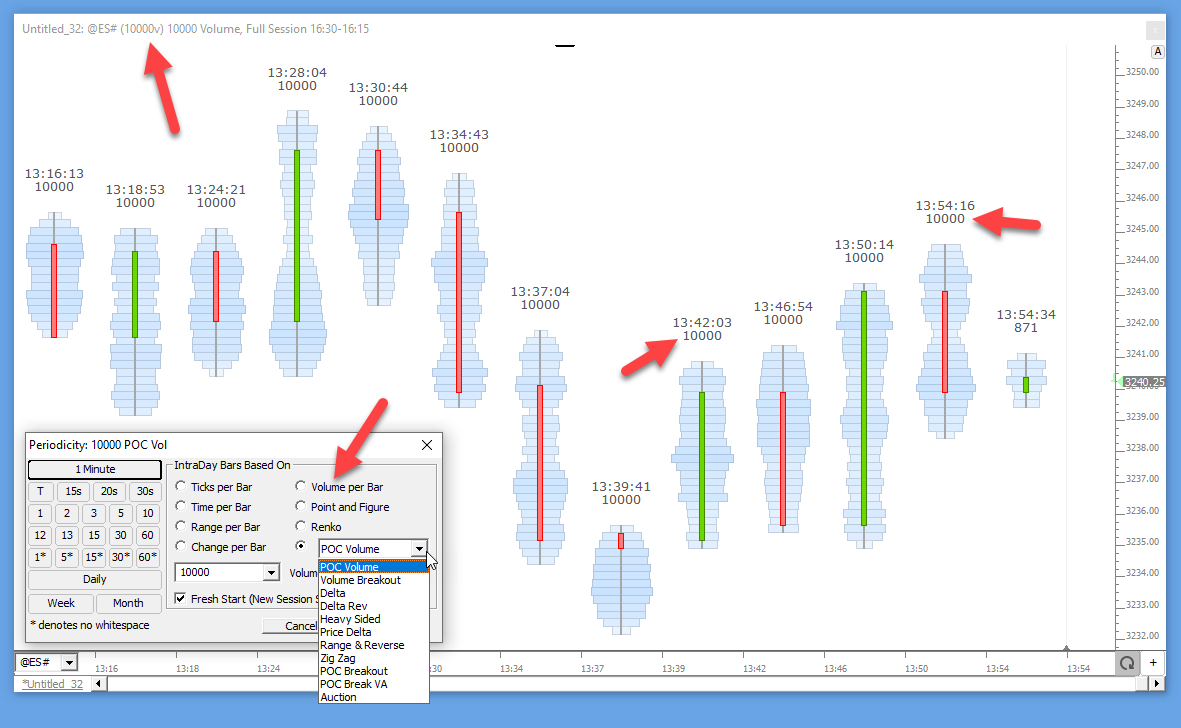
This video highlights a new periodicity in Investor/RT 13.1 called the POC Breakout periodicity. This periodicity requires a bar to reach a user-specified minimum POC Volume, and then continues to form until price breaks out of the range that was achieved while building to the POC Volume to that level. This periodicity combines a volume component with a range component.
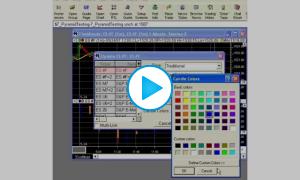
A periodicity named Zig Zag has been added. The magnitude of the periodicity is supplied in ticks. Bar formation operates on the same principles as the Zig Zag indicator. Each bar represents a market move of at least the user specified magnitude. Each bar is an accumulation of the data of a market move. Zig Zag bars are unique in several ways. Each bar opens on one extreme and closes on the other extreme, thus there are no wicks. Also, not only does the last bar change with price movement, but the next to last bar can also change.
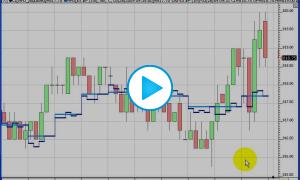
This video demonstrates how to mix periodicities in signals using MPD (Mixed Periodicity Data Indicator). In the specific example used in this video, a signal showing the moving average crossover on a 5-minute data was displayed on a 1-minute chart.
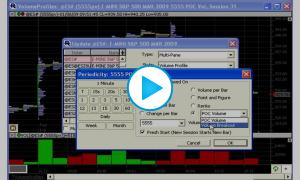
This video demonstrates two periodicities that were added in version 9.2: Point of Control Volume and Volume Breakouts.
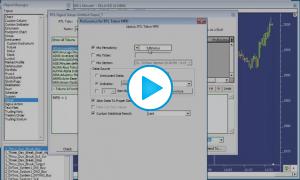
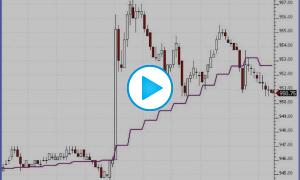
This video demonstrates how to plot the any indicators current value from any chart, on any other chart. In our example, we plotted the daily Volatility Stop on a 3-minute chart as a horizontal reference line.
Charts that utilize a periodicity of "Daily" will show a different quantity of Volume when compared to charts that utilize an intraday periodicty like 1 minute or 1 Day*. This is caused by the fact that certain types of trades, such as block trades, spread trades and market trades, are considered by the exchange when reporting the cumulative daily volume for a specific symbol or contract. However, those trades are not represented in the tick or 1-minute intraday data for the symbol. These trades together make up the difference observed between the daily volume and the sum of the intraday volume.

This video demonstrates how to add a button to a chart that will change the periodicity in the chart.
This video discusses some important aspects of the Mixed Periodicity Data indicator that users should be aware of when using it, and provides some alternative methods to the use of MPD to mix periods.
Anyone using MPD in any context should watch this video. This video demonstrates how to make the most efficient use of the MPD (Mixed Periodicity Data) indicator, which can be extremely inefficient without the use of the special method.