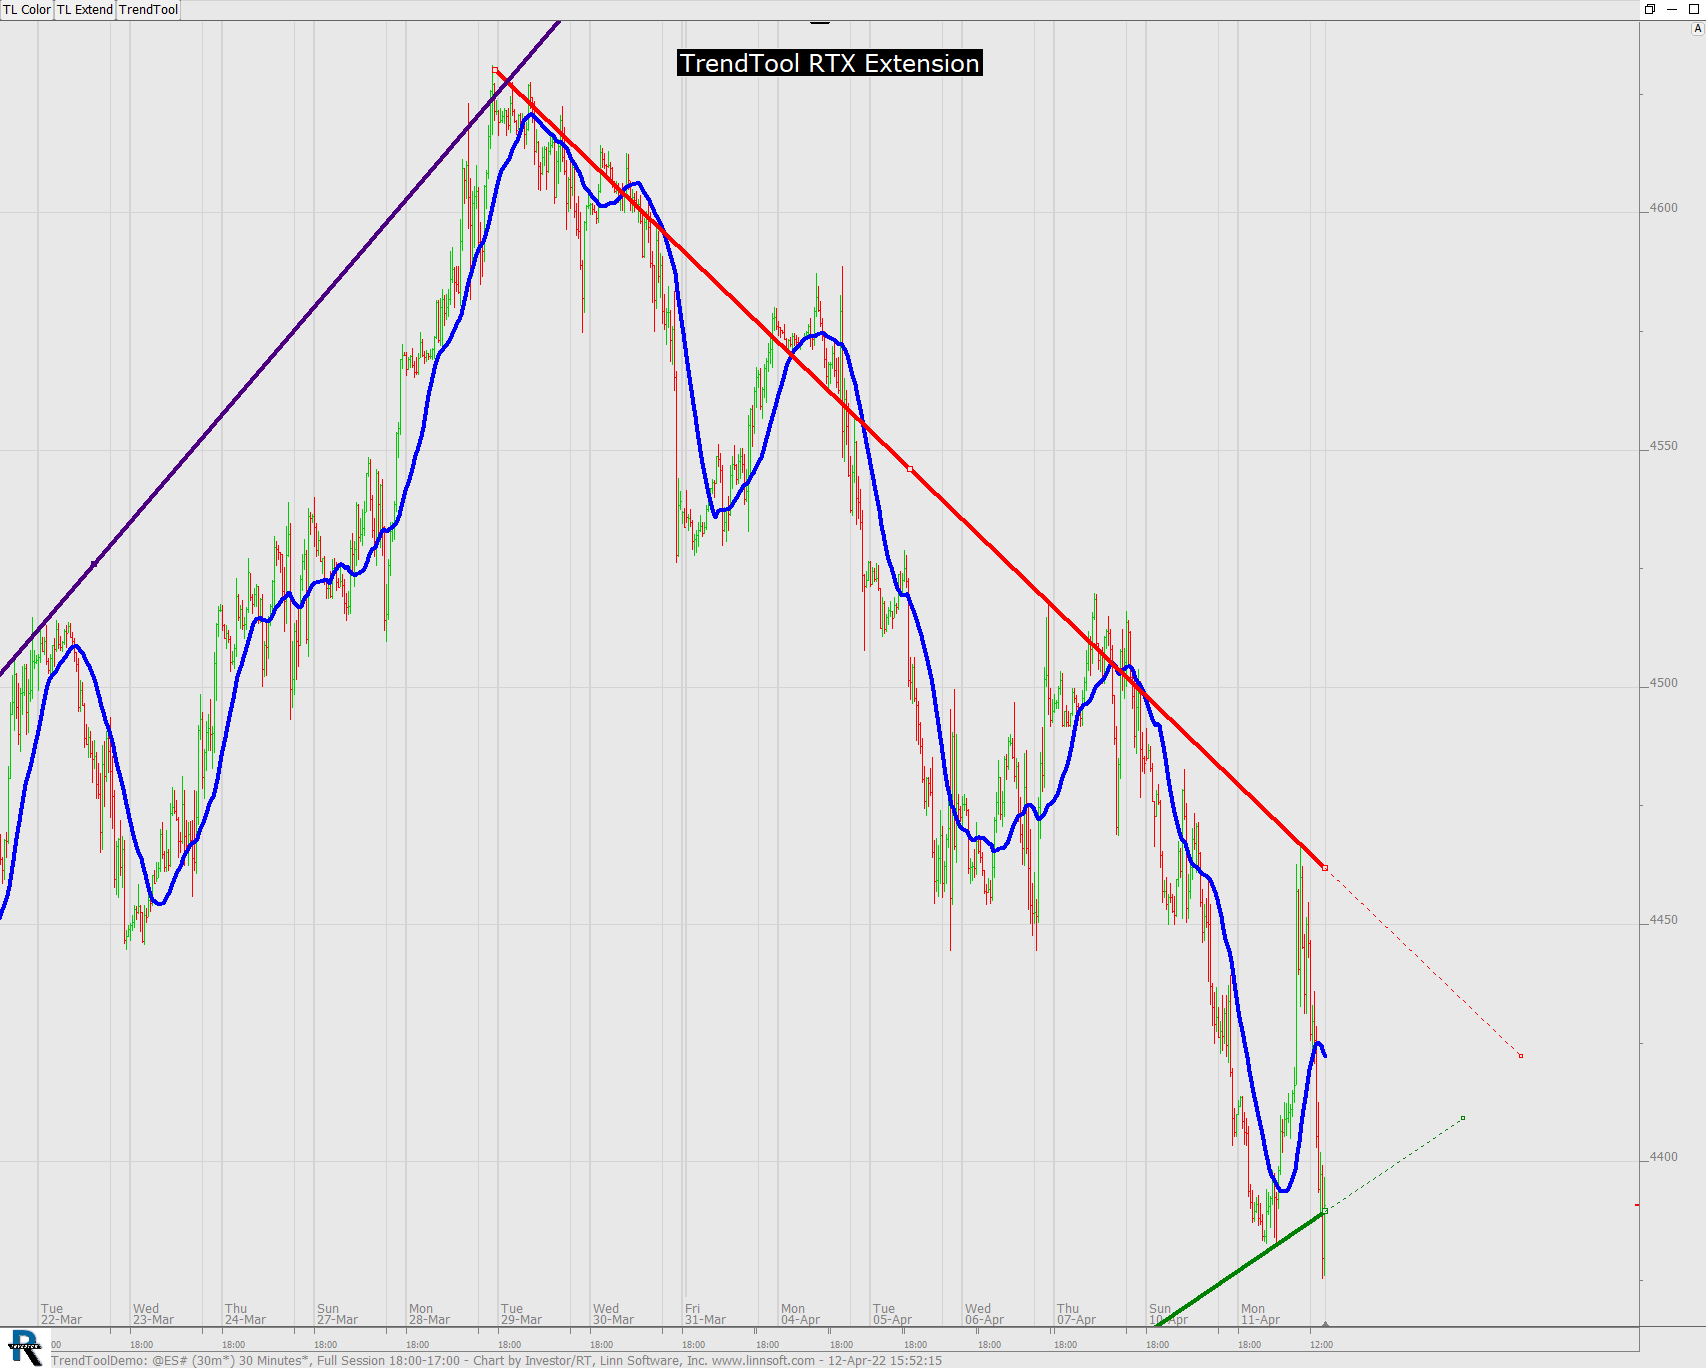
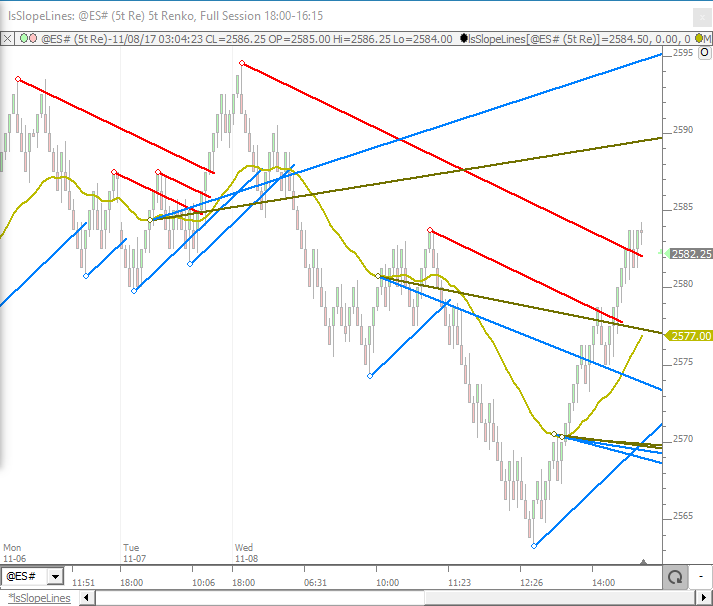
trendlines

TrendTool (RTX)

TrendTool is an RTX Extension for easily drawing and editing trendlines on instruments. TrendTool does not replace the long standing Trendline indicator in Investor/RT. Think of it as a companion tool that you may prefer to use sometimes. Some may use it most of the time. TrendTool was developed using the RTX development tools. As a result, TrendTool trend lines can be edited using convenient keyboard shortcuts and mouse actions.

TrendTool (RTX)

TrendTool (RTX)

TrendTool is an RTX Extension for easily drawing and editing trendlines on instruments. TrendTool does not replace the long standing Trendline indicator in Investor/RT. Think of it as a companion tool that you may prefer to use sometimes. Some may use it most of the time. TrendTool was developed using the RTX development tools. As a result, TrendTool trend lines can be edited using convenient keyboard shortcuts and mouse actions.

SlopeLines (RTX)

Trendlines are one of the basic trading tools used to follow trends in market data. They are easy to draw in Investor/RT using the trendline drawing tool: click on a starting point; drag and drop on the ending point. Investor/RT has some trendline automation features as well that attempt to determine the current trend and auto draw lines to depict the trend. Introducing SlopeLines - a new tool that takes trendline automation to the limit.

AutoTrend Indicator

AutoTrend Indicator Introduction

This video demonstrates the AutoTrend indicator. Continuing the strategy of extending the platform using our RTX development tools, Linn Software is pleased to introduce another new RTX indicator, available to all subscribers and platforms powered by Investor/RT.

Cloning Trendline / Labeling and Arrowheads

Trend Line Indicator

This video provides instruction on cloning/duplicating trendlines (with same length and slope as original), and discusses using trendlines as custom labels with arrowheads pointing to a specific bar.

Trend Line Based Indicators

This video is going to demonstrate how to add and manipulate trend line based indicators or drawing tools in Investor/RT traditional bar and candle charts.

Analysis Of A Move

This video demonstrates how to analyze moves by accumulating statistical data from each price move and labeling the end points of those moves with the data values. This analysis is available to both the Zig Zag indicator for automatic identification of moves as well as the Trendline indicator for manual identification of moves.

Trendlines

Trendlines

This video gives a comprehensive overview of trendlines in Investor/RT: how to add and manipulate trendlines, adjusting preferences, scope, parallel and mirrored trendlines, alerts, labels, and much more.

Pages