FlexMeters (RTX)

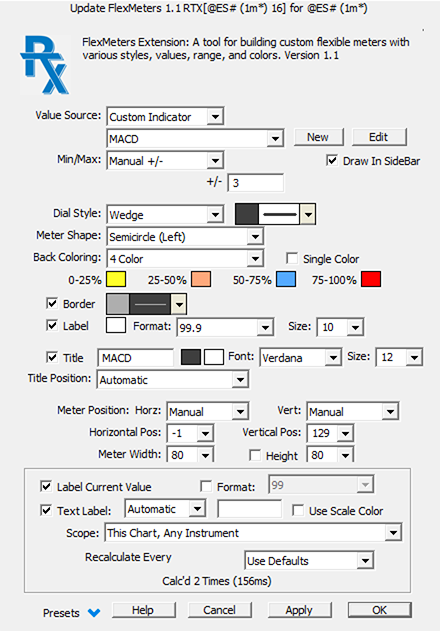
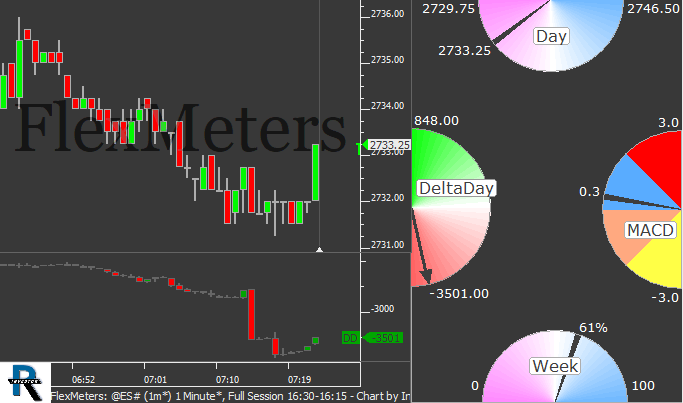
FlexMeters is an RTX extension designed to enable Investor/RT users to display customized meters of market behavior within multi-pane charts. This flexible tool draws meters showing the present value of some price or computed value as compared to a specified range of values seen in the past.  FlexMeters can be drawn using a variety of shapes, colors, dials, positions, titles, and labelling options.  The underlying data values of a FlexMeter can be price values of the associated instrument, or values computed via an RTL custom indicator; thus there is unlimited flexibility in the kinds of market behavior gauges that can be available at a glance to the trader. The range or scale of the meter may be specified manually or it can be computed from minimum/maximum values of a recent period of trading. Even more flexibility can be achieved by specifing the range using C# or V# user variables that may be set by the user or computed by some RTL indicator elsewhere in the trader's workspace.

Meter shape options include Semicircles (Right, Left, Top, Bottom), Quadrants (Top Right, Top Left, Bottom Right, Bottom Left), Blocks (Up, Down, Left, Right), and Pyramid.  A meter's dial can be an Arrow, Line, Wedge or Pie.  The color of both the meter background and the dial are user adjustable with a variety of solid and gradient coloring options.  Options are available for borders, labels, and titles, complete with color customization along with font size and style, and positioning.  The meter position and size is fully customizable with options to align to the top, left, bottom, right (or a combination of the two such as top/left).  Once a Meter has been setup with desired preferences, it may be easily dragged and dropped into to another chart. Right-click on any FlexMeter and choose Duplicate; then customize settings further and drag the meter to a new position.

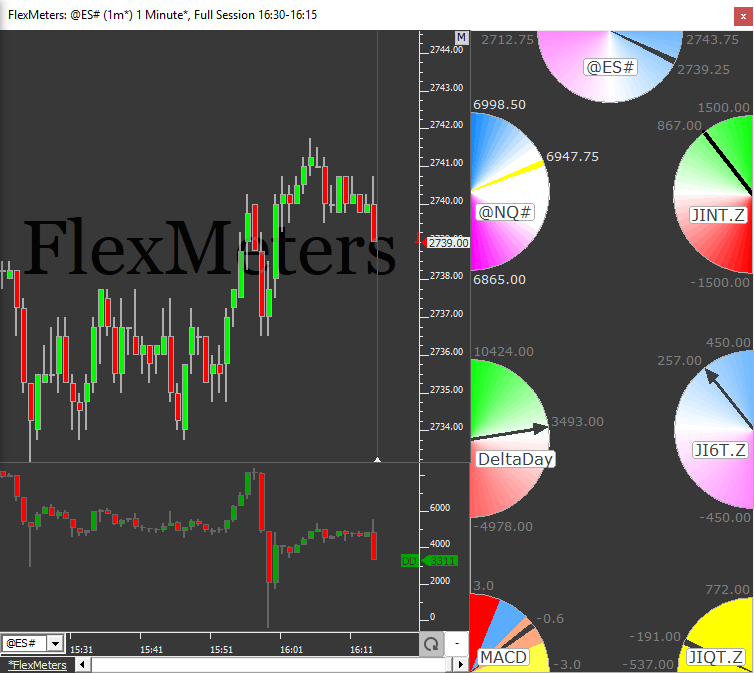
The FlexMeters extension is empowered by a new RTX charting feature called a sidebar. A sidebar is a vertical pane that appears to the right of normal chart window panes where RTX extensions may draw results of interest to the trader. Mouse down on a FlexMeter; drag and drop it into the vertical scale area at the right side of the chart; a sidebar pane will appear showing the meter. Several FlexMeters can be arrayed inside a side bar pane so that the market indications are readily available at a glance and do not overlay any of the chart graphics of regular panes. Some FlexMeters can appear in regular panes while others are shown in a sidebar pane. Sidebar panes span the entire vertical height of the chart window, regardless of how many panes there may be in the chart. Other RTX extensions, such as the Clock extension, will support the RTX sidebar so they may displayed alongside FlexMeters in a sidebar pane.

Presentation

Keyboard Adjustment

Select FlexMeters and use any of the following keystrokes to toggle the following features...

S = Shape
D = Draw in Sidebar
T = Title
L = Label
B = Border
Up/Down/Left/Right Arrows - Adjust Position
Shift+Up/Down Arrows - Adjust Size

FlexMeters Prefs

  • Value Source - Source from which the current value of the meter will be derived.  Options include Custom Indicator, Manual, Instrument (Chart), and Instrument (Other).  The Manual option allows the user to specify a constant number, or a C# or V# variable.  Instrument (Other) allows the user to type in any other instrument that is defined in the system.
  • Min/Max - Source from which the minimium and maximum scale values of the Meter will be derived.  Options include Custom Indicator, Manual, and Instrument. When manual is chosen, the min and max can be specified as constant numbers (-100 or 100) or C# or V# variables (Min: C#1, Max: C#2).  When Custom Indicator or Instrument are chosen, a Min/Max Period listbox is available which provides options of Current Session or Last X Bars.  As an example, if Instrument > Current Session is selected, the min and max will pull from the highest high and lowest low of the instrument for the current session.
  • Dial Style - Style with which the dial will be drawn.  Options include Arrow, Line, Wedge, Pie, and None.  Wedge draws a narrow wedge at the current value, while Pie draws a slice covering the area from the min value to the current value.   None may be used when the user chooses "Single Color" and is coloring the full Meter based the relative position of current value to min/max.
  • Meter Shape - Options include Semicircles (Right, Left, Top, Bottom), Quadrants (Top Right, Top Left, Bottom Right, Bottom Left), Blocks (Up, Down, Left, Right), and Pyramid.  These are drawn using the size and position specified below.  Semicircle Right will draw the right half of a circle.  Quadrant (Bottom Right) will draw the lower right quarter of a circle.  Block (Left) will draw a left oriented histogram (with min on right and max onleft).  Pyramid is drawn with min at bottom and max at tip, in three dimensions.
  • Back Coloring - Meter background coloring options include 1 Color, 2 Color, 3 Color, 4 Color, 2 Color Gradient, 3 Color Gradient, 4 Color Gradient, and Quadrants.  1 Color option draws the full background in a single color.  3 Color option will provide an option for 3 colors and split the meter into 3rds drawing 0-33% in the 1st color, 33-67% in the 2nd color, and 67-100% in the 3rd color.  3 Color Gradient also provides 3 colors, painting the lower half of values in a gradient from color 1 to 2, the top half of values in a gradient from color 2 to 3.  Quadrants draws 3 small slices in user-defined colors at 25%, 50%, and 75%.
  • Single Color - When single color is checked, the background will be a solid color but that color will still reflect the position on the dial relevant to the background coloring option chosen.  For instance, if 2 color gradient was chosen as the back color, the one color would reflect the position of that dial respective of it's position between min and max gradient colors.
  • Border - Border color and width for the meter.
  • Label - Option to turn on the labels for the mix, max, and current value along with options for color, display format, and font size.
  • Title - A custom title can be placed on the meter.  User specifies the text of that title (which can include % tokens such as %TICKER or %LAST), the background and text color, the font style and size. Once activated, the title may be dragged to different positions relative to meter.
  • Meter Position - Horizontal and Vertical position of the meter.  Options include manual vertical and horizontal offsets (from top left) or alignment to the left, right, top and/or bottom of the pane.
  • Meter Size - Option for width and height of the meter.  Typically, width is specified and height is automated to optimal symmetry but user may override the automated height.
FlexMeters (@ES#)
FlexMeters. This chart was uploaded by Investor/RT 13.5.9 showing symbol: @ES#. This chart is explained in the webinar Introducting Investor/RT version 13.5

Read more Download

Pop-up Video Description View
FlexMeters (RTX)
FlexMeters (RTX)

FlexMeters is an RTX extension designed to enable Investor/RT users to display customized meters...

 Watch