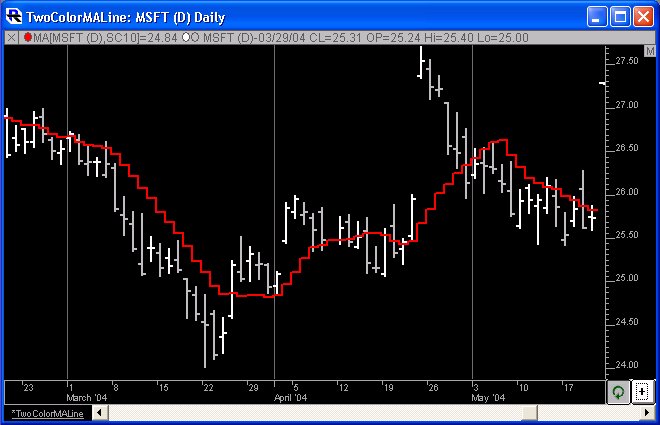
Coloring Lines & Histograms
This video demonstrates how to color line and histogram-style indicators different colors based on various conditions.
This video demonstrates how to color line and histogram-style indicators different colors based on various conditions.
This video describes how to create a more pronounced line separating the sessions in a multi-pane chart.
This video demonstrates how to draw a horizontal reference line between any two bars and how to easily move the line or vary the length using the mouse. It also discusses creating buttons to initiate these lines and how to force these lines to snap to high or low of bar.
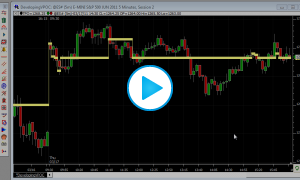
This video demonstrates how to extend time-sensitive prices, such as IB high, until the line is taken out by a future price.
This video demonstrates how to color line and histogram-style indicators different colors based on various conditions.
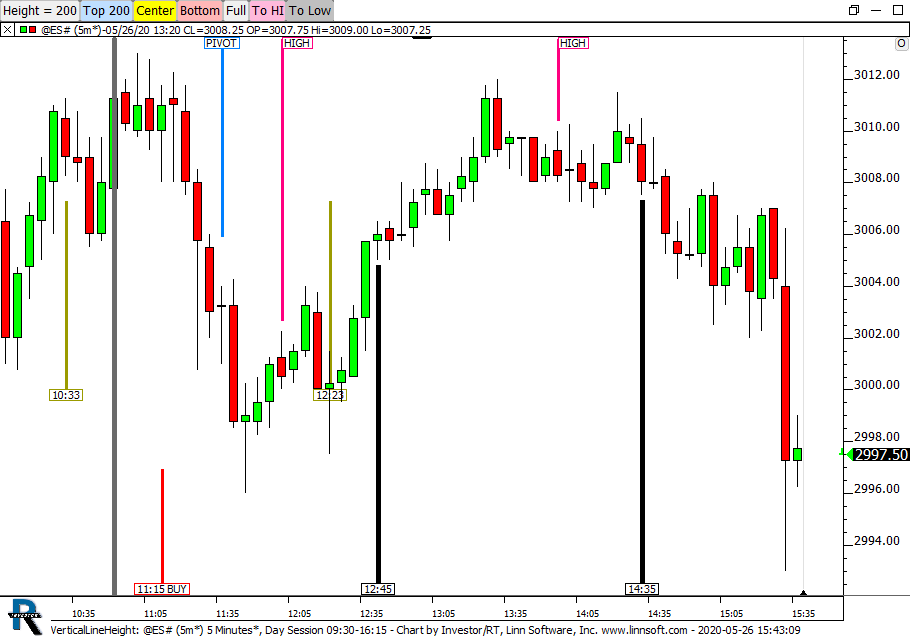
The Vertical Reference Line is a drawing tool that can be used to draw labelled lines at any data/time in the chart. Click on the "Vertical Line" tool on the chart toolbar. Then position the mouse pointer at any time point in the chart window and click. While the vertical line tool is active, the cursor changes to a pencil. Click as many times as you like to add as many vertical reference lines as you wish. To turn off the vertical line tool, click on the "Vertical Line" tool on the chart toolbar again.
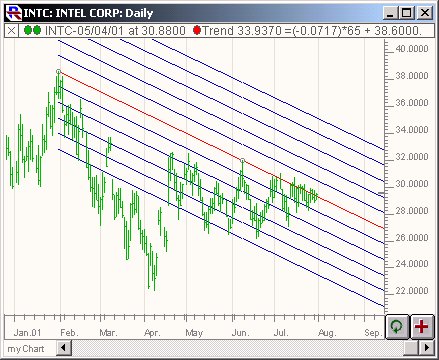
The Trendline Indicator is a tool for drawing lines from a starting price and time to another price and time in the chart. To draw a trend line, activate trend line drawing by depressing the Trend Line Button  in the chart toolbar. The "button" will remain visually depressed to denote that trend line drawing mode has been selected. The cursor changes to a pencil. Position the mouse and press down to start the trend line.
For line graphs, the price used to draw the line may be the open, high, low, last, the median of high and low , or the median of high, low, and last. A continuous line graph is simply a line drawn between each of the price points for the selected price type. A connected line adds dots at each price point. Line graphs may be drawn with one of three line thicknesses and in a user specified color.

This video demonstrates how to hide vertical lines when showing the developing point of control.