Normalized Price
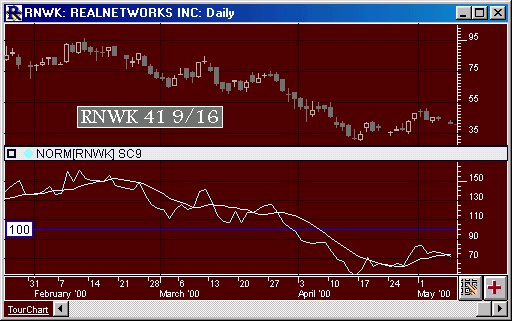
The Normalized Price indicator graphs the price movement of an instrument using 100 as the base value for a user specified base date/time. The normalized value for each bar after the base date/time is the percent of the base price expressed as a whole number. (i.e. 100 times actual price divided by actual base price) This indicator shows the percentage move in price relative to some fixed starting point. For example, if you add this indicator to a daily chart using 12/31/99 as the based date, the indicator line will show you how the issue has performed since the beginning of year 2000.