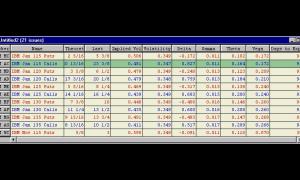
Historical Volatility reflects how far an instruments price has deviated from it's average price(mean) in the past. On a yearly basis, this number represents the one standard deviation % price change expected in the year ahead. In other words if a stock is trading at 100 and has a volatility of 0.20(20%) then there is a 68% probability(1 standard dev = 68% probability) that the price will be in the range 80 to 120 a year from now. Similarly there is a 95% probability that the price will be between 60 and 140 a year from now (2 standard deviations). The higher the volatility number the higher the volatility. Within Investor/RT, there are two methods to choose from when computing volatility: The Close-to-Close Method and the Extreme Value Method. The Close-to-Close Method compares the closing price with the closing price of the previous period, while the Extreme Value Method compare the highs and lows of each period. The method used, along with the number of periods used in the calculation, and the periodicity(duration of each period) may be set by the user in the Options Analysis Preferences.


