Rectangle Drawing Tool
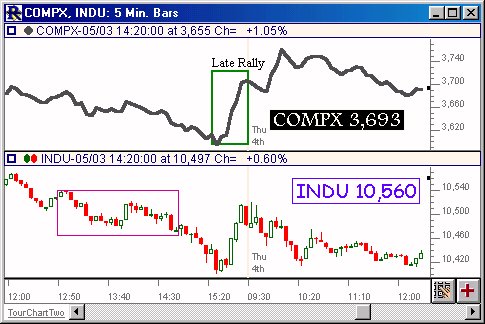
The Rectangle tool is a chart drawing tool used to highlight a user-specified range of time in the chart by enclosing that portion of the chart inside a rectangle. Rectangles may be drawn in chart windows of any periodicity. Activate the rectangle drawing tool by clicking on the rectangle tool in the chart toolbar. Move the mouse pointer into the chart window (the cursor changes to a pencil). Push down the mouse button and drag the mouse to form a rectangle that encompasses the period of time you wish to highlight.