Current Price Highlighter
This video demonstrates how to highlight current price in the scale, and how to draw a dynamically updating line across the chart reflecting the current price, in a multi-pane chart.
This video demonstrates how to highlight current price in the scale, and how to draw a dynamically updating line across the chart reflecting the current price, in a multi-pane chart.
This video demonstrates how to create new sessions with user-specified start and stop times and assign them to symbols.
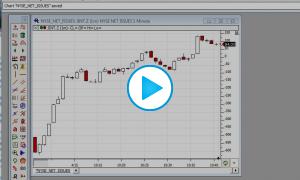
This video not only demonstrates the how to import the adjusted 1-minute ES data, how to link the import process to a keyboard shortcut, and discusses several factors you should be aware of when deciding if this process is right for your need.
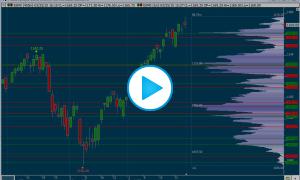
This video demonstrates some new features available to the Profile Indicator including auto-Peak/Valley lines, Naked POCs, and Naked Closes.
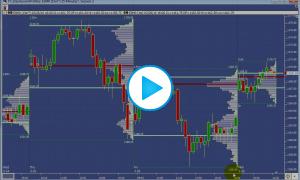
This video shows how to separate the current days volume profile and draw it to the right of the right-most bar.
This video demonstrates how to schedule periodic backfills from DTN MA for symbols which are not supported live with the brokerage feeds.
Major Efficiency improvements were made to the Volume Breakdown and TPO Indicators in version 10.2 Beta 5 as demonstrated in this video.
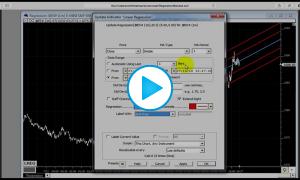
This video demonstrates how to draw regression lines on Investor/RT multi-pane charts.
This video demonstrates how to trigger an audible alert when the developing point of control (DPOC) shifts up or down.
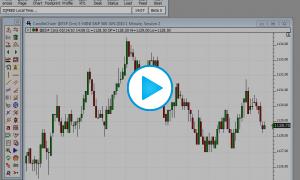
This video demonstrates how to draw a horizontal reference line between any two bars and how to easily move the line or vary the length using the mouse. It also discusses creating buttons to initiate these lines and how to force these lines to snap to high or low of bar.