AvgRangeAtTime (@ES#)
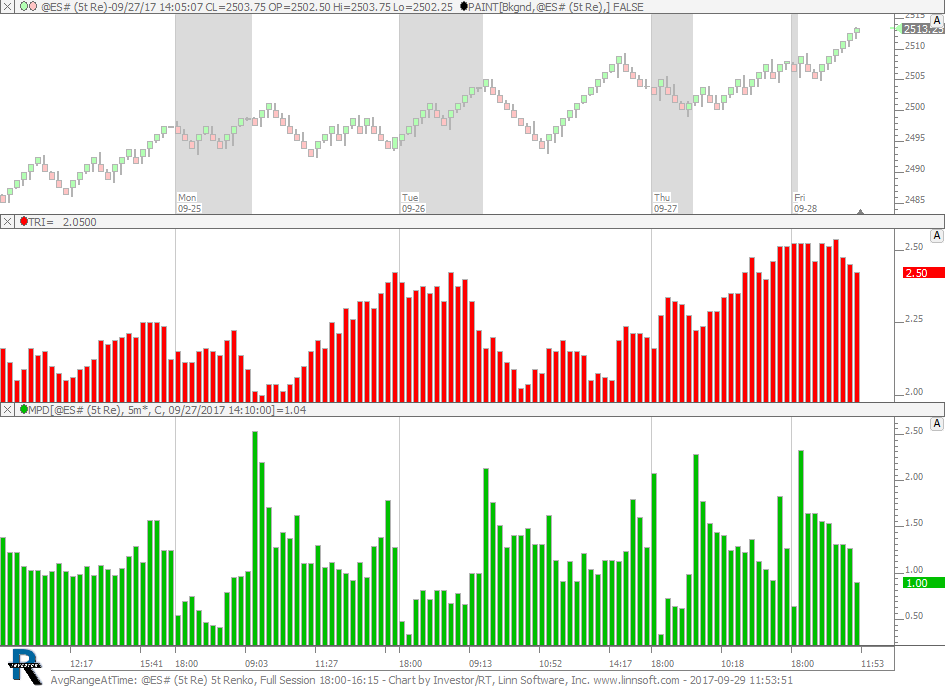
Average Range at Time of Day. This chart is explained in the video Better Volatility. This chart was uploaded by Investor/RT 13.1.1 showing symbol: @ES#.
Average Range at Time of Day. This chart is explained in the video Better Volatility. This chart was uploaded by Investor/RT 13.1.1 showing symbol: @ES#.
This video explains a better method of computing volatility which has several advantages over the more tradition methods such as average true range. This method computes the expected volatility at each bar based on the average range of bars at the same time of day over the previous 20 days. Instead of relying on the previous 20 bars to predict what will happen on the next bar, it uses the same time period over the past 20 days to do so, avoiding the major pitfall of possibly using low range overnight bars to compute volatility of the first bar of the day session or vice versa.
Volatility and Black-Scholes Calculation
See Also... Setting Up an Options QuotePage - Options Analysis Values Defined
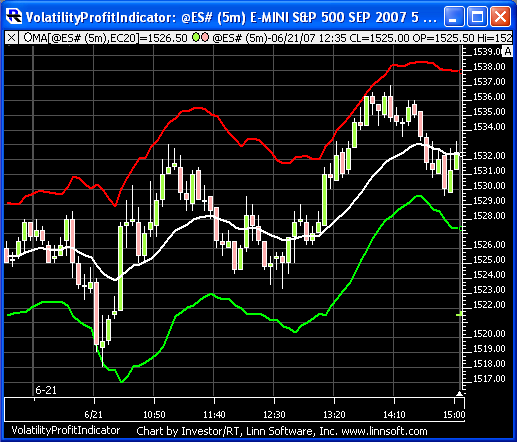
The Volatility Profit Indicator had it's origins in a February 2005 Article in TASC titled "The Truth About Volatility" by Jim Berg. This article was geared toward longer term (weekly) charts, but has been found to work equally well for shorter term trading on intraday charts. The high band is computed by taking a moving average of the highs and adding a multiple of the average true range. The lower band is computed by taking a moving average of the lows and subtracting a multiple of the average true range.