volume

3 posts / 0 new
Last post
Epicuros901
Last seen: 2 months 3 weeks ago
Joined: 08/18/2017 - 09:02
Comparing current volume to previous day

Hello,

I am new to IRT and very happy so far. I am currently retooling various indicators I coded for TOS using Thinkscript and have had great success except for one so far. I searched through the RTL reference pages and forums but could not quite find the solution.

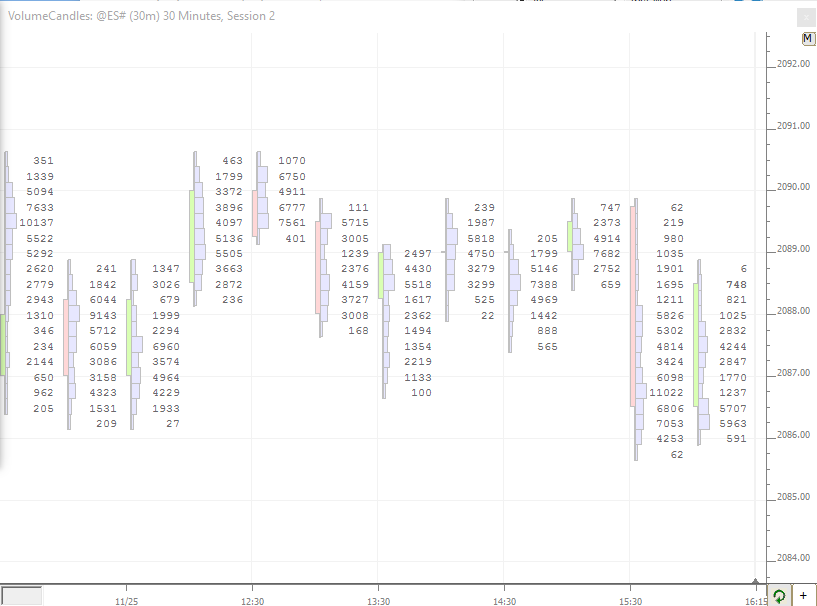
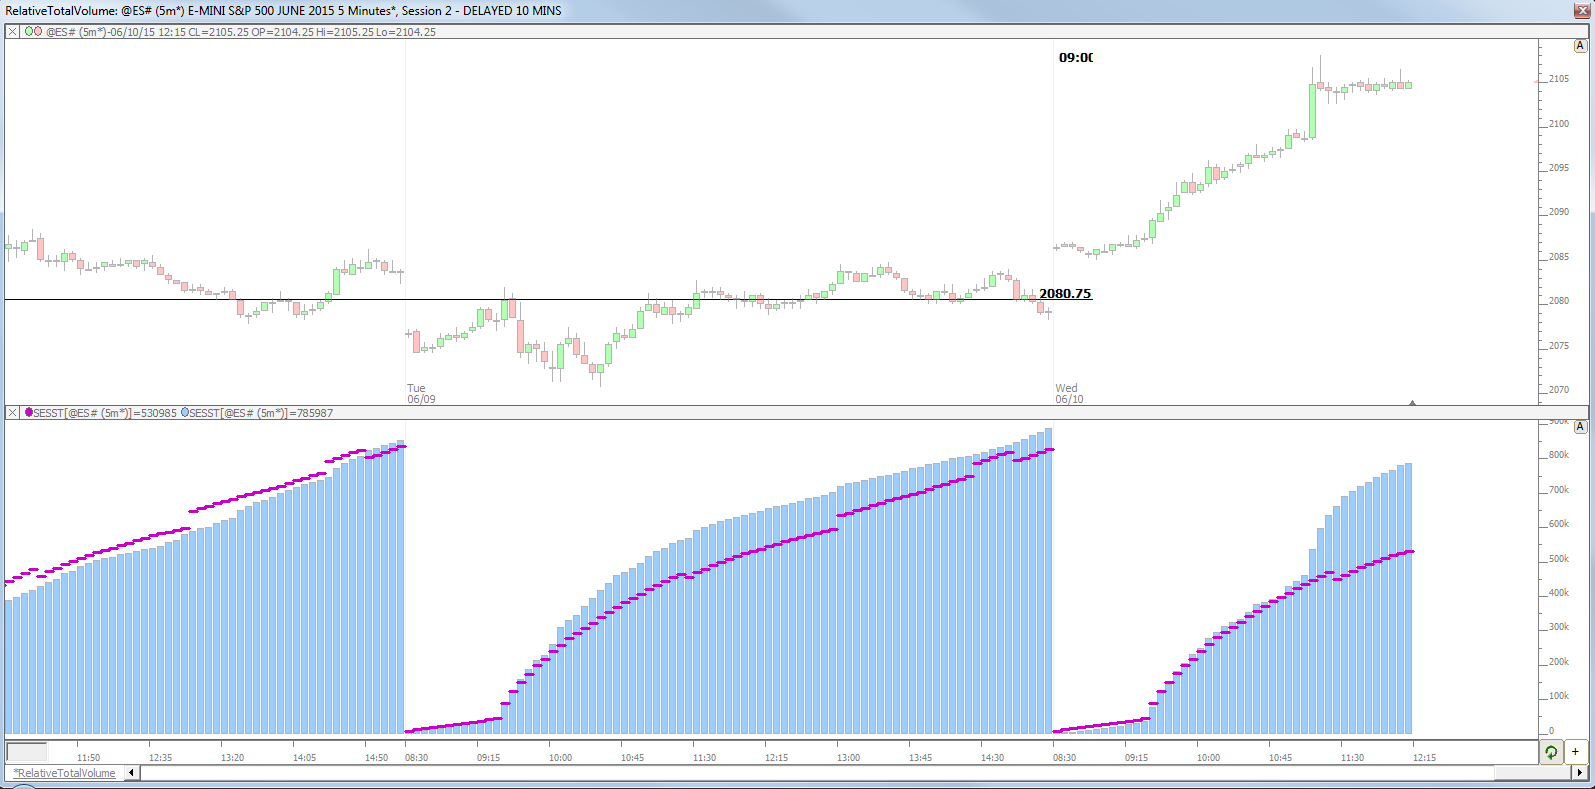
I am hoping to continuously compare the current volume total of today's session to the volume total of the previous session at the same time. So, if volume in the ES were 100k at 10:00am today I would like to know how much this differs from the volume of the previous session at 10:00am.

Volume Filtering: Studying Behavior of Large vs Small Trades

Volume Filtering

This video introduces the ability to add a trade size volume filter to any instrument in any multi-pane chart. This feature enables users to easily do comparative analysis of the volume behavior of large traders versus small traders. This volume filtering can feed and add value to a number of indicators including Zig Zag. Zig Zag Oscillator, Profile Indicator, Volume Breakdown, Bar Statistics, Price Statistics, VWAP, Volume Price Statistics, TPO Indicator, Multiple Price Highlighter, Volume Candles, Trade Dots, Buy Sell Meter, and many more.

MicroComposite Volume Profiles on Daily Charts

MicroComposite Volume Profiles on Daily Charts

This video demonstrates how to quickly and easily draw volume profiles on daily charts. It explains the importance of setting the periodicity of the chart to "Time Per Bar: 1 Day" in order for the Volume Profile to access the required intraday data.

Volume Candles (RTX) Introduction

Volume Candles (RTX)

The Volume Candles RTX extension draws a candle, volume profile, and volume as text, for each bar, making efficient use of the horizontal space available for each bar. It is recommended to set the drawing style of the instrument to "Invisible" and then add the VolumeCandles to the instrument pane to replace the bars. Each of the 3 elements is optional, giving users the ability to plot candles with volume profiles, volumes with volume as text, etc. User must ensure there is enough room vertically and horizontally to properly display elements.

Volume Candles (RTX)

Volume Candles draws a candle, volume profile, and volume as text, for each bar, making efficient use of the horizontal space available for each bar.  It is recommended to set the drawing style of the instrument to "Invisible" and then add the VolumeCandles to the instrument pane to replace the bars.  Each of the 3 elements is optional, giving users the ability to plot candles with volume profiles, volumes with volume as text, etc.  User must ensure there is enough room vertically and horizontally to properly display elements.  To create more horizontal space, use the mouse scrollbar (or up/down arrow keys on keyboard).  To create more vertical space, use the mouse scrollbar while holding down the shift key.

Point and Figure Highs and Lows - Missing Volume

Point and Figure Highs and Lows - Missing Volume

This video explains how point and figure bars are formed and why volume is often missing at the high or low prices of PNF bars (ghost or phantom prices). It also explains how to set a configuration variable, PnfConventionalHighLows, to FALSE, to avoid this situation.