zig zag

1 post / 0 new
cpayne
Last seen: 1 year 4 weeks ago
Joined: 03/30/2009 - 00:00
Zig Zag Volume Value/Labels Explained

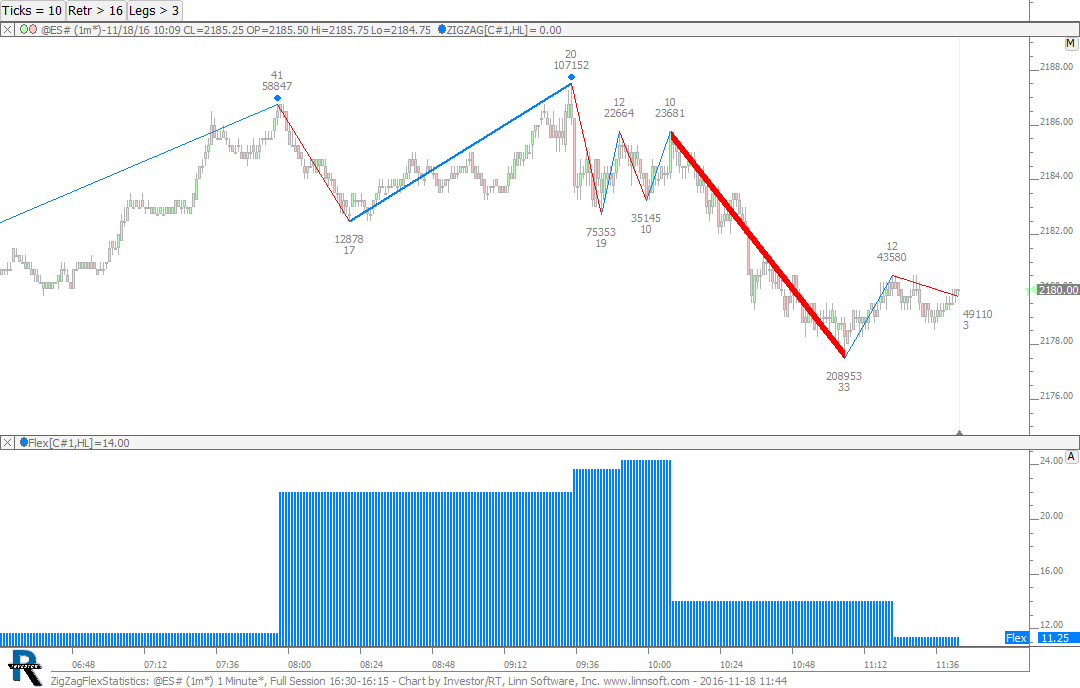
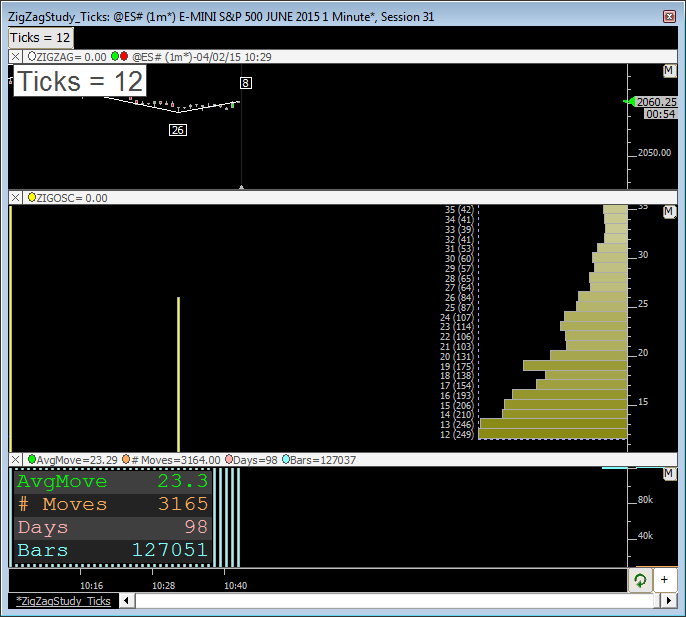
The Zig Zag, and Zig Zag Oscillator indicators, have various options to display the volume of each leg including those seen below...

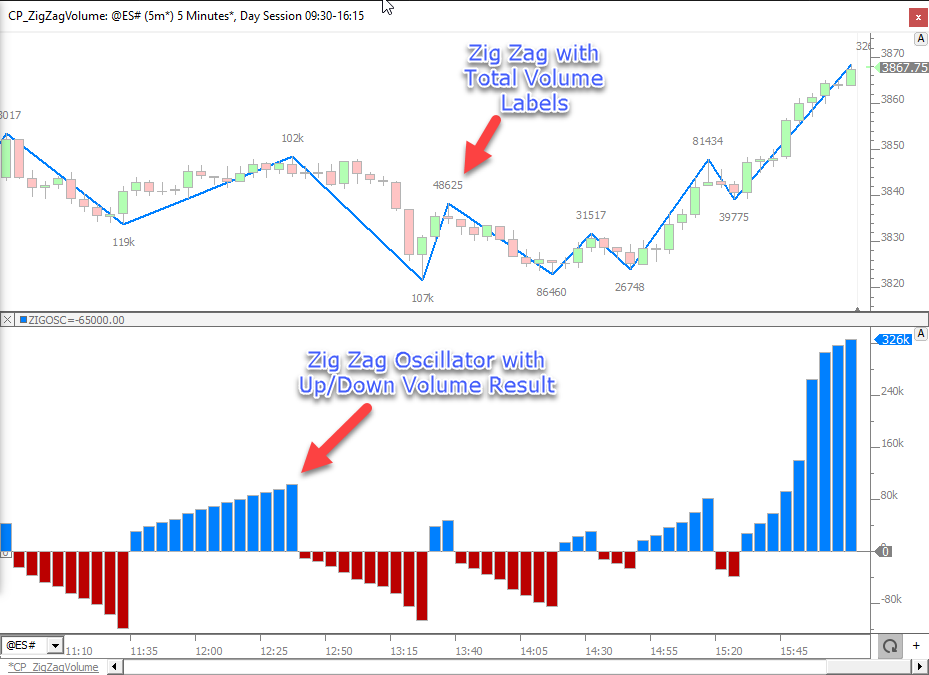
In the upper pane, the Zig Zag indicator labels the legs with "Total Volume" of each leg.  In the lower pane, the Zig Zag Oscillator is showing the Up/Down Volume result.

PaintZigZag (RTX)

PaintZigZag

The PaintZigZag (PZZ) RTX Extension paints the legs of the Zig Zag indicator based on a number criteria of each leg or even each bar. PZZ provides up to 6 paint criteria with each criteria having a unique color and width. PZZ can paint each leg based on conditions such as: up sloping vs down sloping, leg volume > 50,000, leg delta > 12,000, leg move > 35 ticks. Or PZZ can individually paint each bar within each leg based on a bar by bar condition which can be provided via a signal: up bar vs down bar, bar volume > 5000, bar delta > 3500, CCI > 100 vs CCI < -100, etc.

PaintZigZag (RTX)

The PaintZigZag (PZZ) RTX Extension paints the legs of the Zig Zag indicator based on a number criteria of each leg or each bar.

Zig Zag 12.7: Equi-Zig and Delta/Volume Shading

This video highlights some exciting new visual presentation options available to the Zig Zag Indicator: Equi-Zig, Delta Shading, and Volume Shading. The Equi-Zig option draws each leg of the Zig Zag in a variable width reflective of the volume of the leg. The Delta and Volume Shading colors each leg with a shade reflective of the magnitude of the delta or volume respectively. With Equi-ZIg, the user may choose the maximum width in pixels; each leg is drawn with a width that is a percentage of that max width.

Zig Zag Periodicity

Zig Zag Periodicity

A periodicity named Zig Zag has been added. The magnitude of the periodicity is supplied in ticks. Bar formation operates on the same principles as the Zig Zag indicator. Each bar represents a market move of at least the user specified magnitude. Each bar is an accumulation of the data of a market move. Zig Zag bars are unique in several ways. Each bar opens on one extreme and closes on the other extreme, thus there are no wicks. Also, not only does the last bar change with price movement, but the next to last bar can also change.

Using Zig Zag Oscillator in RTL

Using Zig Zag Oscillator in RTL

This video demonstrates how to manage the usage of the forward-looking Zig Zag Oscillator within a Custom Indicator or Signal Marker. The Zig Zag Oscillator is unique in that it is a forward looking indicator, and as such, past values can change based on future price movement. Due to this forward-looking nature, when the ZZO token is used within RTL, special consideration must be made to accommodate the addition of any Custom Indicators or Signals that contain ZZO when adding to a chart. This video describes how to setup such Custom Indicators or Signal.

ZigZagStudy_Ticks

This chart is documented in the Profiles On Indicators article. This chart profiles the significant moves identified by the Zig Zag indicator and produces data such as the number of moves and average move. A button is available to allow easy adjustment to the minimum price change (in ticks).

12.2 Beta Zig Zag Issue Fixed in Beta 6

There is an issue with the Zig Zag Indicator in 12.2 Beta 4 and Beta 5 that has been corrected in 12.2 Beta 6.  In Beta 4 and Beta 5, a new "Minimum Price Change" option was added titled "Fractals" which enables Zig Zag to match the Fractals Indicator (see below).  However, when upgrading to Beta 4 or Beta 5, some existing Zig Zag indicators will automatically turn this new option on, forcing existing Zig Zags based on "Bars, $, %, or Ticks" to now use "Fractals" instead.  When you install Beta 6, Investor/RT will restore all Zig Zags to their pre