The combination of the Profile Indicator and Multi-Pane Charts provides much of the functionality available to standalone TPO Charts, along with a whole world of new functionality that TPO Charts are missing. The primary missing component is the absence of letters, but we will explore some alterntives to that during this article.
The list of benefits when implementing TPO Profiling via the Profile Indicator in Multi-Pane charts is very long, but I'll mention a few here:
- There is no limitation to the number of profiles you can plot in multi-pane charts. You can plot profiles as far back as your data goes (1000s of days). Standalone TPO Charts are limited to 119 profiles.
- Multi-Pane charts have a libraray of over 200 indicators and drawing tools available, in addition to Signal Markers, Custom Indicators (RTL) and RTX extensions. All of these can be overlaid or drawn right on the profiles. These indicators and tools cannot be used in TPO Charts.
- In short, the vast majority of Linn Software's development resources have been devoted to Multi-Pane charts over the past 20 years. The amount of functionaily and flexibility available to multi-pane charts is hard to capture in a list.
What you might miss from standalone TPO Charts
- Letters - While the Profile Indicator does not provide the option of drawing each TPO as a letter, it does provide the same shape as the TPO Charts which is the most important aspect. Also, the 30 minute bars are right behind the profile which makes it clear where price traded during each 30 minute period. So all of the information is there. And it is possible to label bars in various ways with letter if desired. We'll cover that as we continue with this tip.
- Profile Splitting/Merging - While the Profile Indicator does not specifically allow splitting or merging of profiles, it does allow users to quickly and easily draw a profile for any period of time by dragging a rectangle over that period. A button can be placed at the top of the chart. Click the button and drag a profile over any period and a profile will be representing that period and overlaying that period. We'll also cover this going forward.
This article will continue to expand based on user feedback. If you're looking to to something specific in your chart that we haven't covered in this article, please open a support ticket and let us know what it is (reference this article/tip). We will append instructions to this tip.
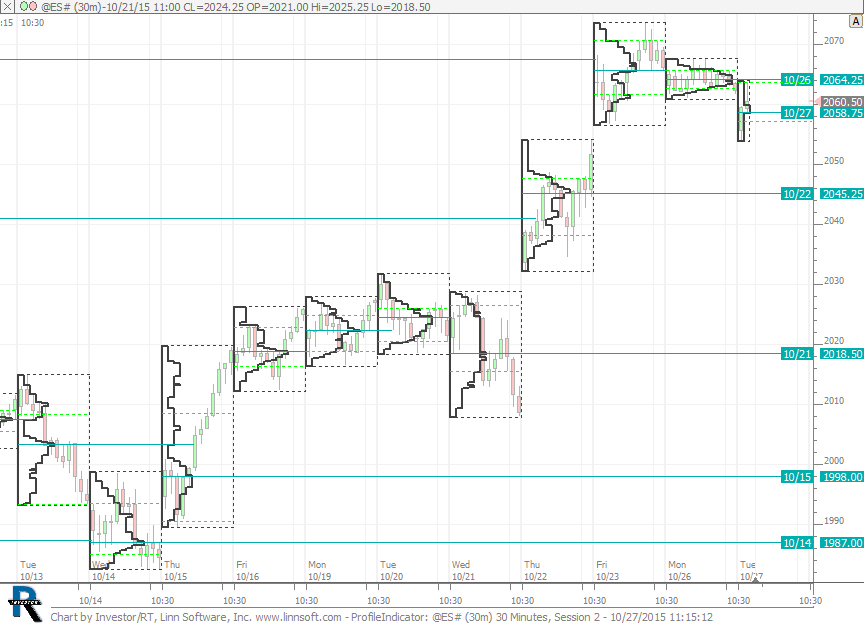
We'll start with a simple chart with one instance of the Profile Indicator setup to show time-based (TPO) profiles and extending naked POCs. Chart definition available below chart.
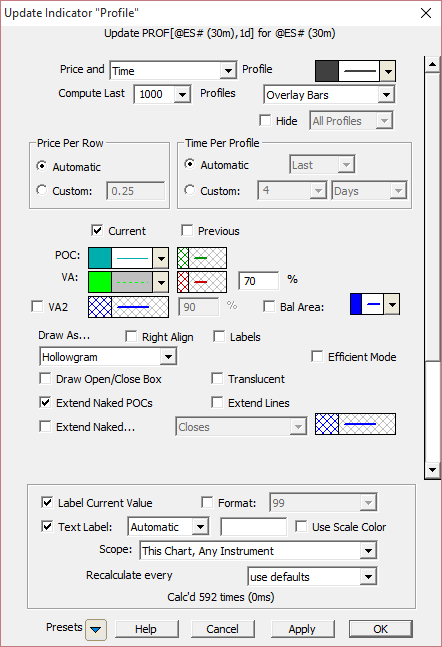
The Profile Indicator settings can be seen below. Notice the "Price and Time" settings (instead of Volume). When "Time" is chosen, the profiles will be developed just like TPO Profile charts, using each bar as a TPO. In this case, our chart is set to a periodicity of 30minutes so we have 30 min TPOs. If you prefer 10 minute TPOs, simply change the periodicity of the chart to 10 minutes, but TPOs can be based on any periodicity including volume bars, tick bars, renko bars, etc. Also notice the time per profile is set to "Automatic" which results in one profile per day/session. There are many options with respect to profile duration including options to split the session into day and overnight, weekly profiles, monthly profiles, minute profiles, and much more.
For further customization of such TPO profiles :
The Colors indicator is designed to feed the Profiles Indicator custom colors and/or custom letters for TPOs.
https://www.linnsoft.com/videos/colors-rtx-introduction
The Boundaries indicator allows you to easily split and/or merge TPOs and create any kind of microcomposite profile
Check this chart (and the attached video) for a demonstration of such flexibility
https://www.linnsoft.com/charts/cp-ap-dailytpovolprofiles-es
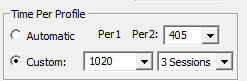
Split Profiles: The image below shows how to setup the Time Per Profile to split the overnight and day session. Note that this works for a chart set to the Globex session (31) set to 4:30pm ET to 4:15pm ET. Such a session has 1435 minutes, with 1020 minutes in the overnight session, and 405 minutes in the day session. You'll need to adjust your numbers accordingly for different session times.
And if you prefer to only plot the day session profiles on a Globex (session 31) chart, then check the "2nd session only" checkbox below the Time Per Profile option. Notice, you can keep these time per profile settings, and switch chart easily between session 2 and session 31, and these settings will work properly for both sessions. Users may change session easily using the comma key on keyboard or adding a button indicator to chart with purpose "Change Session".
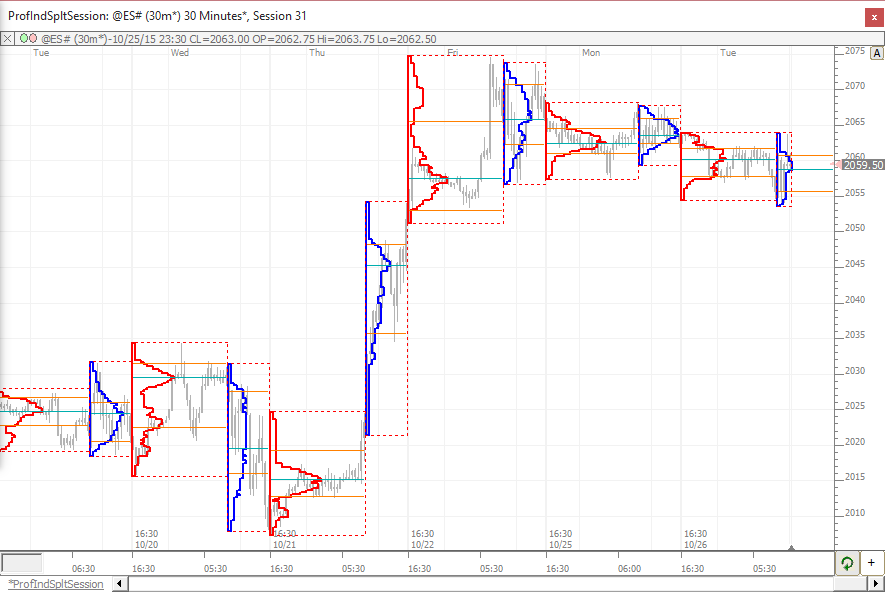
Below is a chart along with definition showing the split session profiles. Notice the overnight and day profiles have their own unique colors (specified in upper right corner of Profile Indicator Preferences).
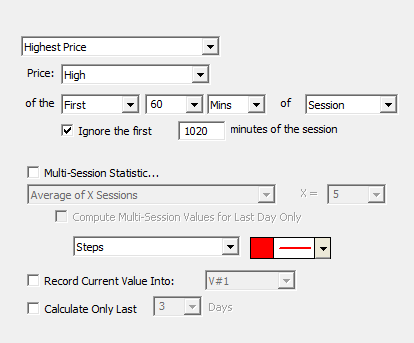
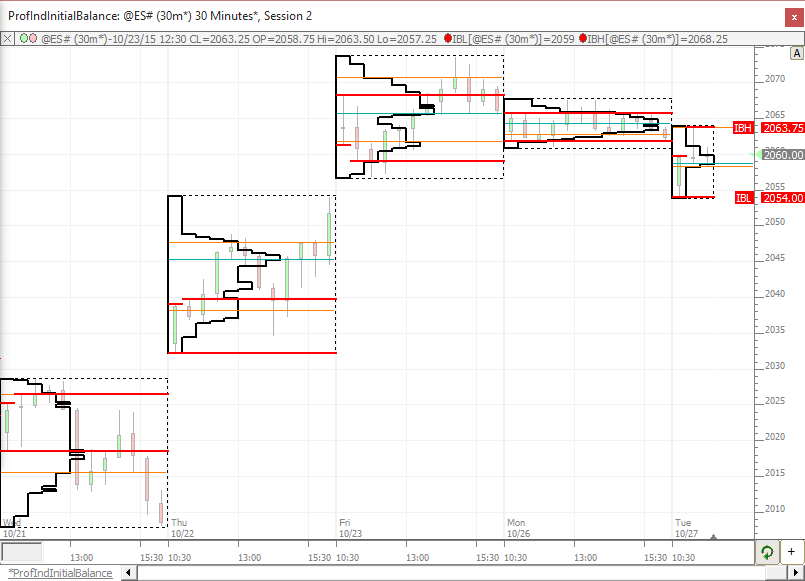
Initial Balance: Initial Balance is an important feature for traditional Market Profilists. Adding Initial Balance to our charts is easy with the Session Statistics Indicator. Simply setup SESST with "Highest High of 1st 60 Minutes of Session" to get IBH. If you're adding to session 31 chart, you'll need to check "Ignore first 1020 minutes of the session" (Adjusted for your times if needed). Session Statistics preferences for IBH below along with chart image and definition which includes IBH and IBL below.