To plot the overnight high and/or low on a day session chart (of any periodicity), you'll use a combination of Mixed Periodicity Data (MPD) and Session Statistics (SESST). MPD will allow you to mix sessions so you can access the full session (31) data and then SESST can take that data and compute the high and low of the overnight period. So add MPD to the chart, with these settings:
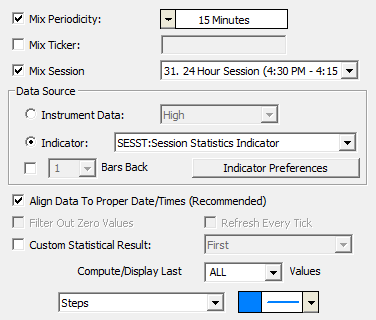
Note the mixed periodicity is set to 15 minutes, and the mix session is set to session 31 (full globex session). And Indicator is set to Session Statistics. And if we click the Indicator Preferences button, we get these SESST settings:
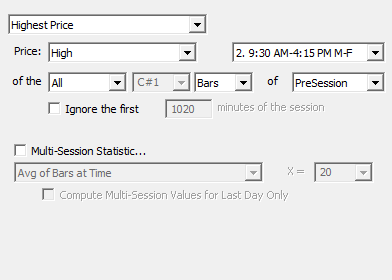
Which grabs the high of the overnight period (all data before the day session 2). To get the low, you'd follow the same sequence except choose Lowest Price: Low in the SESST preferences.
Note: MPD is the indicator which presents the overnight high and low. SESST is used within MPD (embedded within it). So to access the overnight high and low, you add MPD to the chart (or use it within the syntax of an RTL object), and then simply use SESST as the data source / indicator within the MPD settings. And furthermore, click the Indicator Preferences button within MPD to specify the proper SESST settings (seen above).
Why do we need to use MPD here and not just SESST alone? All indicators by default operate on the data in the chart. If the chart is set to day session (2), then the indicator (SESST) does not have access to the overnight data in order to compute the overnight high and low. MPD is a special indicator which loads data which can have any combiation of a different periodicity, different session, and even different symbol, from what is in the chart. Initially MPD only mixed periodicity, thus the name, but over time it grew into much more. So the MPD indicator is used to load the full globex session (31) data, and then SESST operates upon that to compute the high and low of only the overnight period. Within SESST, we instruct it to get the highest high, and lowest low, of all data of the "presession" with session 2 (day session) selected. That will gives us the high and low of all the data BEFORE (pre) that day session (thus giving us the overnight high and low). Another alternative would be to setup SESST to highest high / lowest low of the 1st 1020 minutes of the session (or how ever many minutes in the overnight session). But that method is less reliable because the number of minutes in overnight session can differ between users based on what time they set their globes session (31) to begin.
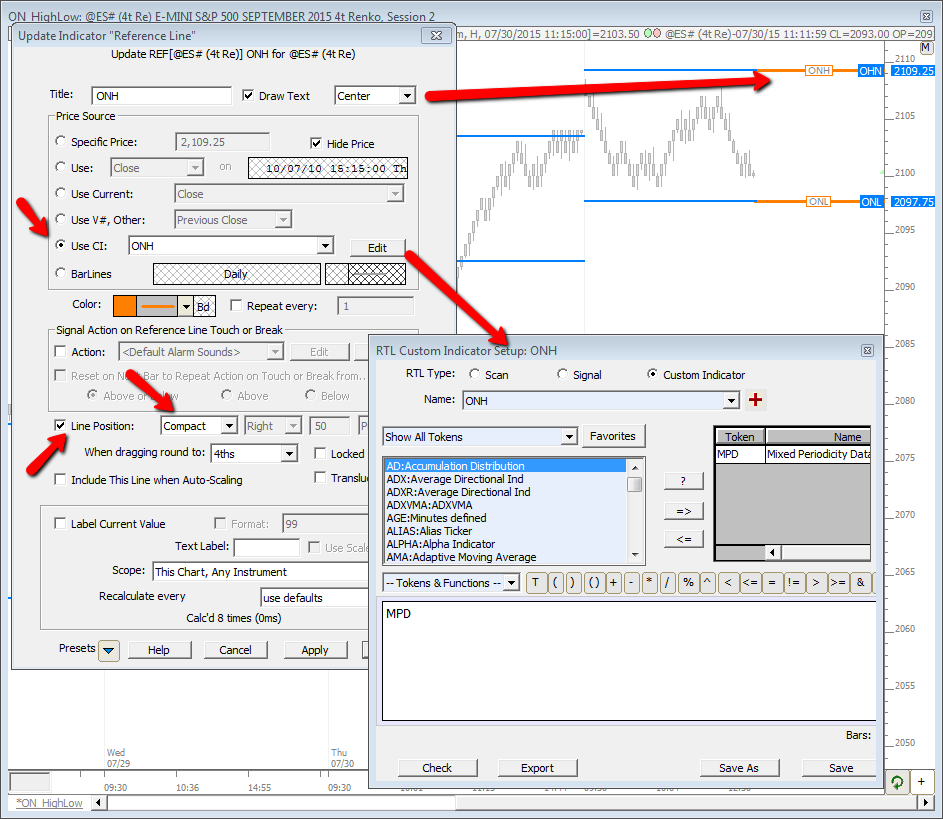
How can I plot the ONH and ONL as compact lines? Simply create custom indicators, one for ONH and one for ONL. The sytnax for both would simply be MPD, with proper setup of preferences accordingly. Then add Reference Lines for each to the chart which "Use CI" and are setup as Compact. The image below tells the story, and this chart definition includes both the historical lines (blue) and the compact lines (orange). You can drag and drop either or both from this chart to another chart after importing. Remember you can right-click on these lines and "Bring to Front" or "Send to Back" if needed.