 |
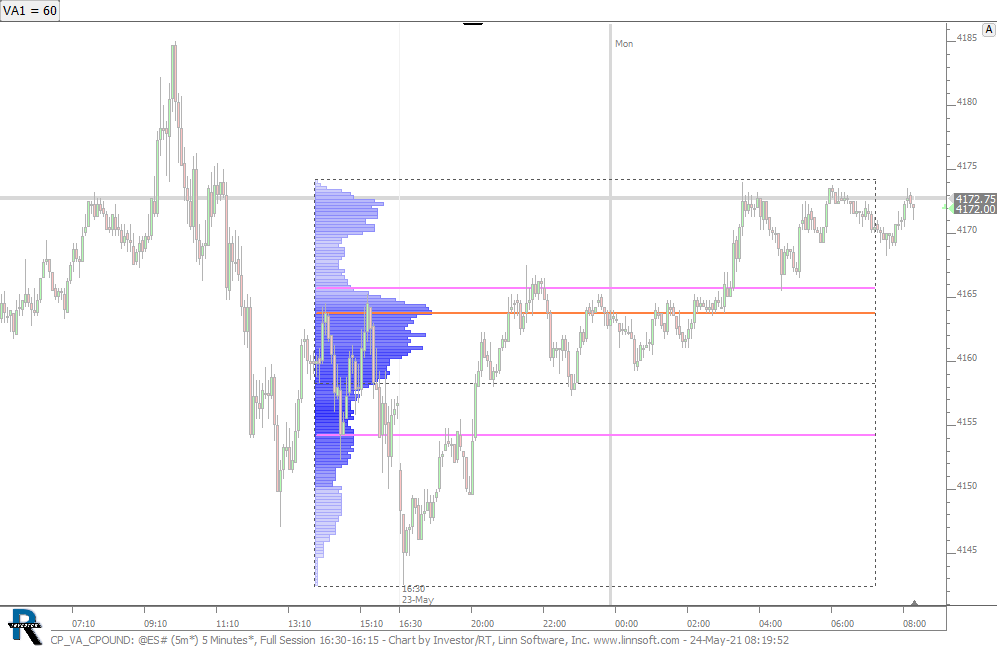
CP VA CPOUND (@ES#) cpayne [totalcount]
5 years 1 month ago
This chart was uploaded by Investor/RT 14.2.7 showing symbol: @ES#. |
View |
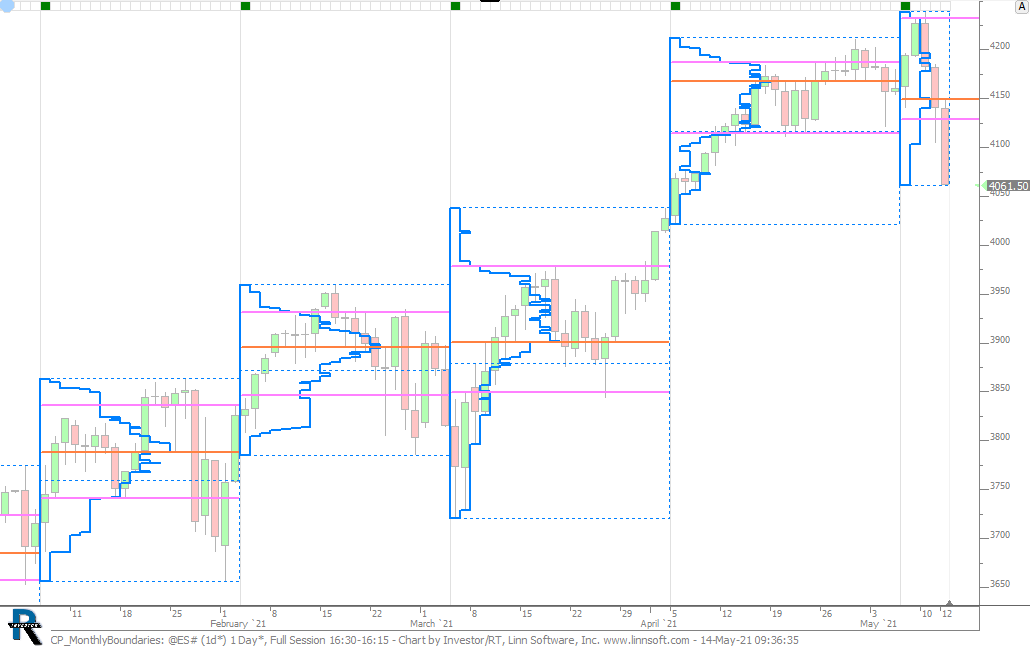 |
CP MonthlyBoundaries (@ES#) cpayne [totalcount]
5 years 2 months ago
Monthly profiles linked to boundaries. This chart was uploaded by Investor/RT 14.2.7 showing symbol: @ES#. |
View |
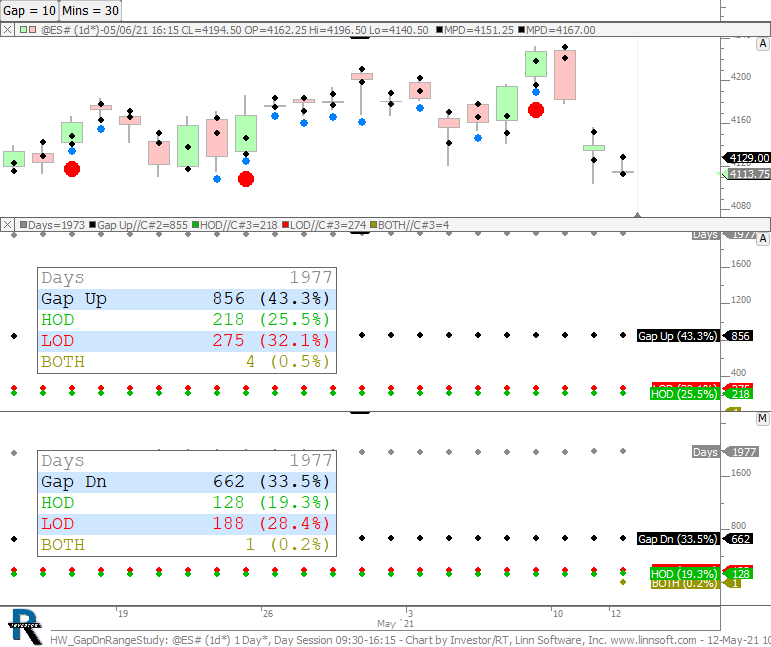 |
HW GapDnRangeStudy (@ES#) cpayne [totalcount]
5 years 2 months ago
Gap Up and Gap Down Days. How often is the HOD and LOD created in first X minutes on days that gap up or down. Gap (in ticks) and X Minutes both controlled by buttons at top. |
View |
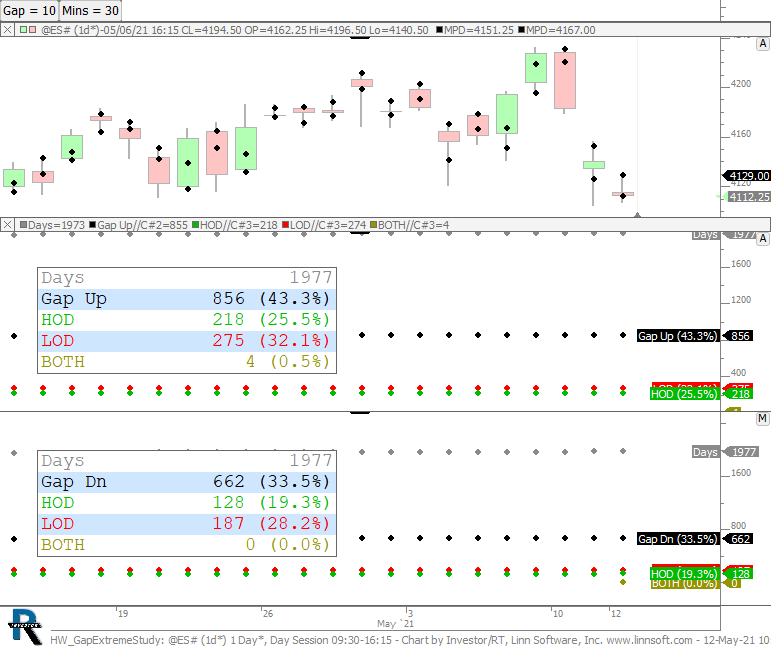 |
HW GapExtremeStudy (@ES#) cpayne [totalcount]
5 years 2 months ago
Gap Up and Gap Down Days. How often is the HOD and LOD created in first X minutes on days that gap up or down. Gap (in ticks) and X Minutes both controlled by buttons at top. |
View |
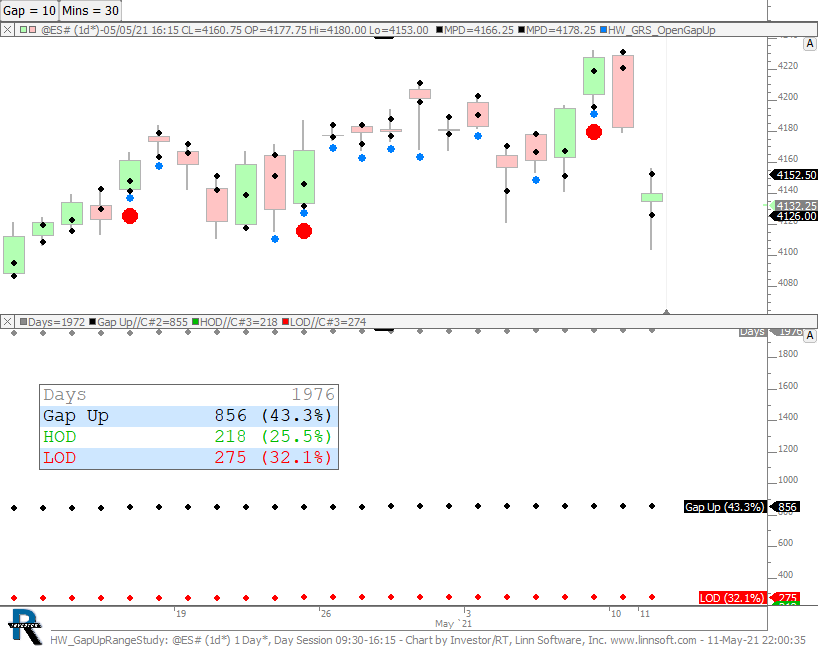 |
HW GapUpRangeStudy (@ES#) cpayne [totalcount]
5 years 2 months ago
This chart was uploaded by Investor/RT 14.2.6 showing symbol: @ES#. |
View |
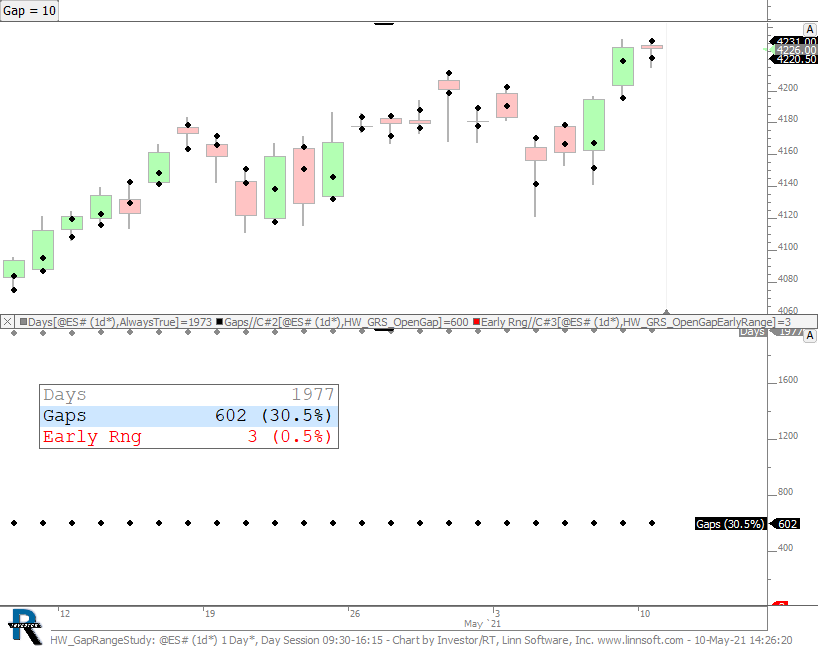 |
HW GapRangeStudy (@ES#) cpayne [totalcount]
5 years 2 months ago
Homework - Open Gap days and how often they result in range being established in first 30 minutes. This chart was uploaded by Investor/RT 14.2.6 showing symbol: @ES#. |
View |
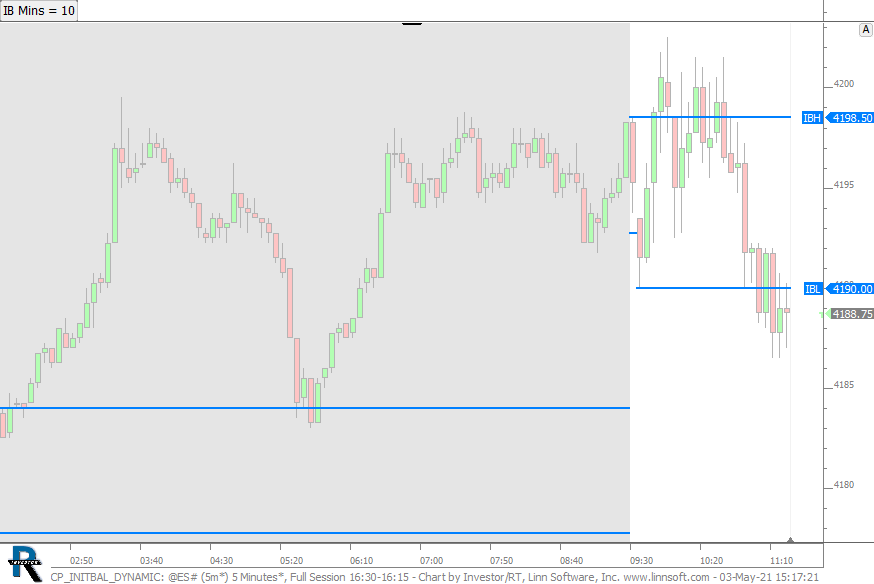 |
CP INITBAL DYNAMIC (@ES#) cpayne [totalcount]
5 years 2 months ago
Dynamic Initial Balance for any duration (in minutes) controlled by button. Works on chart of any session and any periodicity. |
View |
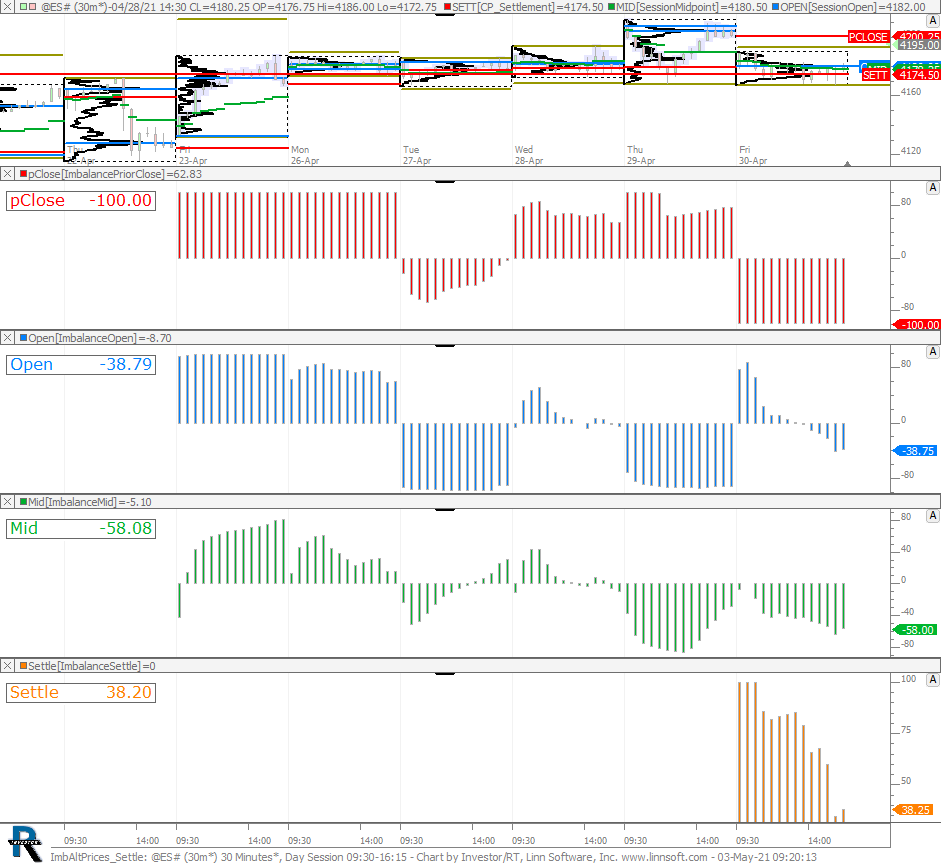 |
ImbAltPrices Settle (@ES#) cpayne [totalcount]
5 years 2 months ago
This chart was uploaded by Investor/RT 14.2.6 showing symbol: @ES#. |
View |
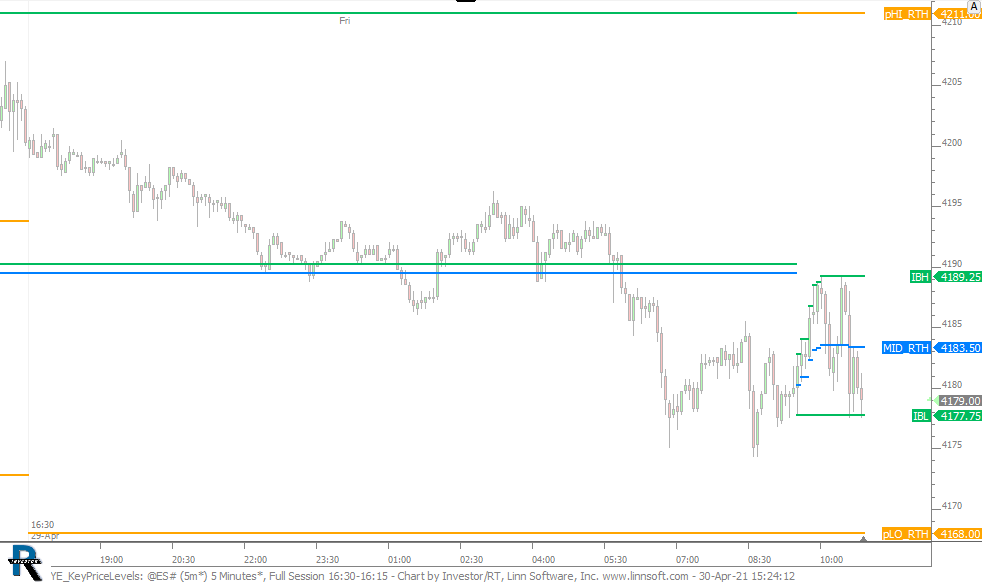 |
YE KeyPriceLevels (@ES#) cpayne [totalcount]
5 years 2 months ago
This chart was uploaded by Investor/RT 14.2.6 showing symbol: @ES#. |
View |
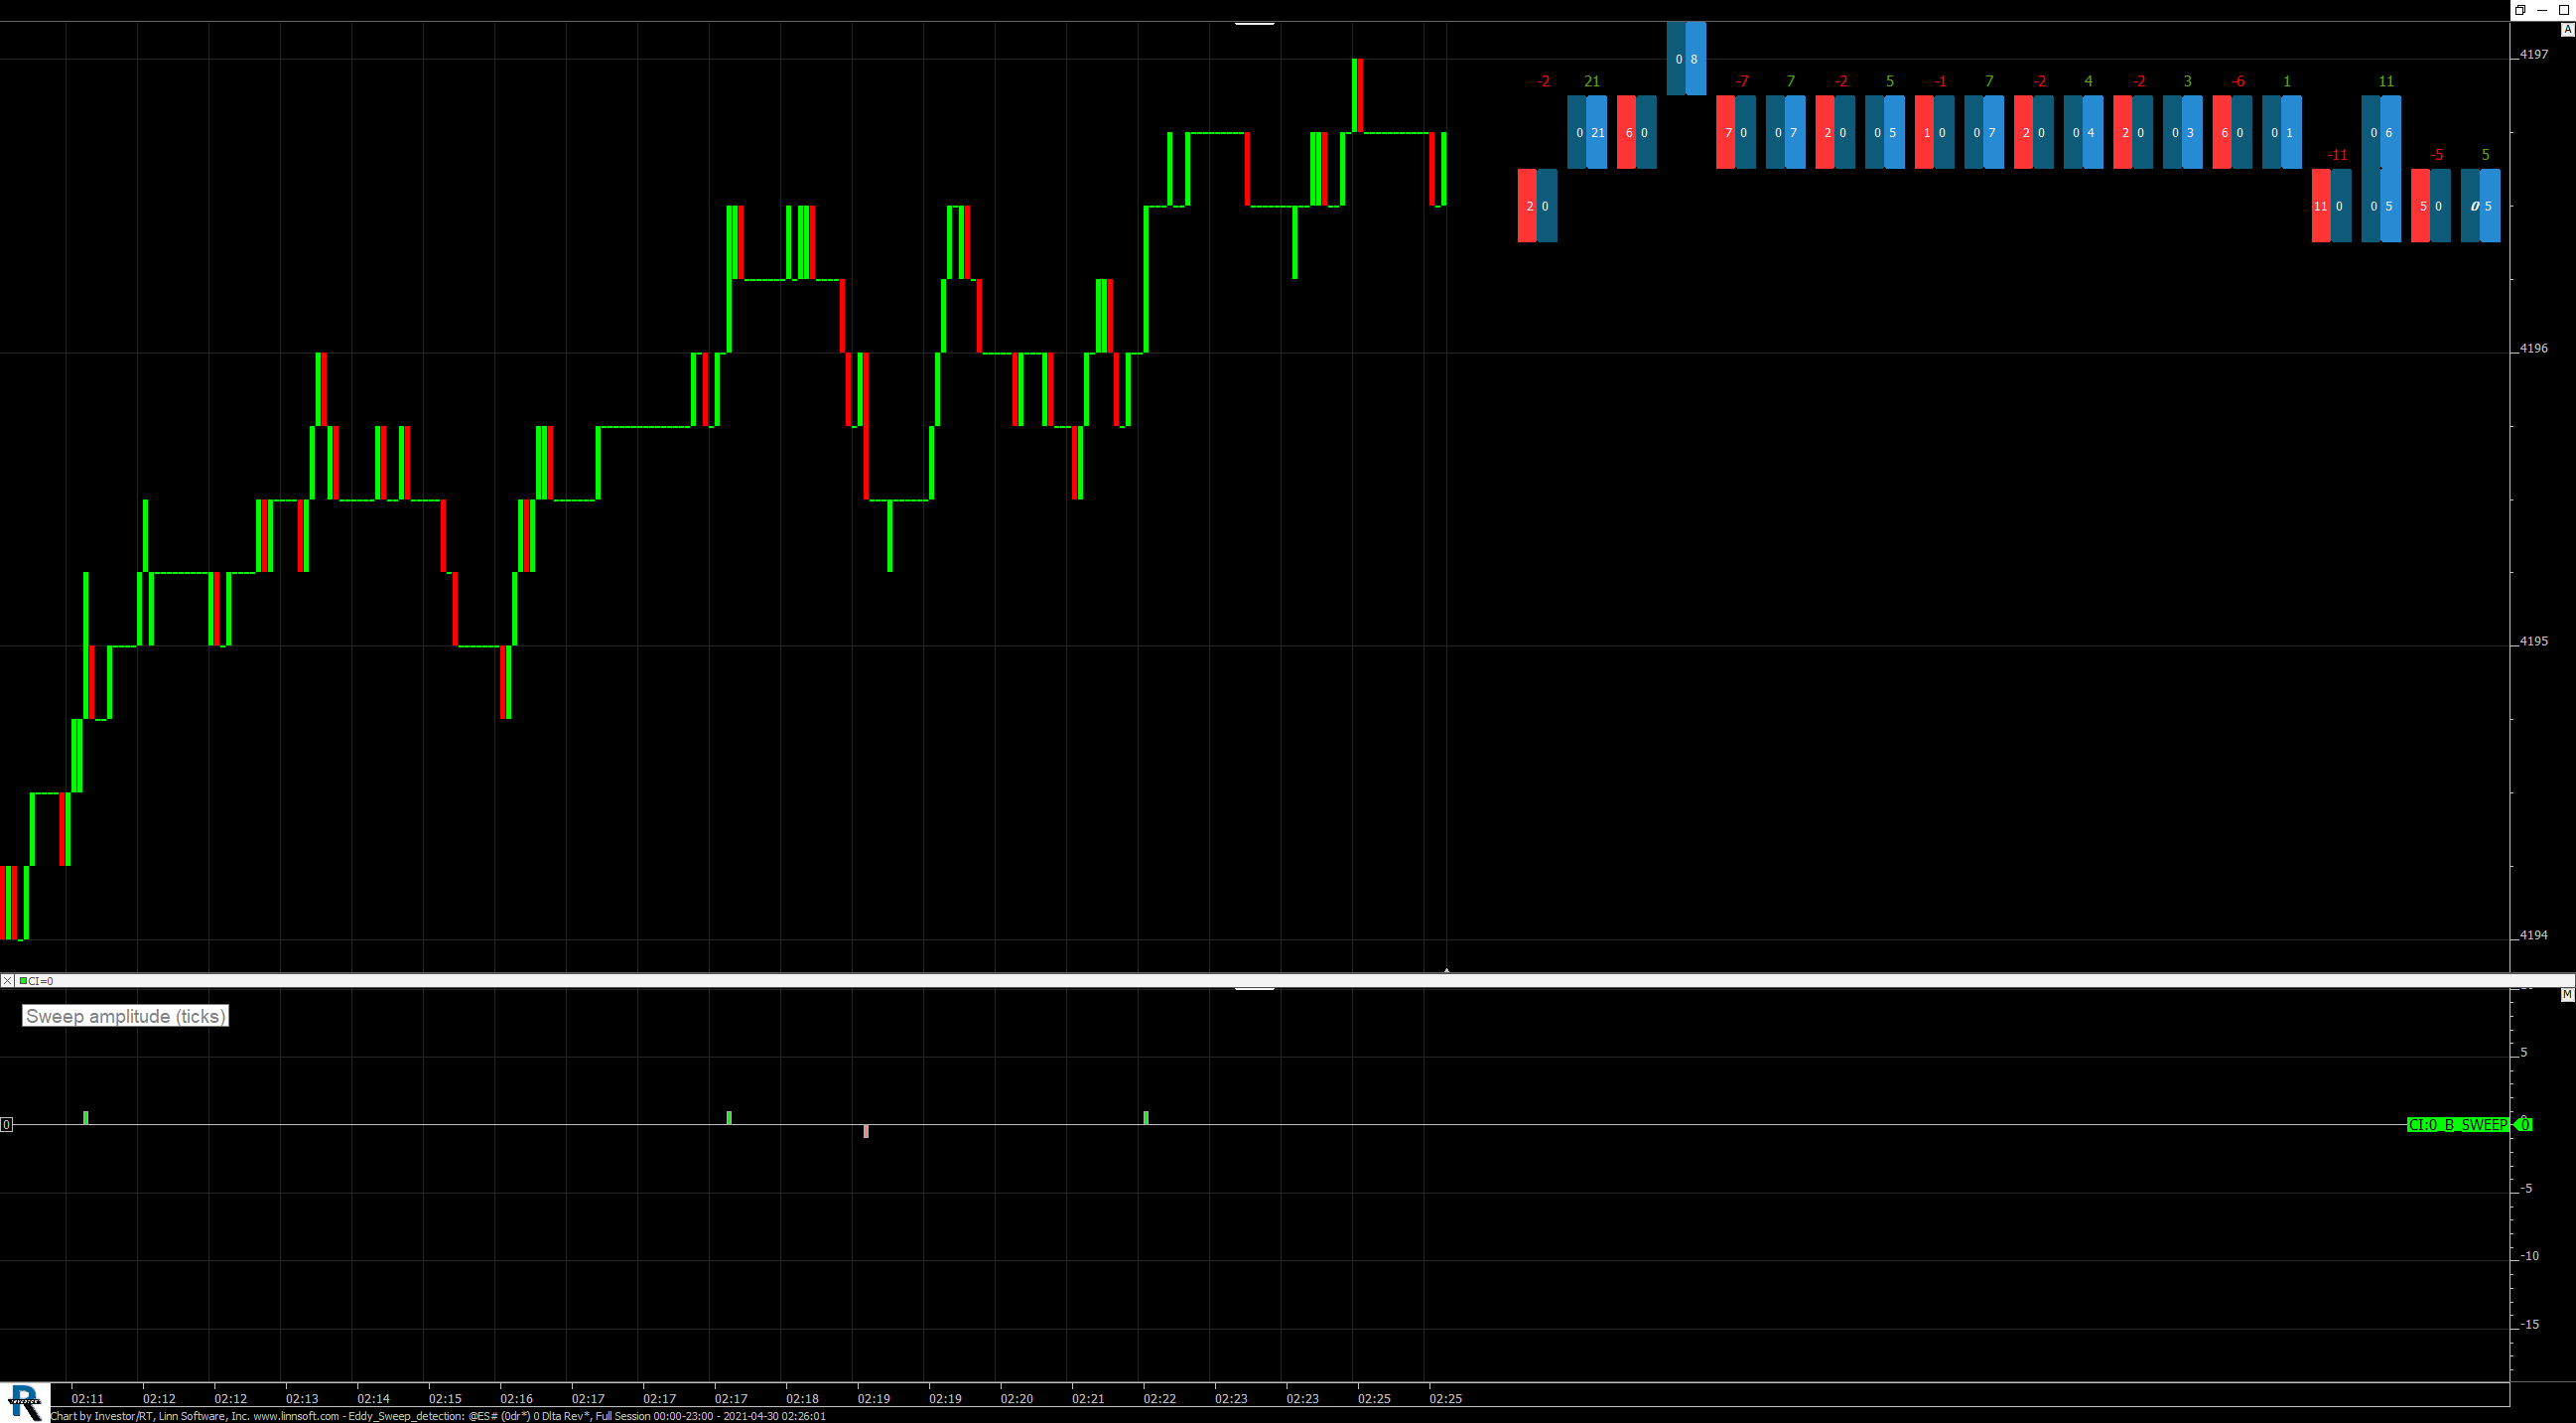 |
Eddy Sweep detection (@ES#) Eddy_F [totalcount]
5 years 2 months ago
Basic sweep detection chart using the 0 tick delta reversal periodicity (one bar keeps building as long as trades are done at the BID/resp ASK prices). |
View |
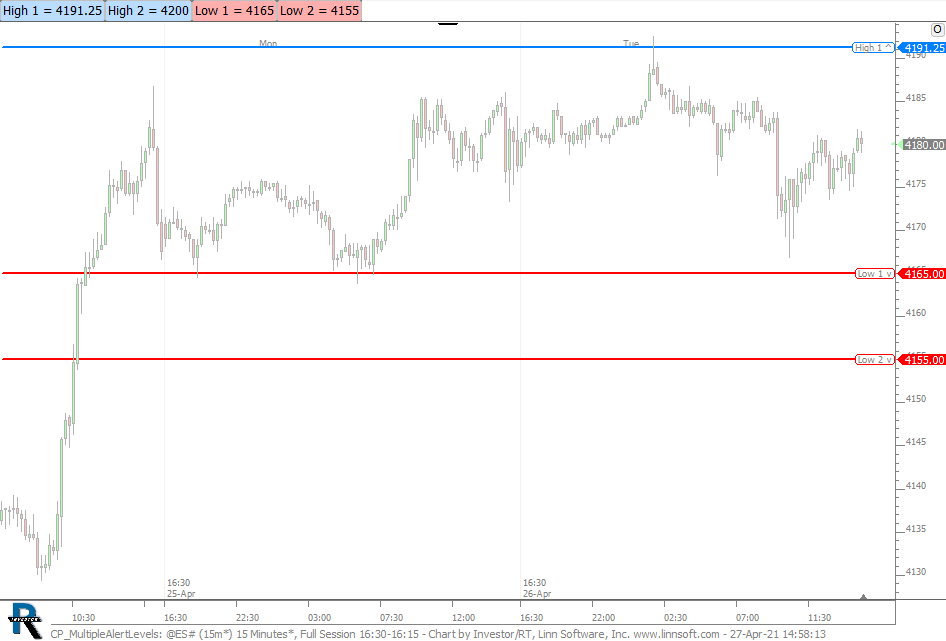 |
CP MultipleAlertLevels (@ES#) cpayne [totalcount]
5 years 2 months ago
Adding Multple High and Low Price Alarms. This chart was uploaded by Investor/RT 14.2.6 showing symbol: @ES#. |
View |
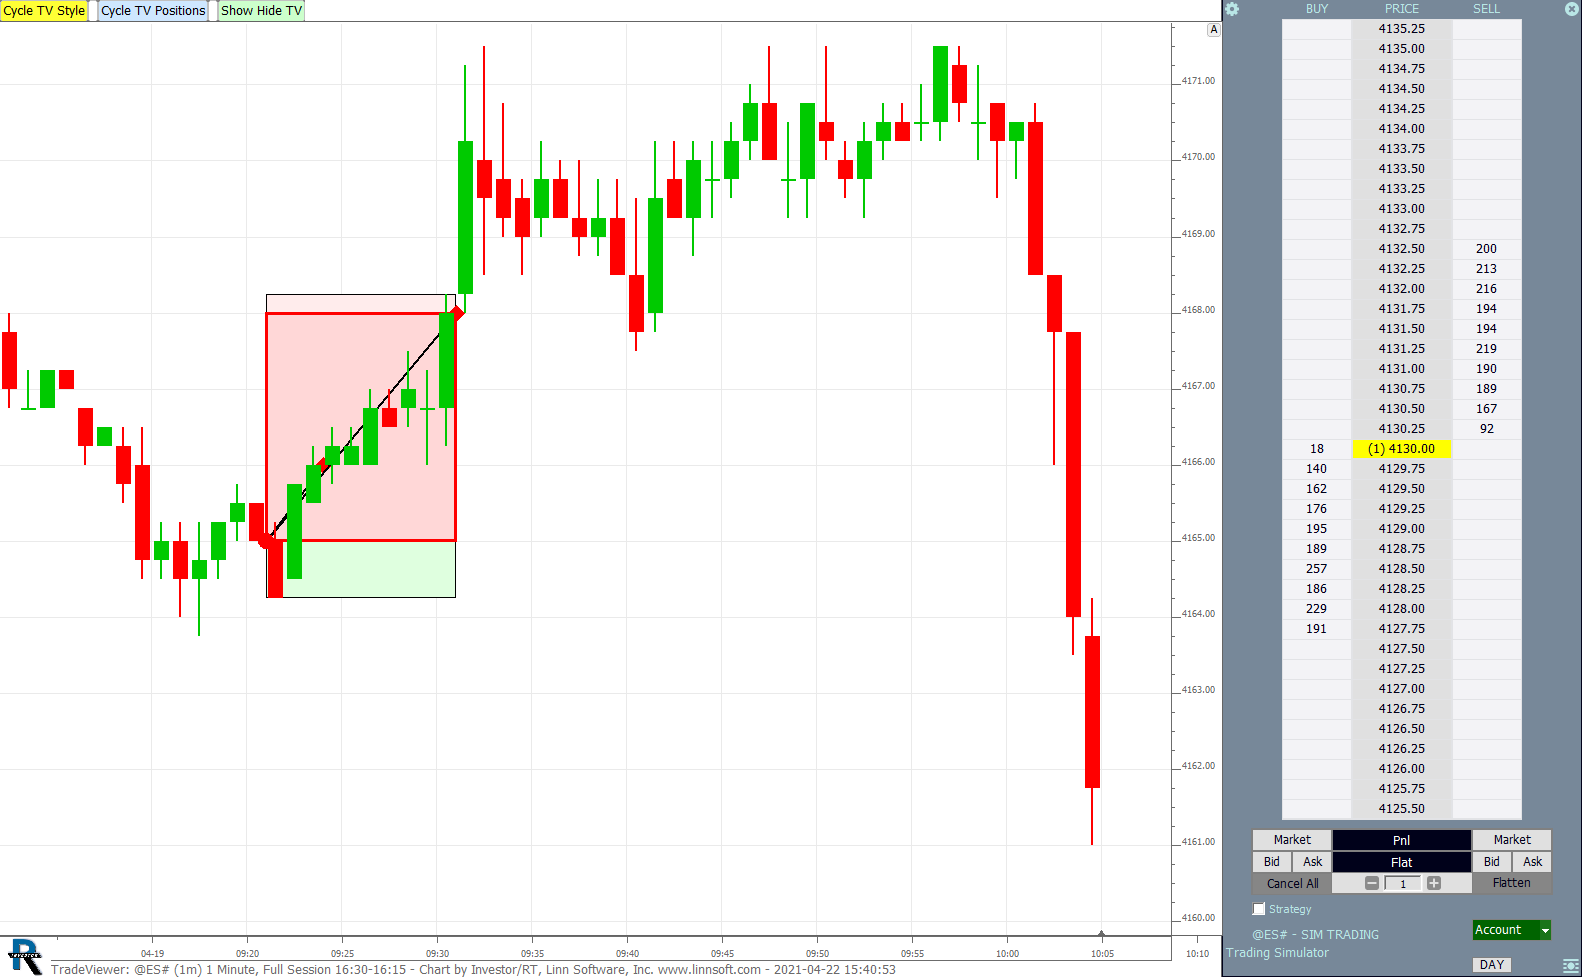 |
TradeViewer Chart (RTX) william-linn [totalcount]
5 years 2 months ago
TradeViewer Sample Chart. |
View |
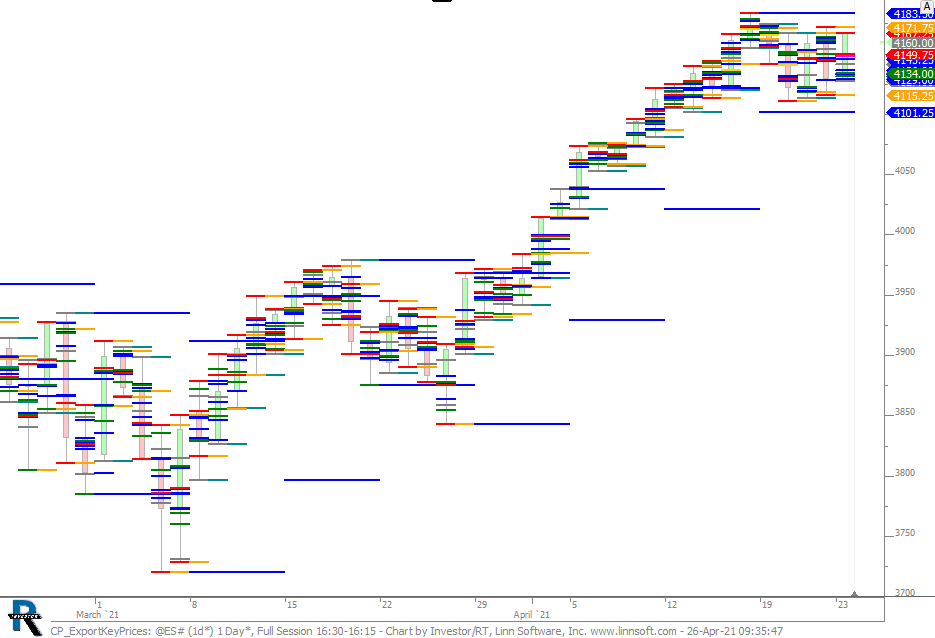 |
CP ExportKeyPrices (@ES#) cpayne [totalcount]
5 years 2 months ago
Export Key Prices via the SessionPrices indicator by right-cliicking on the chart and Export > All Chart Data. |
View |
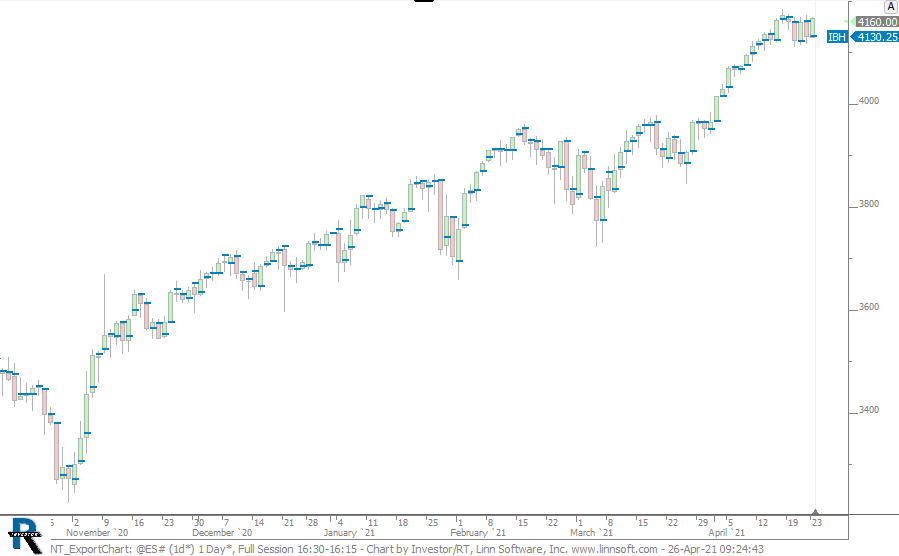 |
NT ExportChart (@ES#) cpayne [totalcount]
5 years 2 months ago
This chart was uploaded by Investor/RT 14.2.6 showing symbol: @ES#. |
View |
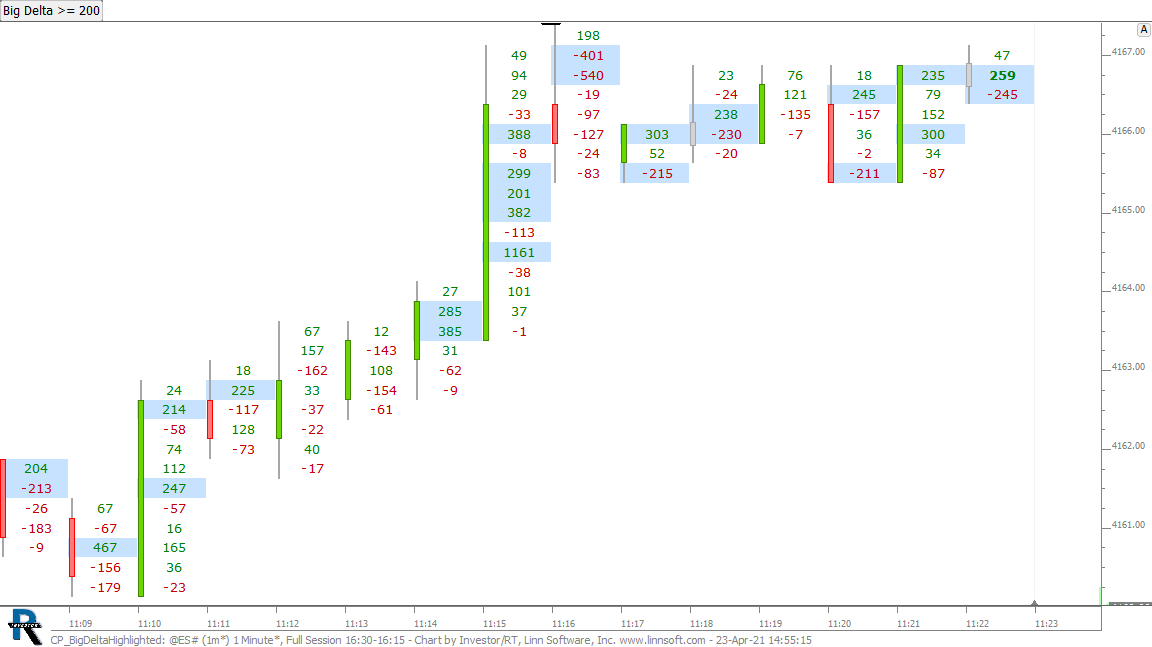 |
CP BigDeltaHighlighted (@ES#) cpayne [totalcount]
5 years 2 months ago
Highlight Big Delta at Price. This chart was uploaded by Investor/RT 14.2.6 showing symbol: @ES#. |
View |
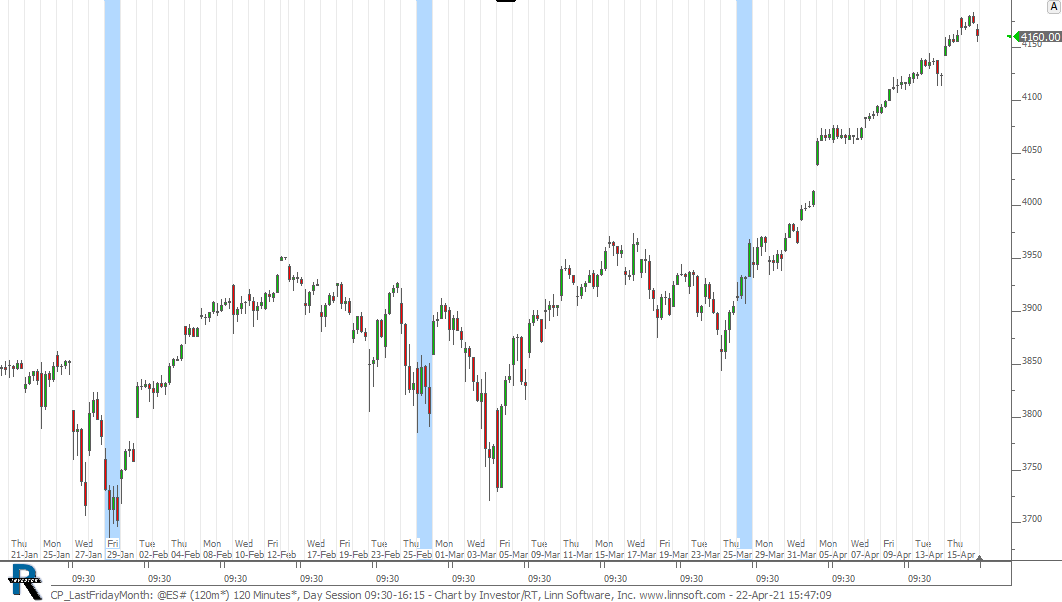 |
CP LastFridayMonth (@ES#) cpayne [totalcount]
5 years 2 months ago
Highlight Last Friday Session of each Month. This chart was uploaded by Investor/RT 14.2.6 showing symbol: @ES#. |
View |
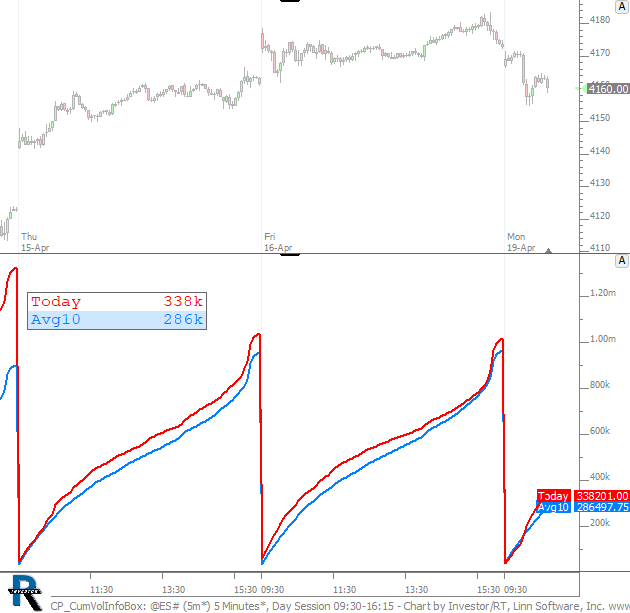 |
CP CumVolInfoBox (@ES#) cpayne [totalcount]
5 years 2 months ago
This chart was uploaded by Investor/RT 14.2.6 showing symbol: @ES#. |
View |
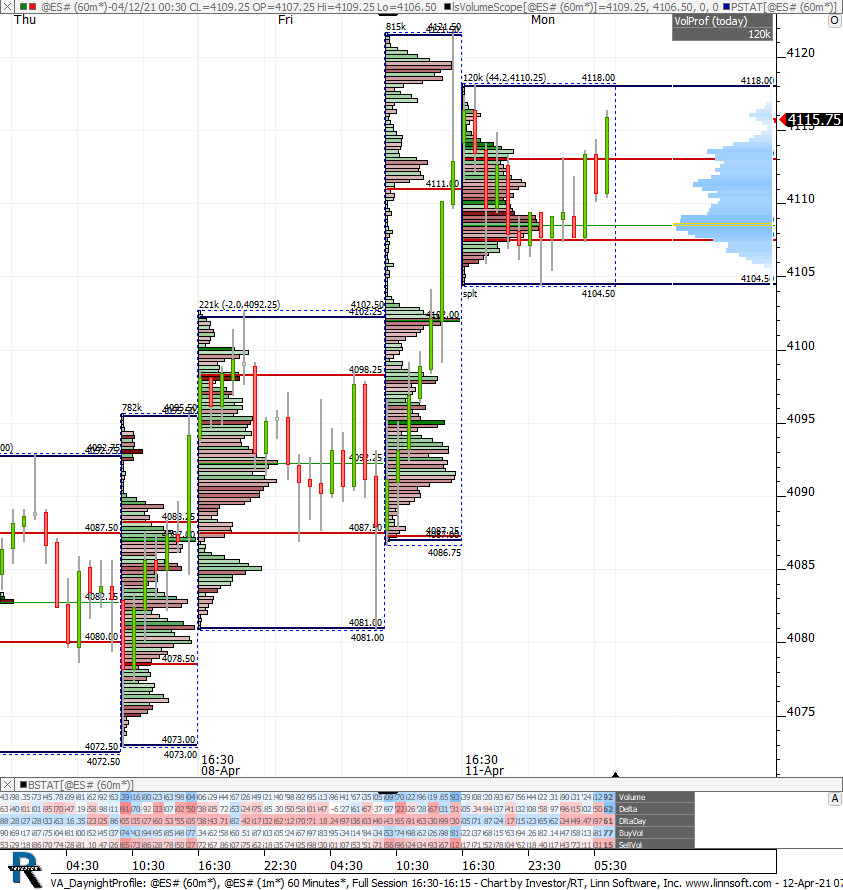 |
VA DaynightProfile (@ES#) cpayne [totalcount]
5 years 3 months ago
This chart was uploaded by Investor/RT 14.2.6 showing symbol: @ES#. |
View |
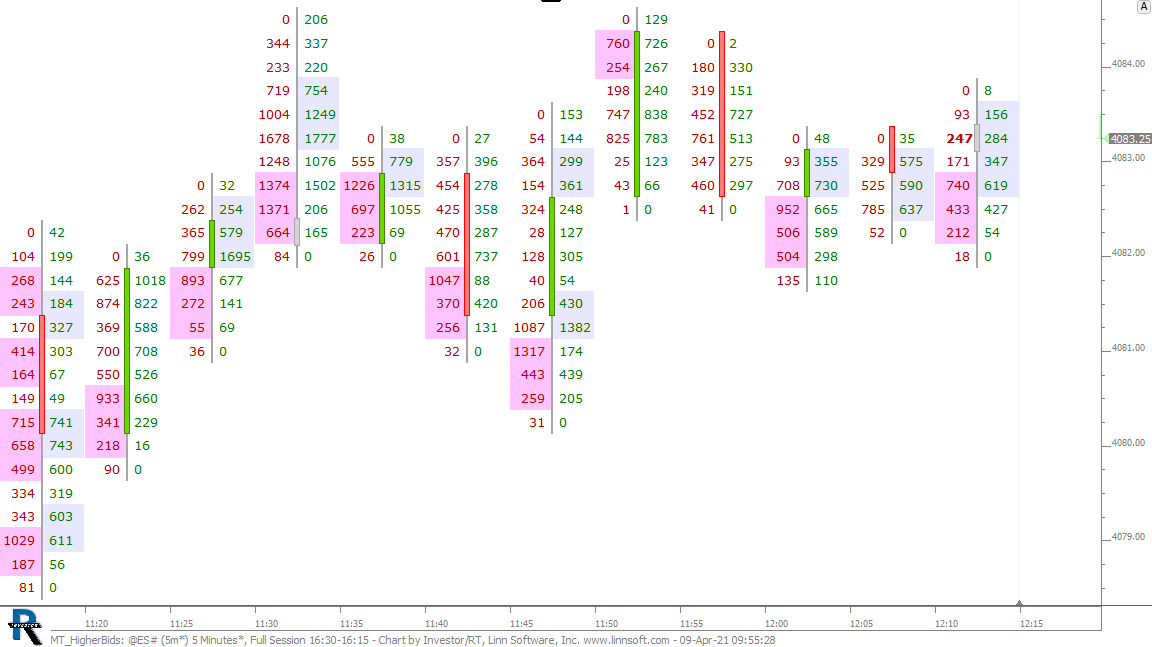 |
MT HigherBids (@ES#) cpayne [totalcount]
5 years 3 months ago
This chart was uploaded by Investor/RT 14.2.6 showing symbol: @ES#. |
View |
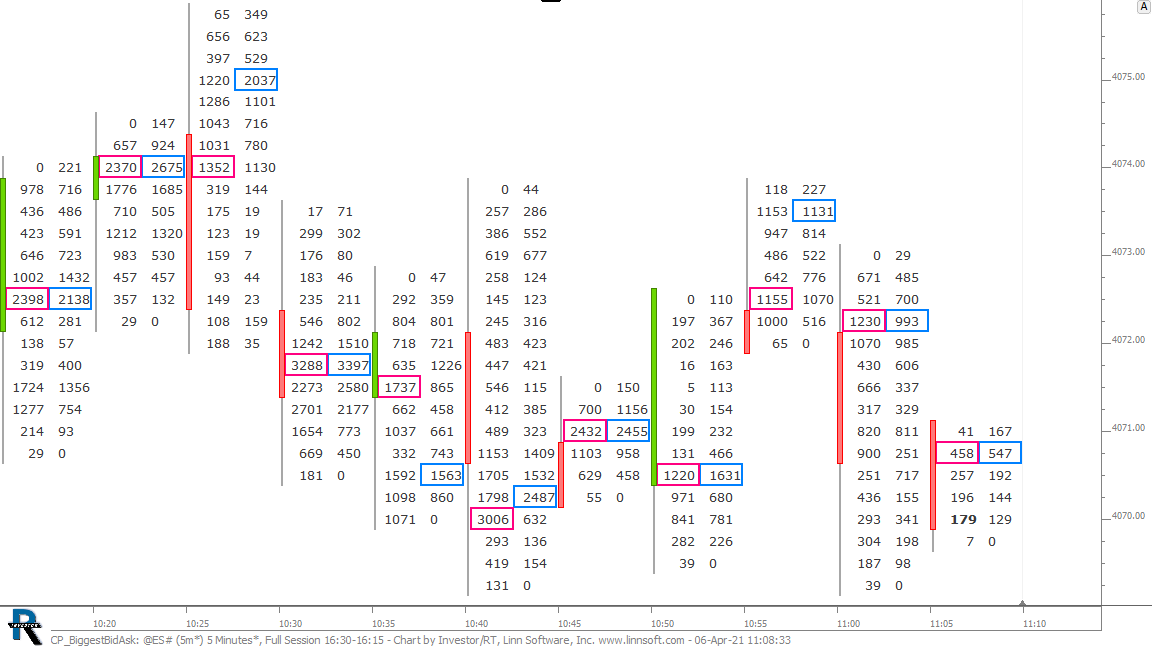 |
CP BiggestBidAsk (@ES#) cpayne [totalcount]
5 years 3 months ago
MPH highlights the biggest bid and ask volume within each bar. This chart was uploaded by Investor/RT 14.2.6 showing symbol: @ES#. |
View |
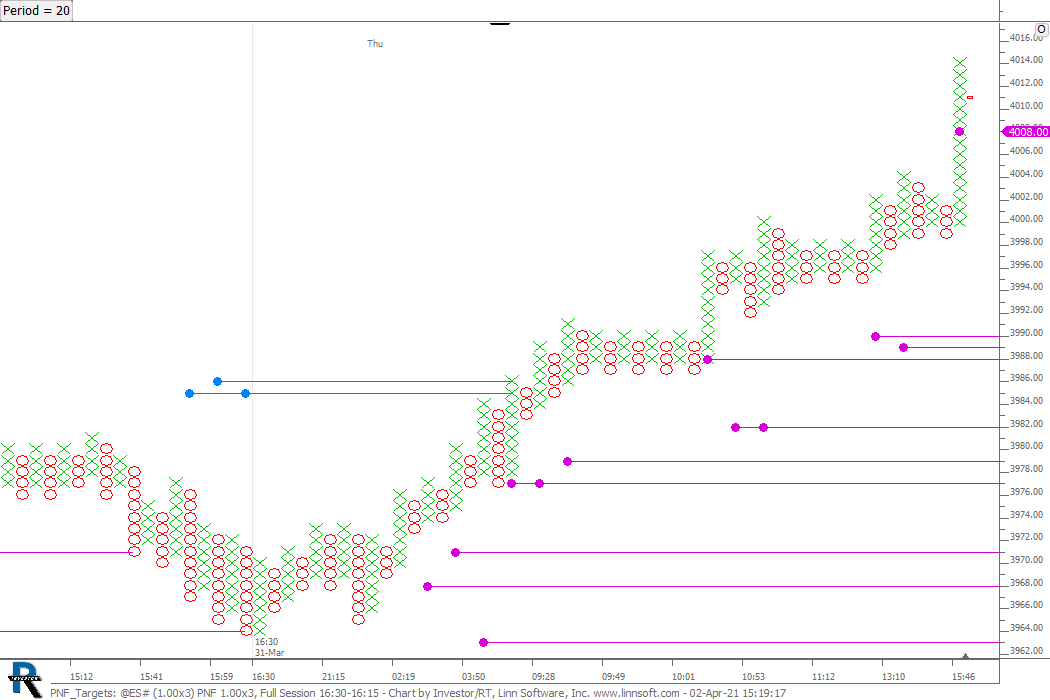 |
PNF Targets (@ES#) cpayne [totalcount]
5 years 3 months ago
PNF Targets. This chart was uploaded by Investor/RT 14.2.6 showing symbol: @ES#. |
View |
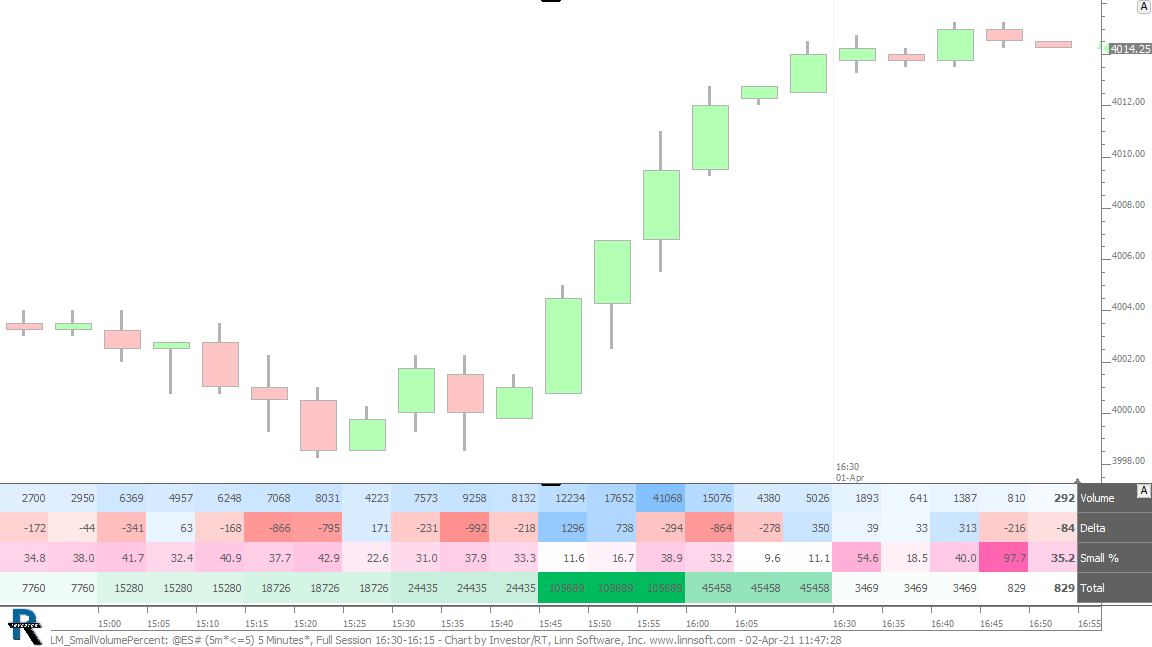 |
LM SmallVolumePercent (@ES#) cpayne [totalcount]
5 years 3 months ago
This chart was uploaded by Investor/RT 14.2.6 showing symbol: @ES#. |
View |
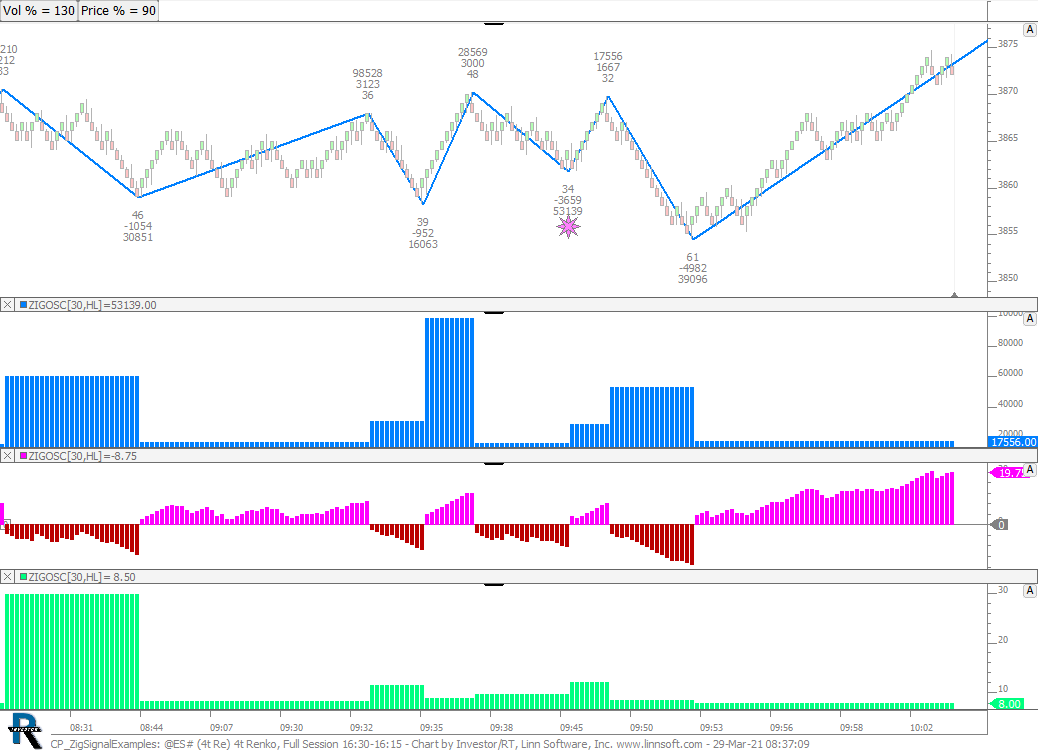 |
CP ZigSignalExamples (@ES#) cpayne [totalcount]
5 years 3 months ago
This chart was uploaded by Investor/RT 14.2.6 showing symbol: @ES#. |
View |
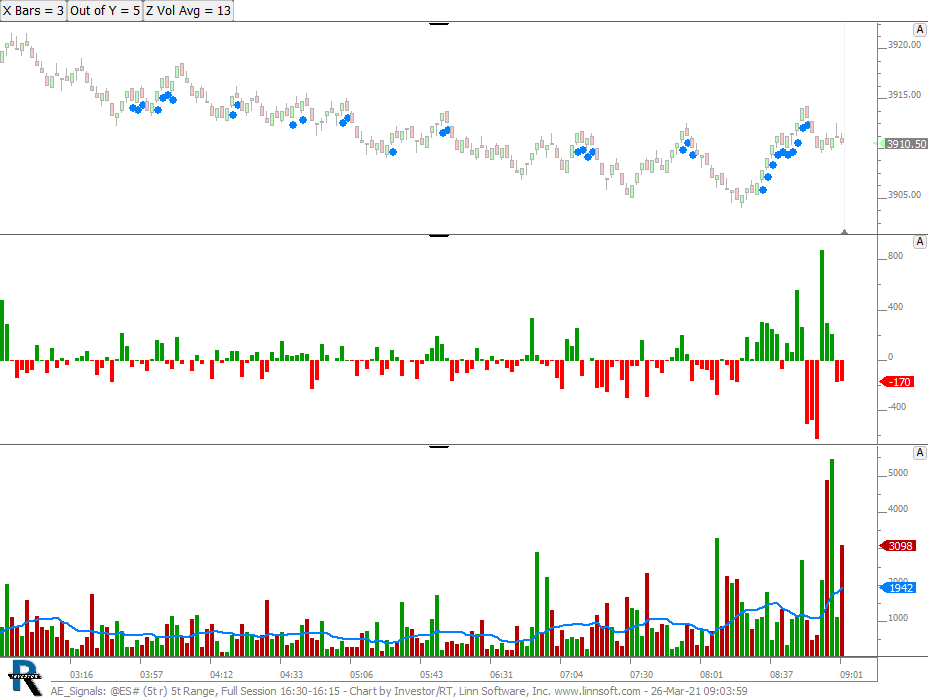 |
AE Signals (@ES#) cpayne [totalcount]
5 years 3 months ago
This chart was uploaded by Investor/RT 14.2.6 showing symbol: @ES#. |
View |
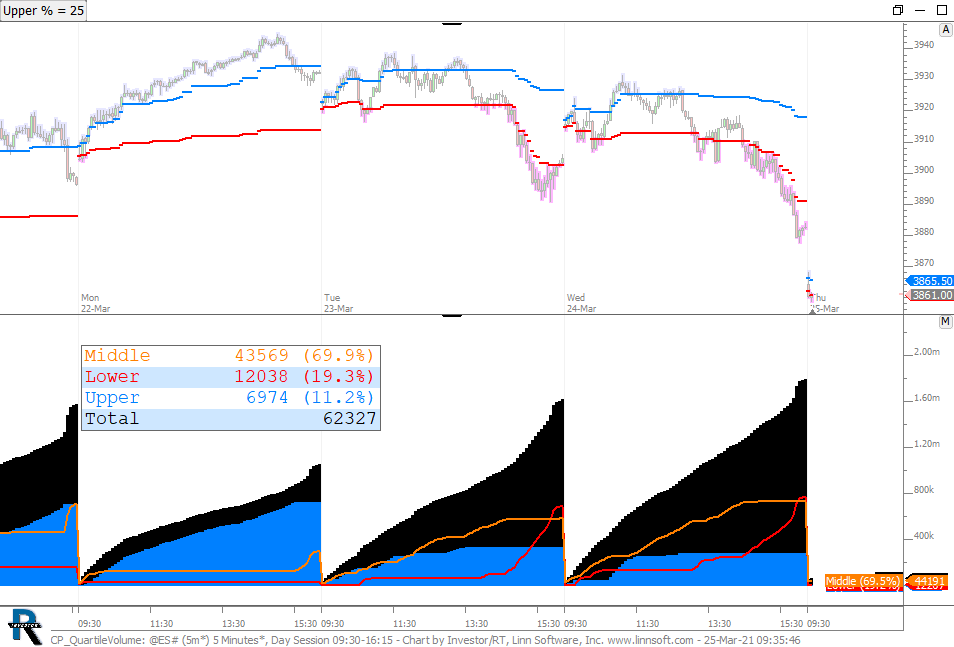 |
CP QuartileVolume (@ES#) cpayne [totalcount]
5 years 3 months ago
Volume of Upper Quartile Prices. This chart was uploaded by Investor/RT 14.2.6 showing symbol: @ES#. |
View |