 |
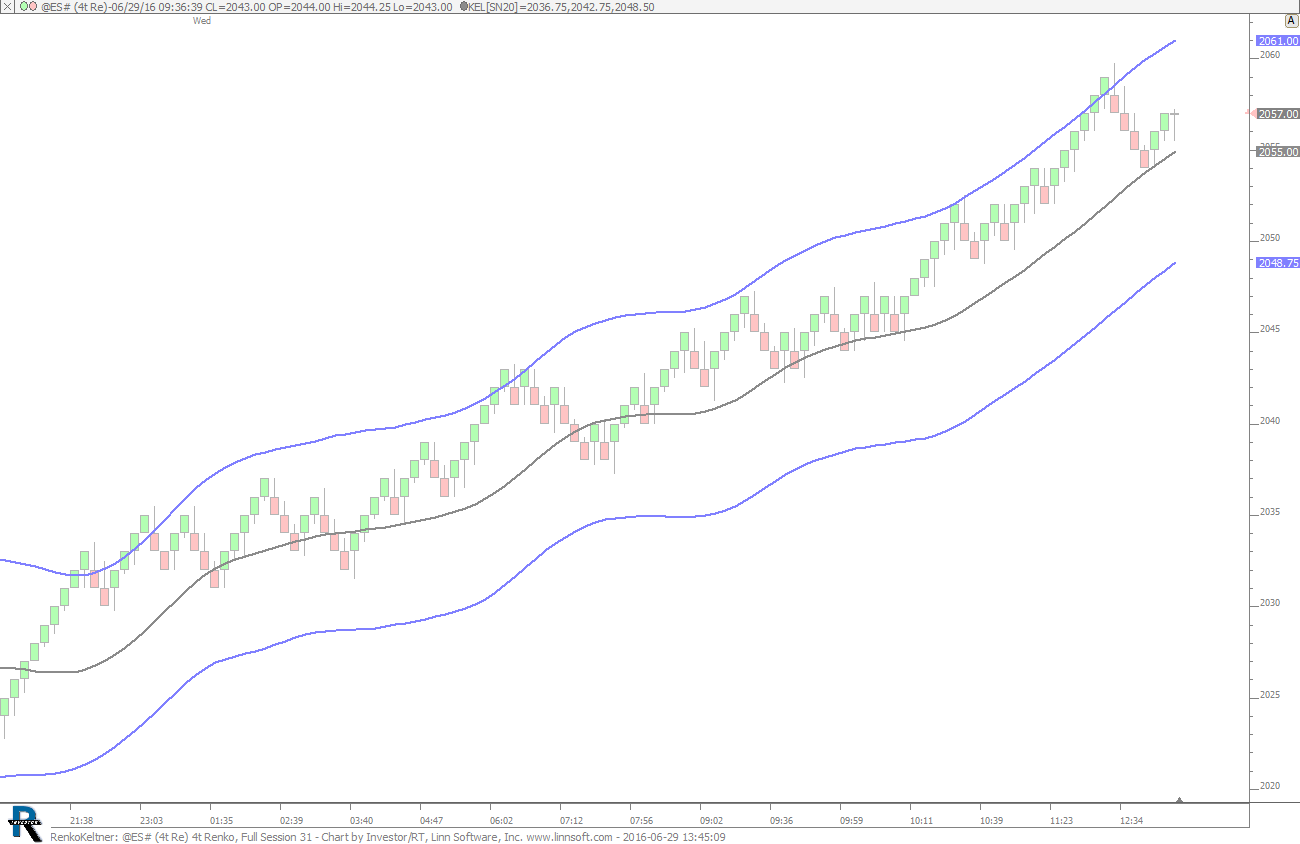
RenkoKeltner (@ES#) cpayne [totalcount]
10 years 2 weeks ago
Renko Chart with Keltner. This chart was uploaded by Investor/RT 12.6.1 showing symbol: @ES#. |
View |
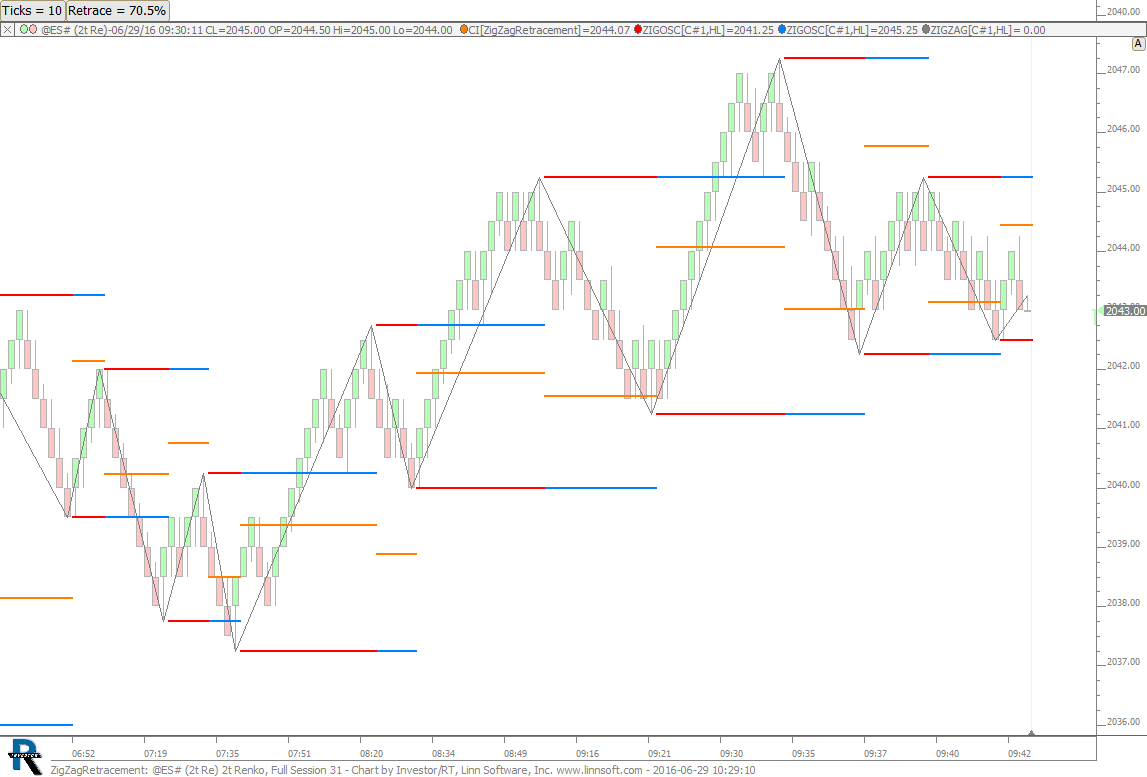 |
ZigZagRetracement (@ES#) 2 cpayne [totalcount]
10 years 2 weeks ago
Zig Zag Retracement - Use buttons to control ticks of zig zag and retracement percentage. Orange line is retracement of previous leg. |
View |
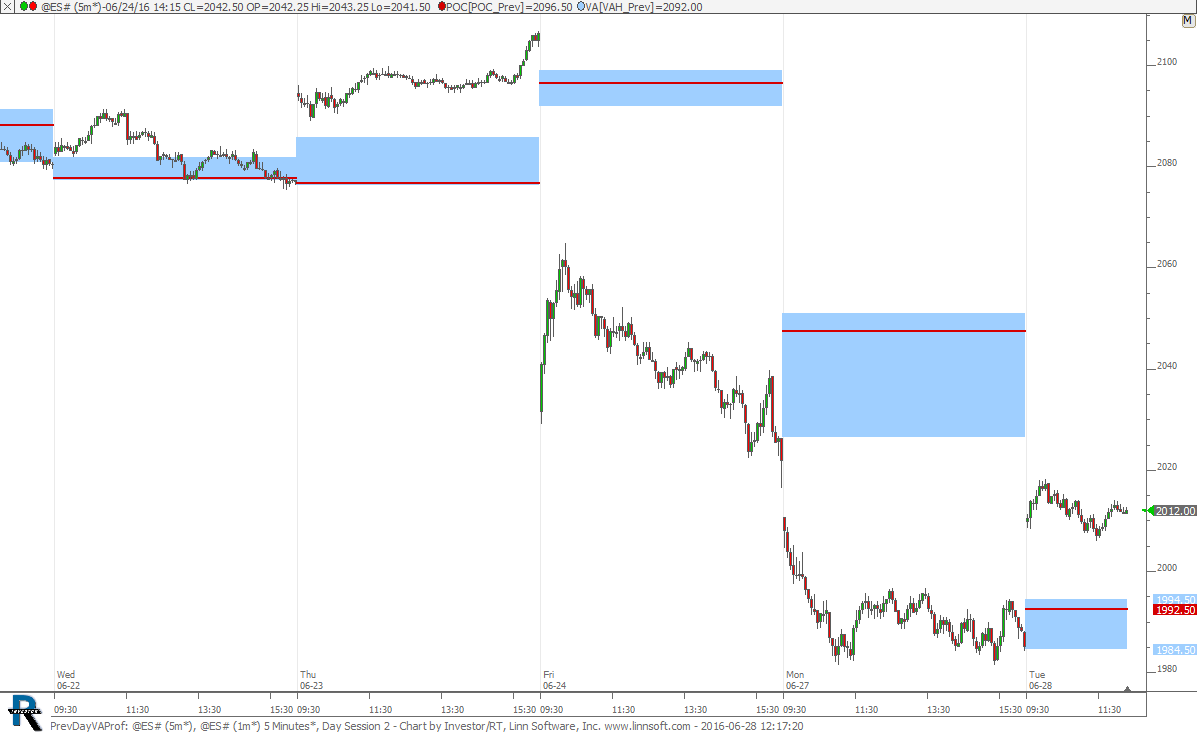 |
PrevDayVAProf (@ES#) cpayne [totalcount]
10 years 2 weeks ago
Previous Day VA & POC - Bands Indicator. This chart was uploaded by Investor/RT 12.6.1 showing symbol: @ES#. |
View |
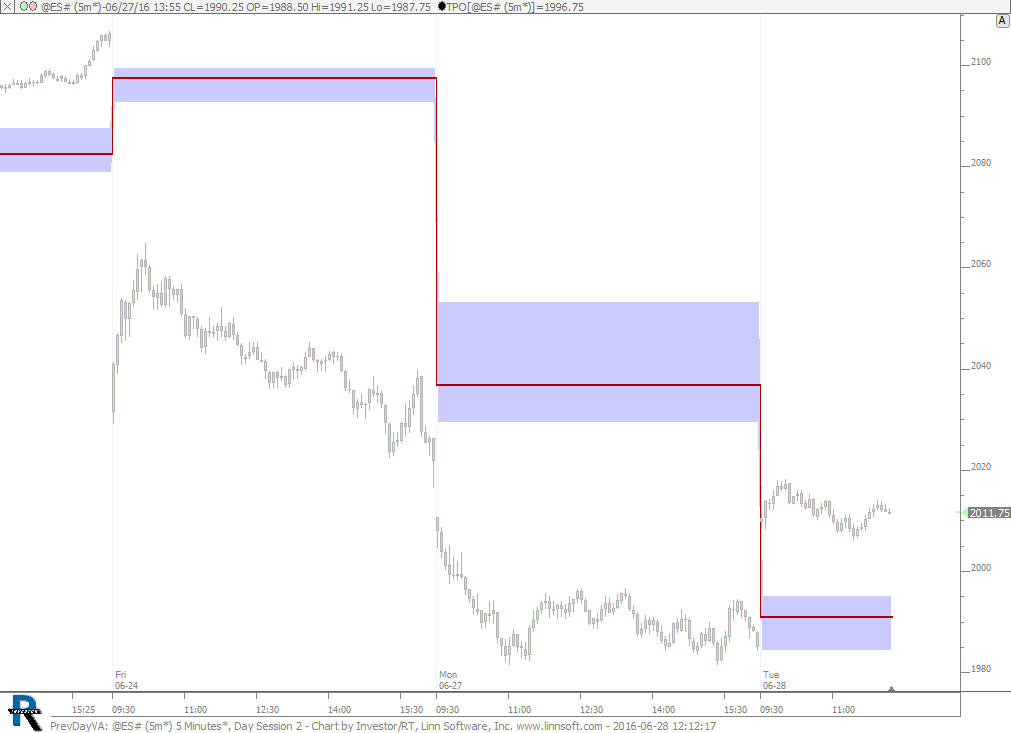 |
PrevDayVA (@ES#) cpayne [totalcount]
10 years 2 weeks ago
Previous Day VA - TPO Indicator. This chart was uploaded by Investor/RT 12.6.1 showing symbol: @ES#. |
View |
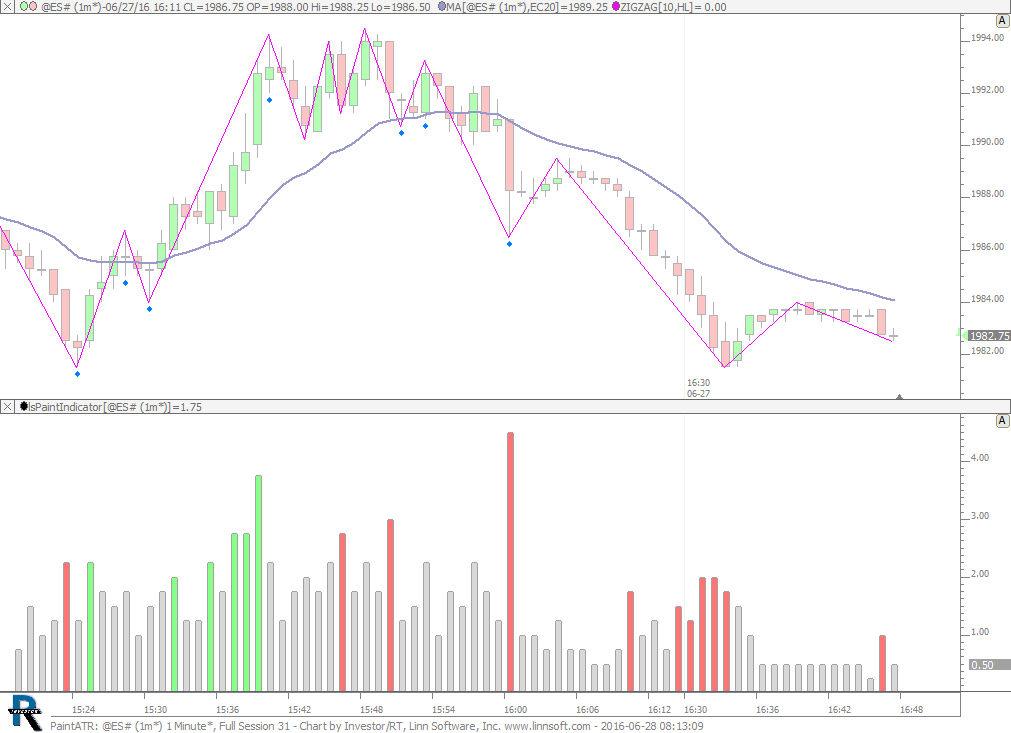 |
PaintATR (@ES#) cpayne [totalcount]
10 years 2 weeks ago
Painted ATR. This chart was uploaded by Investor/RT 12.6.1 showing symbol: @ES#. |
View |
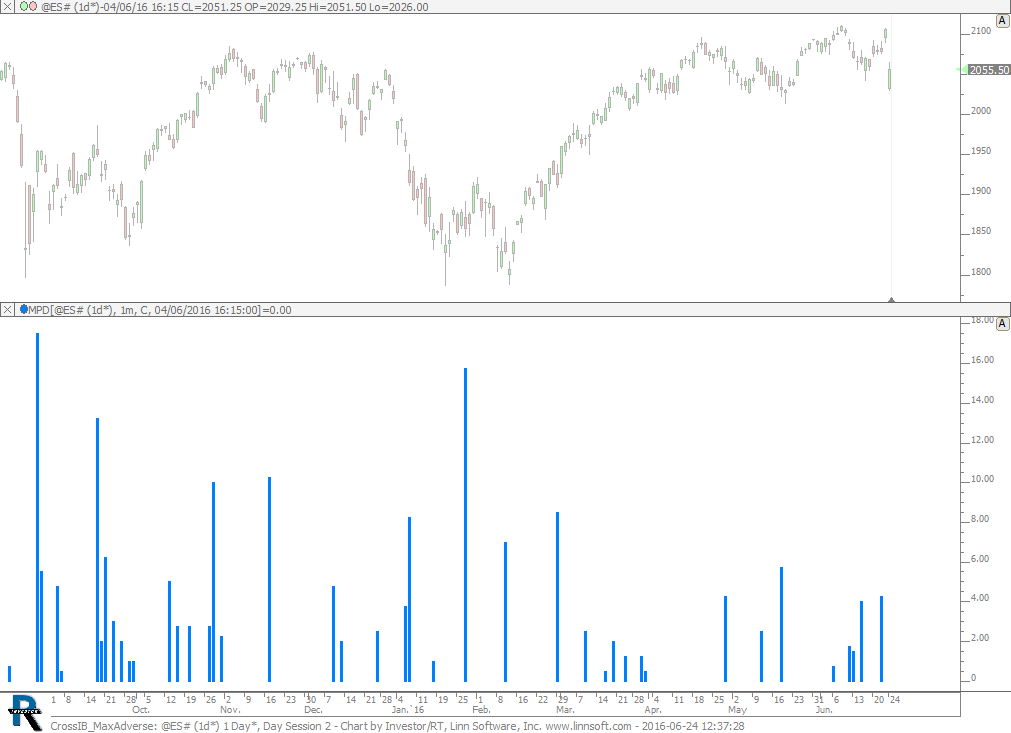 |
CrossIB MaxAdverse (@ES#) cpayne [totalcount]
10 years 3 weeks ago
Max Adverse when Crossing the IB. This chart was uploaded by Investor/RT 12.6.1 showing symbol: @ES#. |
View |
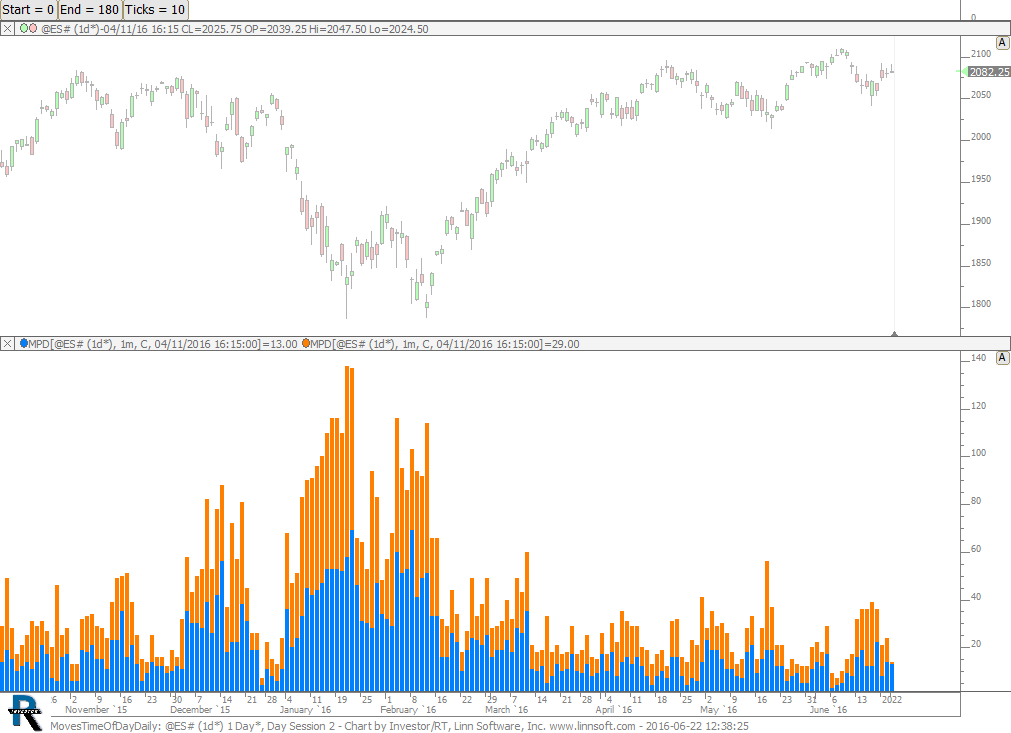 |
MovesTimeOfDayDaily (@ES#) cpayne [totalcount]
10 years 3 weeks ago
Moves by Time of Day vs All Moves. This chart was uploaded by Investor/RT 12.6.1 showing symbol: @ES#. |
View |
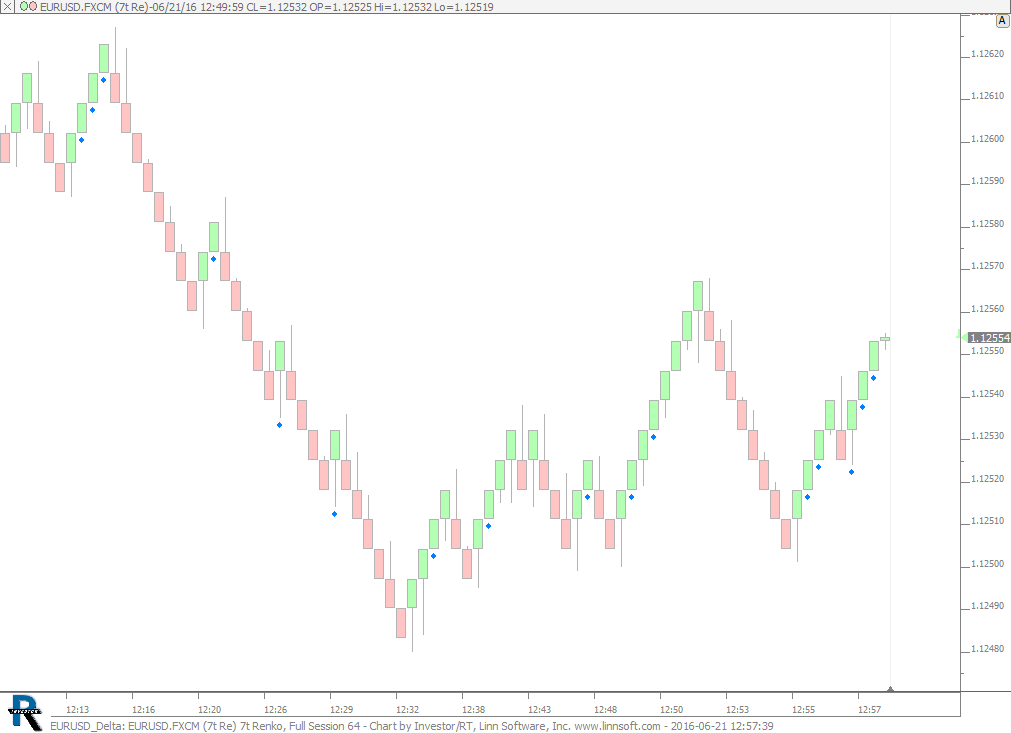 |
EURUSD Delta (EURUSD.FXCM) cpayne [totalcount]
10 years 3 weeks ago
Strong Delta for EURUSD.FXCM. This chart was uploaded by Investor/RT 12.6.1 showing symbol: EURUSD.FXCM. |
View |
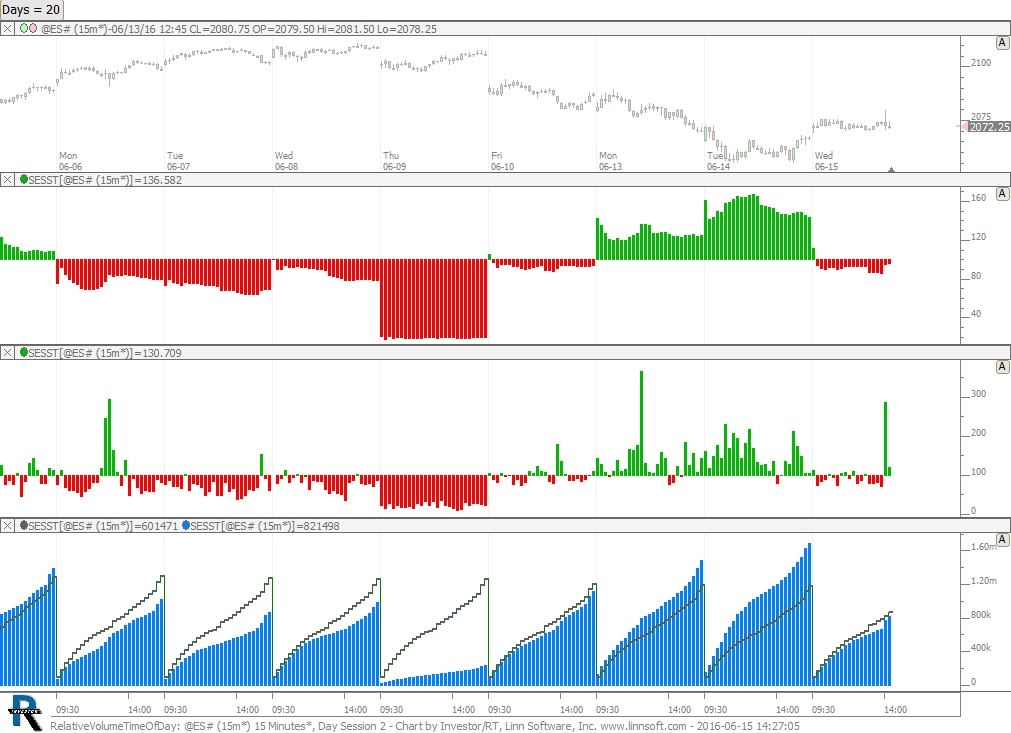 |
RelativeVolumeTimeOfDay (@ES#) cpayne [totalcount]
10 years 3 weeks ago
Relative Volume by Time of Day Presented 3 Ways. This chart was uploaded by Investor/RT 12.6.1 showing symbol: @ES#. |
View |
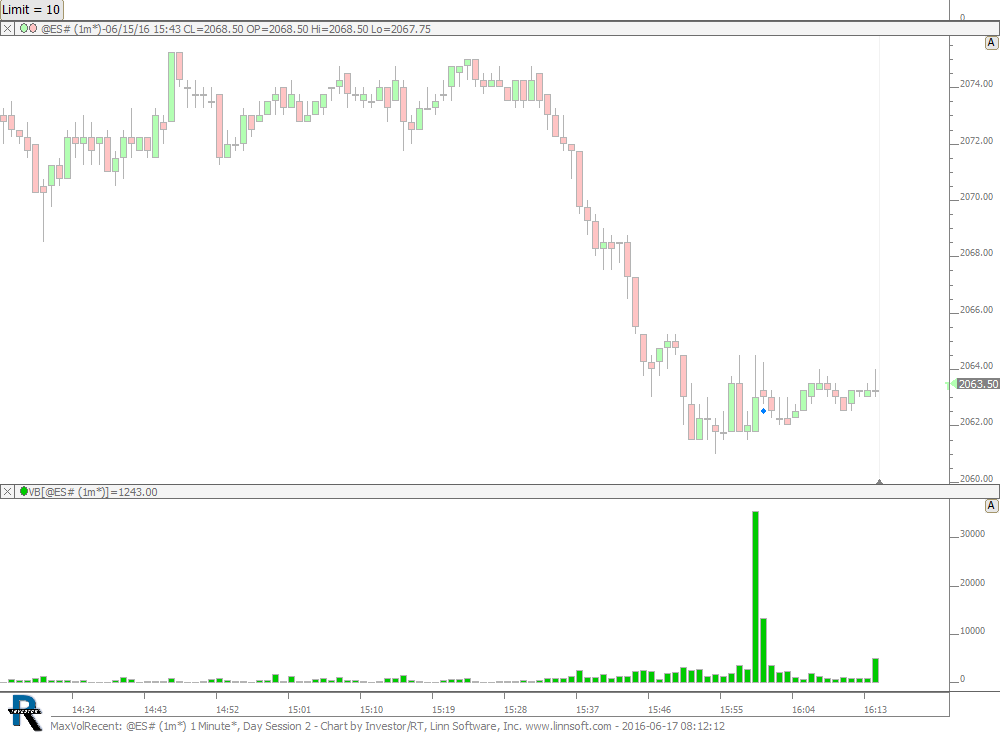 |
MaxVolRecent (@ES#) cpayne [totalcount]
10 years 4 weeks ago
Max Volume Bar over last 15 bars. This chart was uploaded by Investor/RT 12.6.1 showing symbol: @ES#. |
View |
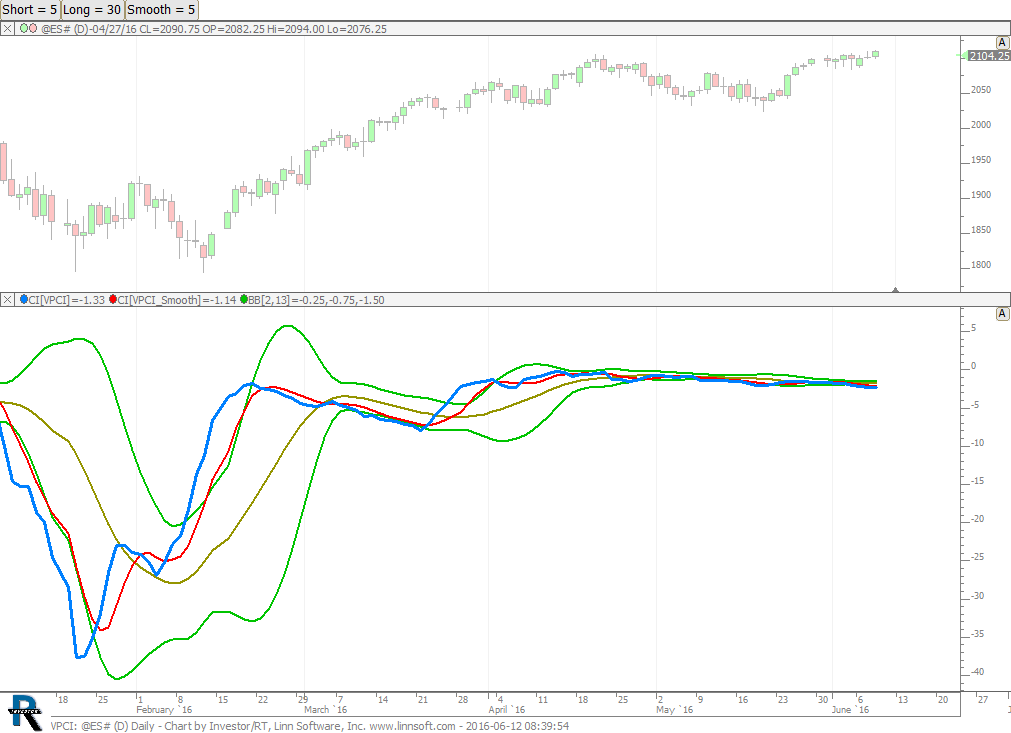 |
VPCI (@ES#) cpayne [totalcount]
10 years 1 month ago
VPCI - TASC July 2007. This chart was uploaded by Investor/RT 12.6.1 showing symbol: @ES#. |
View |
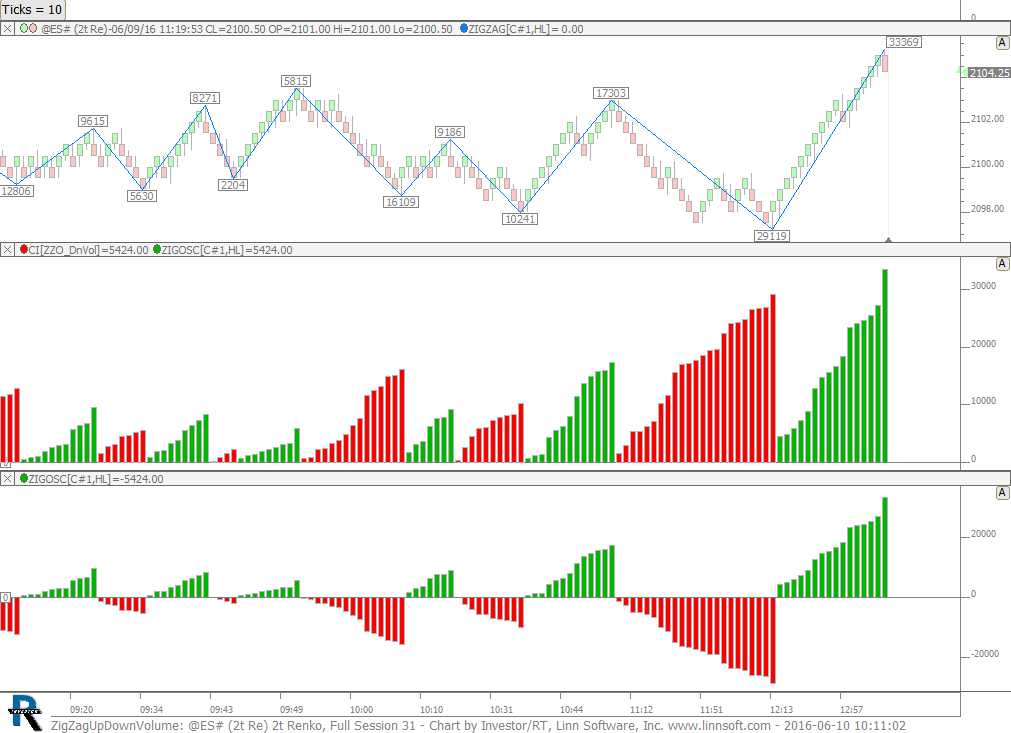 |
ZigZagUpDownVolume (@ES#) cpayne [totalcount]
10 years 1 month ago
2 ways to present the volume of up and down moves of Zig Zag indicator (using Zig Zag Oscillator). This chart was uploaded by Investor/RT 12.6.1 showing symbol: @ES#. |
View |
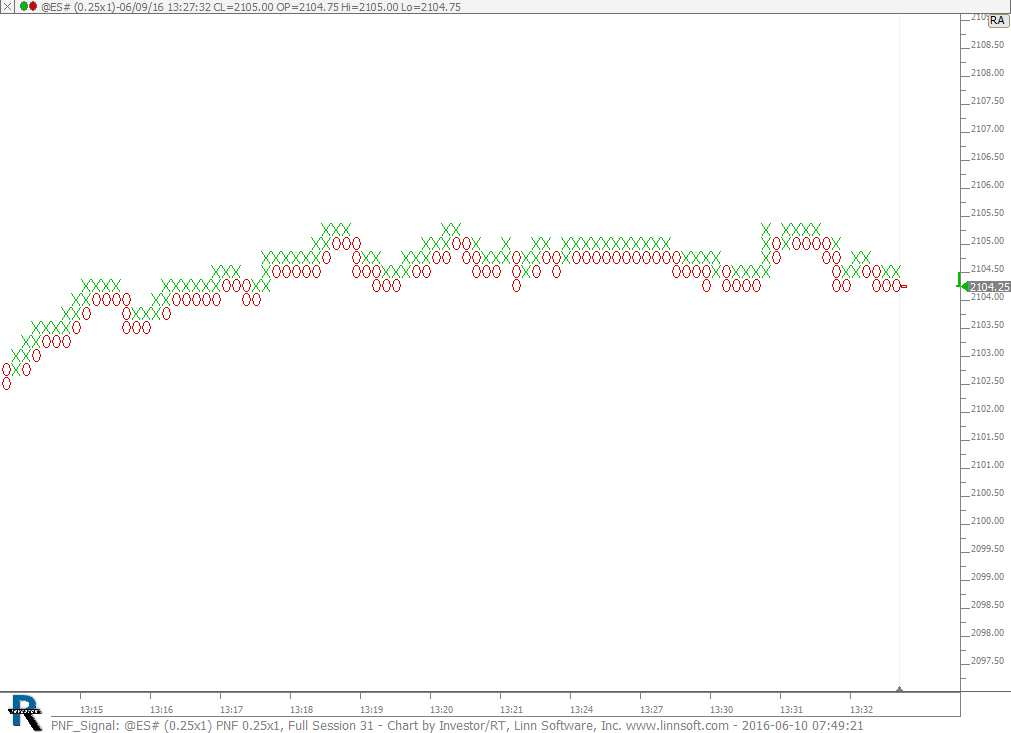 |
PNF Signal (@ES#) cpayne [totalcount]
10 years 1 month ago
This chart was uploaded by Investor/RT 12.6.1 showing symbol: @ES#. |
View |
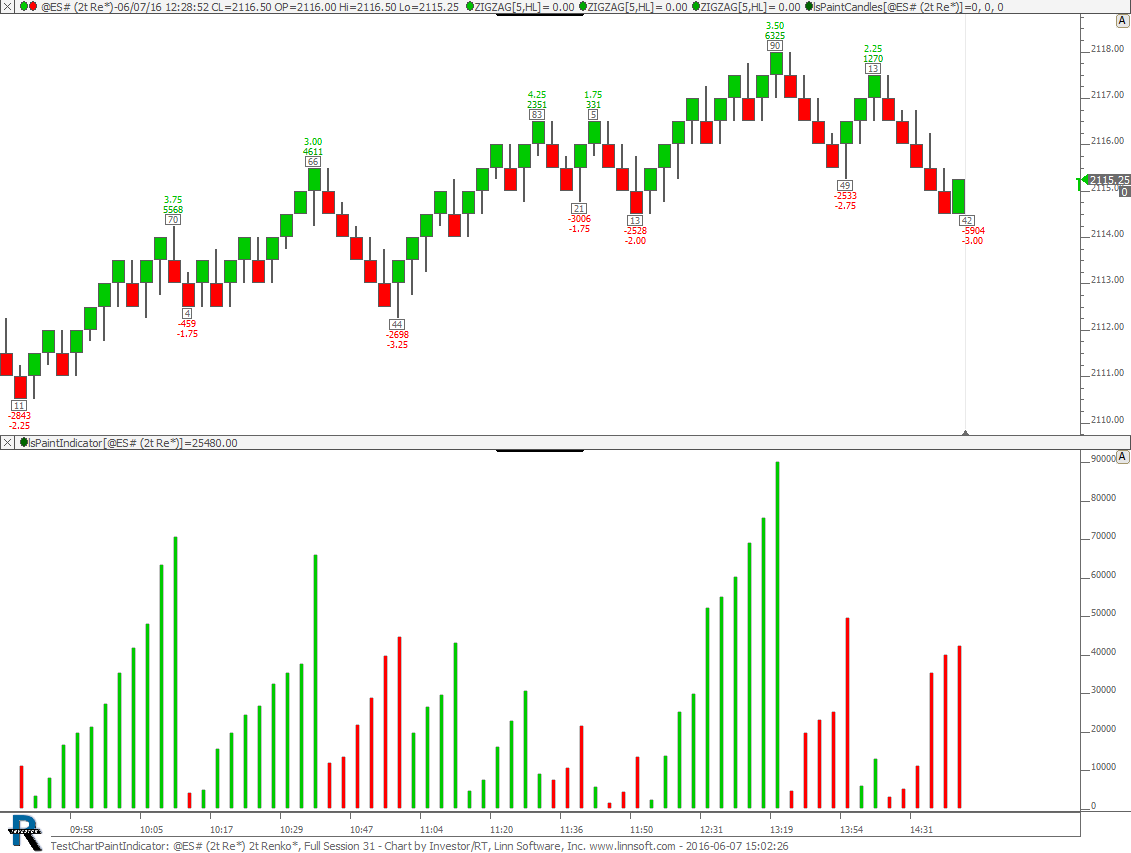 |
TestChartPaintIndicator (@ES#) cpayne [totalcount]
10 years 1 month ago
This chart was uploaded by Investor/RT 12.6.1 showing symbol: @ES#. |
View |
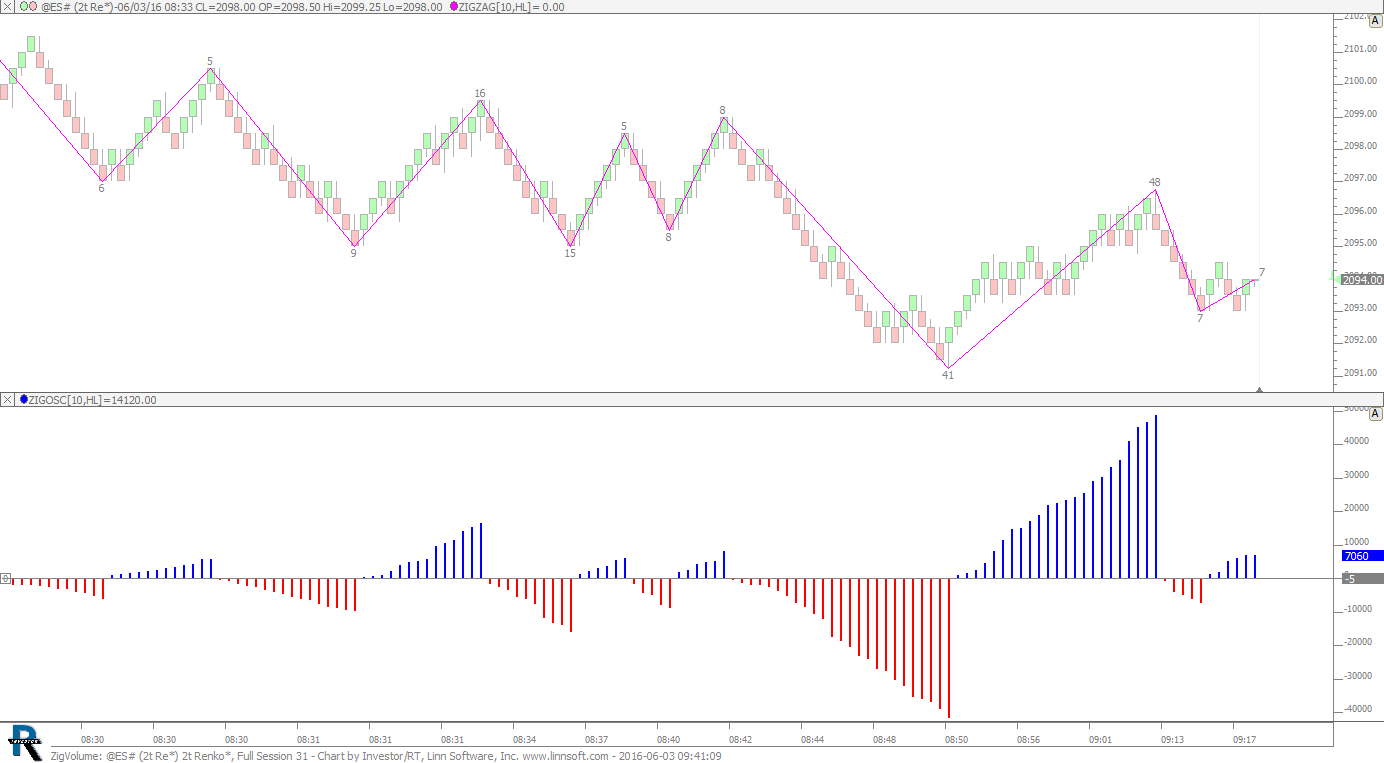 |
ZigVolume (@ES#) 2 cpayne [totalcount]
10 years 1 month ago
Zig Zag Volume. This chart was uploaded by Investor/RT 12.6.1 showing symbol: @ES#. |
View |
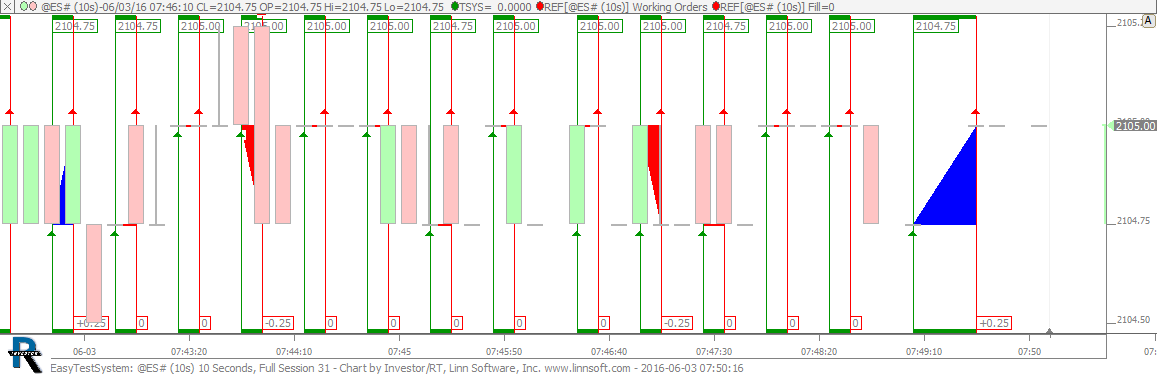 |
EasyTestSystem (@ES#) cpayne [totalcount]
10 years 1 month ago
EasyTestSystem. This chart was uploaded by Investor/RT 12.6.1 showing symbol: @ES#. |
View |
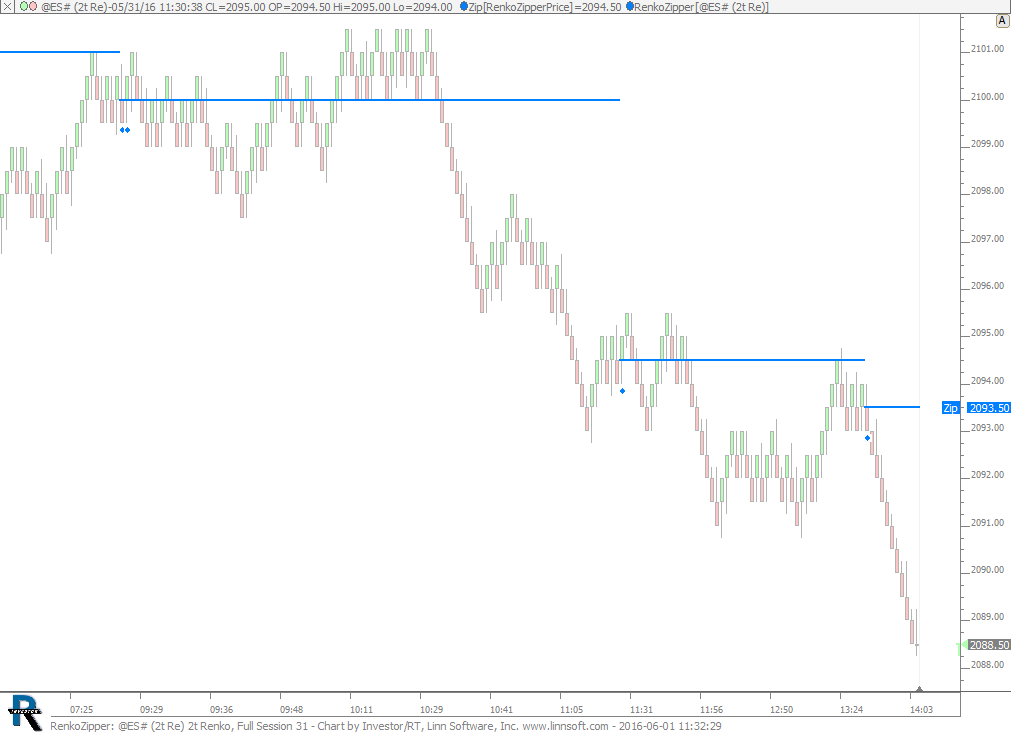 |
RenkoZipper (@ES#) cpayne [totalcount]
10 years 1 month ago
Renko Zipper. This chart was uploaded by Investor/RT 12.5.9 showing symbol: @ES#. |
View |
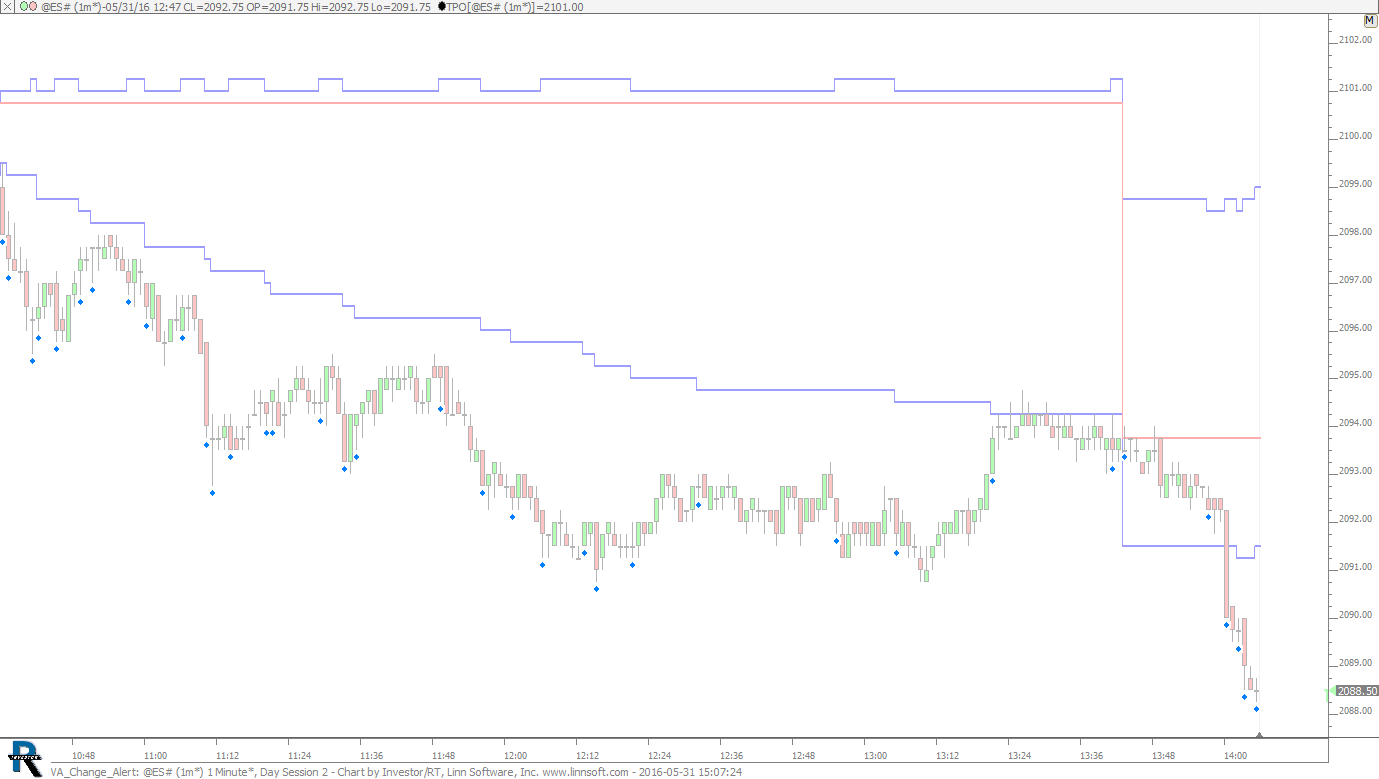 |
VA Change Alert (@ES#) cpayne [totalcount]
10 years 1 month ago
VA Change Alert. This chart was uploaded by Investor/RT 12.5.9 showing symbol: @ES#. |
View |
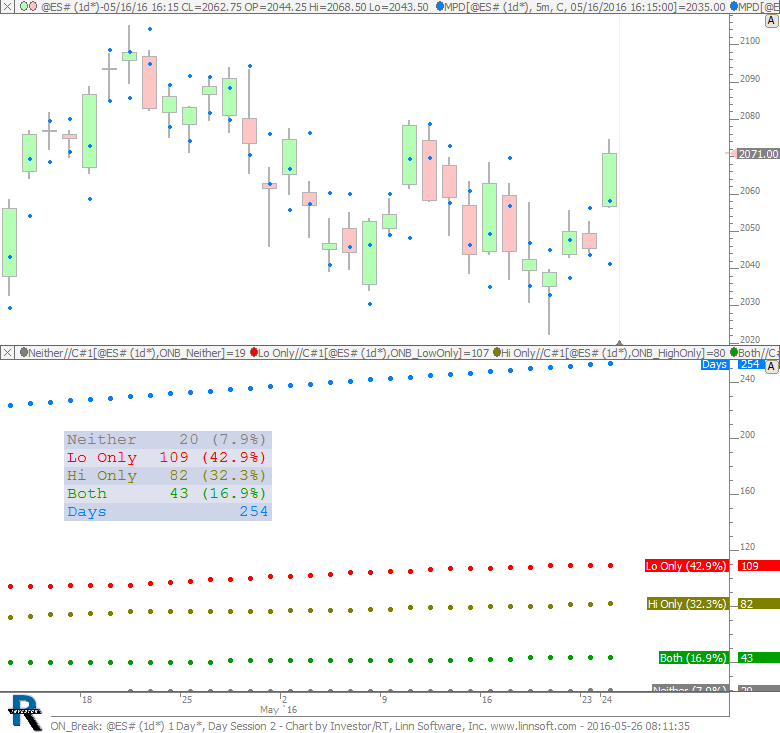 |
ON Break (@ES#) cpayne [totalcount]
10 years 1 month ago
Statistics on breaks of overnight high and low. This chart was uploaded by Investor/RT 12.5.9 showing symbol: @ES#. |
View |
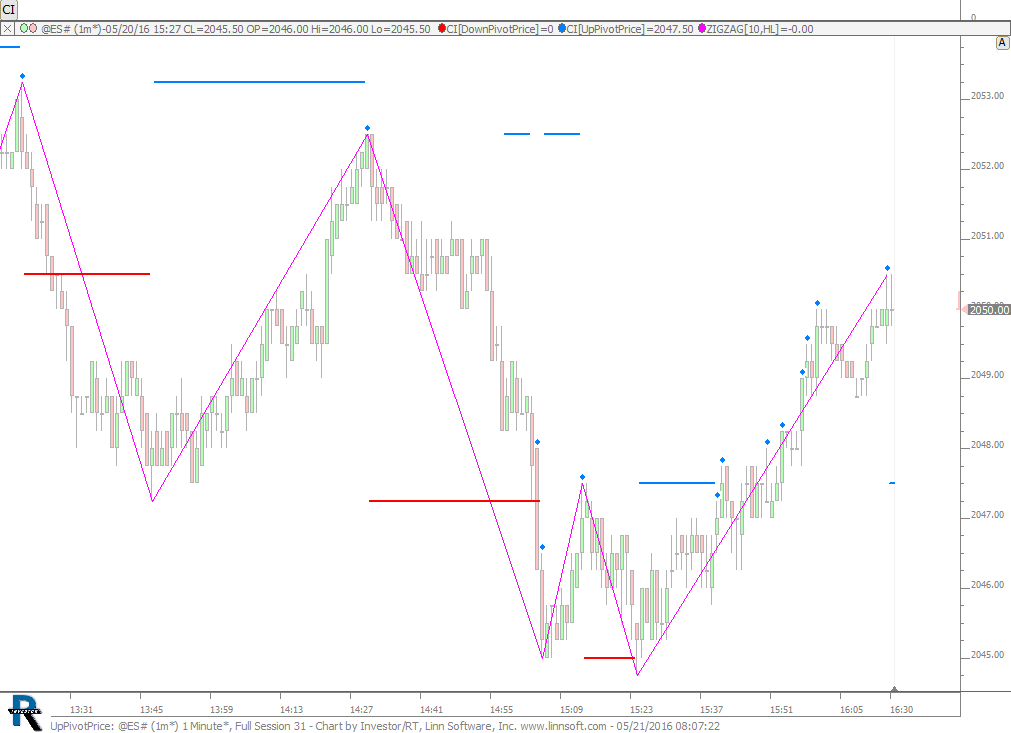 |
UpPivotPrice (@ES#) cpayne [totalcount]
10 years 1 month ago
UpPivotPrice. This chart was uploaded by Investor/RT 12.5.9 showing symbol: @ES#. |
View |
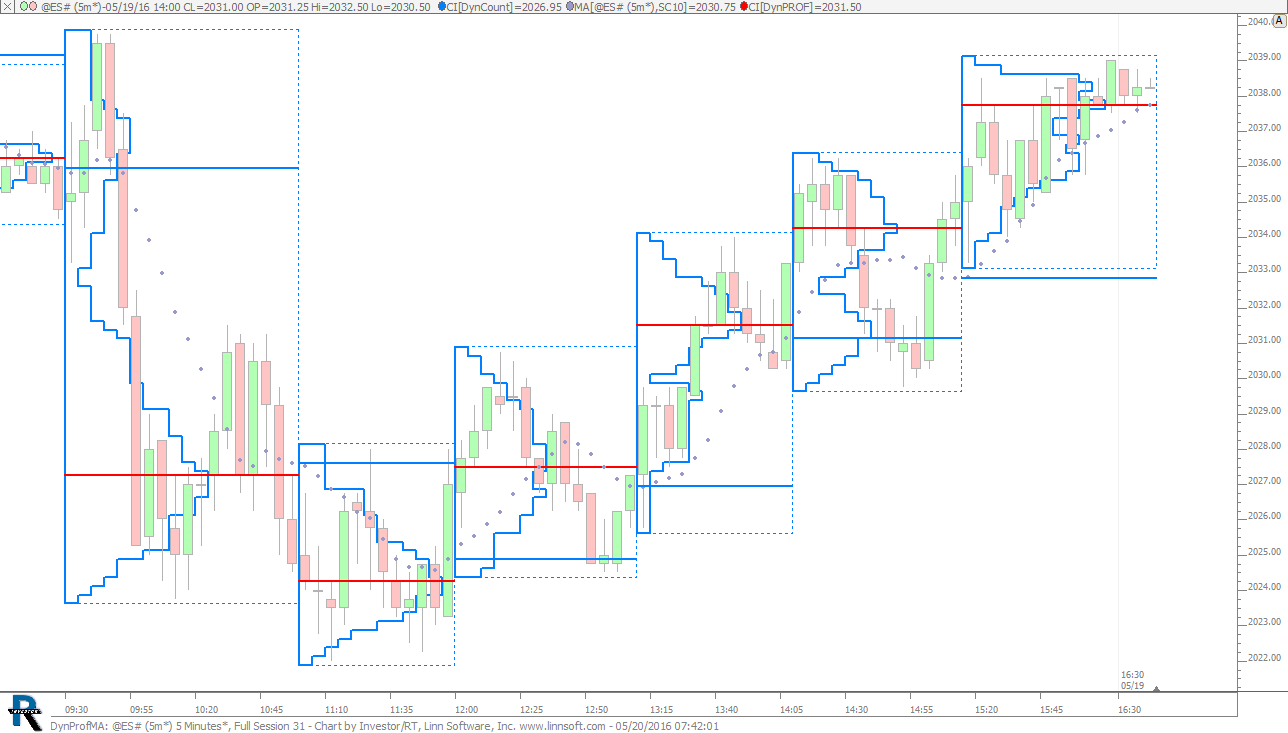 |
DynProfMA (@ES#) cpayne [totalcount]
10 years 1 month ago
This chart was uploaded by Investor/RT 12.5.9 showing symbol: @ES#. |
View |
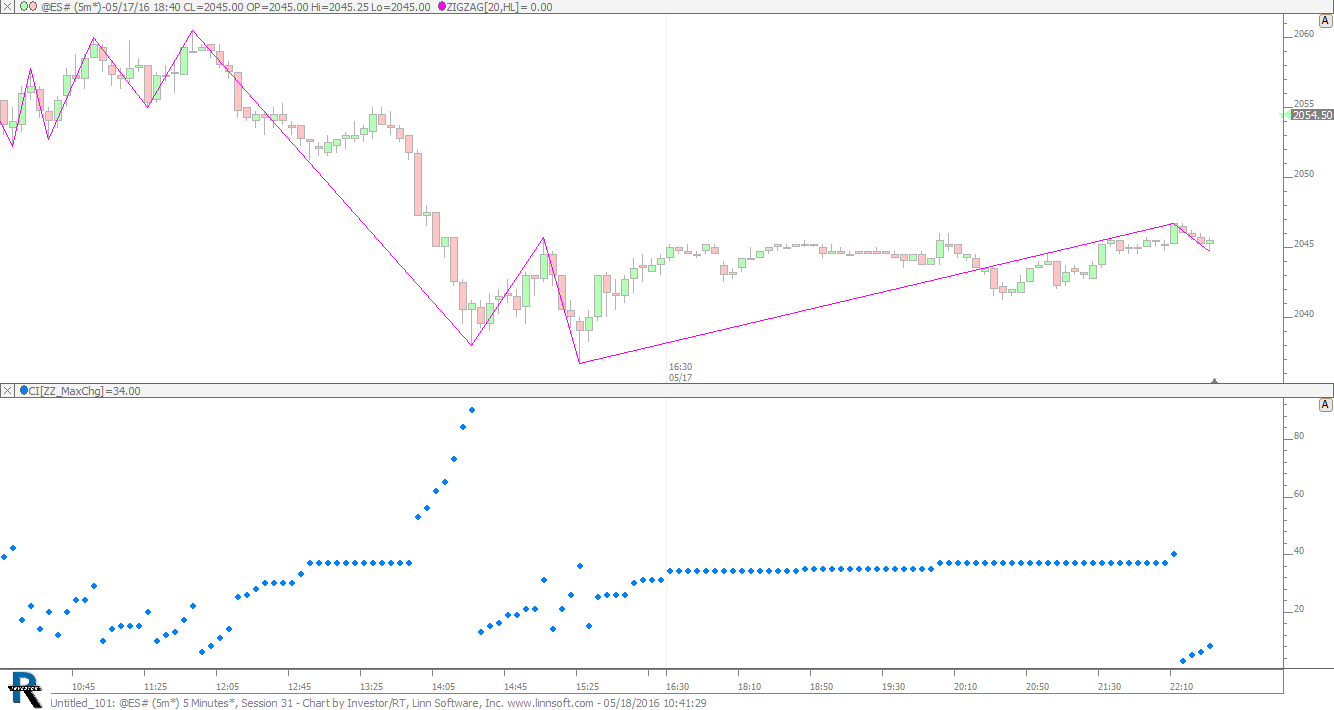 |
Untitled 101 (@ES#) cpayne [totalcount]
10 years 1 month ago
This chart was uploaded by Investor/RT 12.5.9 showing symbol: @ES#. |
View |
 |
Untitled 101 (@ES#) cpayne [totalcount]
10 years 1 month ago
This chart was uploaded by Investor/RT 12.5.9 showing symbol: @ES#. |
View |
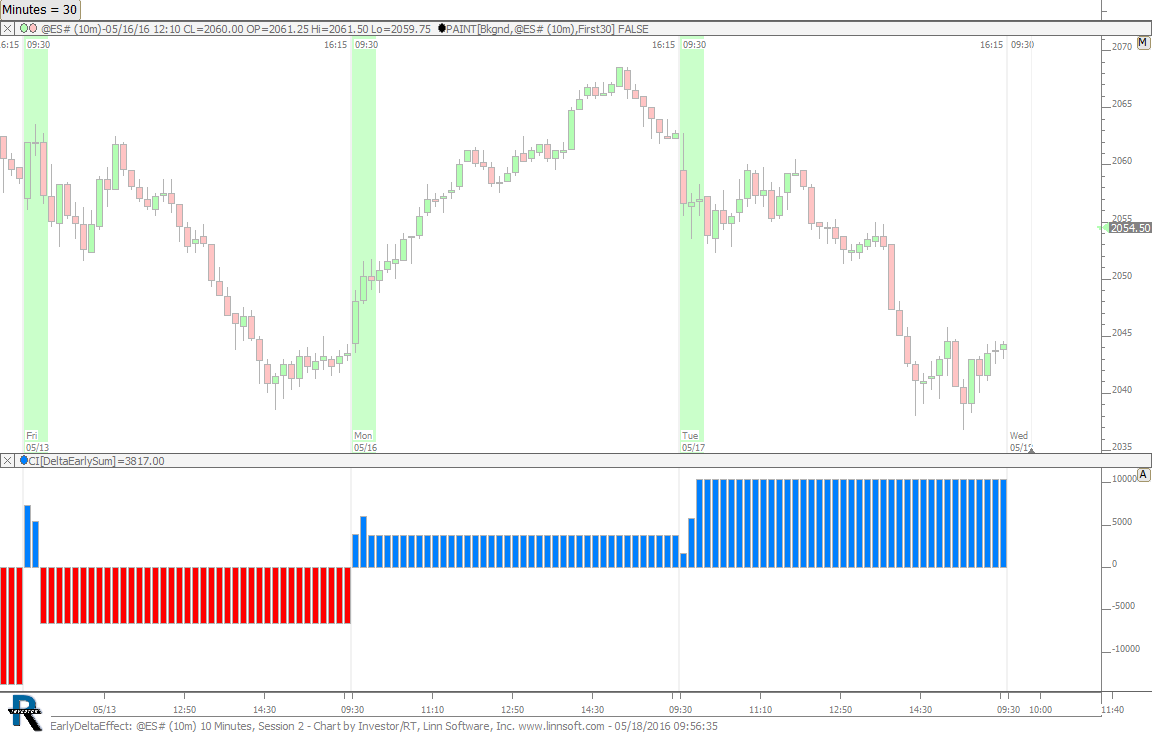 |
EarlyDeltaEffect (@ES#) cpayne [totalcount]
10 years 1 month ago
Early Delta Effect. This chart was uploaded by Investor/RT 12.5.9 showing symbol: @ES#. |
View |
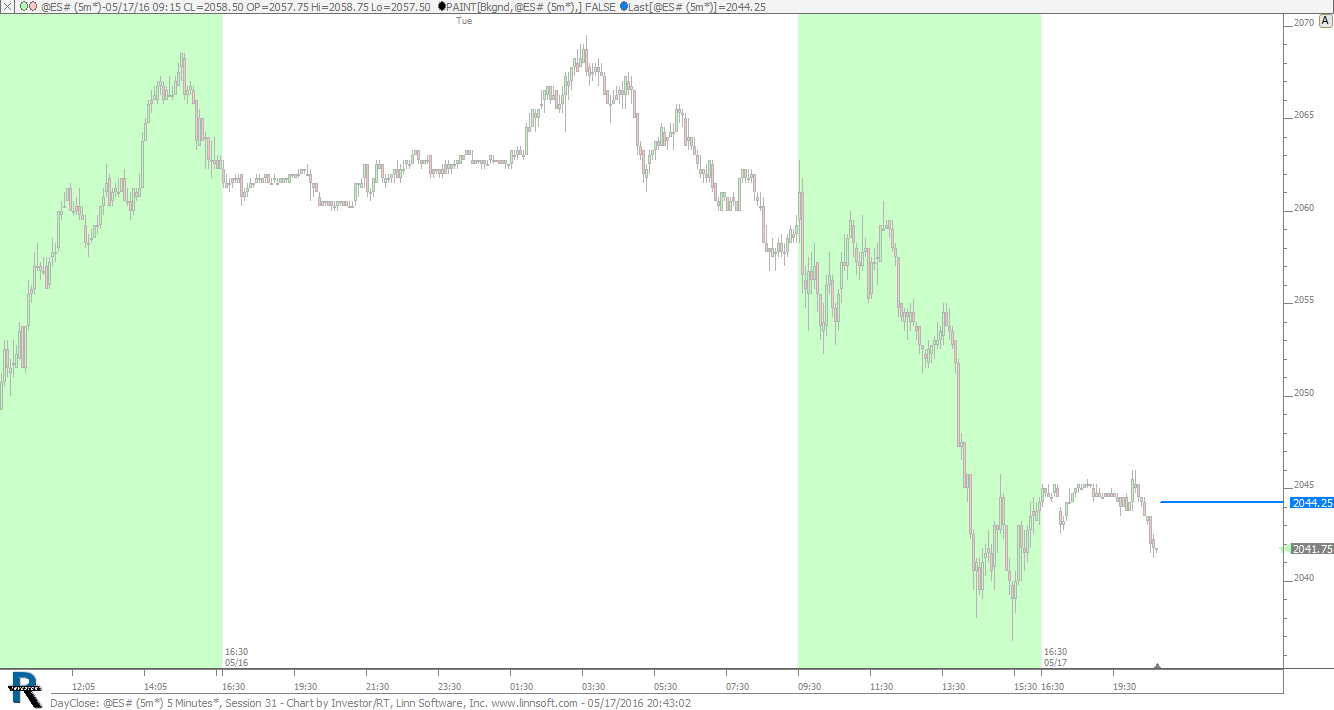 |
DayClose (@ES#) cpayne [totalcount]
10 years 1 month ago
Close. This chart was uploaded by Investor/RT 12.5.9 showing symbol: @ES#. |
View |