 |
PricePivotCountIntra (@ES#) cpayne [totalcount]
10 years 3 months ago
This chart was uploaded by Investor/RT 12.5.6 showing symbol: @ES#. |
View |
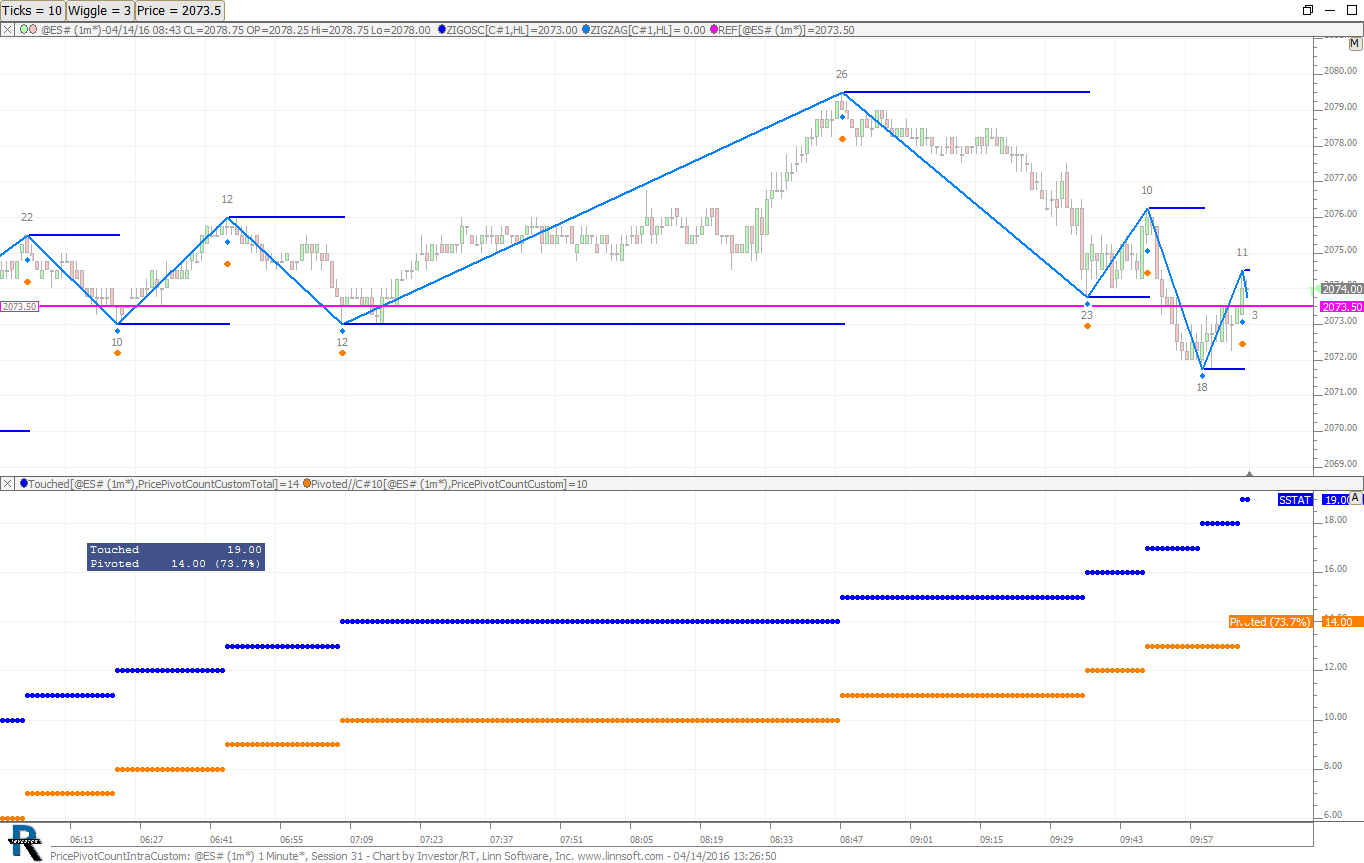 |
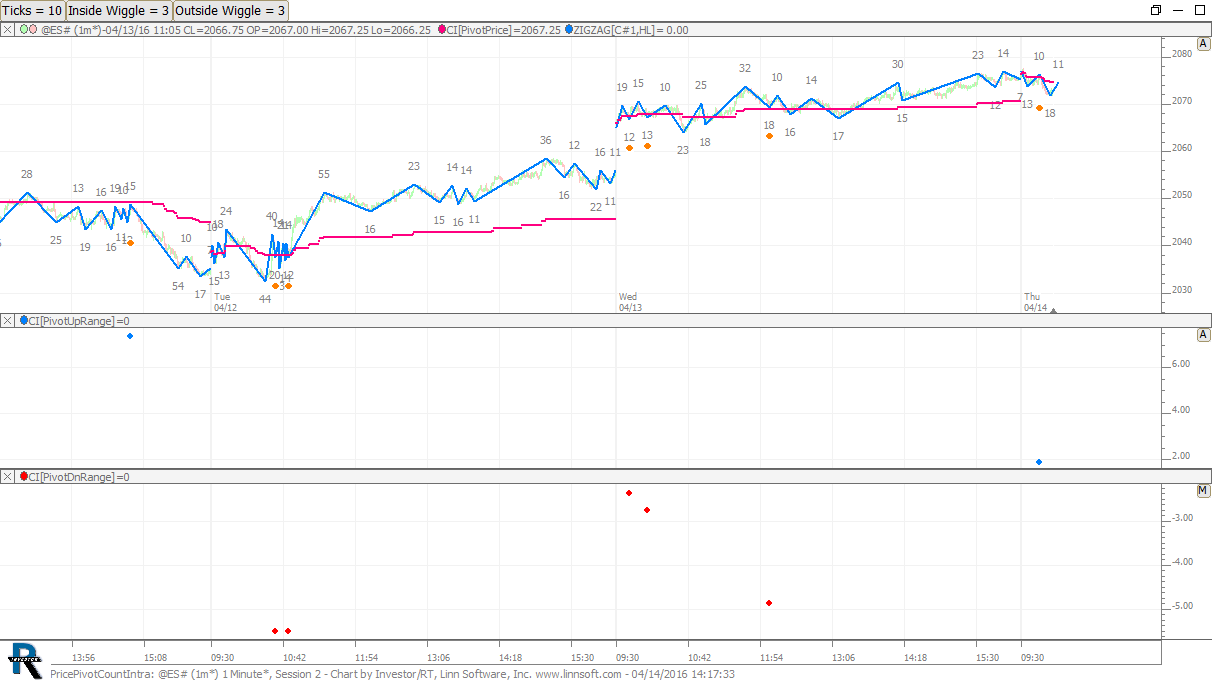
PricePivotCountIntraCustom (@ES#) cpayne [totalcount]
10 years 3 months ago
Effectiveness Measure of Pivot Price. This chart was uploaded by Investor/RT 12.5.6 showing symbol: @ES#. |
View |
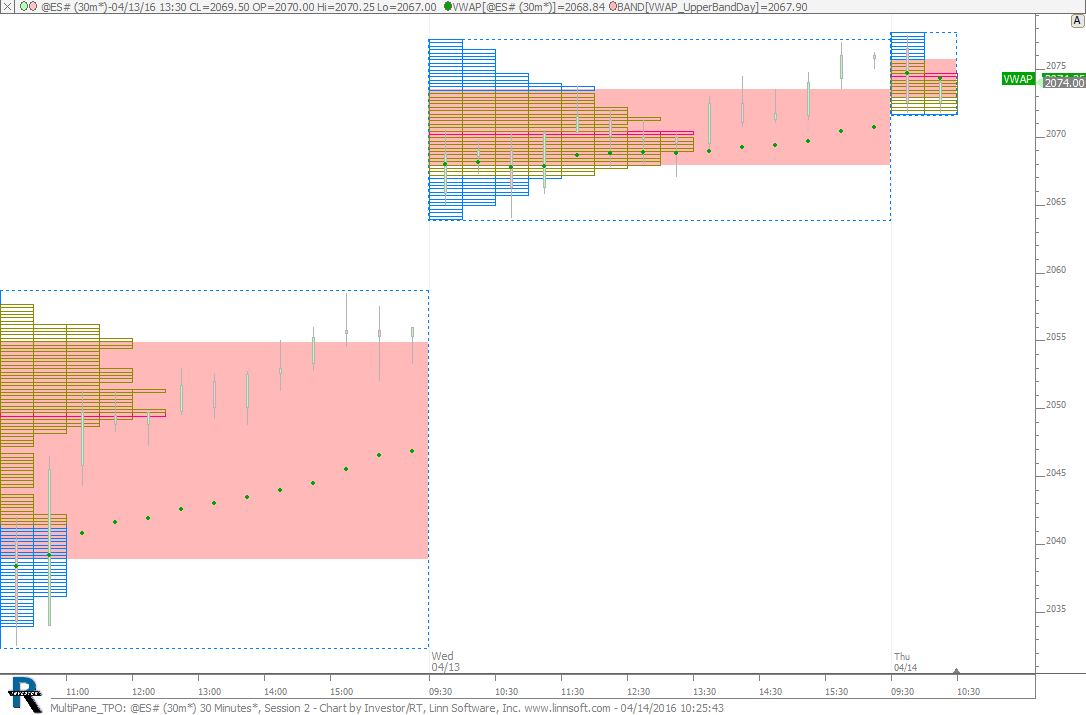 |
MultiPane TPO (@ES#) cpayne [totalcount]
10 years 3 months ago
Multi-Pane TPO. This chart was uploaded by Investor/RT 12.5.6 showing symbol: @ES#. |
View |
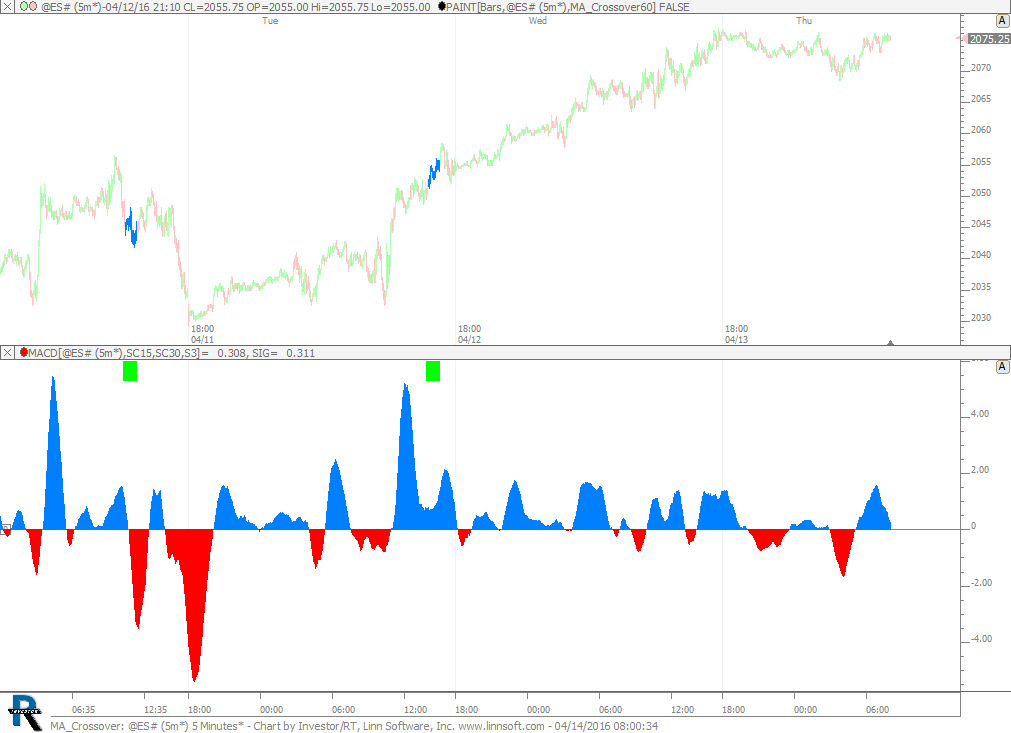 |
MA Crossover (@ES#) cpayne [totalcount]
10 years 3 months ago
MA Crossover. This chart was uploaded by Investor/RT 12.5.6 showing symbol: @ES#. |
View |
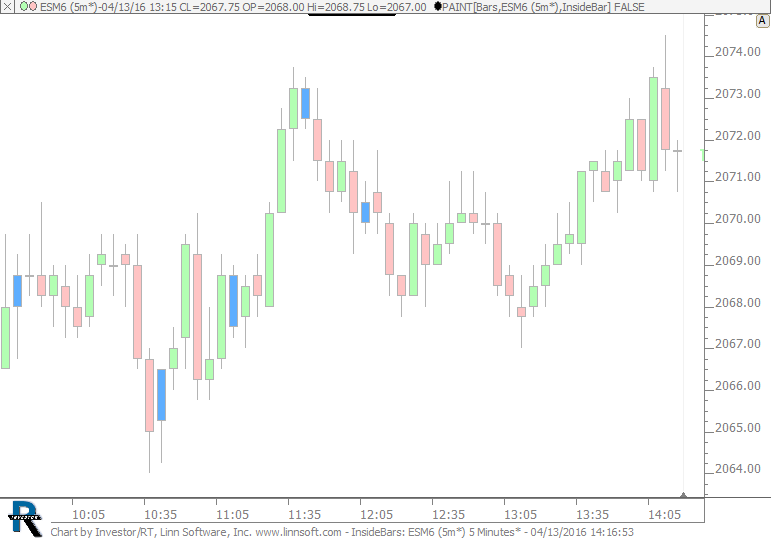 |
InsideBars (ESM6) cpayne [totalcount]
10 years 3 months ago
Inside Bars Painted. This chart was uploaded by Investor/RT 12.5.7 showing symbol: ESM6. |
View |
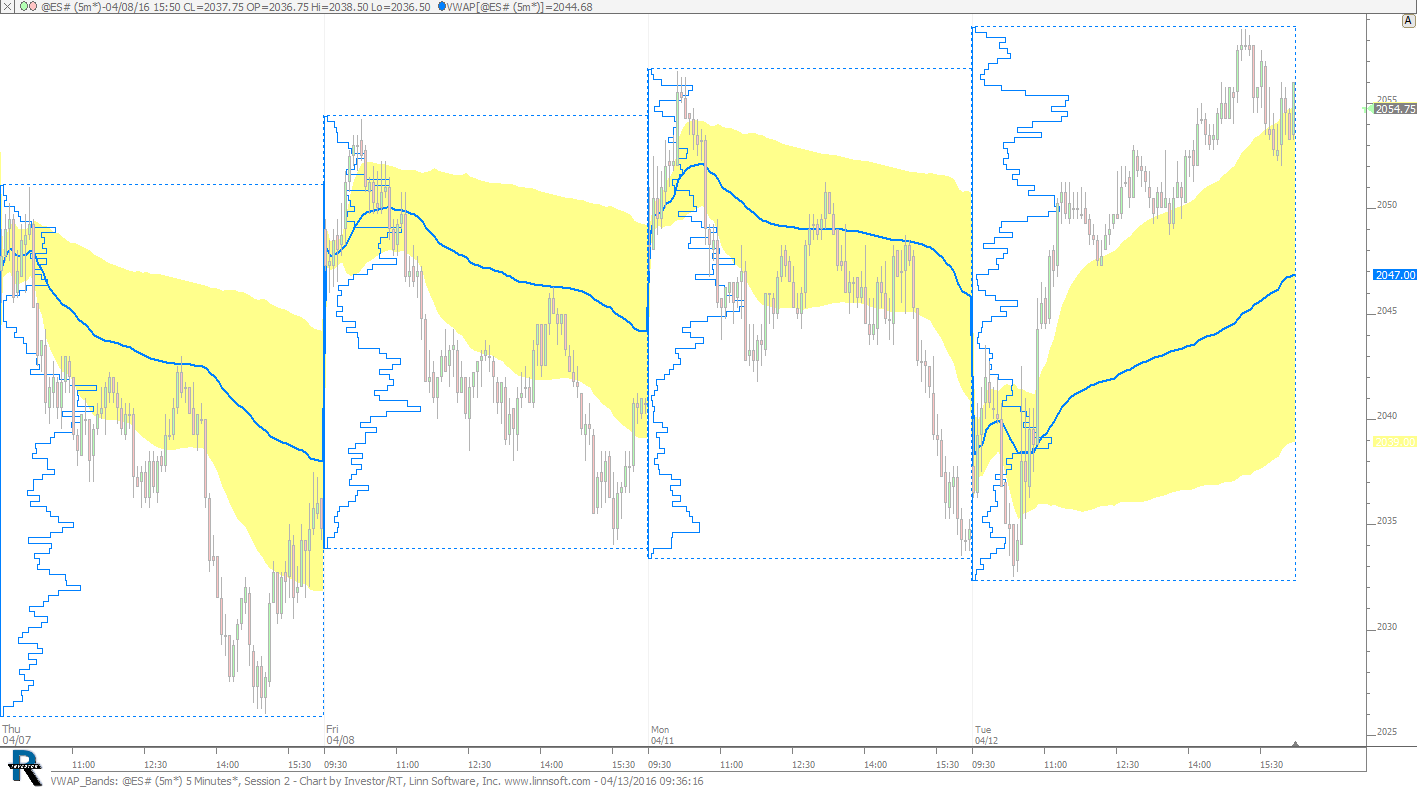 |
VWAP Bands (@ES#) cpayne [totalcount]
10 years 3 months ago
VWAP Bands on Profile Indicator. This chart was uploaded by Investor/RT 12.5.6 showing symbol: @ES#. |
View |
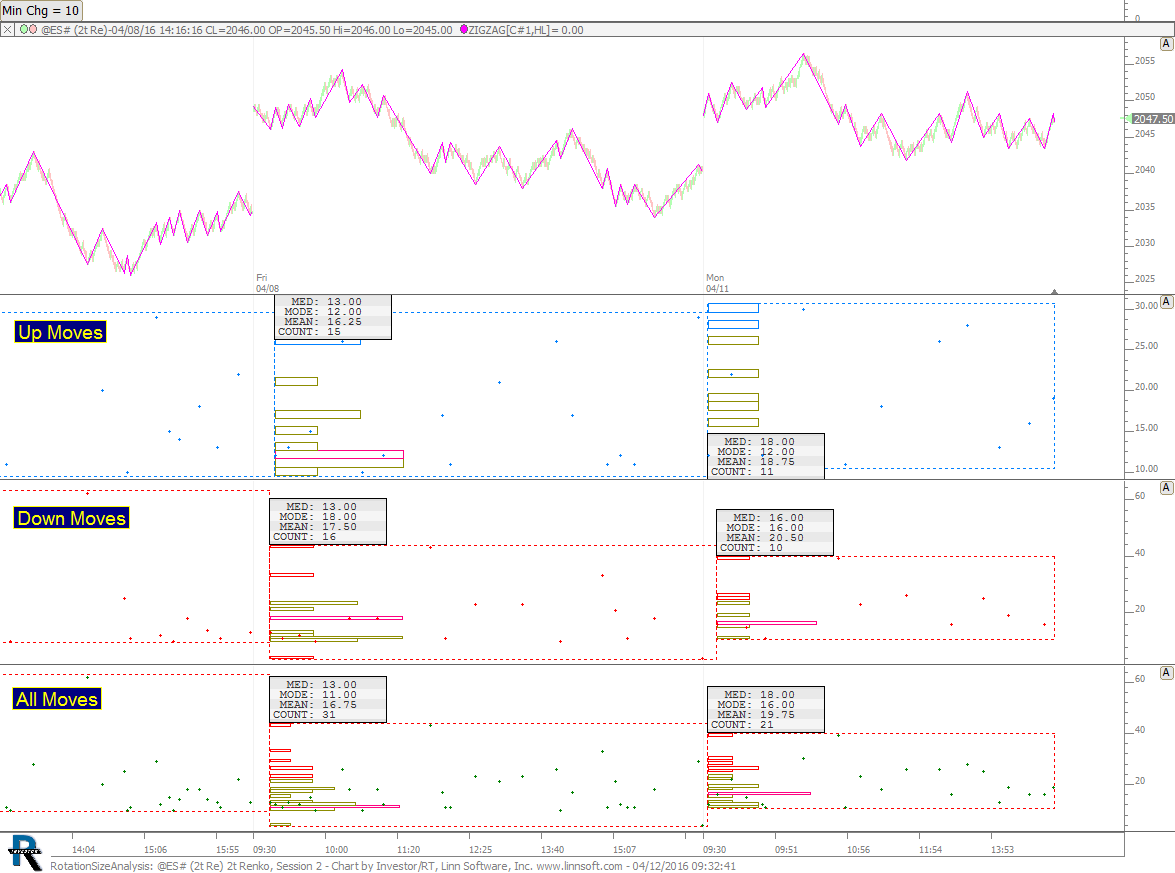 |
RotationSizeAnalysis (@ES#) 3 cpayne [totalcount]
10 years 3 months ago
Rotation Size Analysis: Up Moves, Down Moves, All Moves. Use button at top to adjust min size of moves in ticks. |
View |
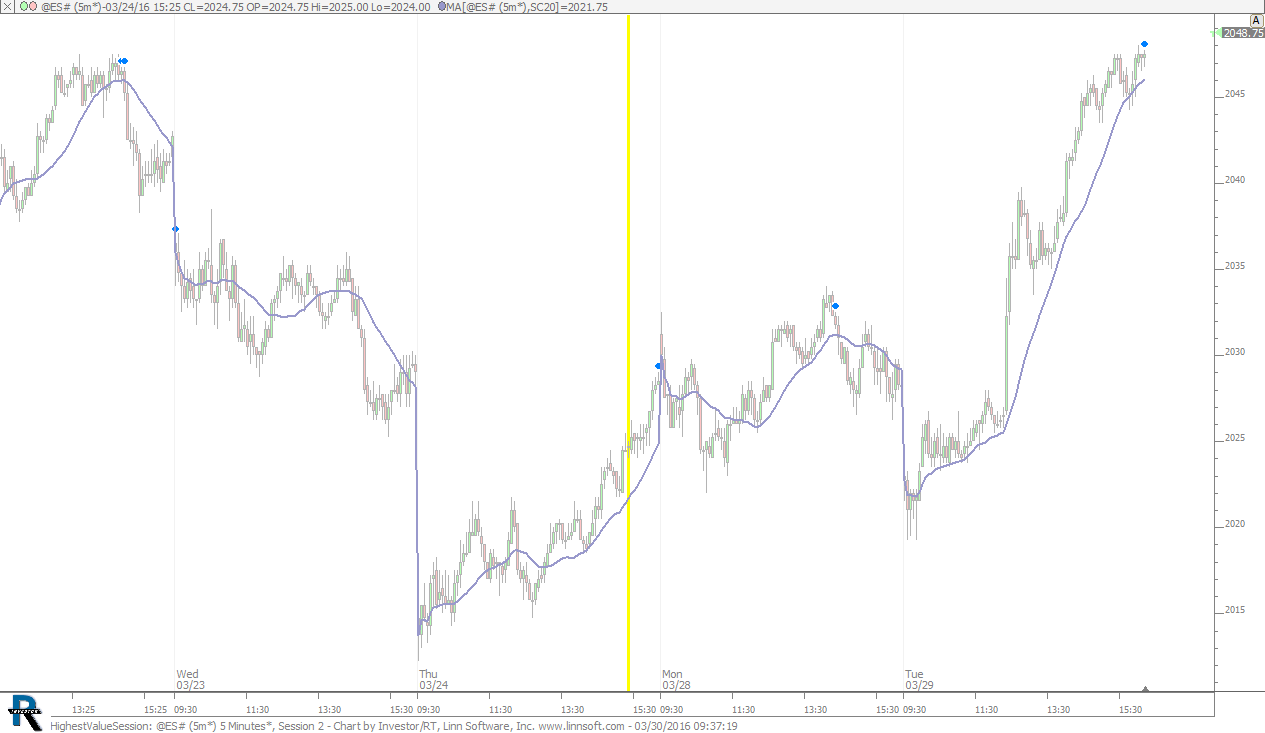 |
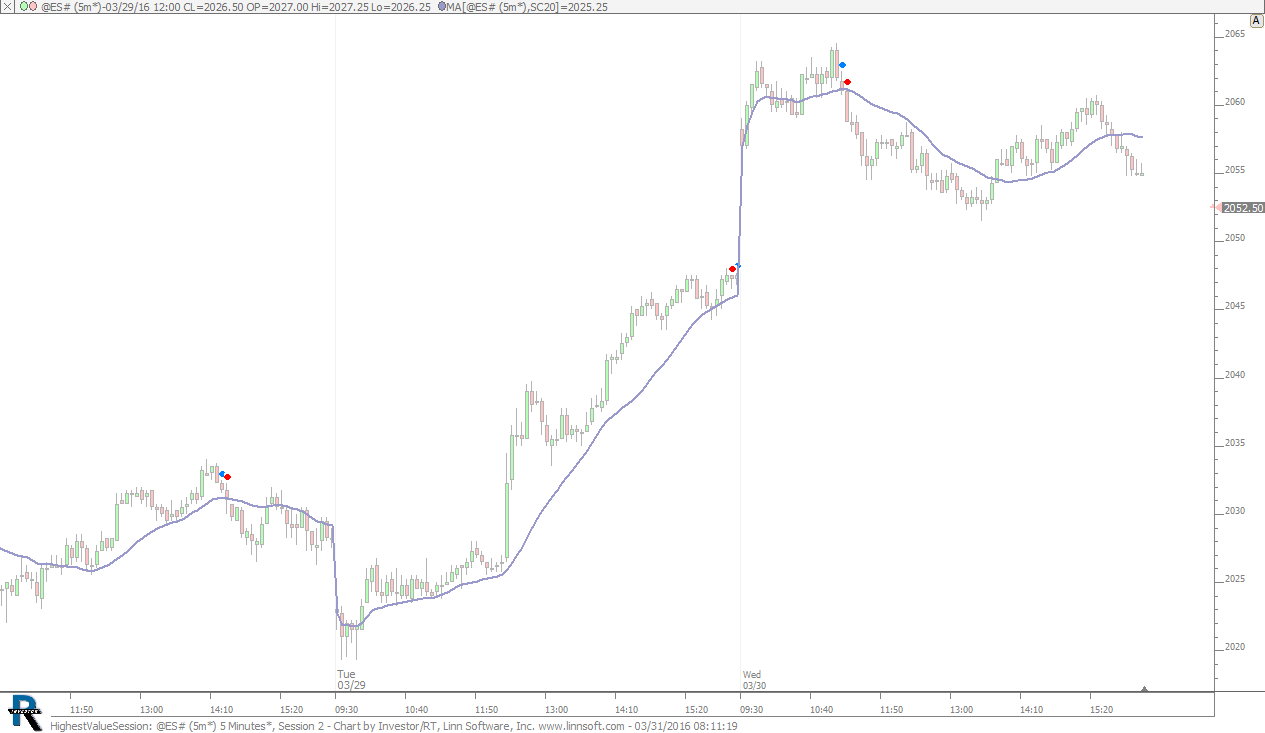
HighestValueSession (@ES#) cpayne [totalcount]
10 years 3 months ago
Highest Value of Session. This chart was uploaded by Investor/RT showing symbol: @ES#. |
View |
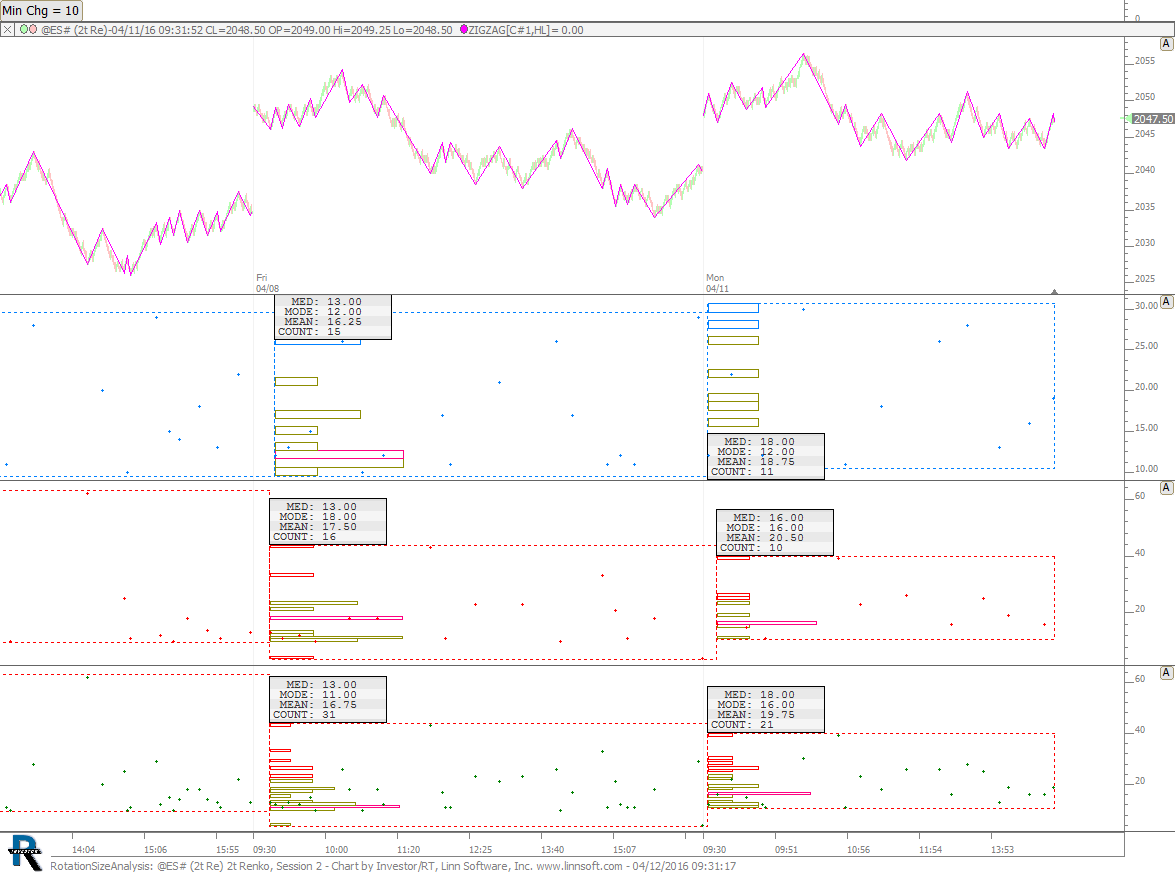 |
RotationSizeAnalysis (@ES#) 2 cpayne [totalcount]
10 years 3 months ago
Rotation Size Analysis. This chart was uploaded by Investor/RT 12.5.6 showing symbol: @ES#. |
View |
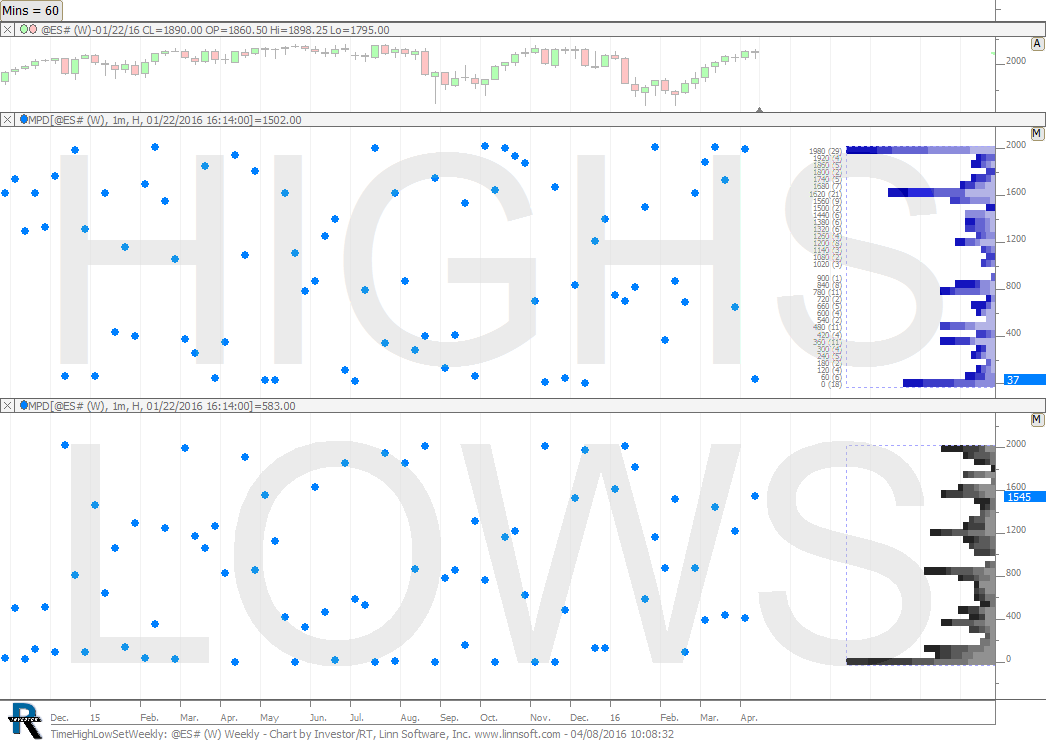 |
TimeHighLowSetWeekly (@ES#) 2 cpayne [totalcount]
10 years 3 months ago
Time into Week new high or low was formed (number of minutes - 405 min per session). This chart was uploaded by Investor/RT 12.5.5 showing symbol: @ES#. |
View |
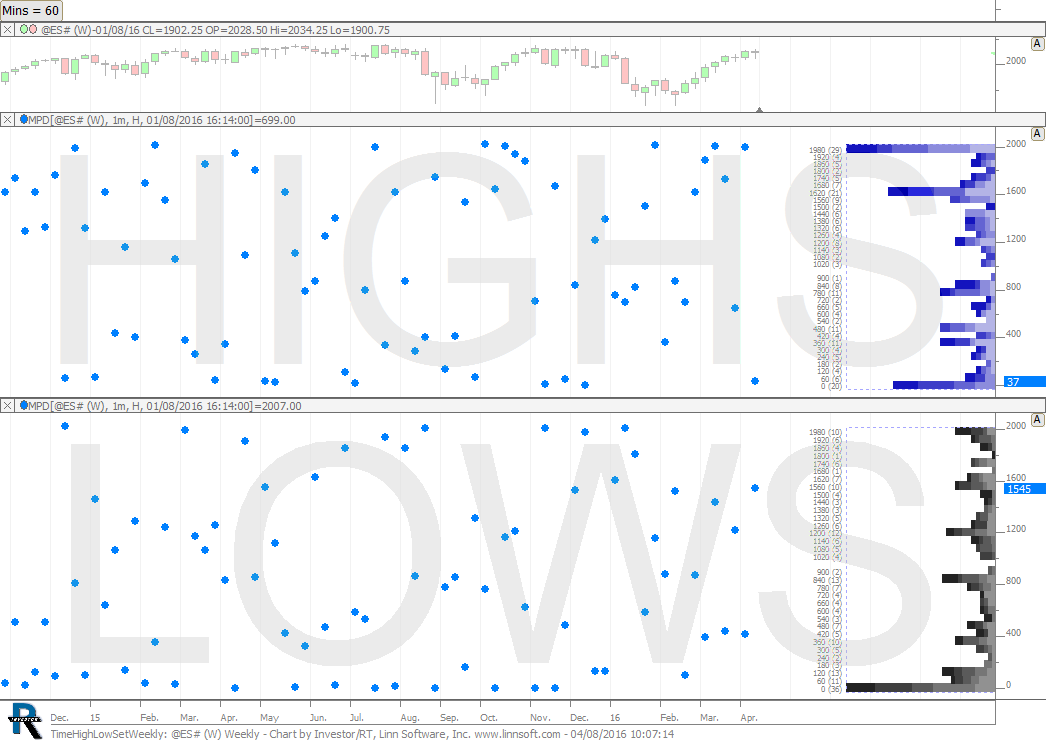 |
TimeHighLowSetWeekly (@ES#) cpayne [totalcount]
10 years 3 months ago
Time into Week new high or low was formed (number of minutes - 405 min per session). This chart was uploaded by Investor/RT 12.5.5 showing symbol: @ES#. |
View |
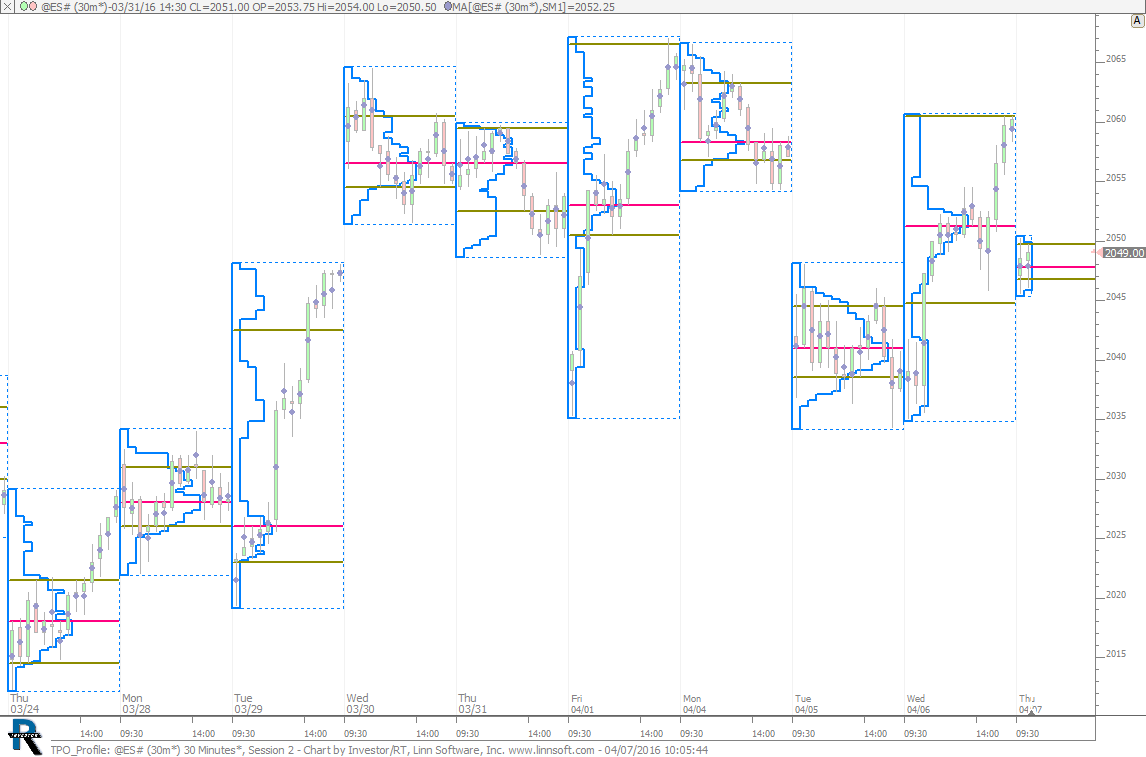 |
TPO Profile (@ES#) cpayne [totalcount]
10 years 3 months ago
TPO Profile Emulation. This chart was uploaded by Investor/RT 12.5.5 showing symbol: @ES#. |
View |
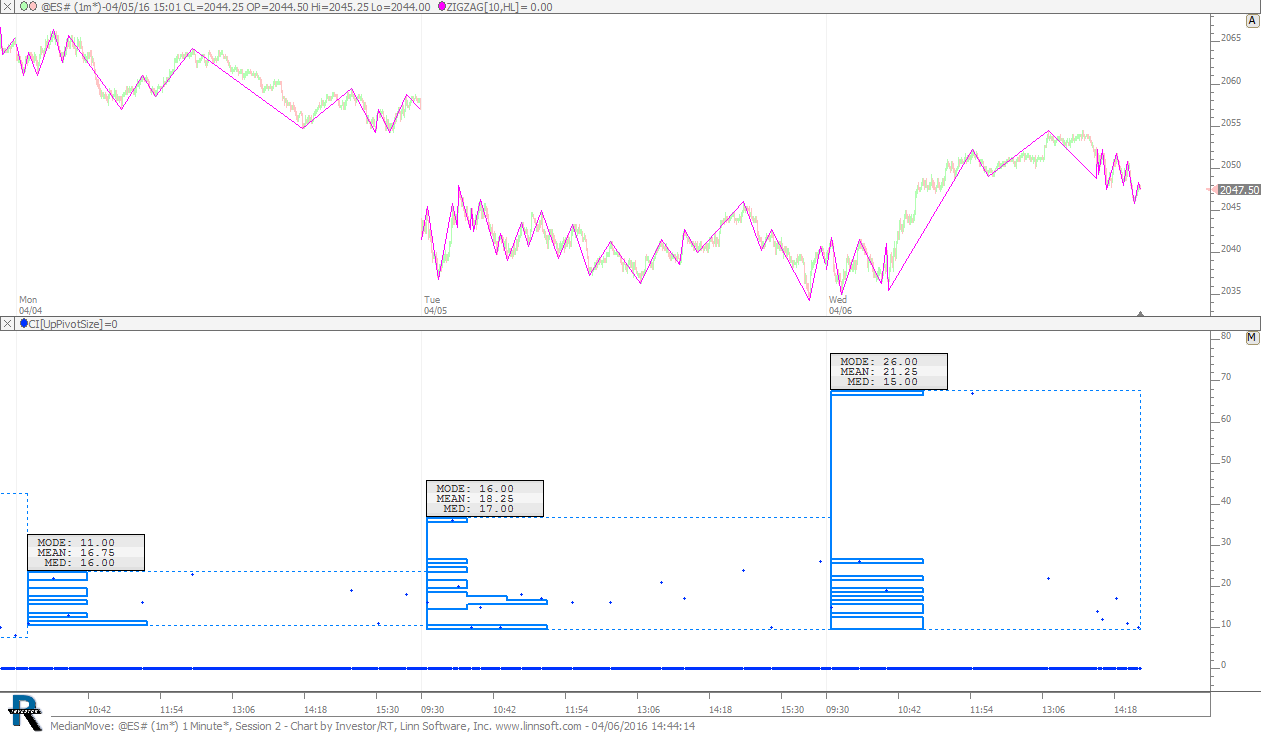 |
MedianMove (@ES#) cpayne [totalcount]
10 years 3 months ago
Median of Moves within a day. This chart was uploaded by Investor/RT 12.5.5 showing symbol: @ES#. |
View |
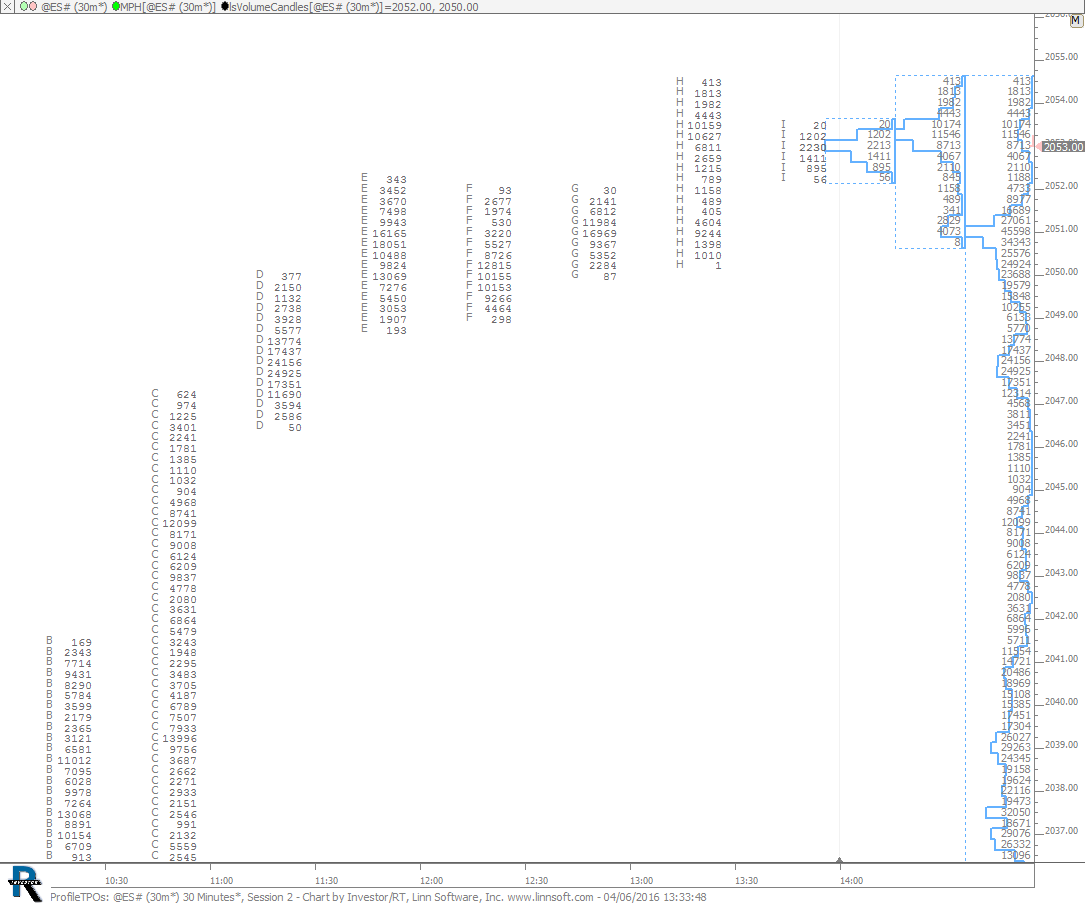 |
ProfileTPOs (@ES#) cpayne [totalcount]
10 years 3 months ago
TPO Profile chart using Profile Indicator. This chart was uploaded by Investor/RT 12.5.5 showing symbol: @ES#. |
View |
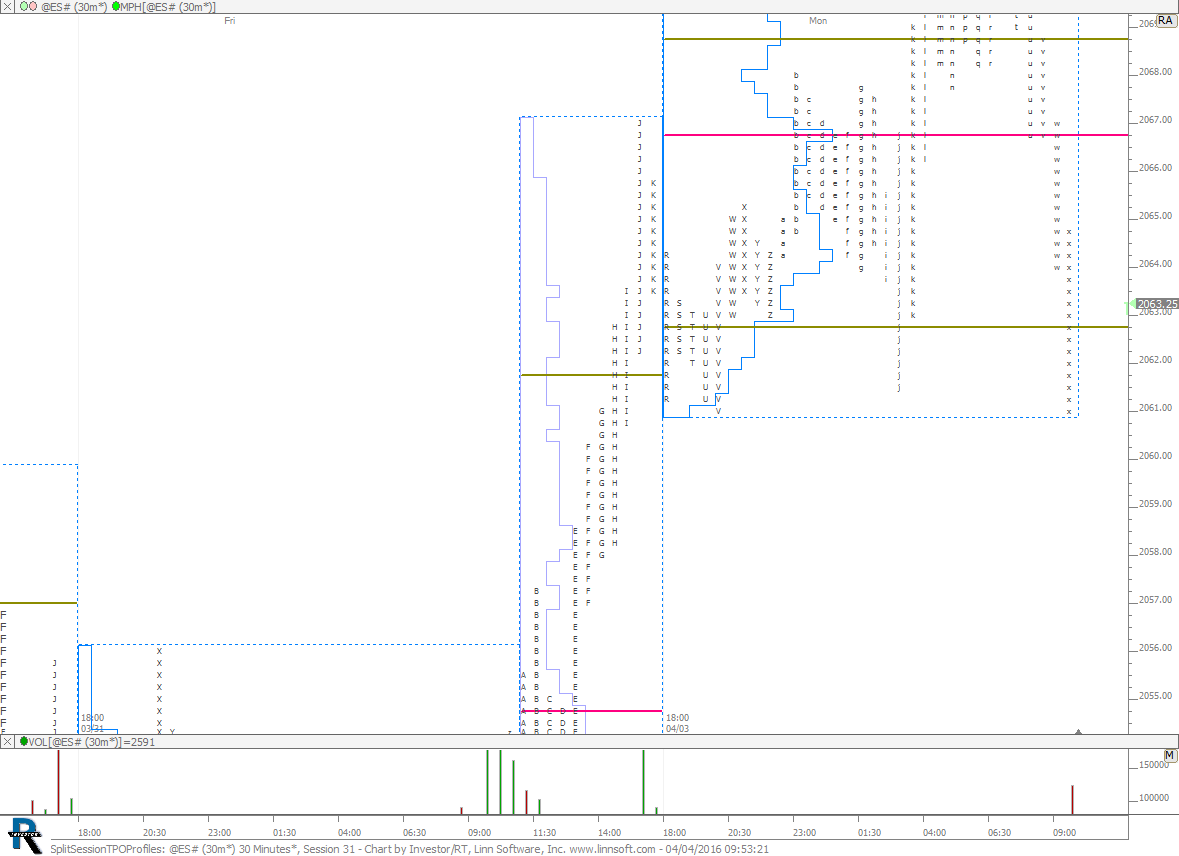 |
SplitSessionTPOProfiles (@ES#) 3 cpayne [totalcount]
10 years 3 months ago
TPO Profiles last 2000 days on ES. Split Session. This chart was uploaded by Investor/RT 12.5.5 showing symbol: @ES#. |
View |
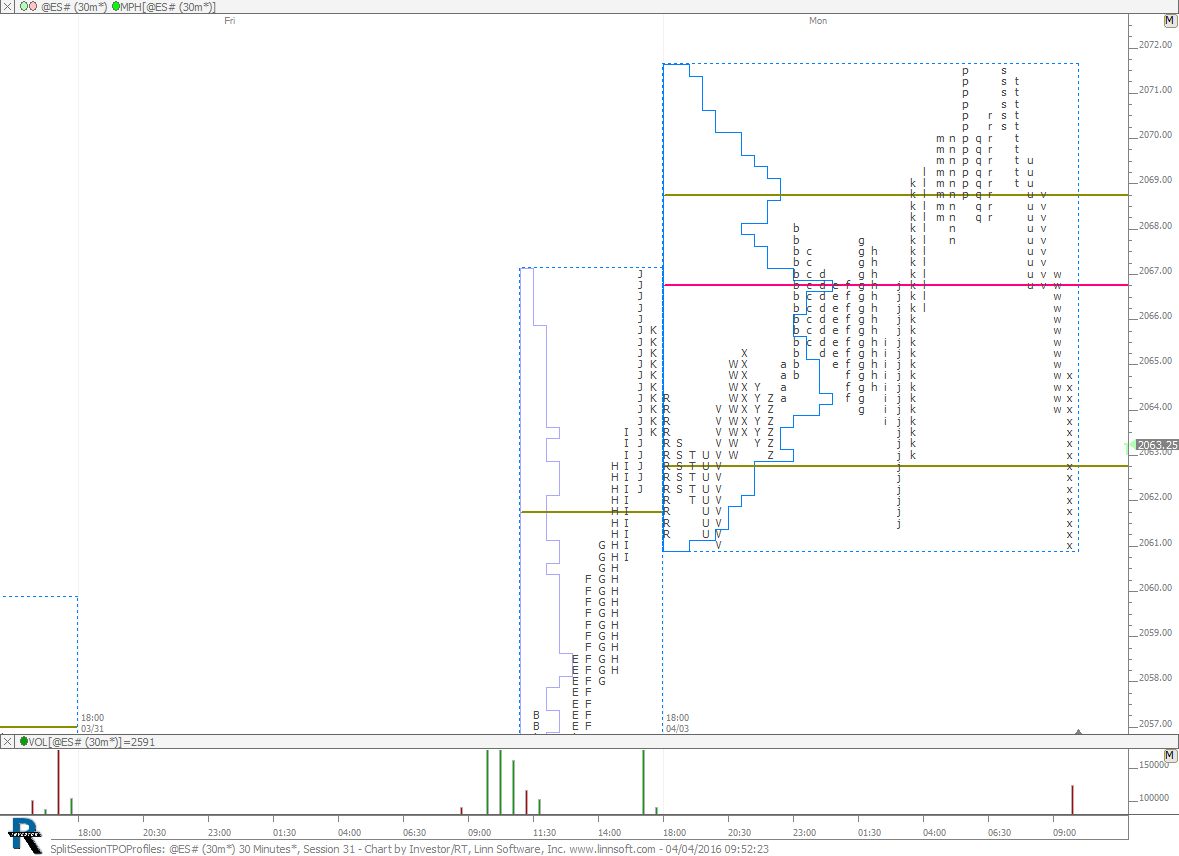 |
SplitSessionTPOProfiles (@ES#) 2 cpayne [totalcount]
10 years 3 months ago
TPO Profiles last 2000 days on ES. Split Session. This chart was uploaded by Investor/RT 12.5.5 showing symbol: @ES#. |
View |
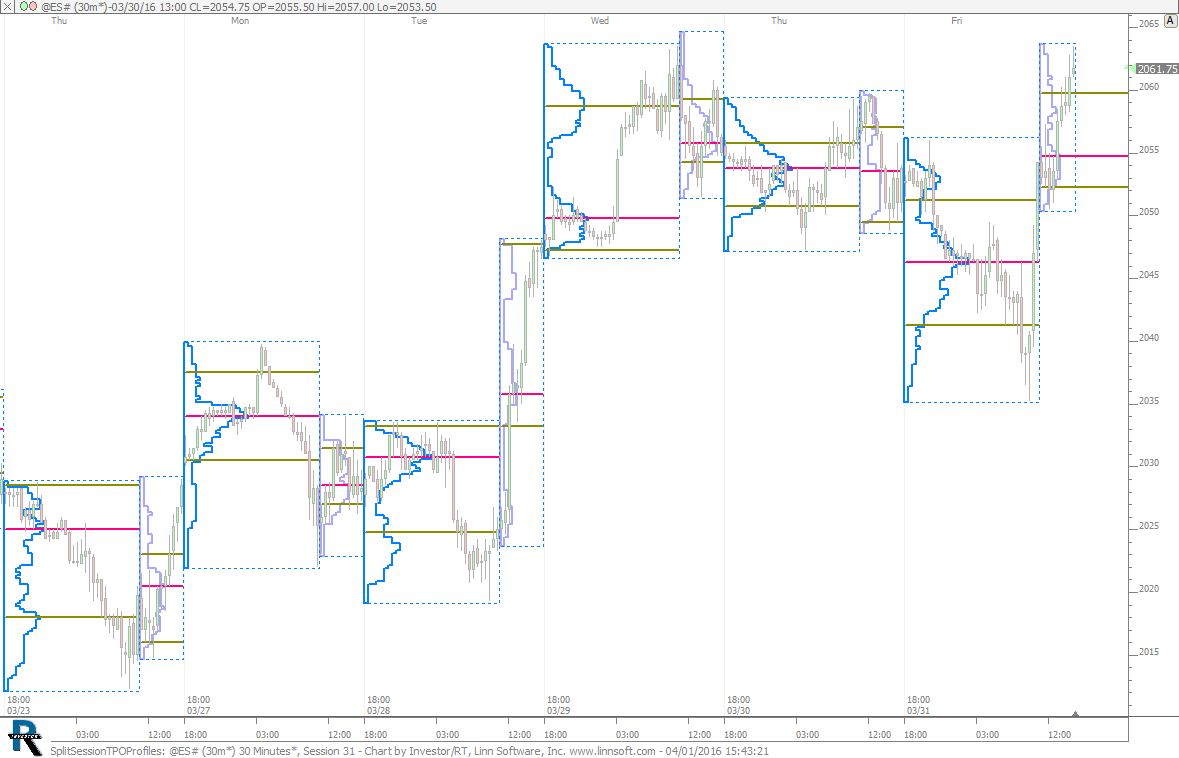 |
SplitSessionTPOProfiles (@ES#) cpayne [totalcount]
10 years 3 months ago
TPO Profiles last 2000 days on ES. Split Session. This chart was uploaded by Investor/RT 12.5.1 showing symbol: @ES#. |
View |
 |
HighestValueSession (@ES#) 2 cpayne [totalcount]
10 years 3 months ago
Second Highest Value of Session. This chart was uploaded by Investor/RT showing symbol: @ES#. |
View |
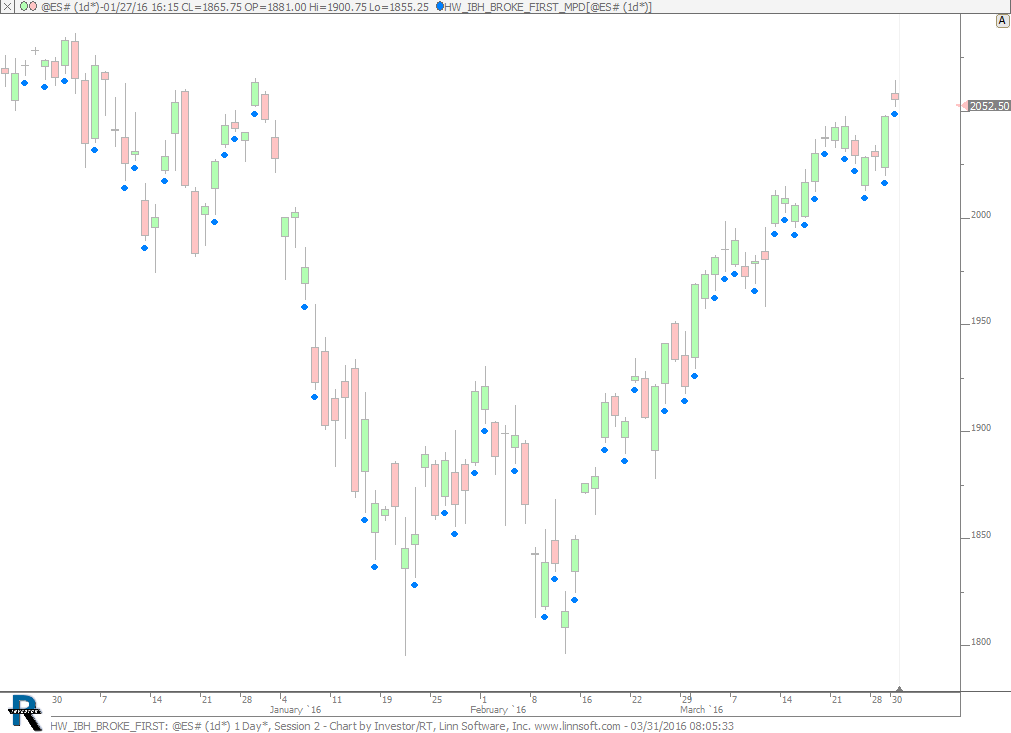 |
HW IBH BROKE FIRST (@ES#) cpayne [totalcount]
10 years 3 months ago
Homework - IBH Broken First. This chart was uploaded by Investor/RT showing symbol: @ES#. |
View |
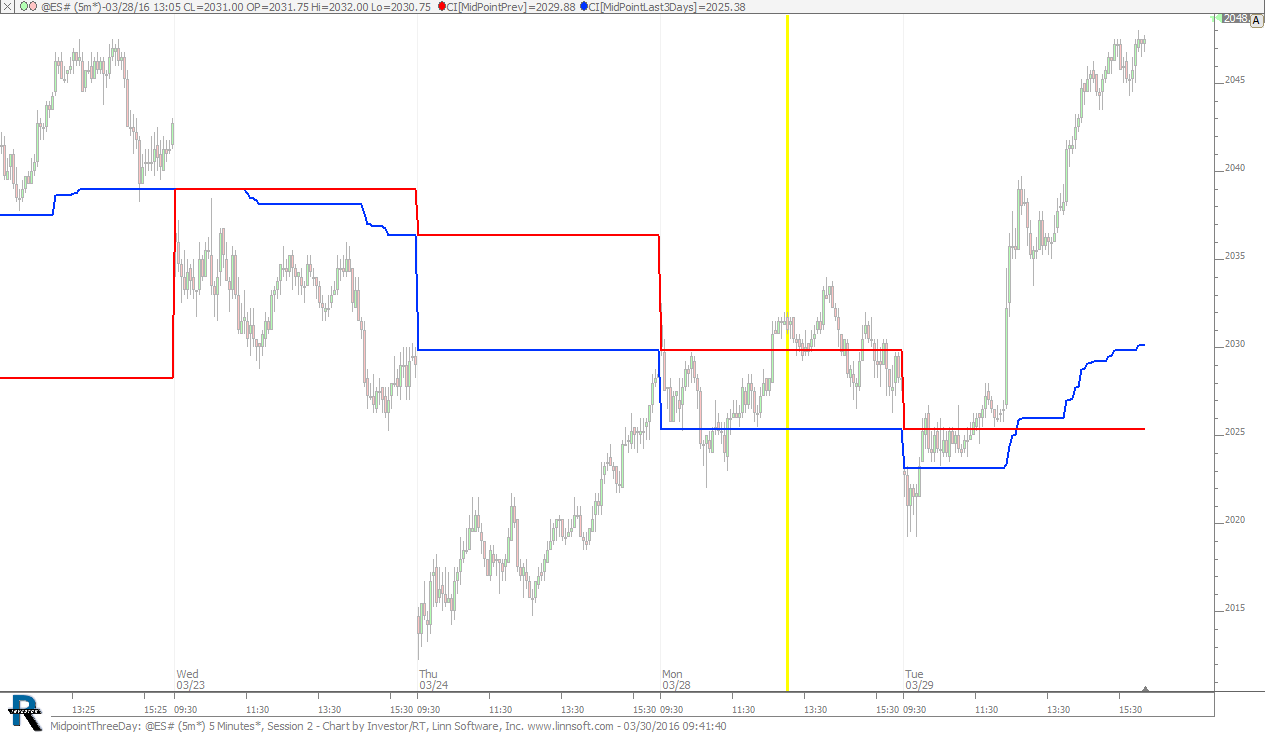 |
MidpointThreeDay (@ES#) cpayne [totalcount]
10 years 3 months ago
Midpoint Last 3 Days. This chart was uploaded by Investor/RT showing symbol: @ES#. |
View |
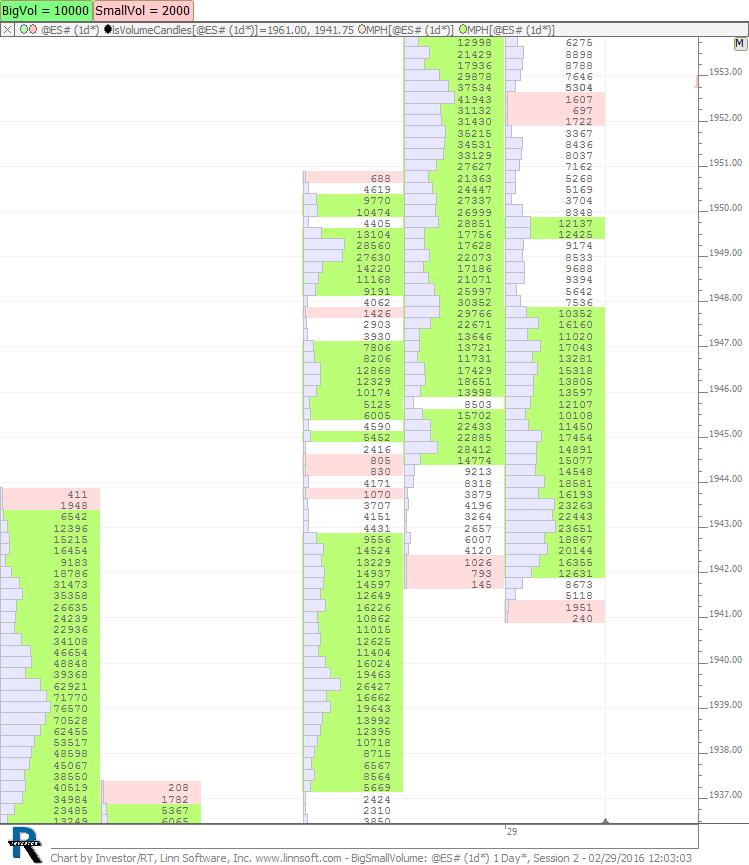 |
Untitled (@ES#) cpayne [totalcount]
10 years 4 months ago
This chart was uploaded by Investor/RT on Mon, 02/29/2016 - 12:03 showing symbol: @ES#. Created by Chad Payne. |
View |
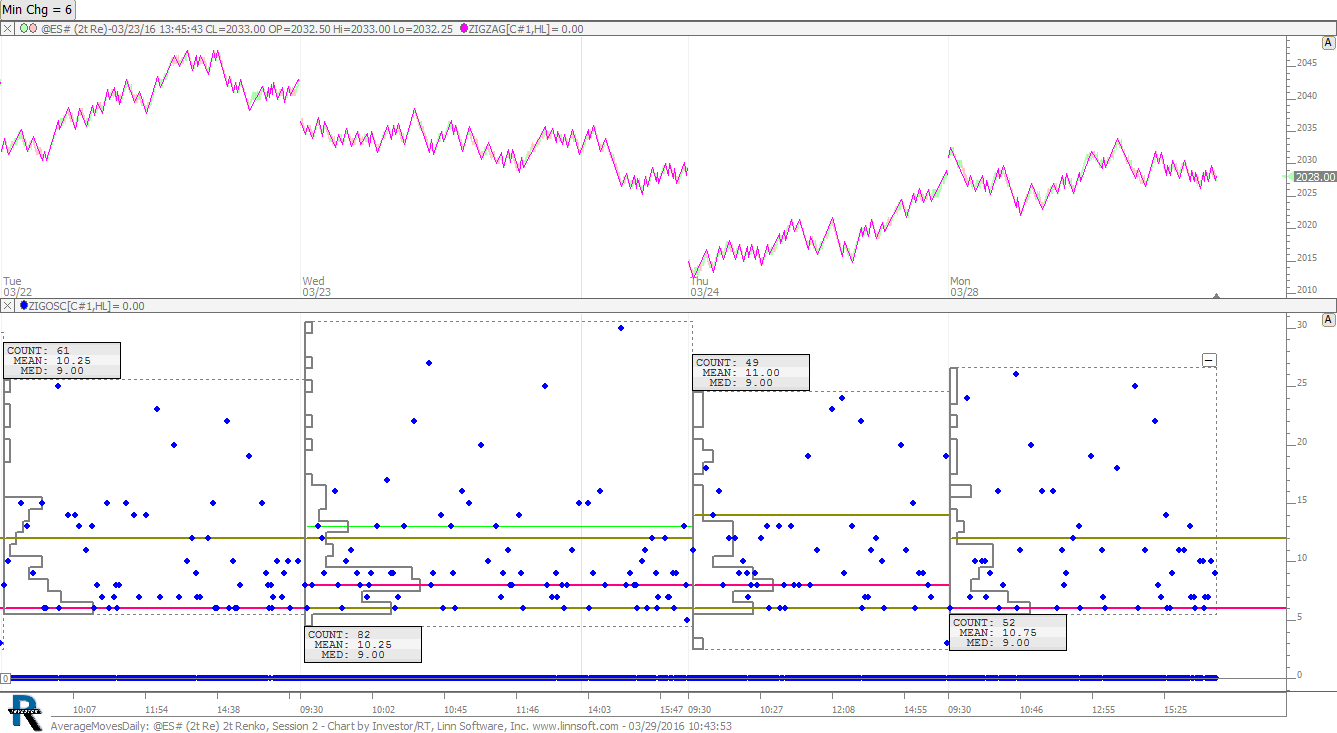 |
AverageMovesDaily (@ES#) cpayne [totalcount]
10 years 3 months ago
Average Moves Daily. This chart was uploaded by Investor/RT showing symbol: @ES#. |
View |
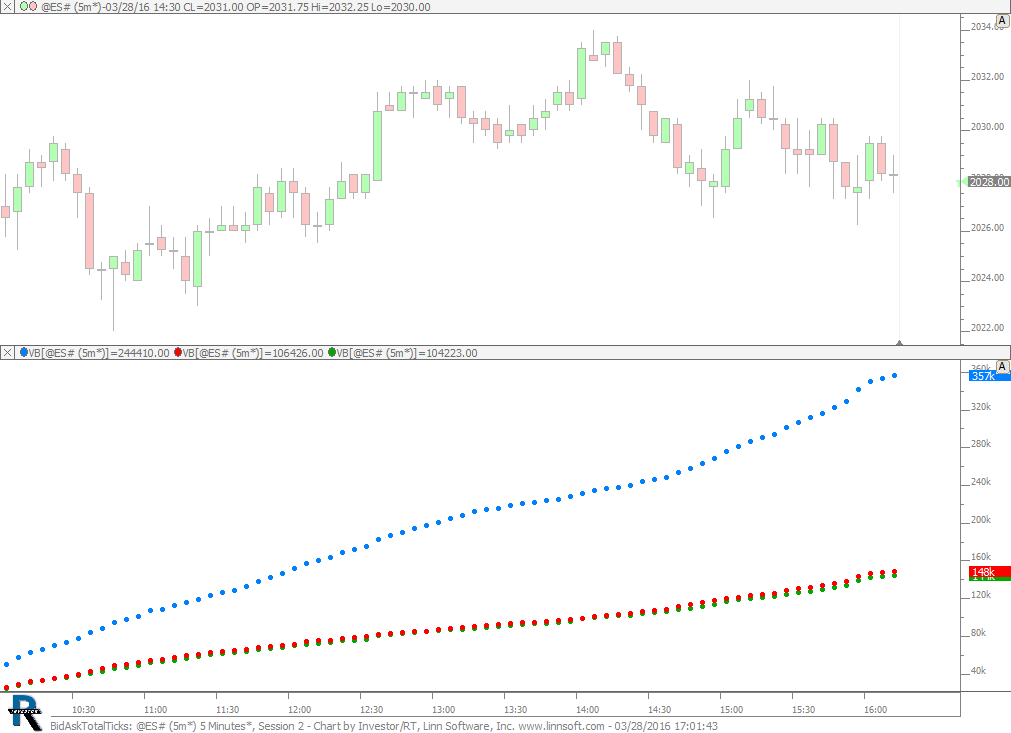 |
BidAskTotalTicks (@ES#) cpayne [totalcount]
10 years 3 months ago
Sum of Trades at Bid, Ask, Total. This chart was uploaded by Investor/RT showing symbol: @ES#. |
View |
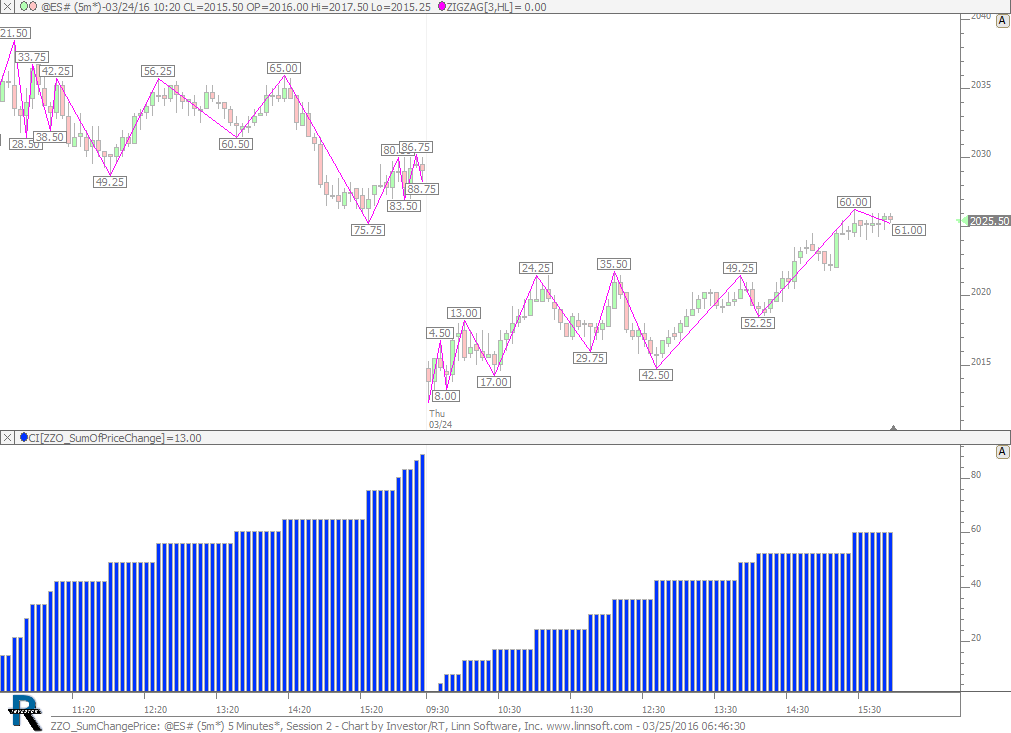 |
ZZOSumChangePrice (@ES#) cpayne [totalcount]
10 years 3 months ago
Sum of Change In Price of Zig Zag. This chart was uploaded by Investor/RT on Fri, 03/25/2016 - 06:46 showing symbol: @ES#. |
View |
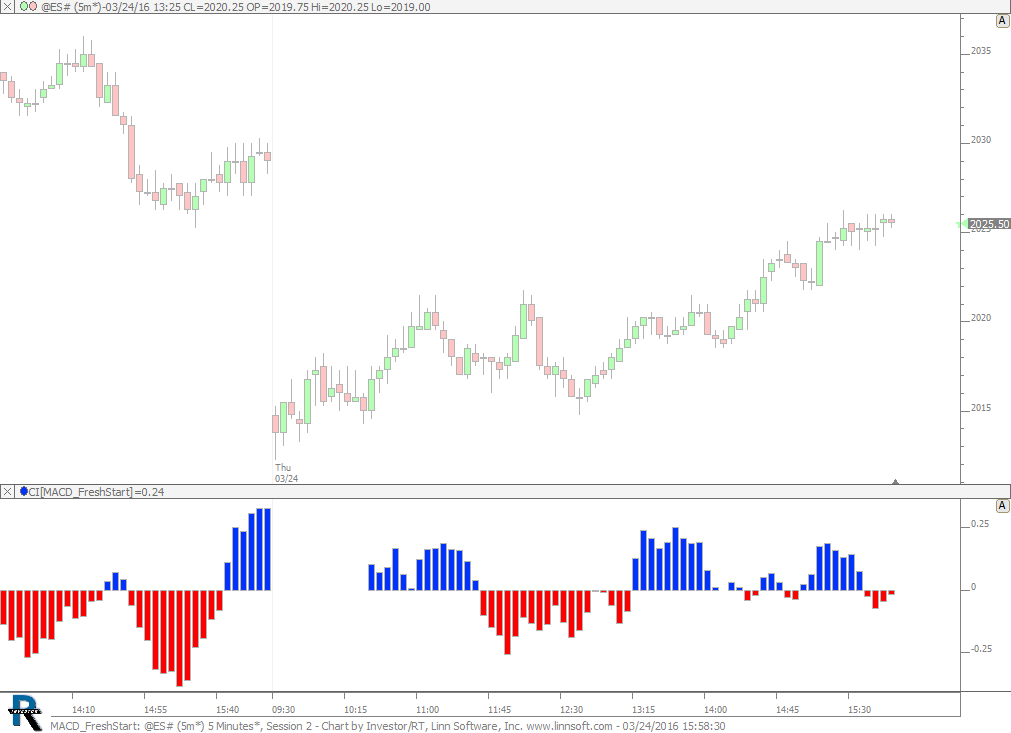 |
MACDFreshStart (@ES#) cpayne [totalcount]
10 years 3 months ago
MACD Fresh Start. This chart was uploaded by Investor/RT on Thu, 03/24/2016 - 15:58 showing symbol: @ES#. |
View |