 |
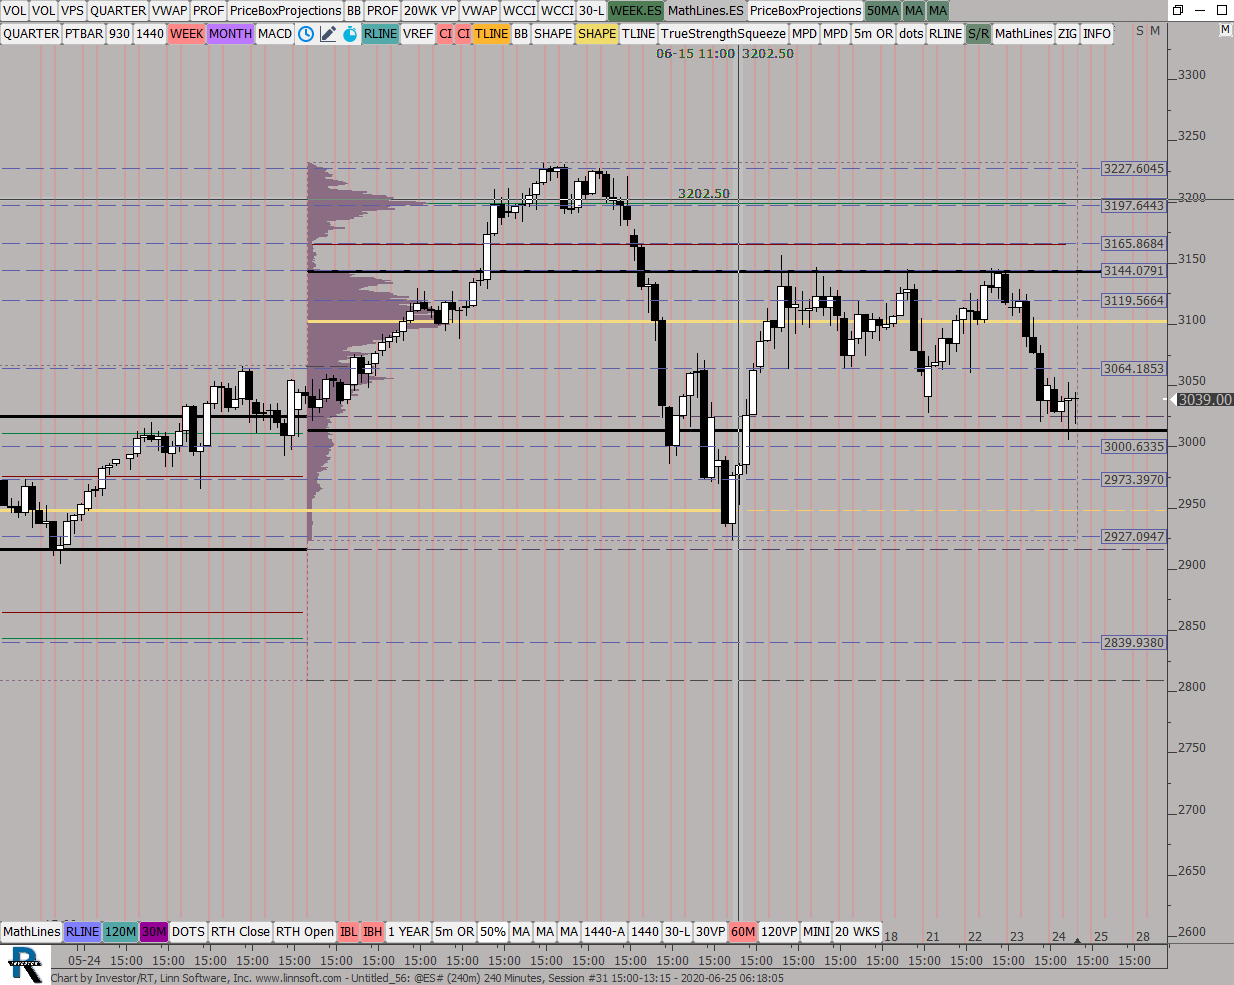
Untitled (@ES#) 5 ES42 [totalcount]
5 years 5 months ago
This chart was uploaded by Investor/RT 13.3.4 showing symbol: @ES#. |
View |
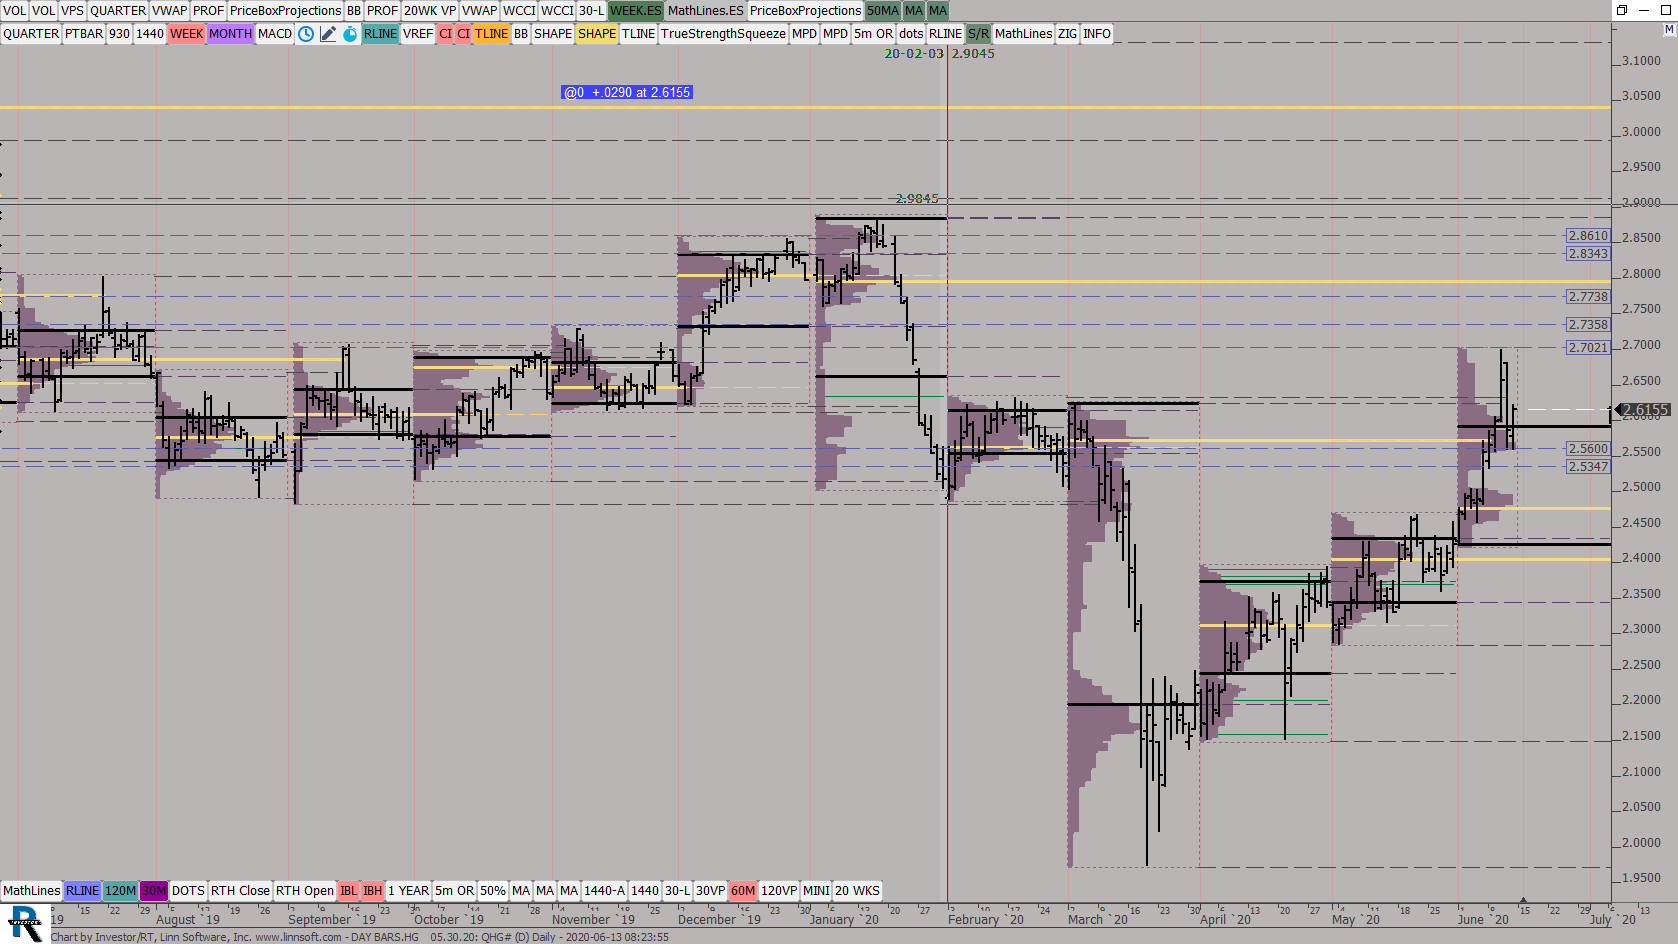 |
DAY BARSHG (QHG#) ES42 [totalcount]
5 years 6 months ago
Monthly Ptofiles 2 hour Candles. This chart was uploaded by Investor/RT 13.6.15 showing symbol: QHG#. |
View |
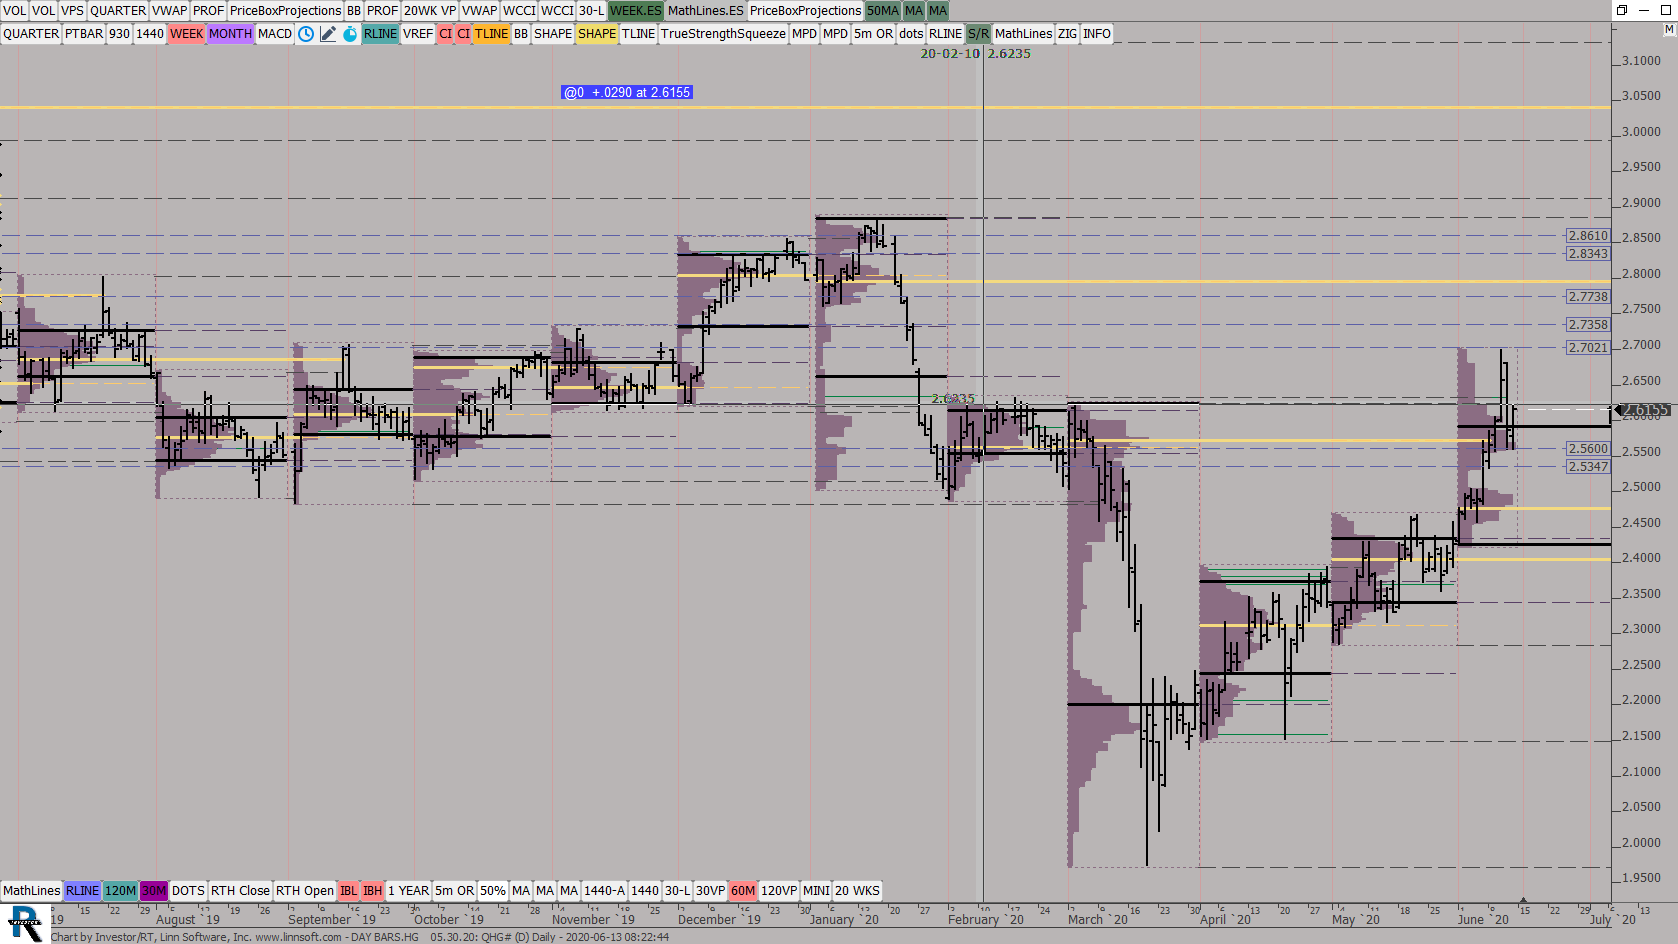 |
DAY BARSHG (QHG#) ES42 [totalcount]
5 years 6 months ago
Monthly Ptofiles 2 hour Candles. This chart was uploaded by Investor/RT 13.6.15 showing symbol: QHG#. |
View |
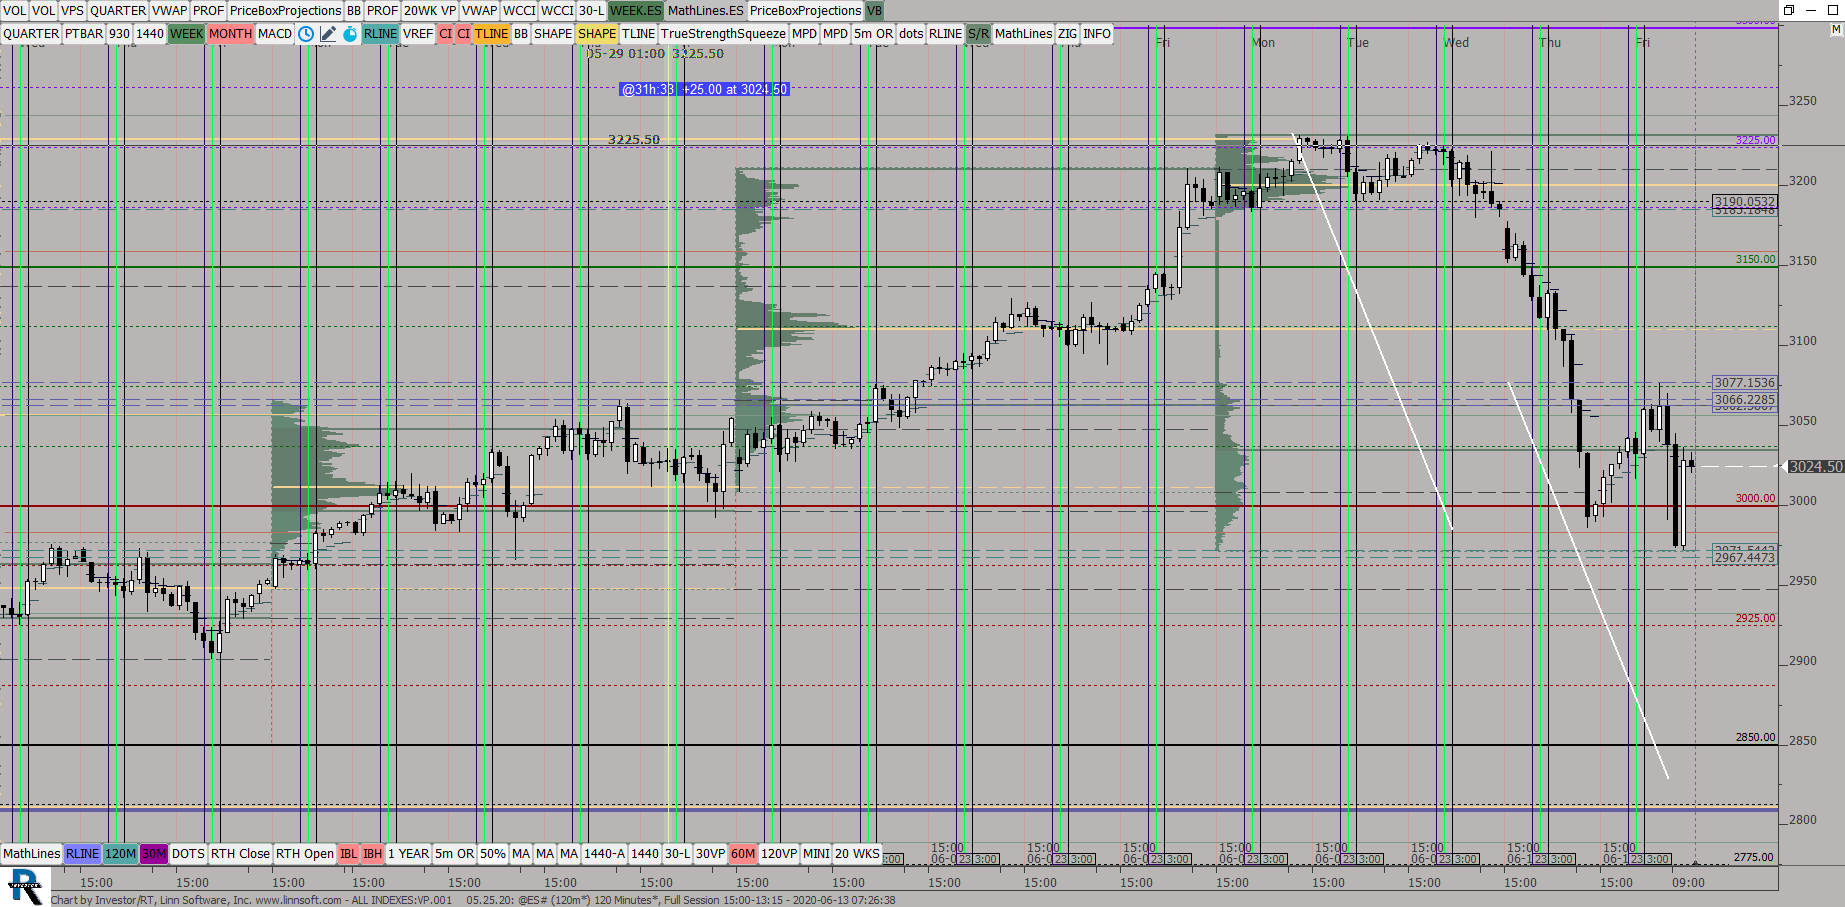 |
ALL INDEXESVP001 (@ES#) ES42 [totalcount]
5 years 6 months ago
Weekly Profiles, 120 Min Candles. This chart was uploaded by Investor/RT 13.6.15 showing symbol: @ES#. |
View |
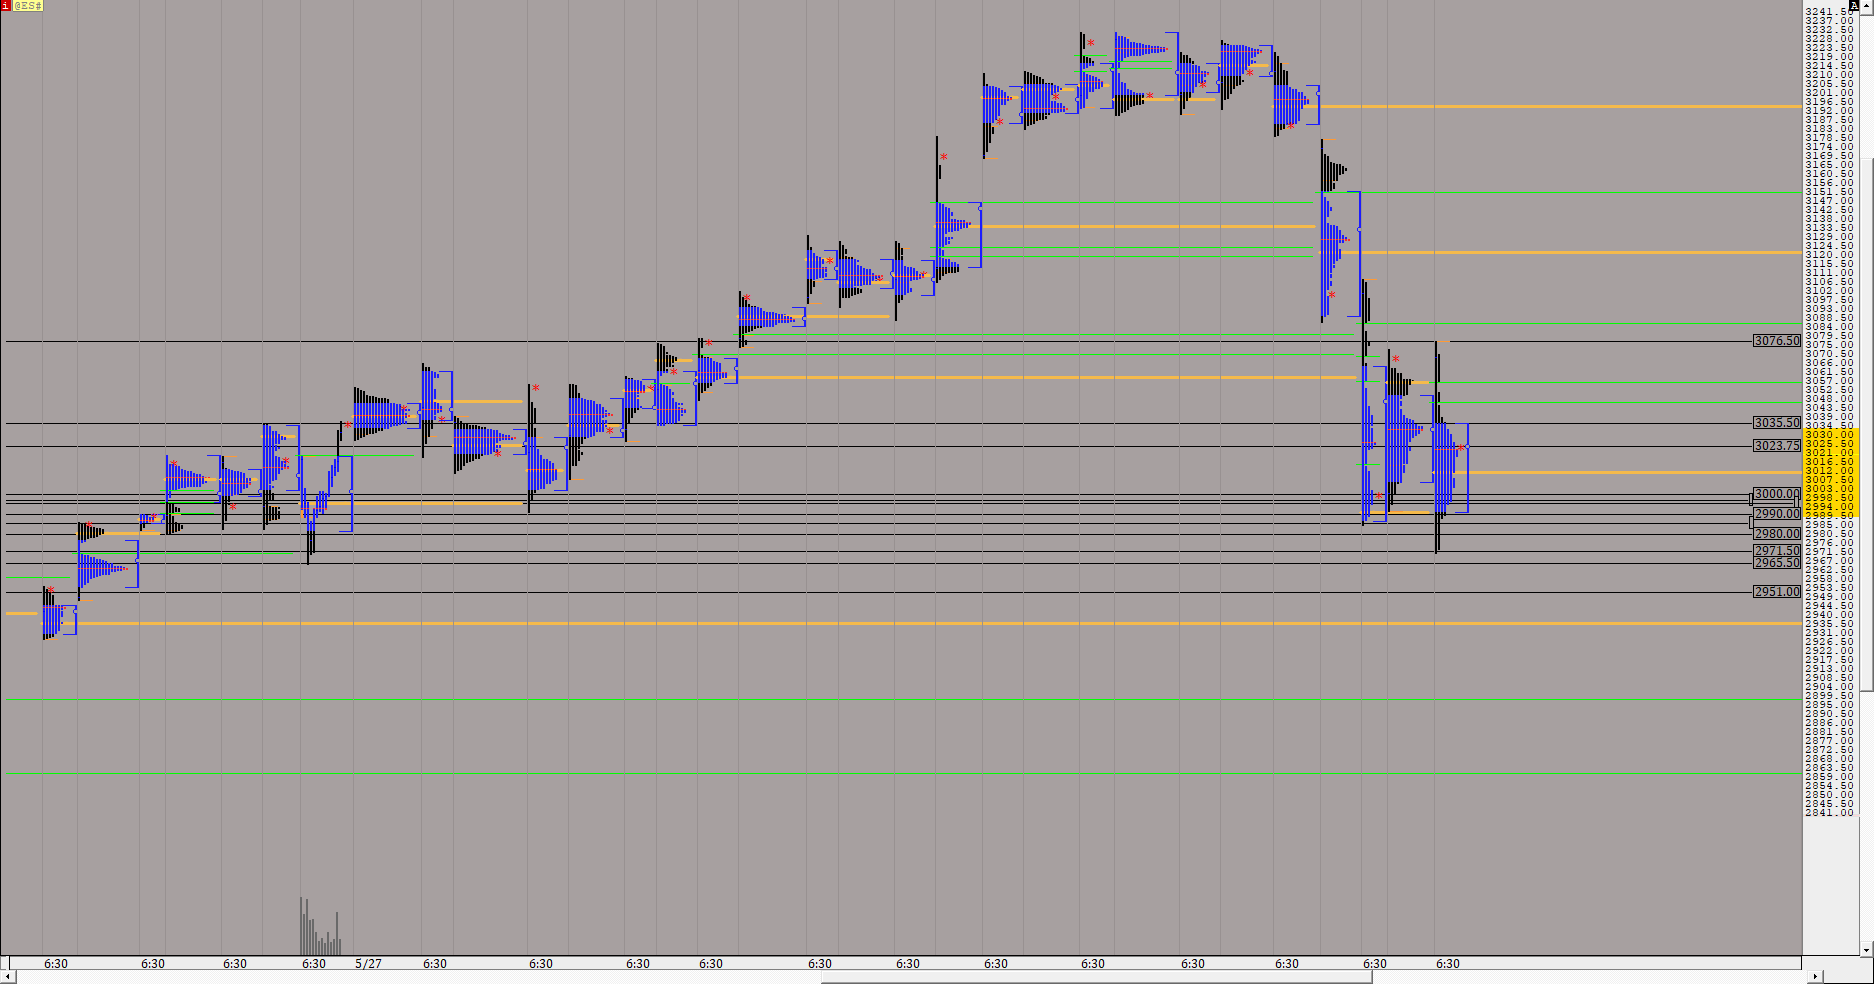 |
TPOMPDaily (@ES#) ES42 [totalcount]
5 years 6 months ago
Daily Profiles. This chart was uploaded by Investor/RT 13.6.15 showing symbol: @ES#. |
View |
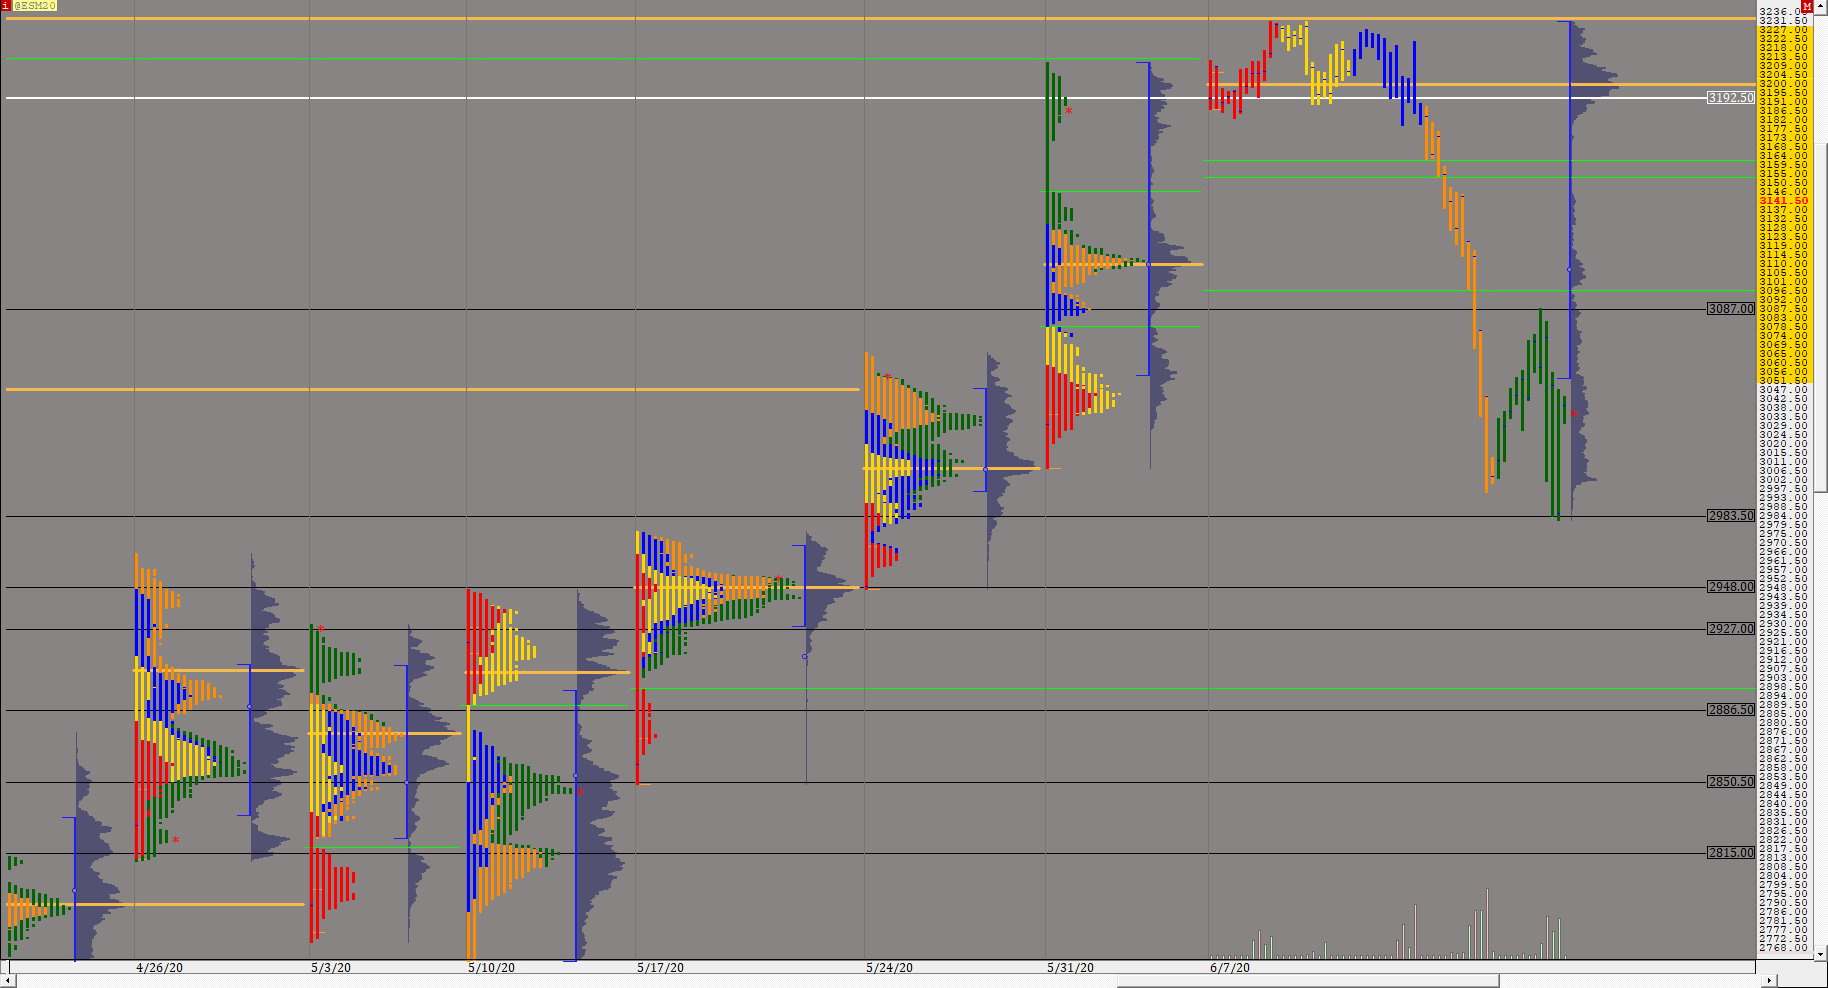 |
TPOWEEKLY (@ESM20) ES42 [totalcount]
5 years 6 months ago
Weekly Profiles, 120 Candles. This chart was uploaded by Investor/RT 13.6.15 showing symbol: @ESM20. |
View |
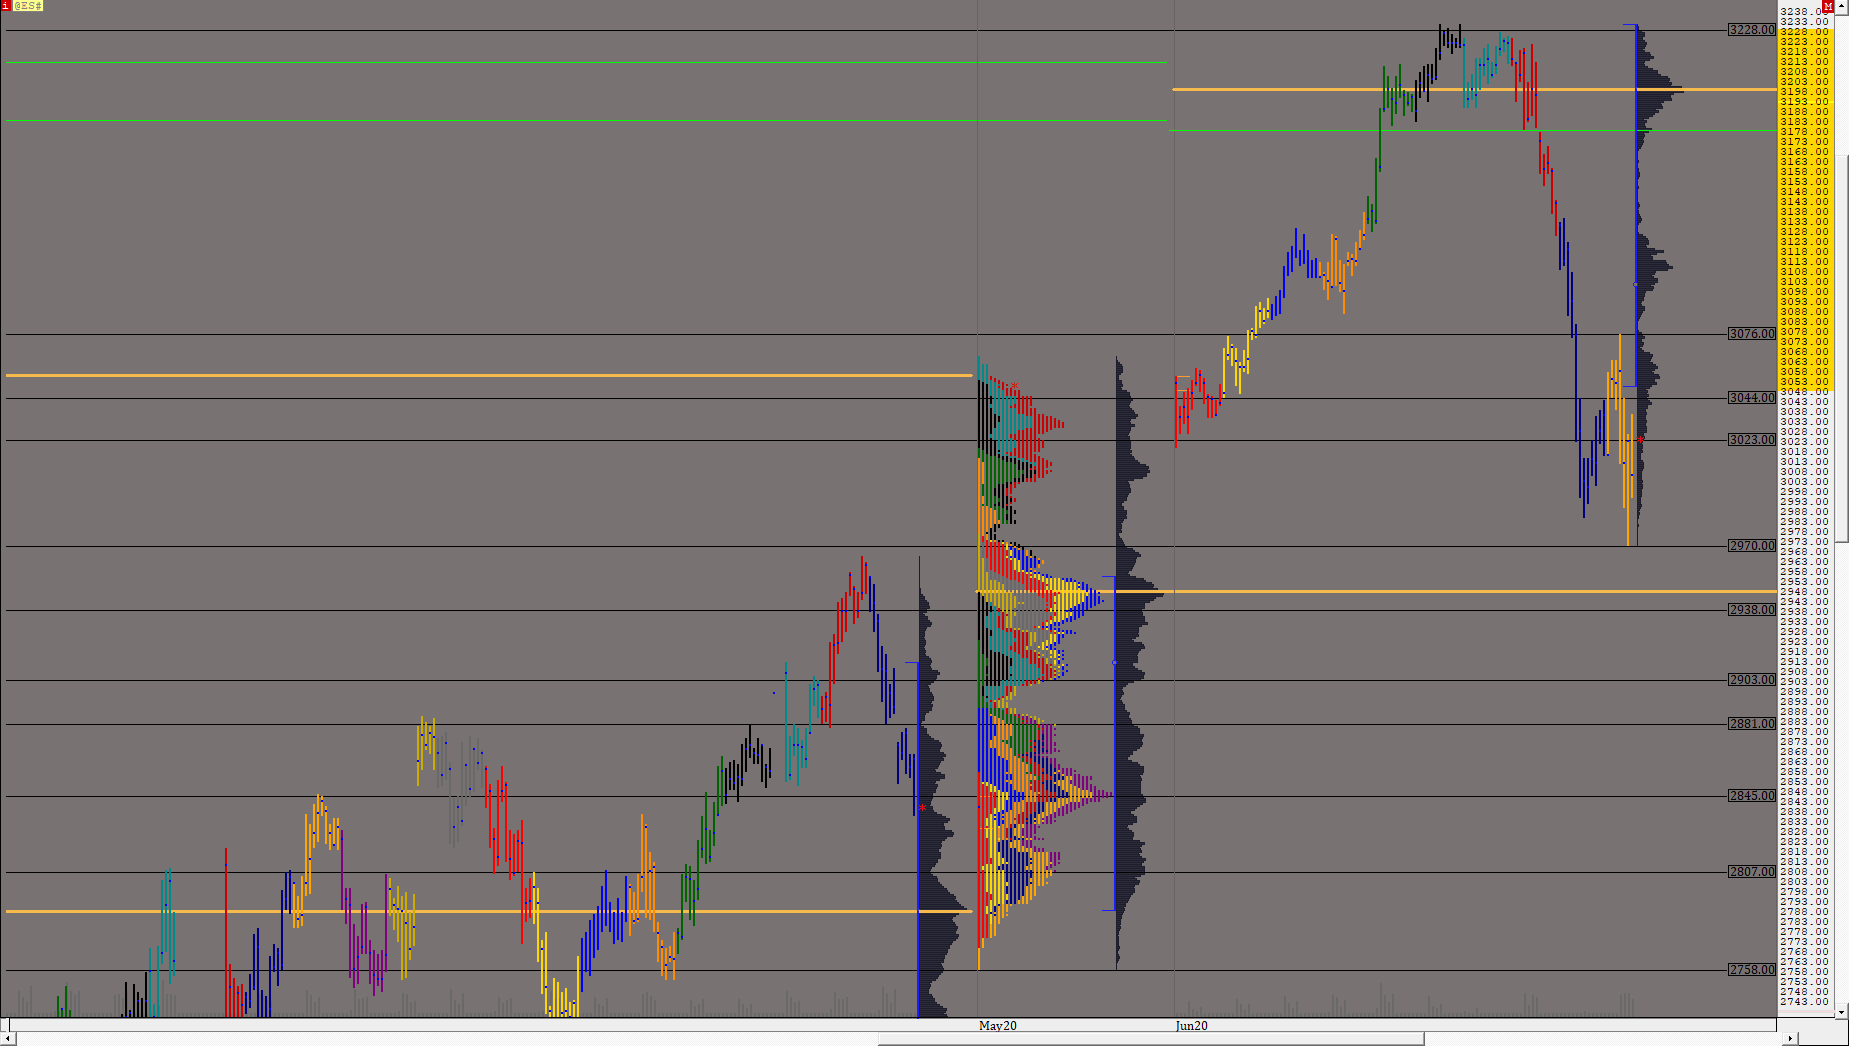 |
TPOESMONTHLY (@ES#) ES42 [totalcount]
5 years 6 months ago
Monthly Ptofiles 2 hour Candles. This chart was uploaded by Investor/RT 13.6.15 showing symbol: @ES#. |
View |
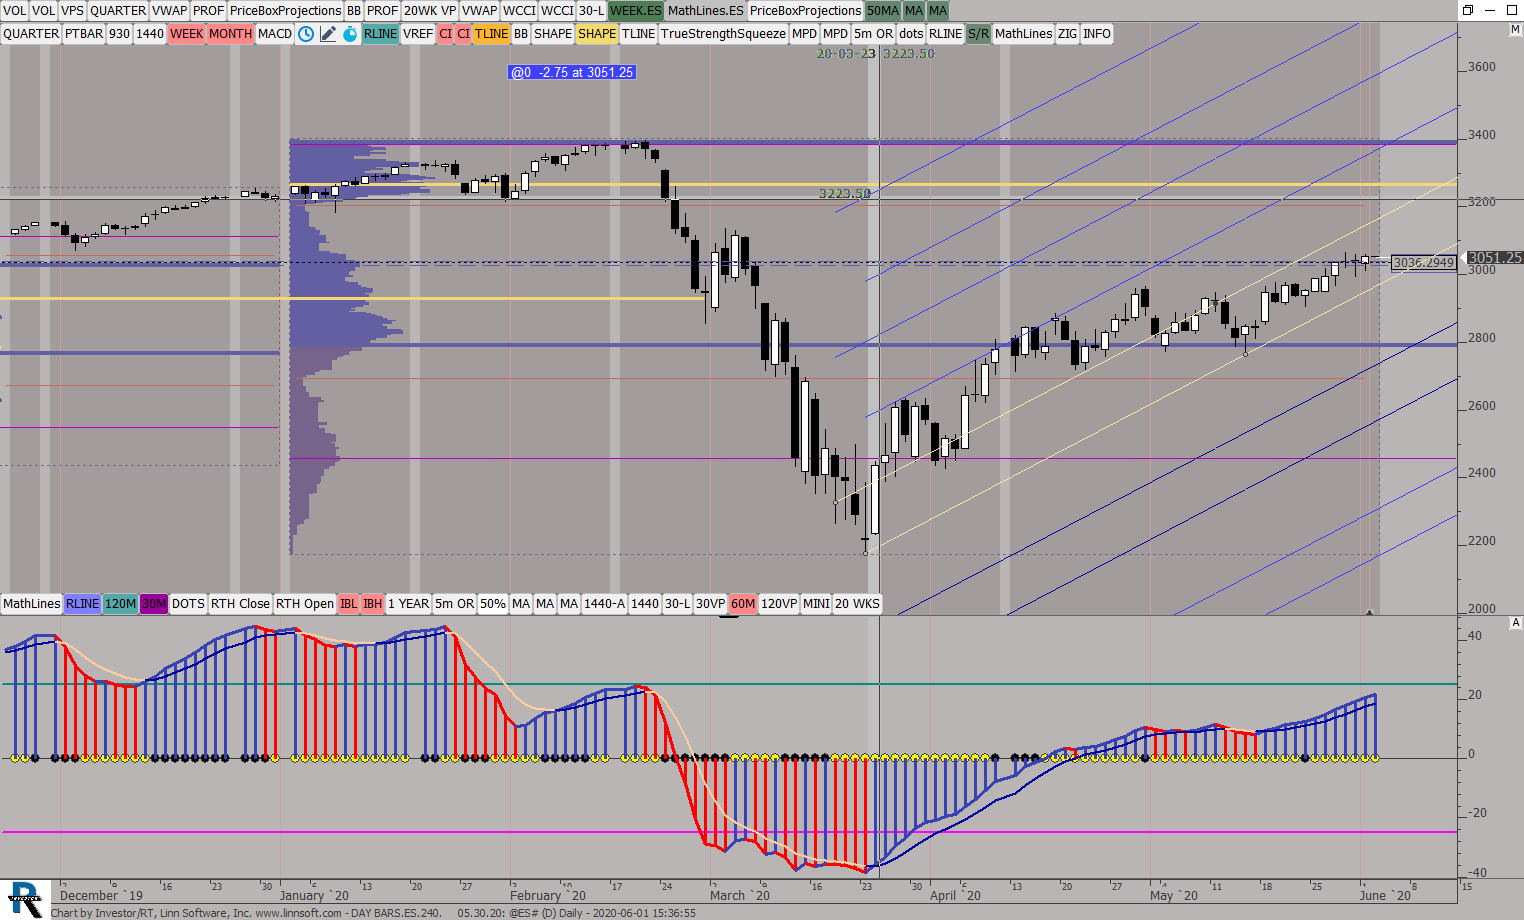 |
DAY BARSES240 (@ES#) ES42 [totalcount]
5 years 6 months ago
This chart was uploaded by Investor/RT 13.6.15 showing symbol: @ES#. |
View |
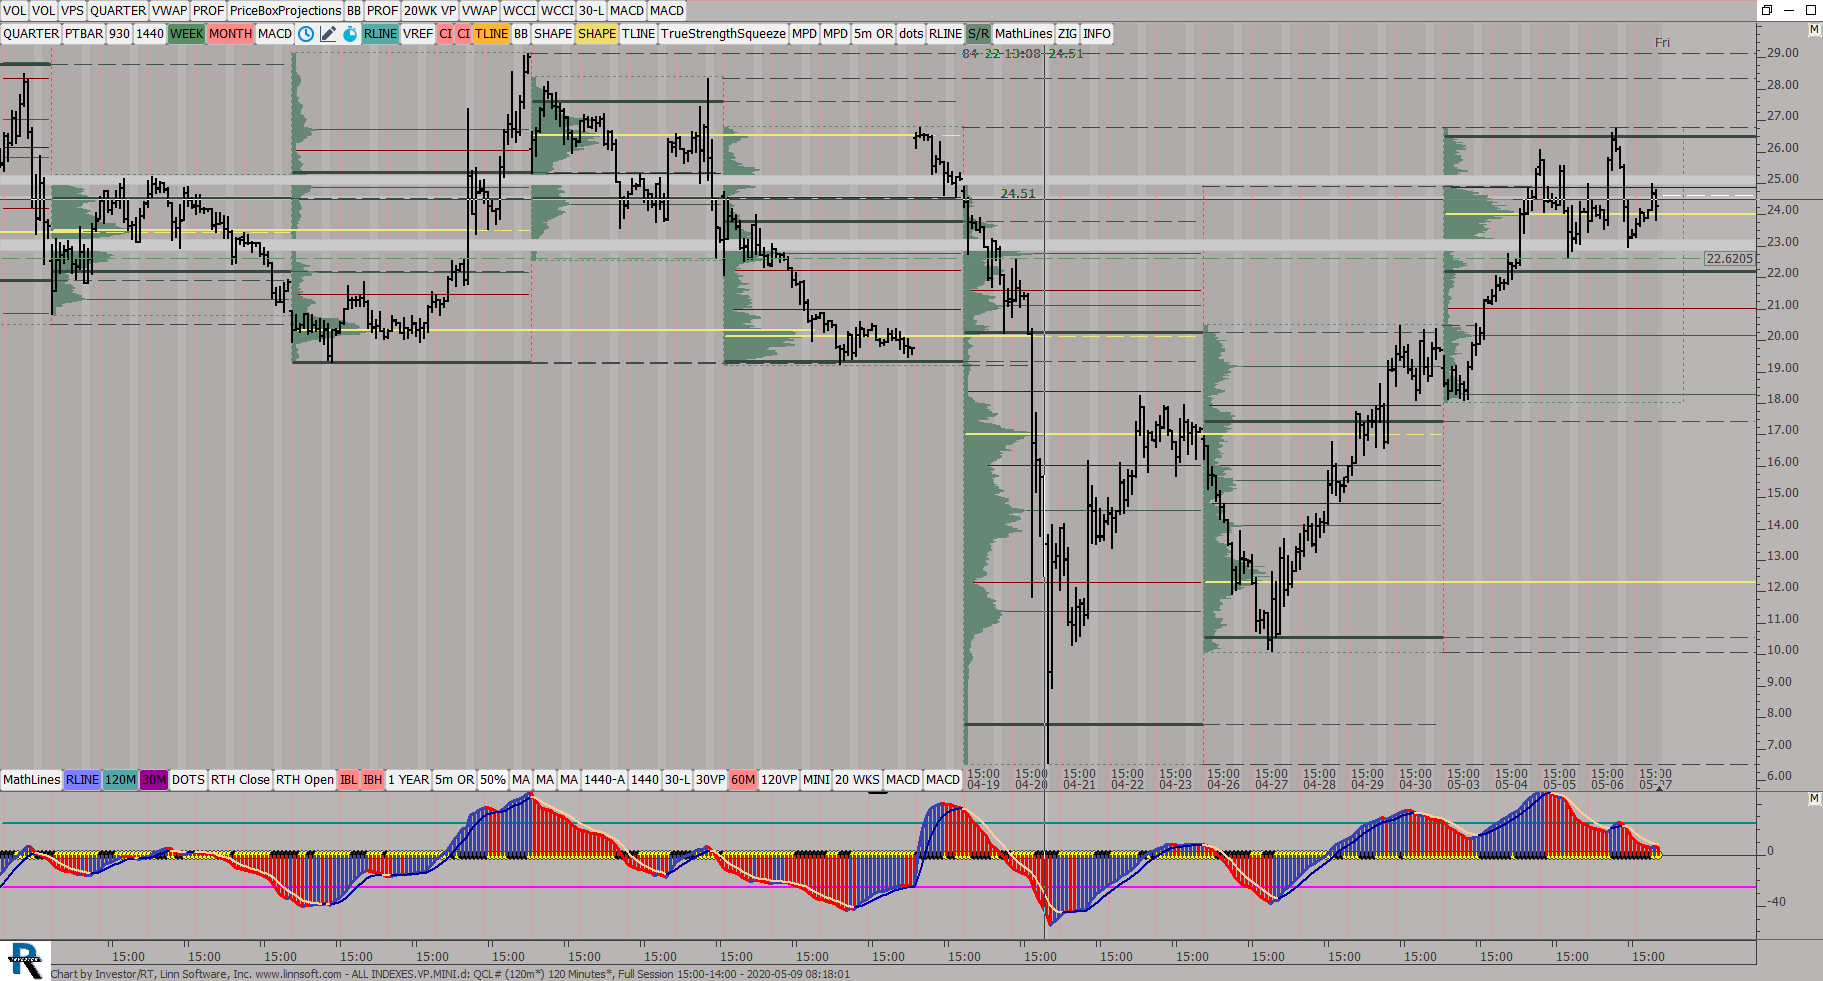 |
ALL INDEXESVPMINId (QCL#) ES42 [totalcount]
5 years 7 months ago
This chart was uploaded by Investor/RT 13.6.15 showing symbol: QCL#. |
View |
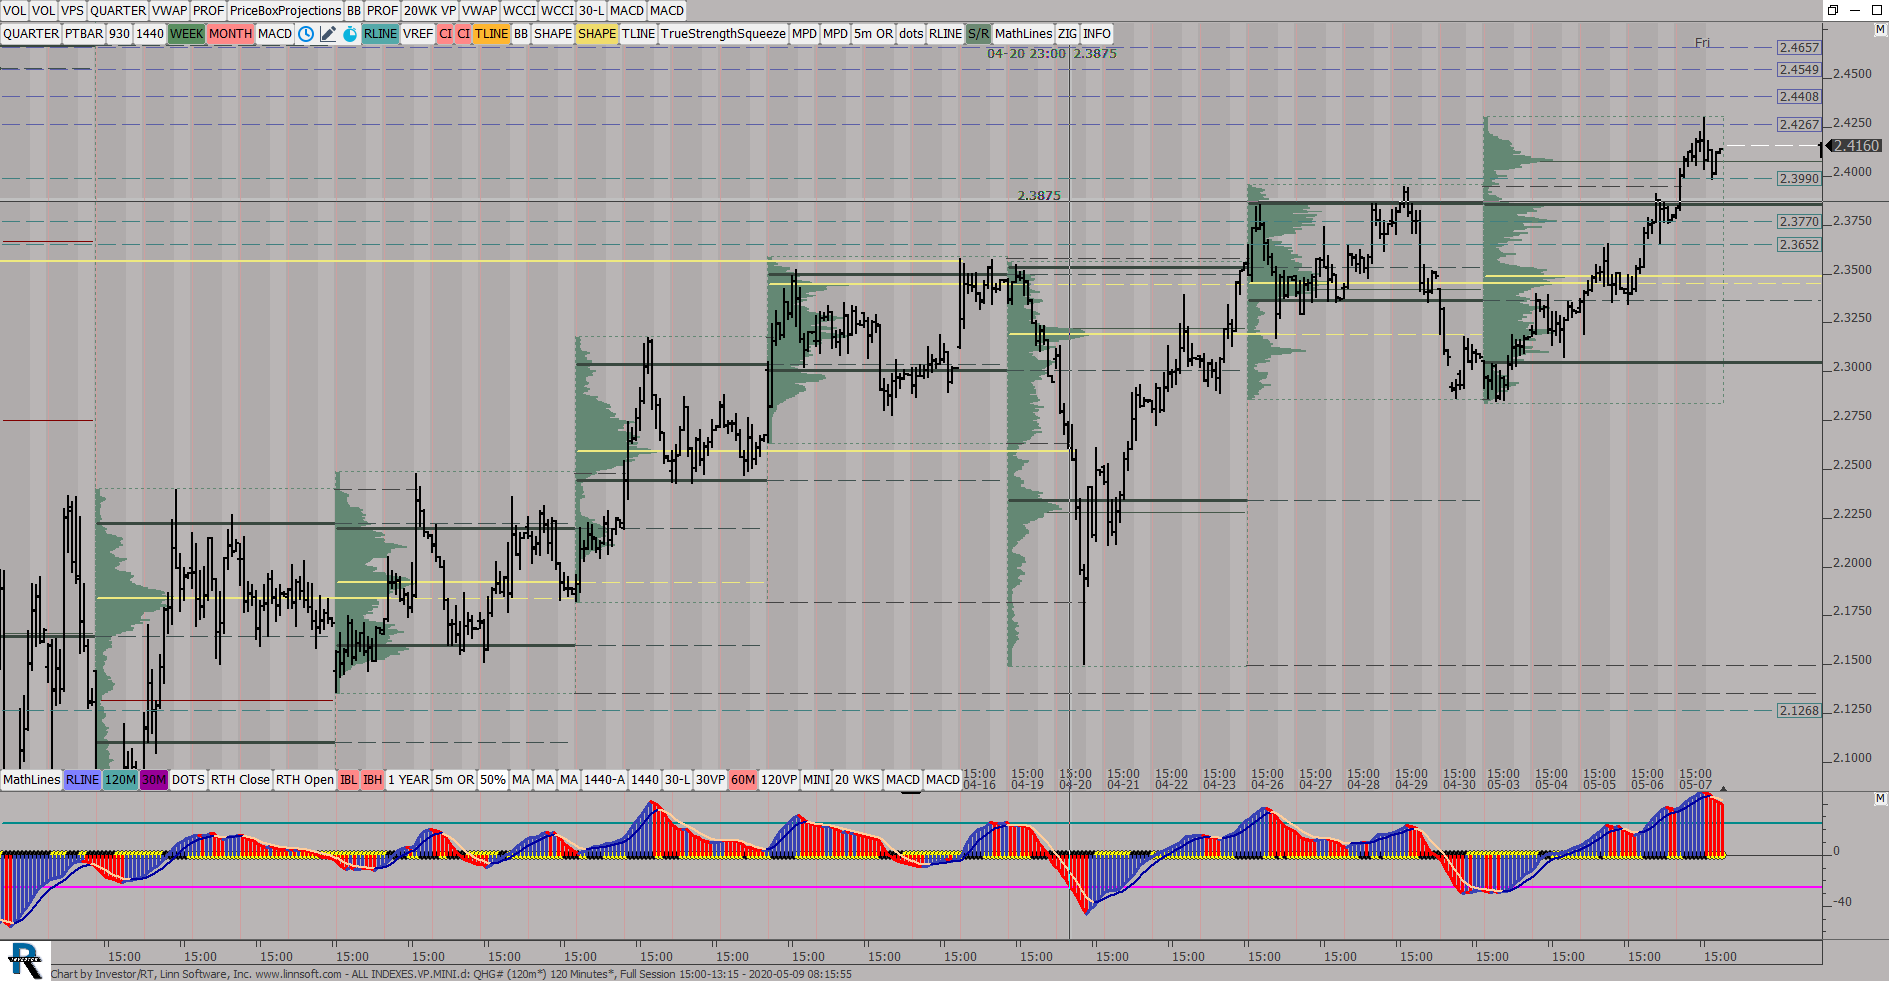 |
ALL INDEXESVPMINId (QHG#) ES42 [totalcount]
5 years 7 months ago
This chart was uploaded by Investor/RT 13.6.15 showing symbol: QHG#. |
View |
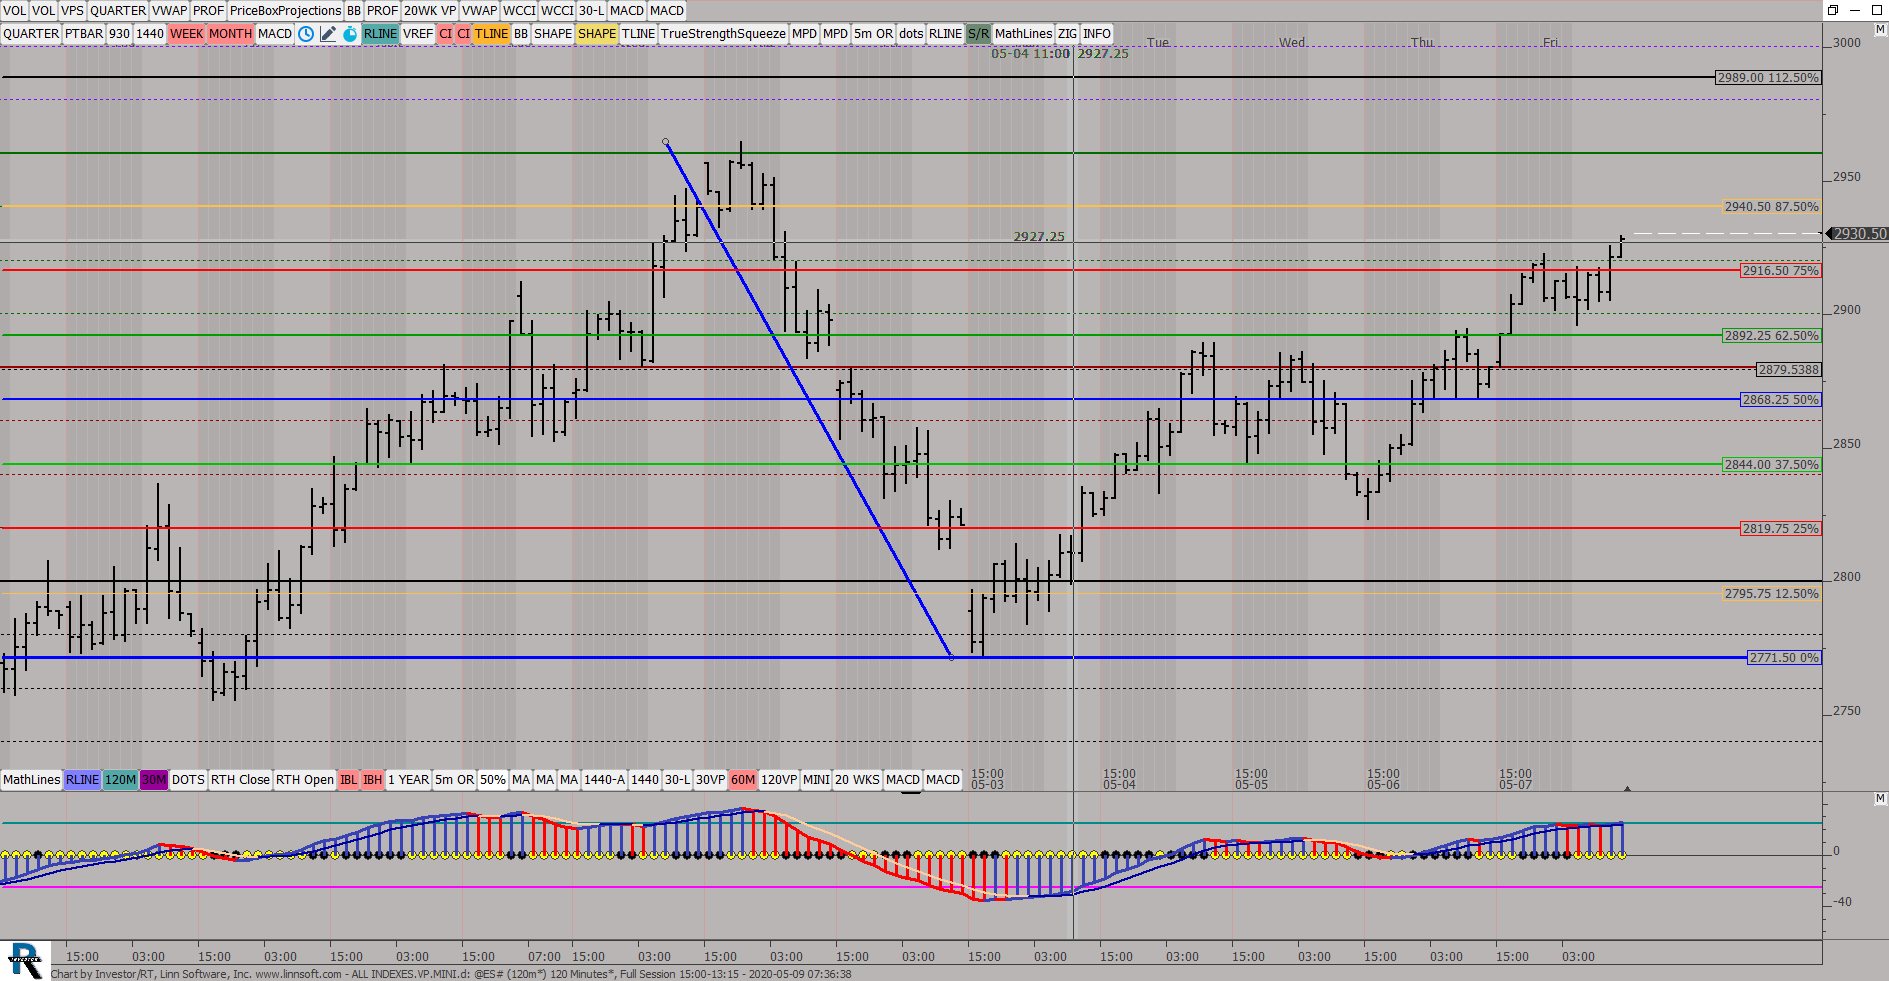 |
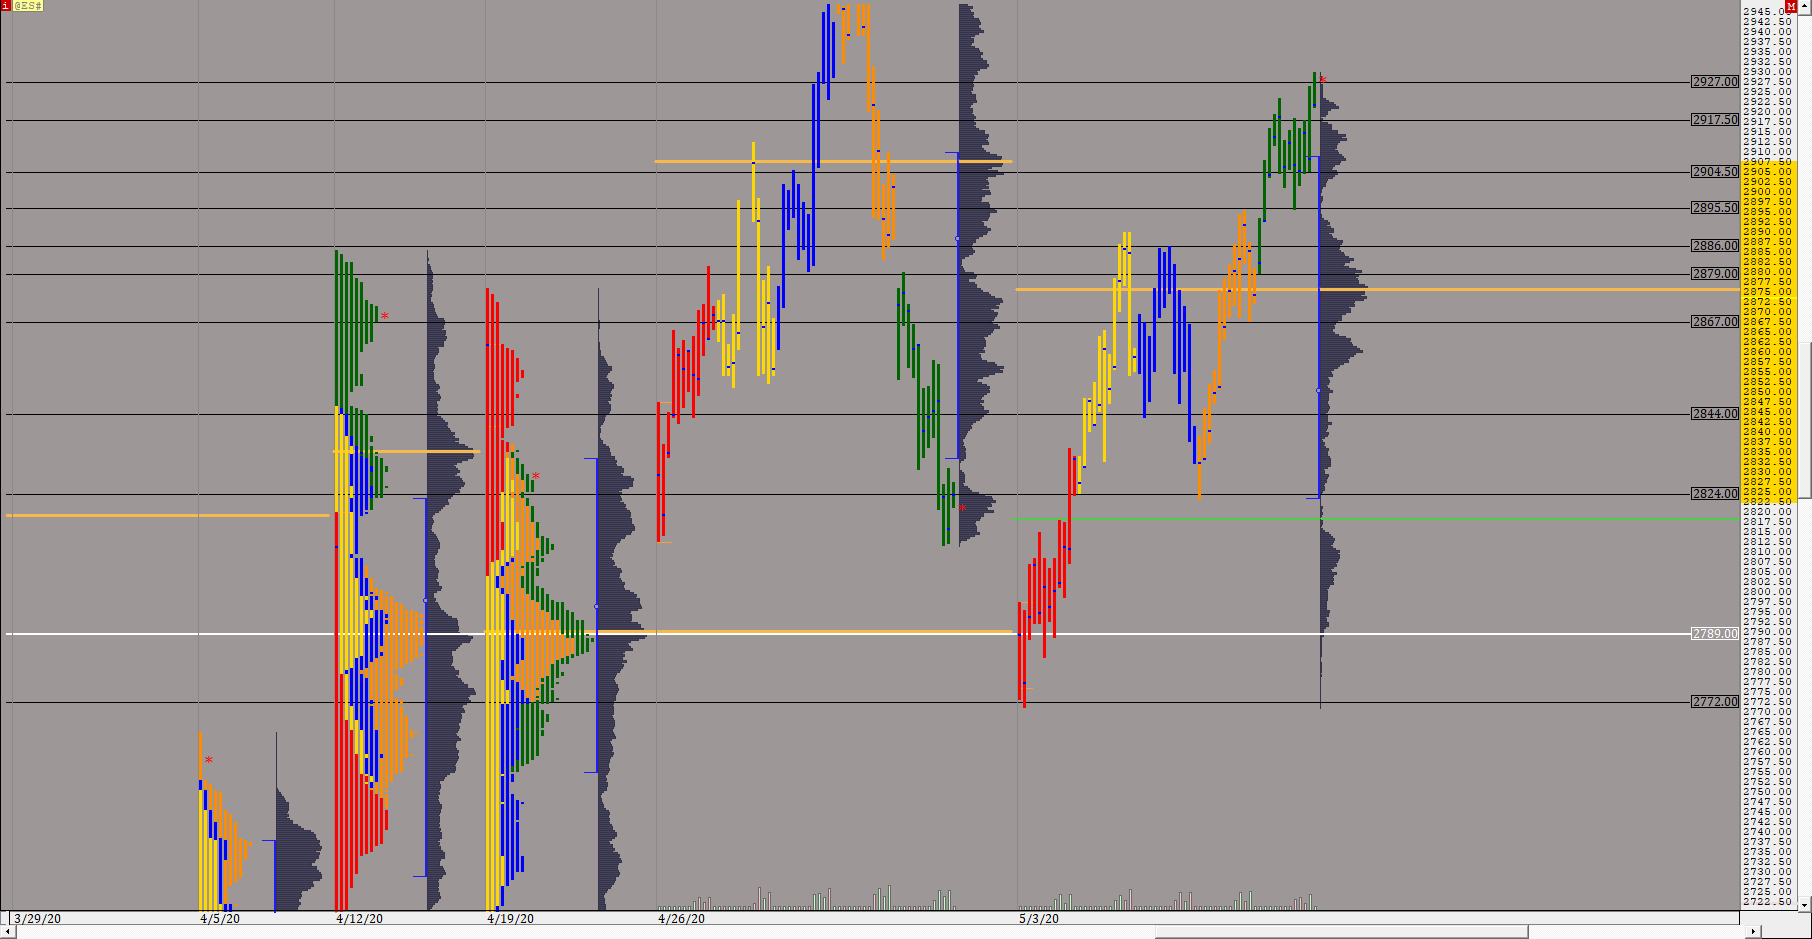
ALL INDEXESVPMINId (@ES#) ES42 [totalcount]
5 years 7 months ago
This chart was uploaded by Investor/RT 13.6.15 showing symbol: @ES#. |
View |
 |
MPGLOBEXDAILY (@ES#) ES42 [totalcount]
5 years 7 months ago
This chart was uploaded by Investor/RT 13.6.15 showing symbol: @ES#. |
View |
 |
MP ES WEEKLY (@ES#) ES42 [totalcount]
5 years 7 months ago
This chart was uploaded by Investor/RT 13.6.15 showing symbol: @ES#. |
View |
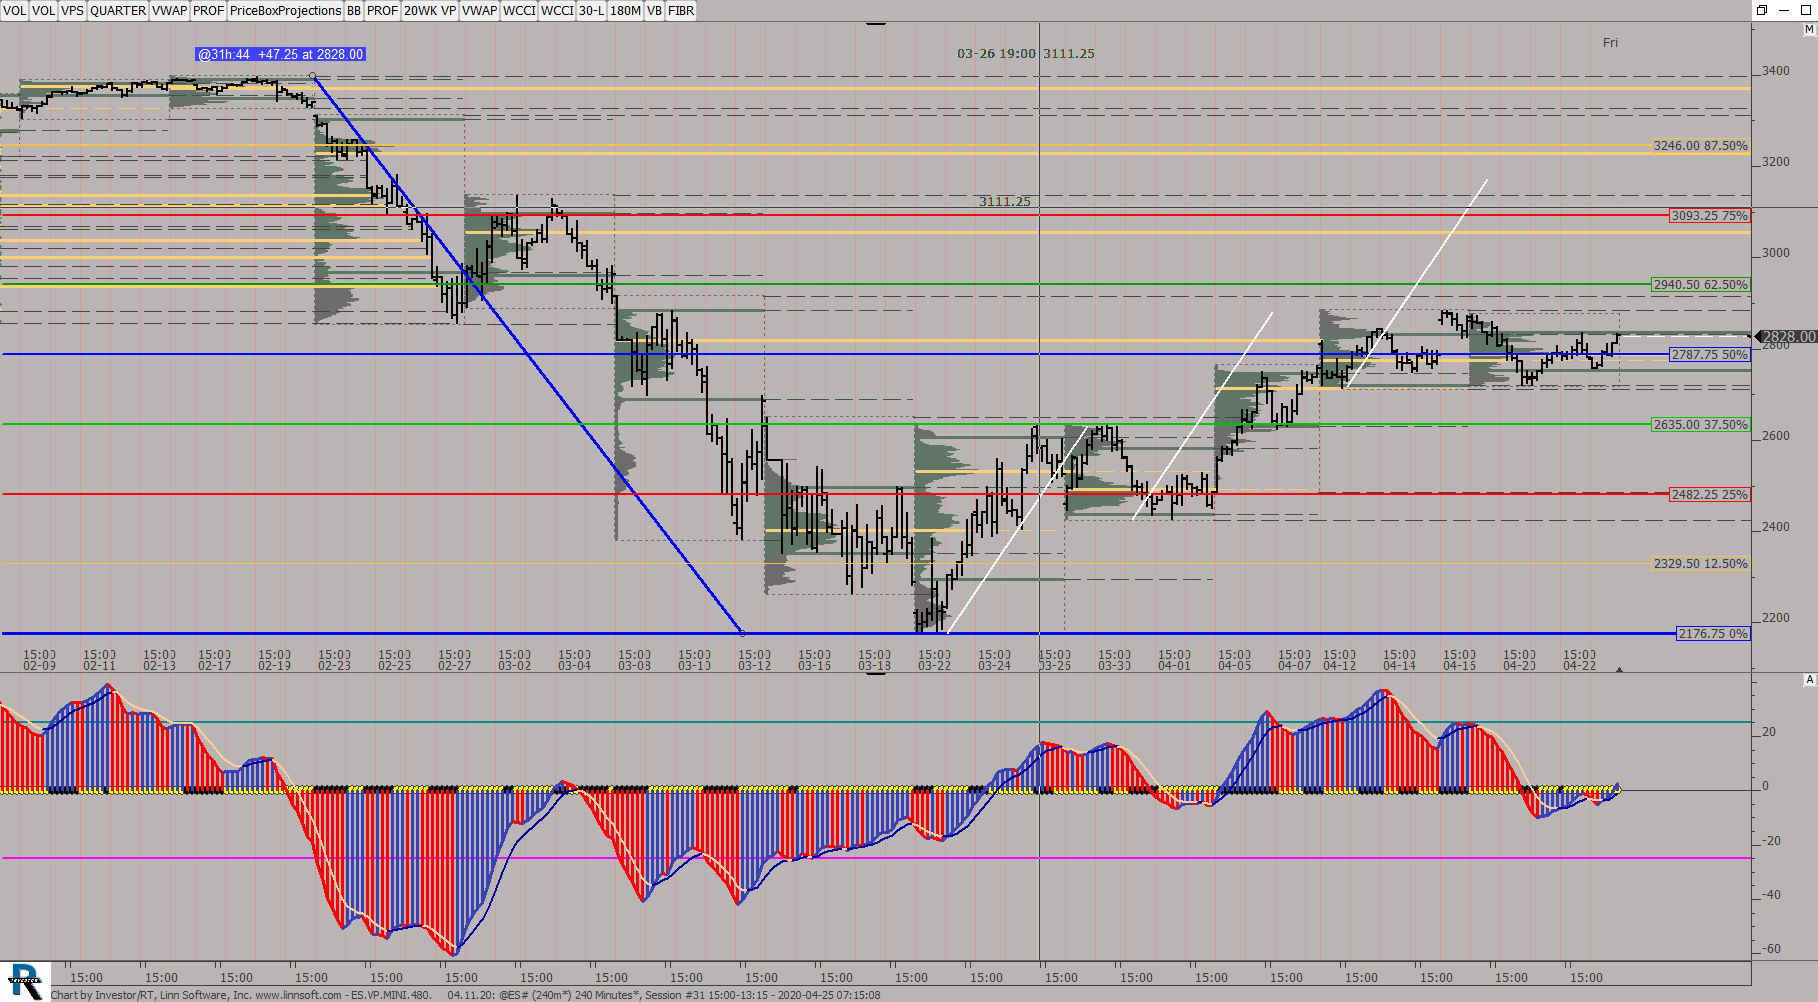 |
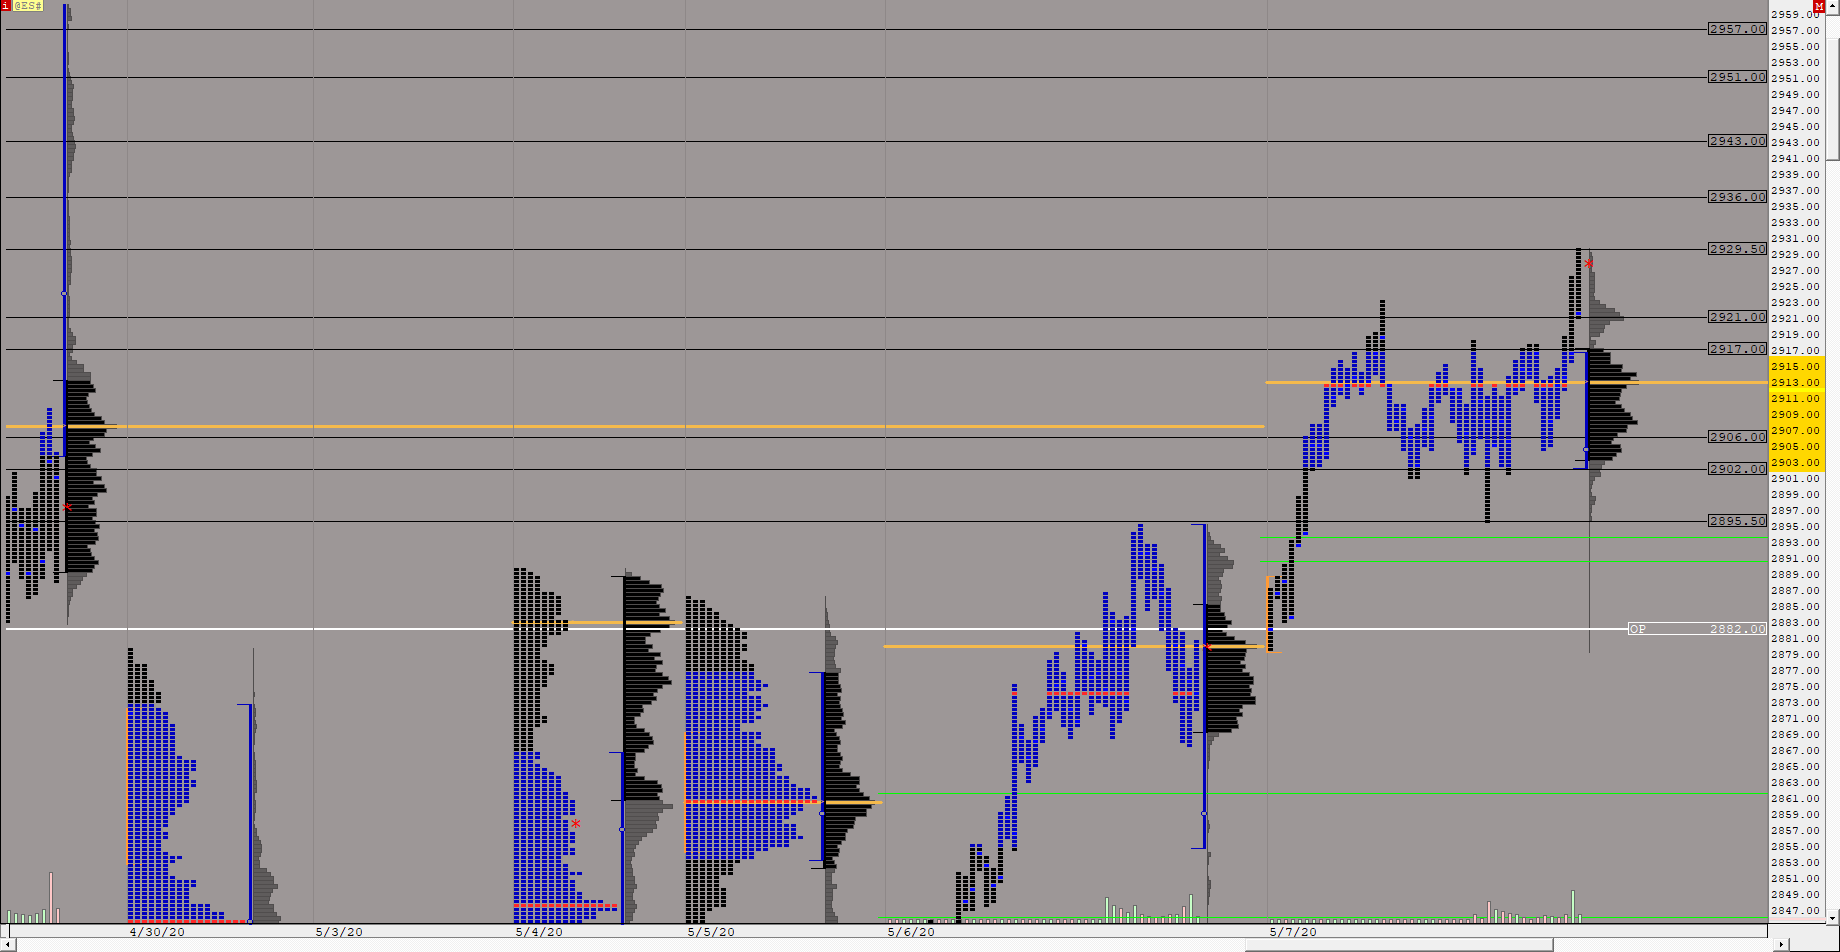
ESVPMINI480 (@ES#) ES42 [totalcount]
5 years 7 months ago
Measured Move to resistance is to 2883. This chart was uploaded by Investor/RT 13.6.15 showing symbol: @ES#. |
View |
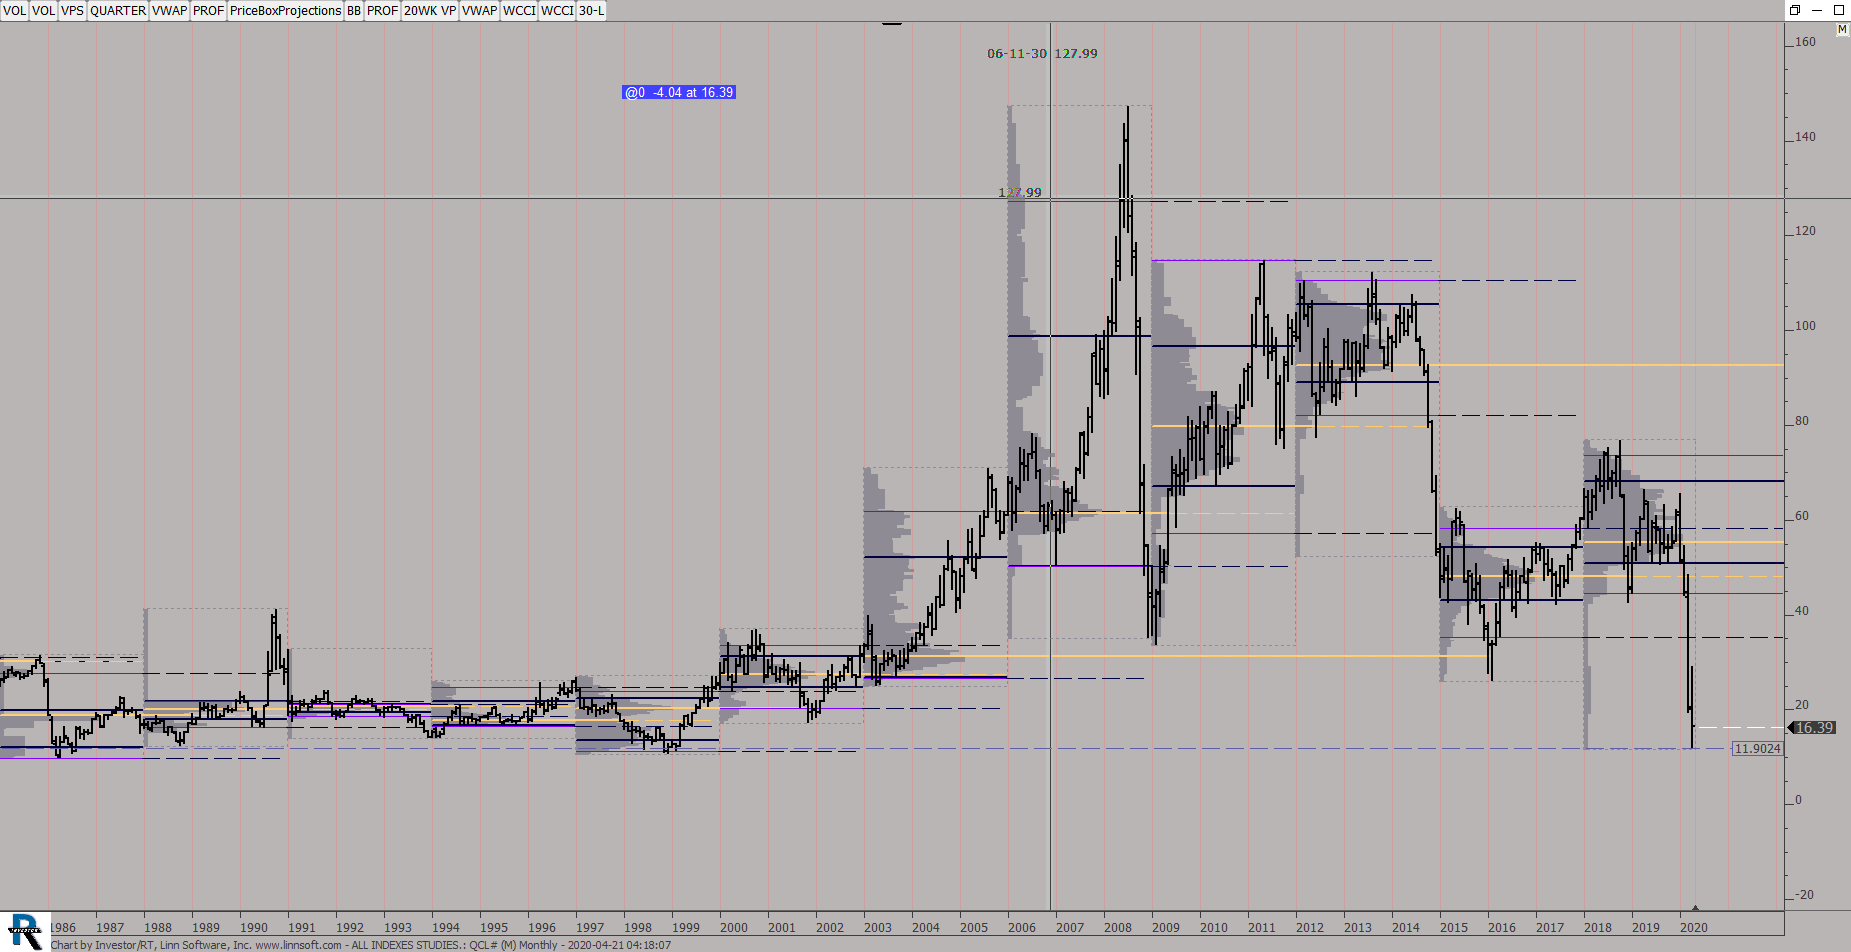 |
ALL INDEXES STUDIES (QCL#) ES42 [totalcount]
5 years 8 months ago
1 Year Profiles, Monthly Bars, 40 years. This chart was uploaded by Investor/RT 13.6.15 showing symbol: QCL#. |
View |
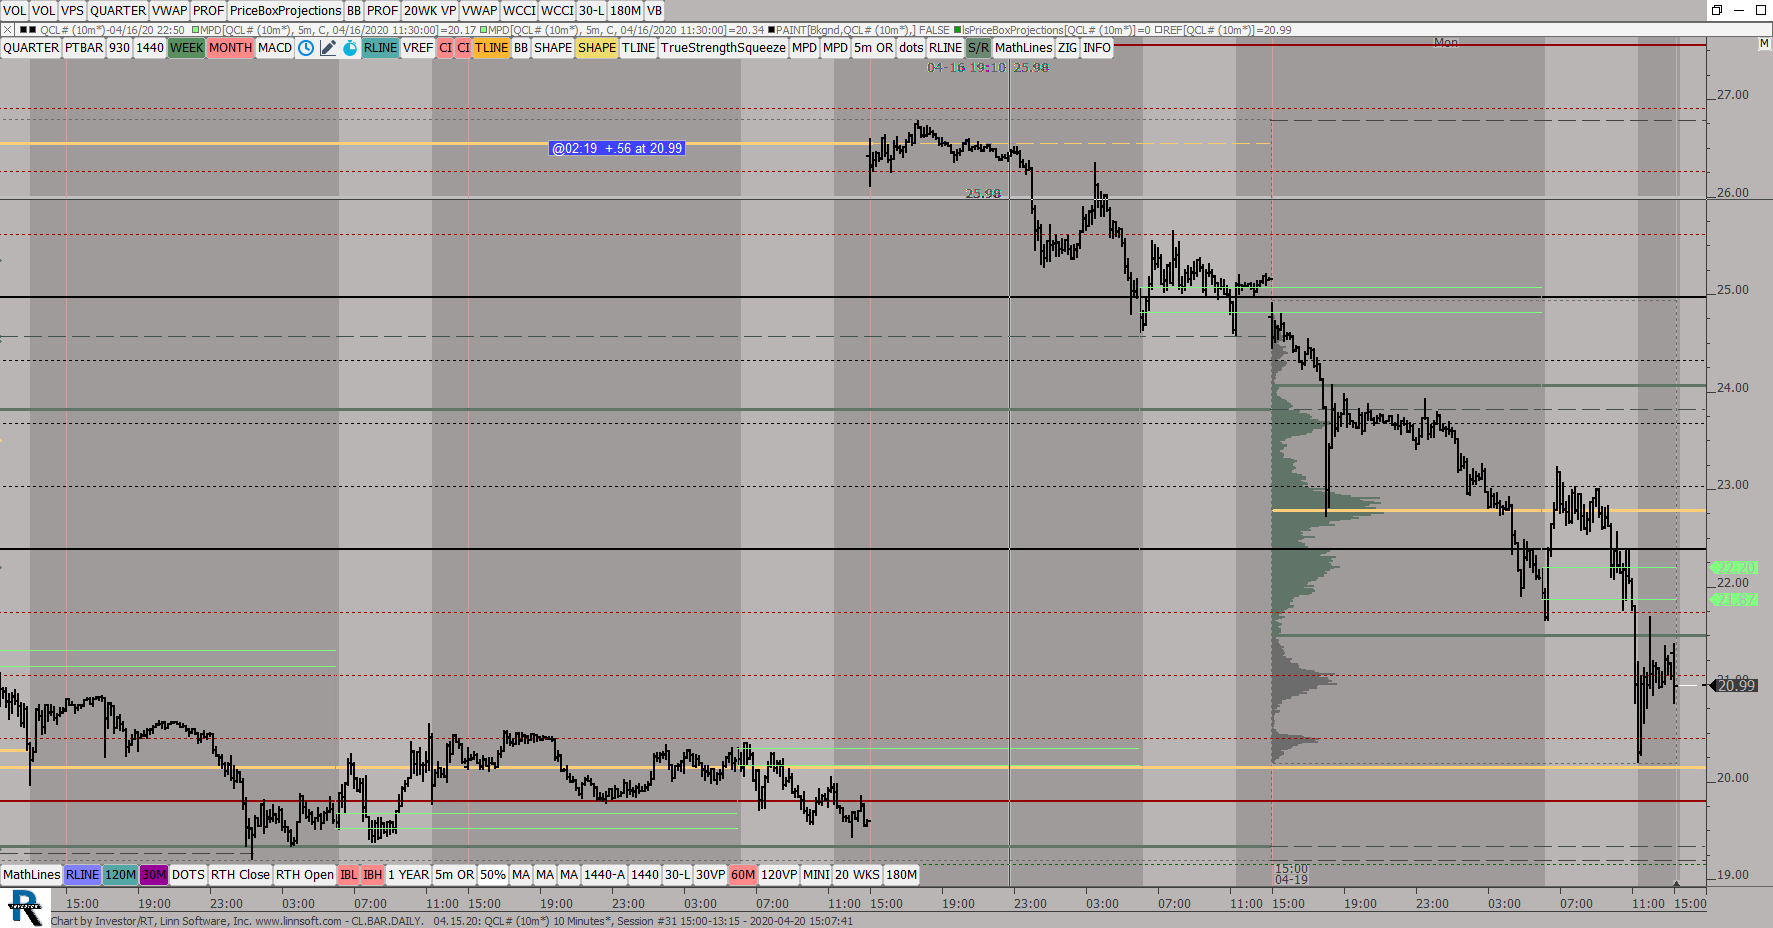 |
CLBARDAILY (QCL#) ES42 [totalcount]
5 years 8 months ago
This chart was uploaded by Investor/RT 13.6.15 showing symbol: QCL#. |
View |
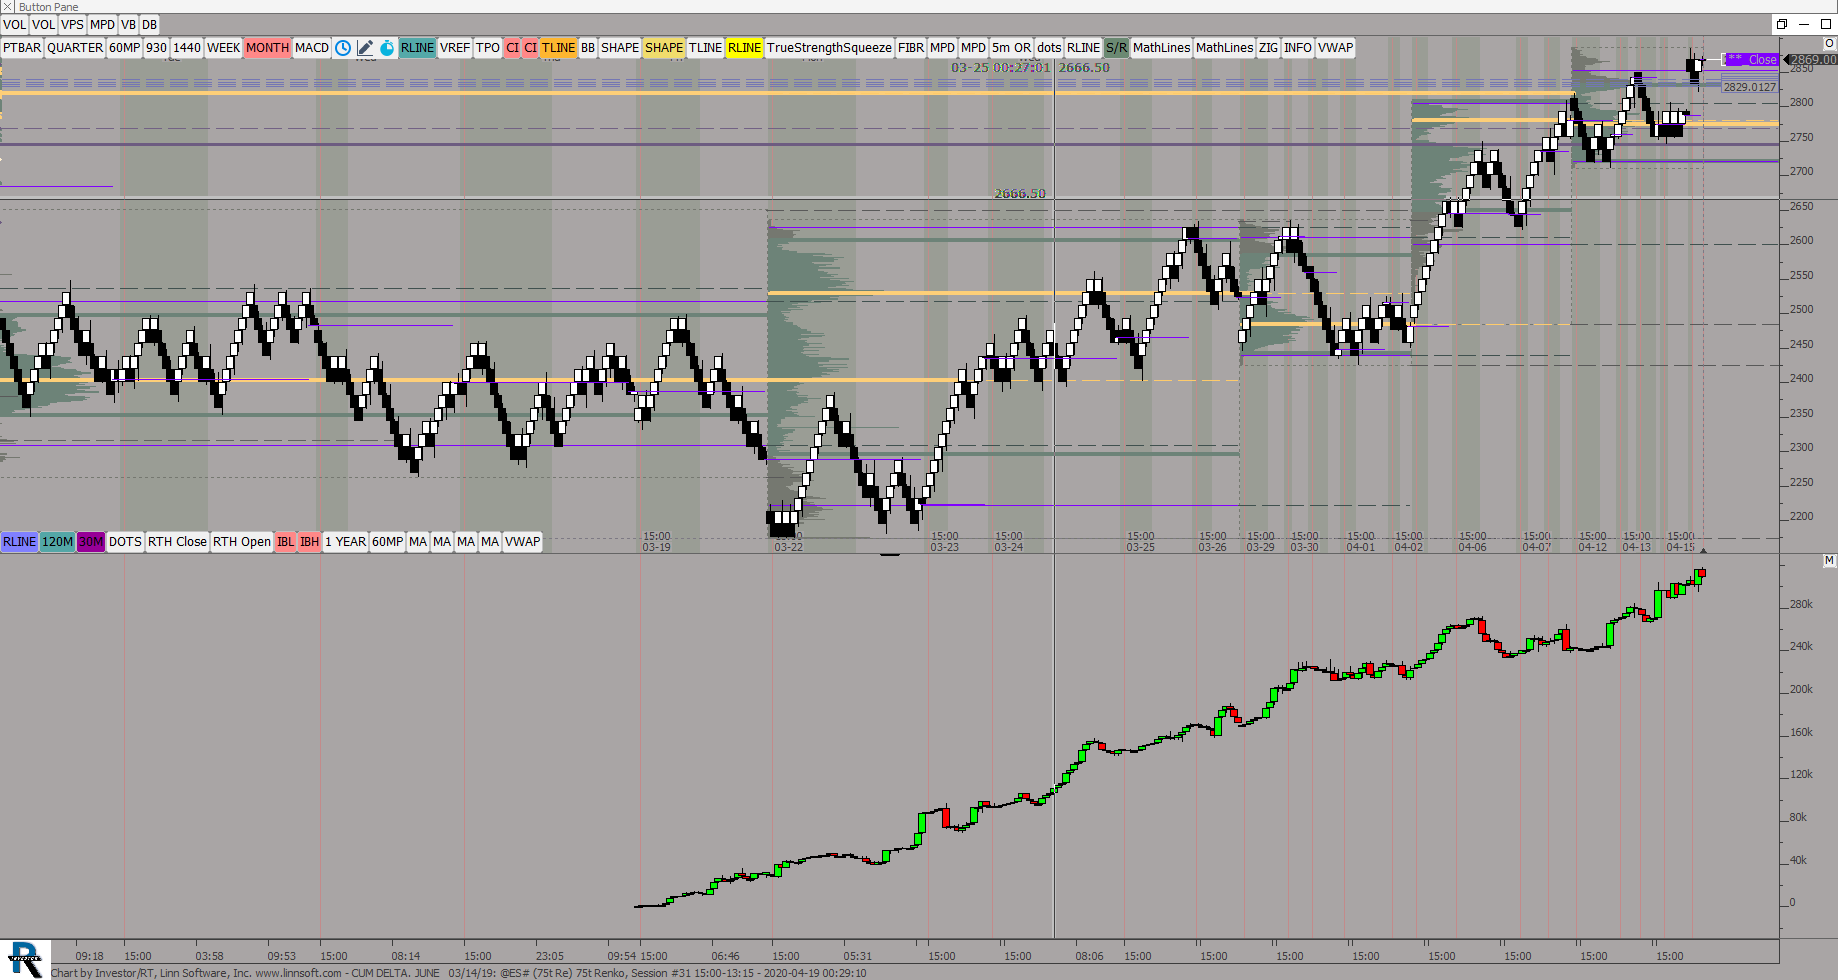 |
CUM DELTA JUNE 03 14 (@ES#) ES42 [totalcount]
5 years 8 months ago
CUM DELTA, June2020. This chart was uploaded by Investor/RT 13.6.15 showing symbol: @ES#. |
View |
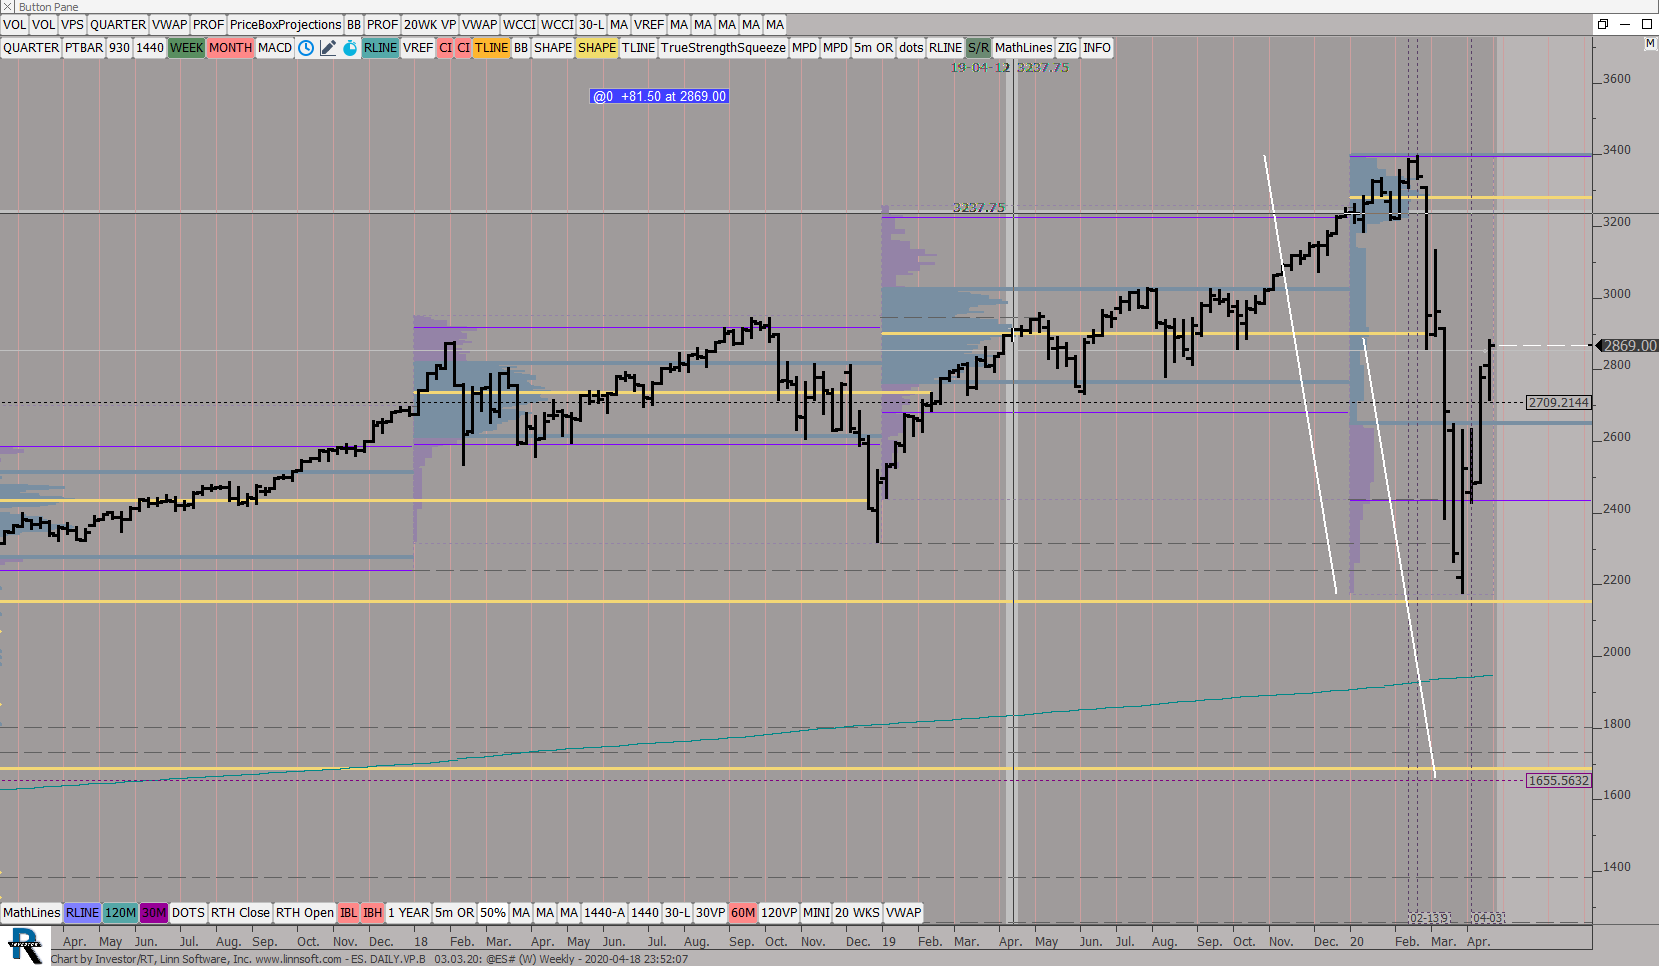 |
ES DAILYVPB (@ES#) ES42 [totalcount]
5 years 8 months ago
Measured Move to the tick!. This chart was uploaded by Investor/RT 13.6.15 showing symbol: @ES#. |
View |
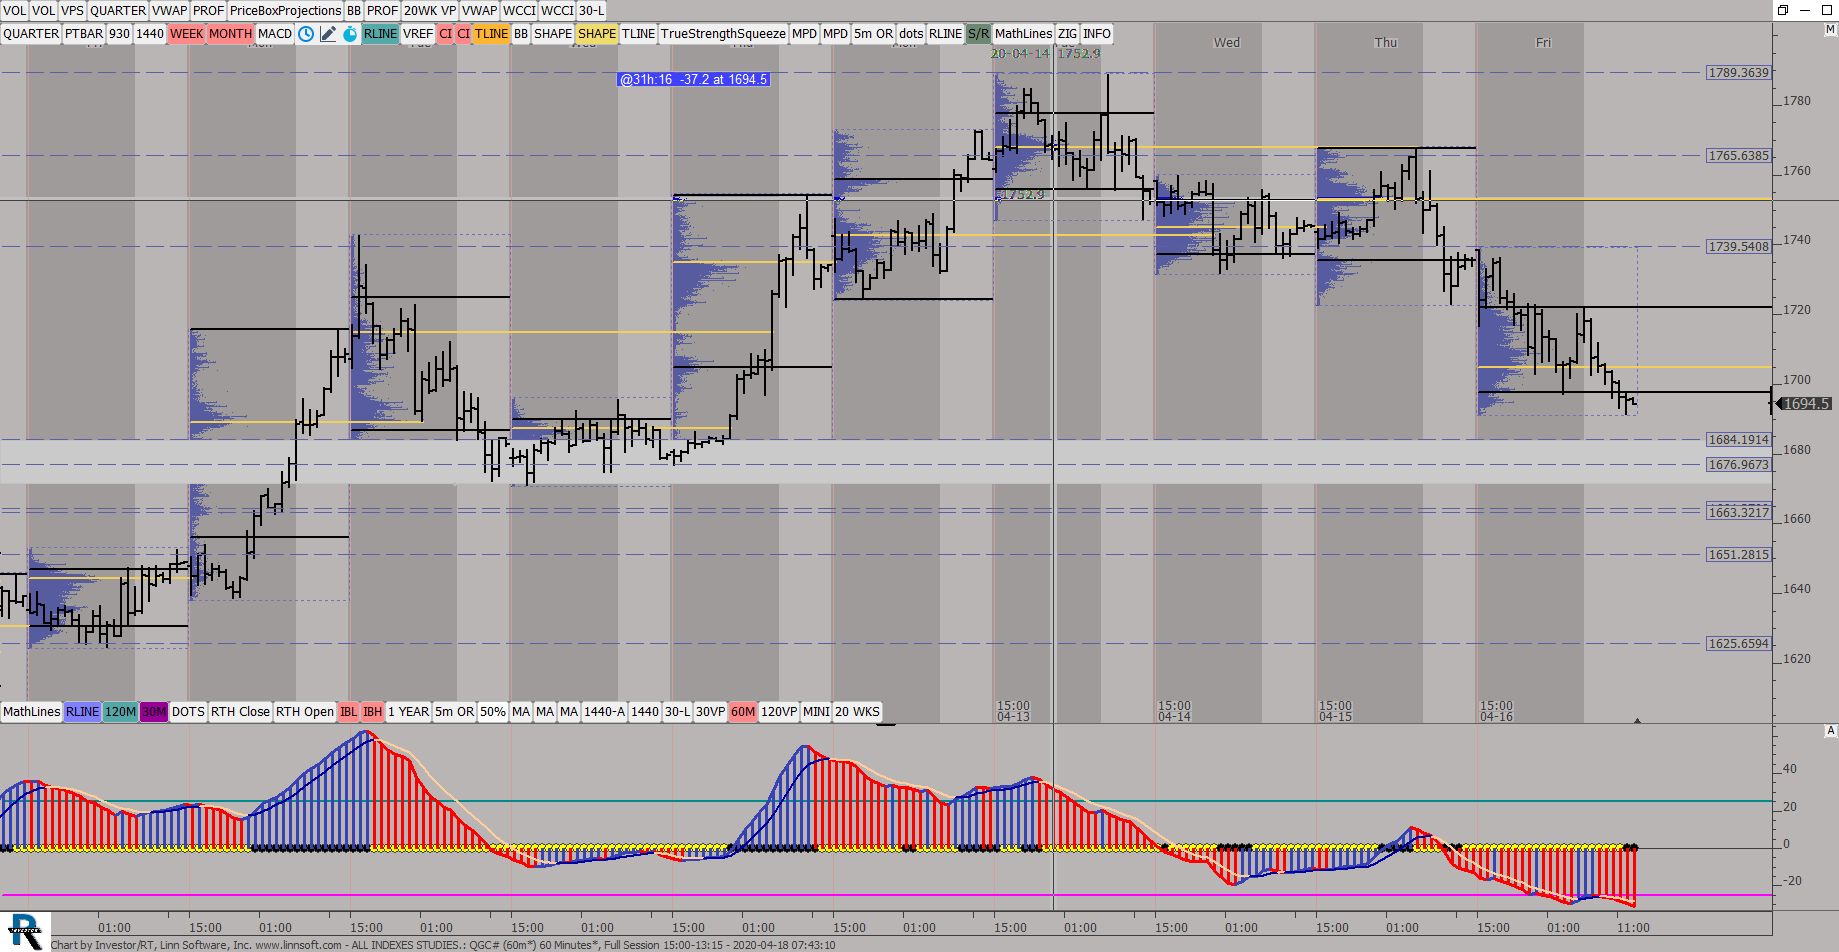 |
ALL INDEXES STUDIES (QGC#) ES42 [totalcount]
5 years 8 months ago
This chart was uploaded by Investor/RT 13.6.15 showing symbol: QGC#. |
View |
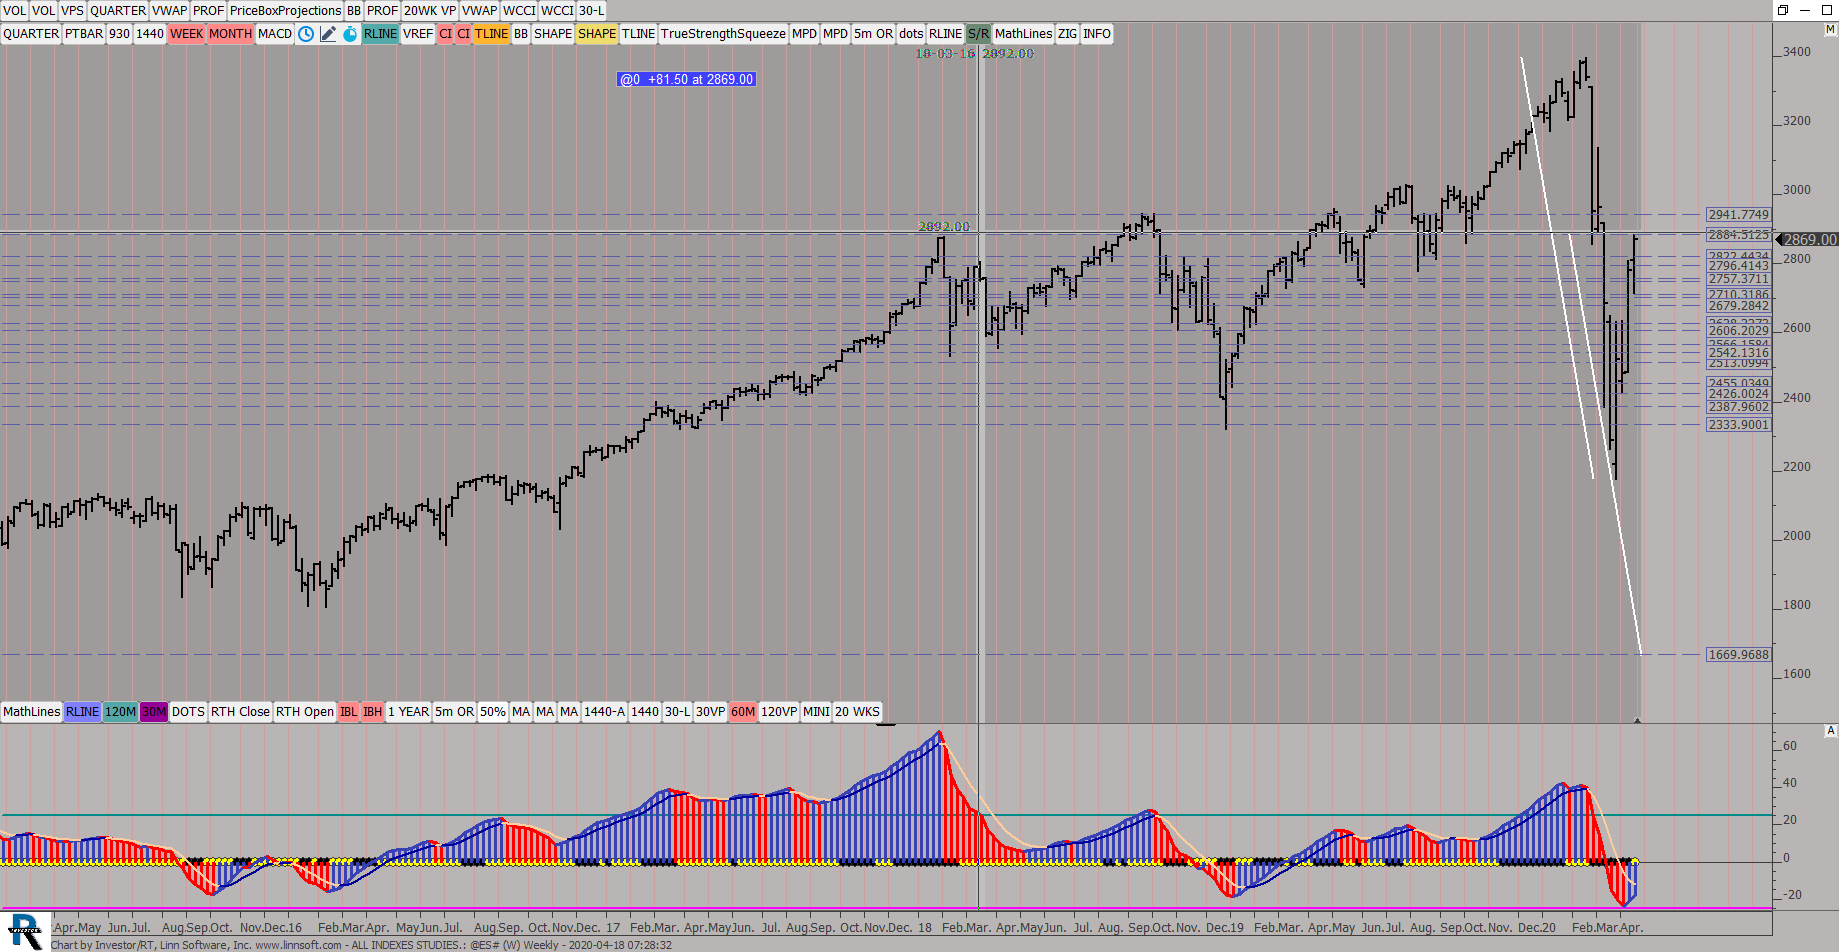 |
ALL INDEXES STUDIES (@ES#) ES42 [totalcount]
5 years 8 months ago
This chart was uploaded by Investor/RT 13.6.15 showing symbol: @ES#. |
View |
 |
S R ESTPO (@ES#) ES42 [totalcount]
5 years 8 months ago
This chart was uploaded by Investor/RT 13.6.15 showing symbol: @ES#. |
View |
 |
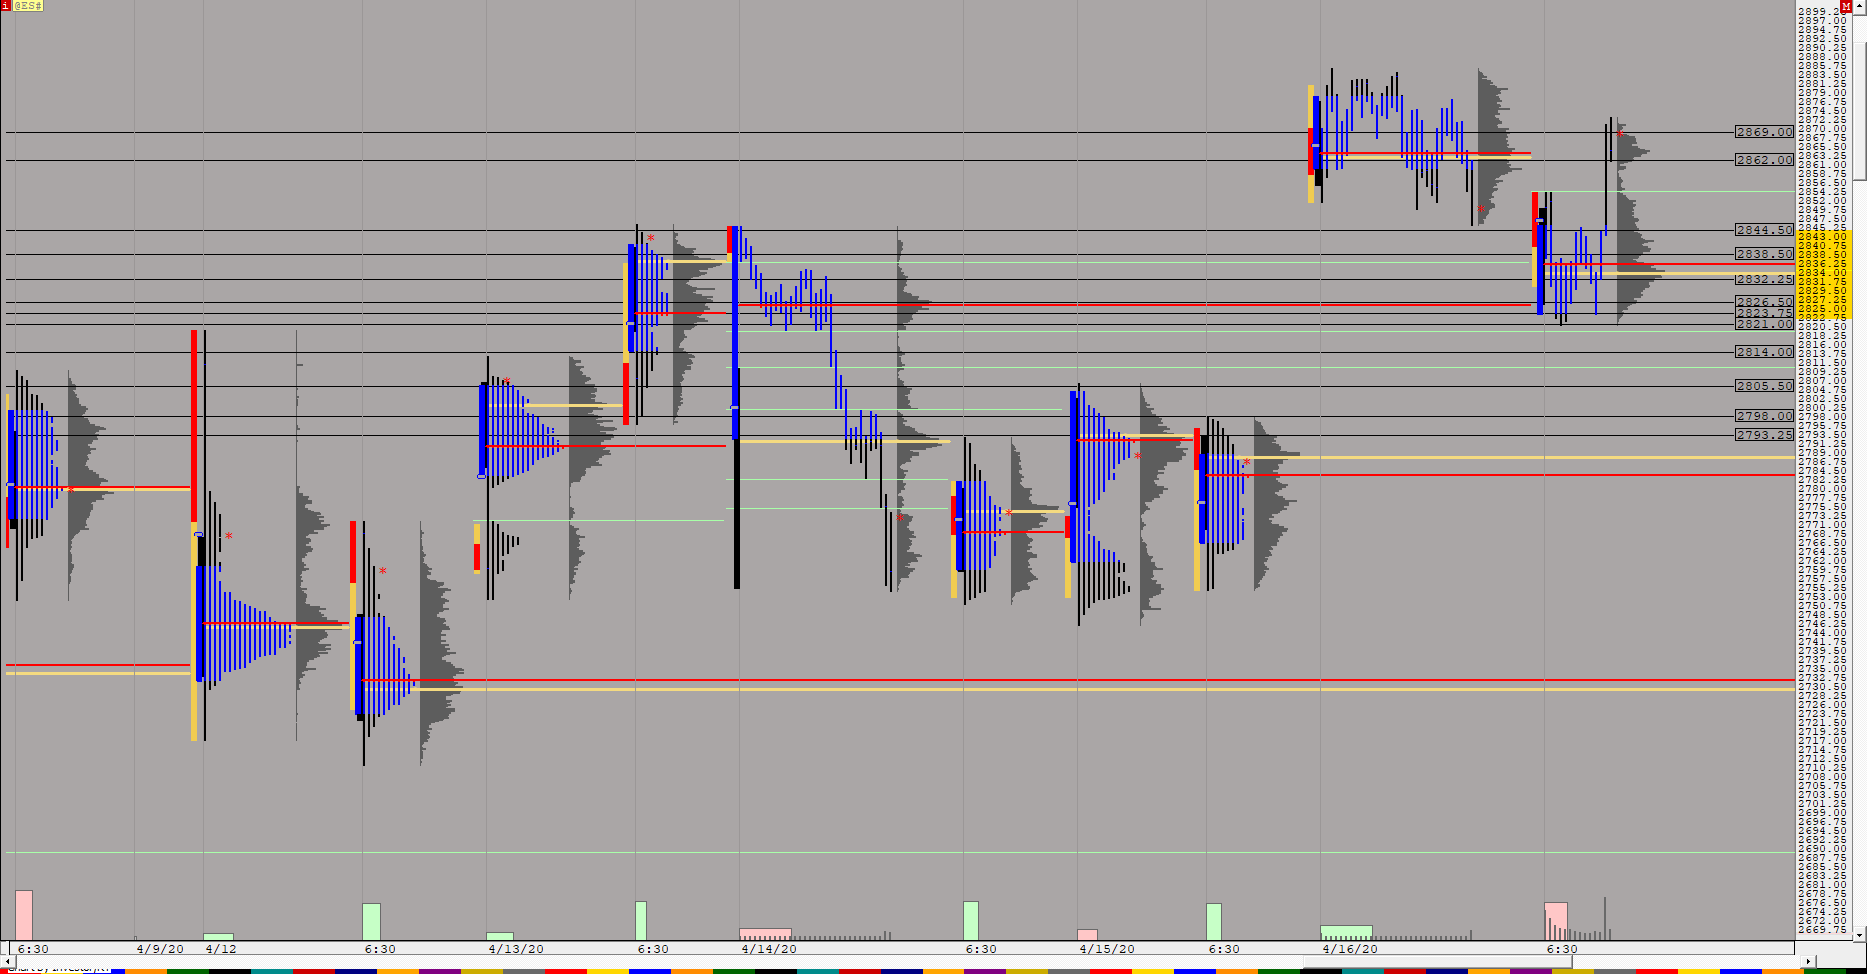
YMMINIVPa (@YM#) ES42 [totalcount]
5 years 8 months ago
YM.Monthly Profiles, 480 MIN Bars, Measured Move levels. This chart was uploaded by Investor/RT 13.6.15 showing symbol: @YM#. |
View |
 |
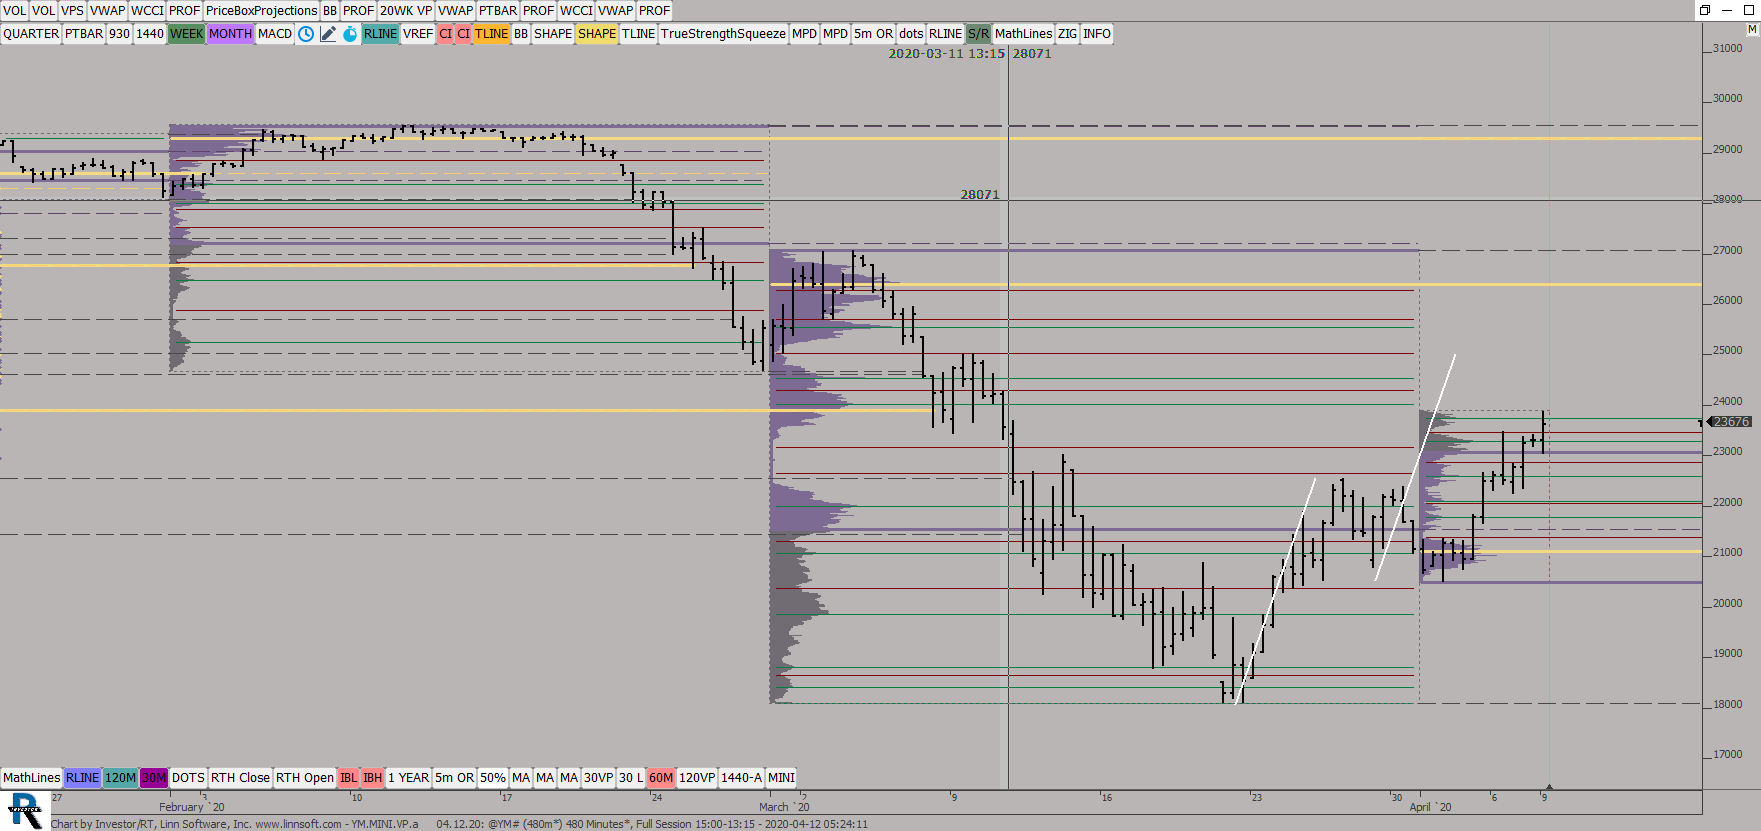
GCMINIVPc (QGC#) ES42 [totalcount]
5 years 8 months ago
GOLD. 20/20 60 MIN chart, Daily Profiles, Measured move projections. This chart was uploaded by Investor/RT 13.6.15 showing symbol: QGC#. |
View |
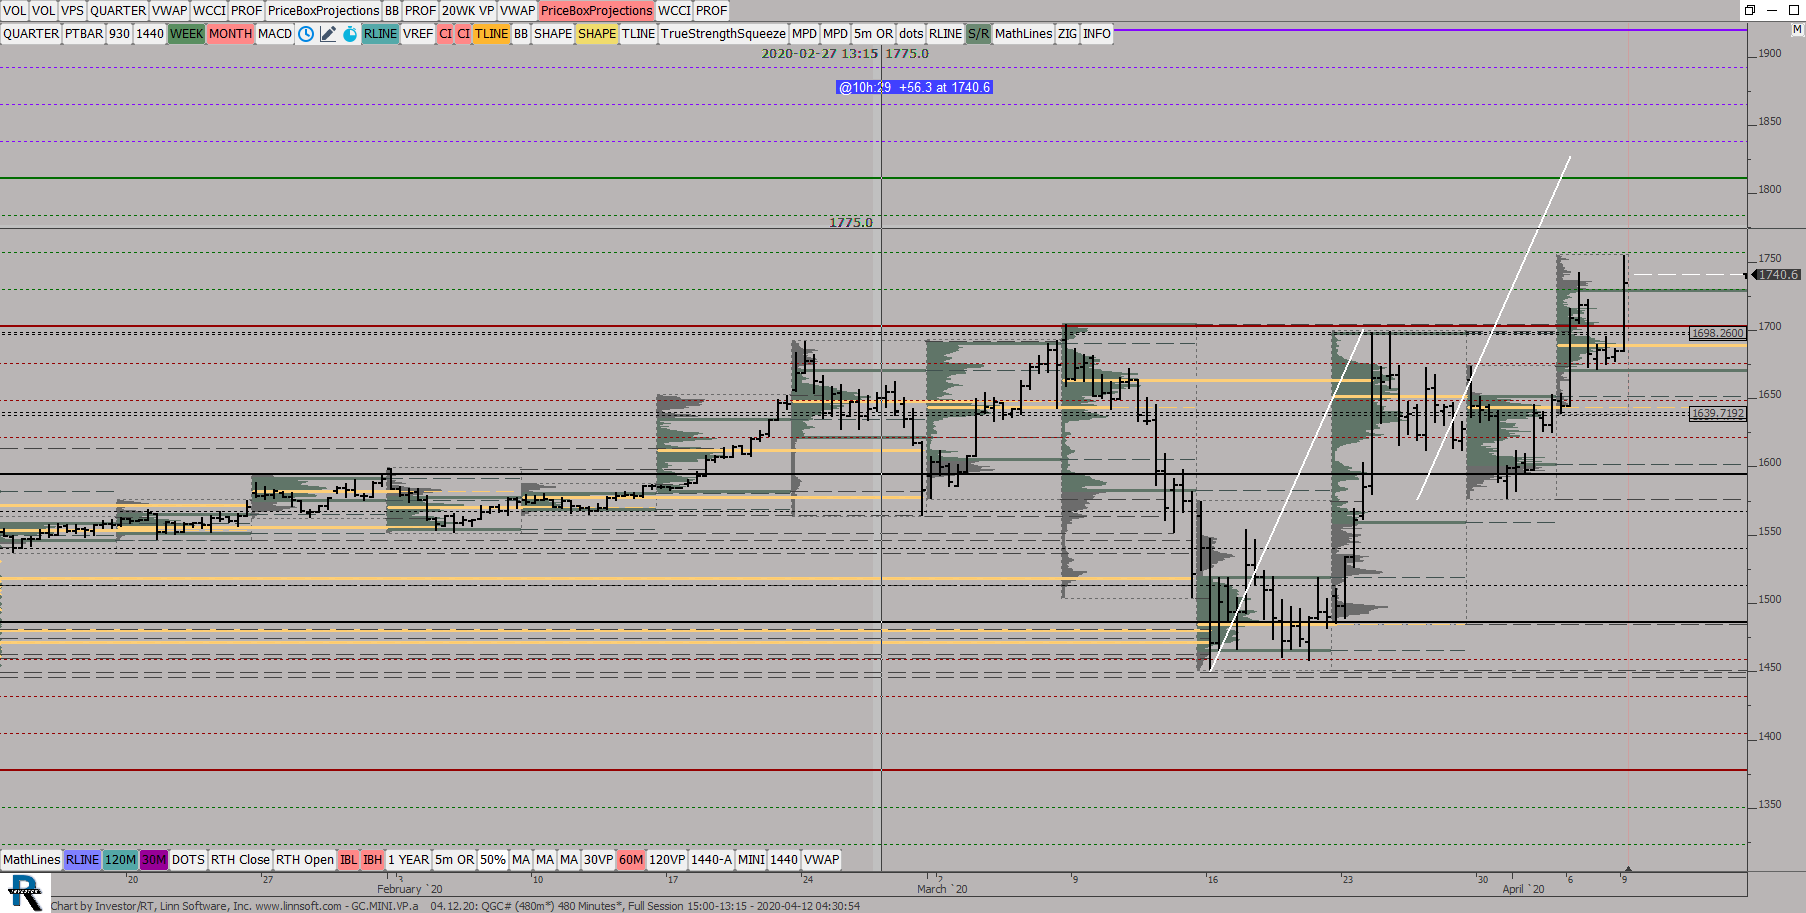 |
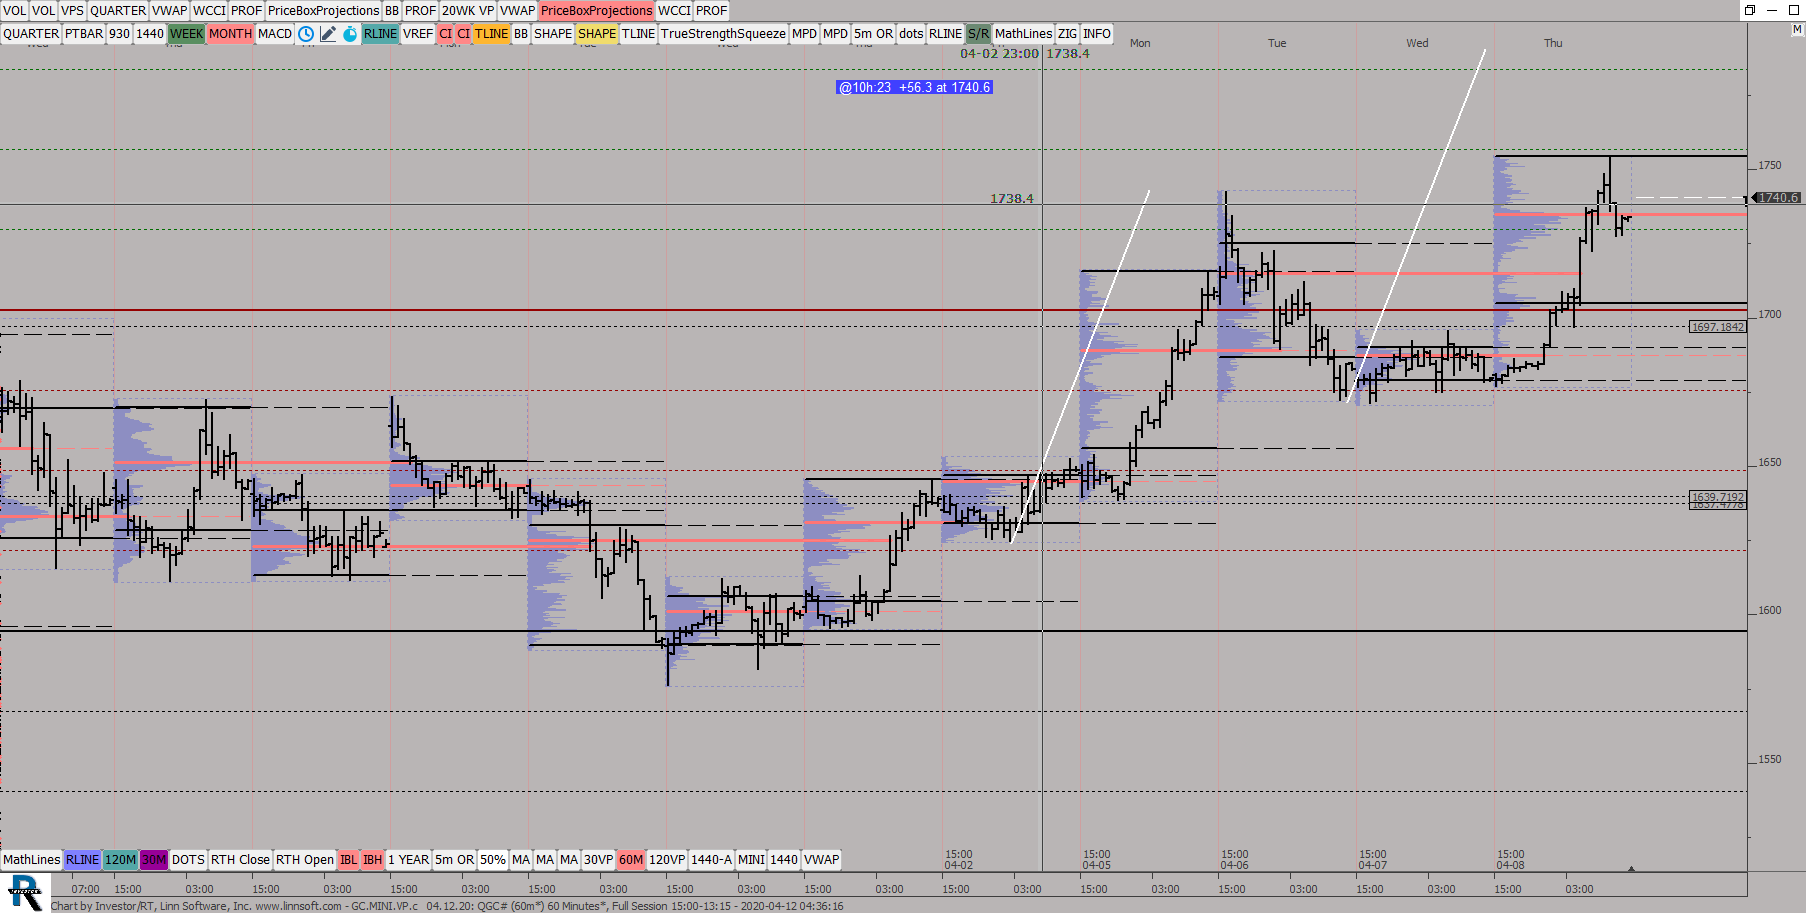
GCMINIVPa (QGC#) ES42 [totalcount]
5 years 8 months ago
GOLD. 20/20 480 MIN chart Measured move projections. This chart was uploaded by Investor/RT 13.6.15 showing symbol: QGC#. |
View |
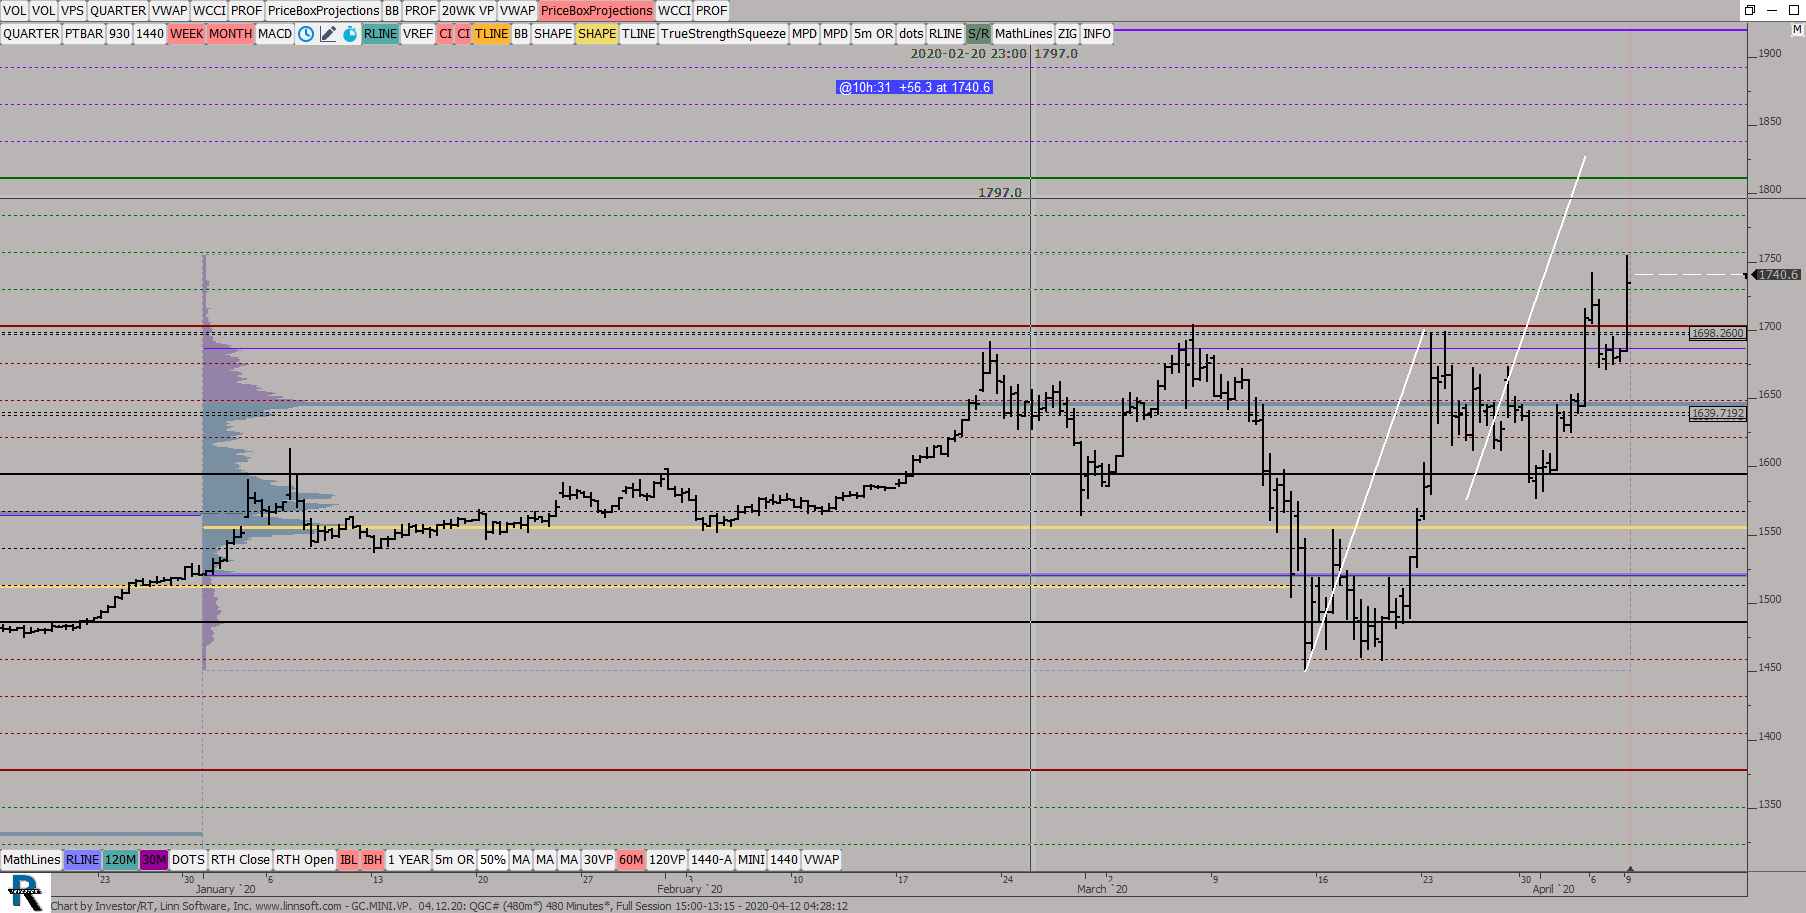 |
GCMINIVP (QGC#) ES42 [totalcount]
5 years 8 months ago
GOLD. 20/20 480 MIN chart Measured move projections. This chart was uploaded by Investor/RT 13.6.15 showing symbol: QGC#. |
View |