 |
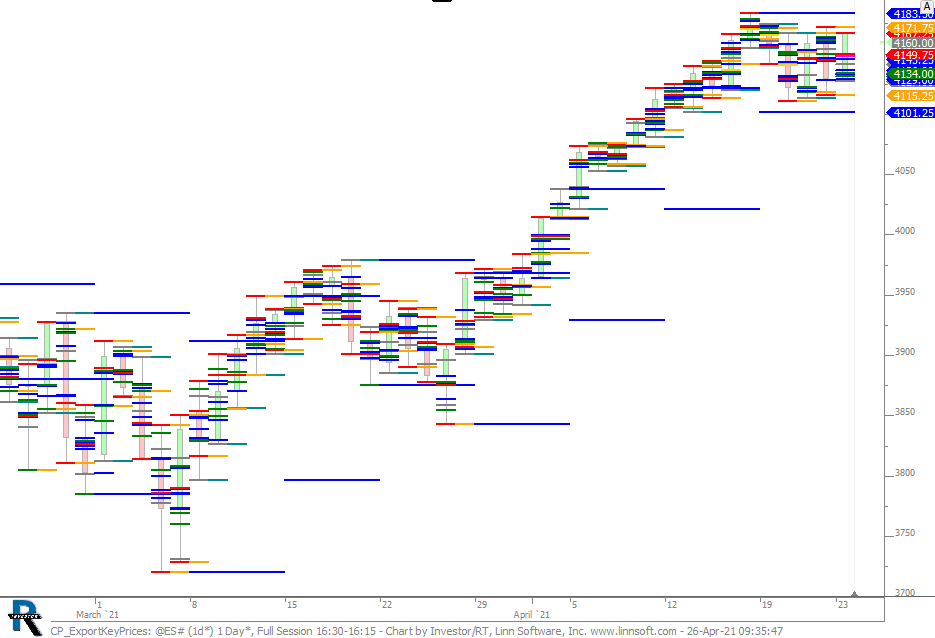
CP ExportKeyPrices (@ES#) cpayne [totalcount]
5 years 3 months ago
Export Key Prices via the SessionPrices indicator by right-cliicking on the chart and Export > All Chart Data. |
View |
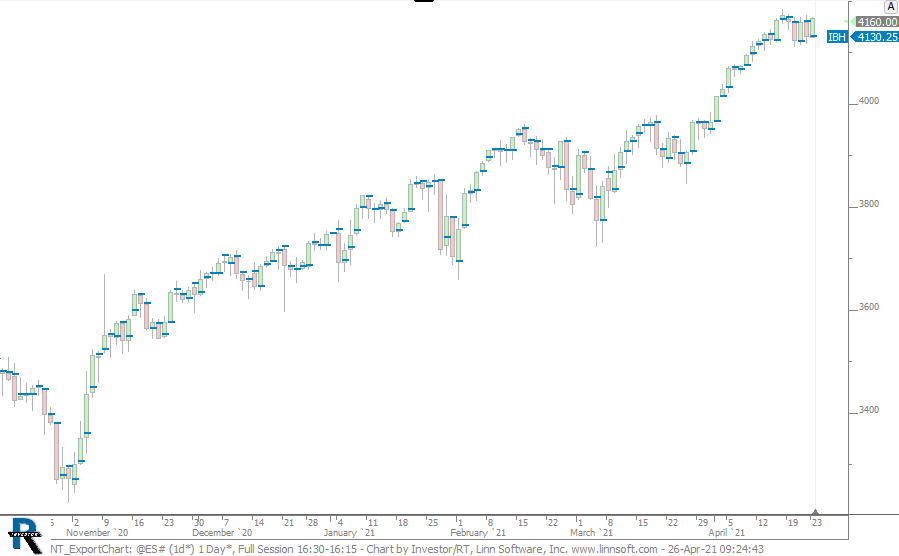 |
NT ExportChart (@ES#) cpayne [totalcount]
5 years 3 months ago
This chart was uploaded by Investor/RT 14.2.6 showing symbol: @ES#. |
View |
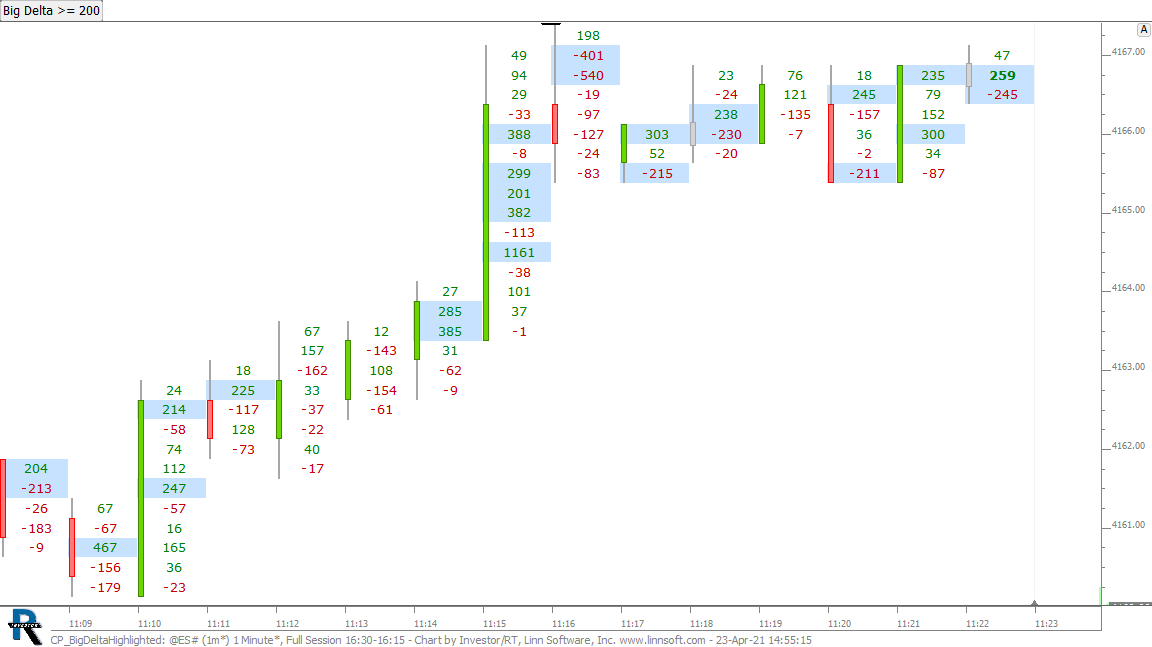 |
CP BigDeltaHighlighted (@ES#) cpayne [totalcount]
5 years 3 months ago
Highlight Big Delta at Price. This chart was uploaded by Investor/RT 14.2.6 showing symbol: @ES#. |
View |
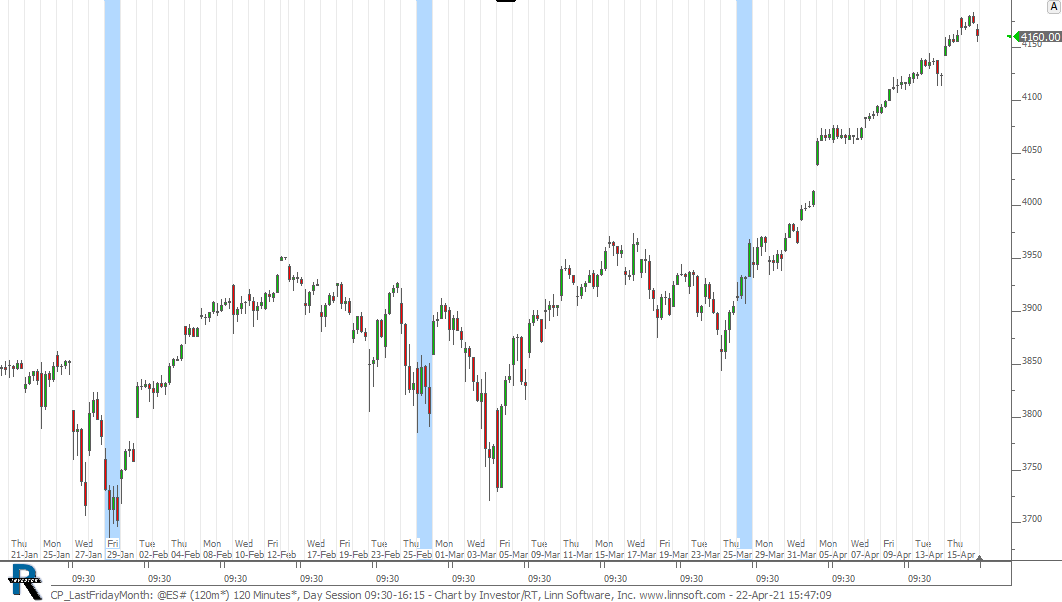 |
CP LastFridayMonth (@ES#) cpayne [totalcount]
5 years 3 months ago
Highlight Last Friday Session of each Month. This chart was uploaded by Investor/RT 14.2.6 showing symbol: @ES#. |
View |
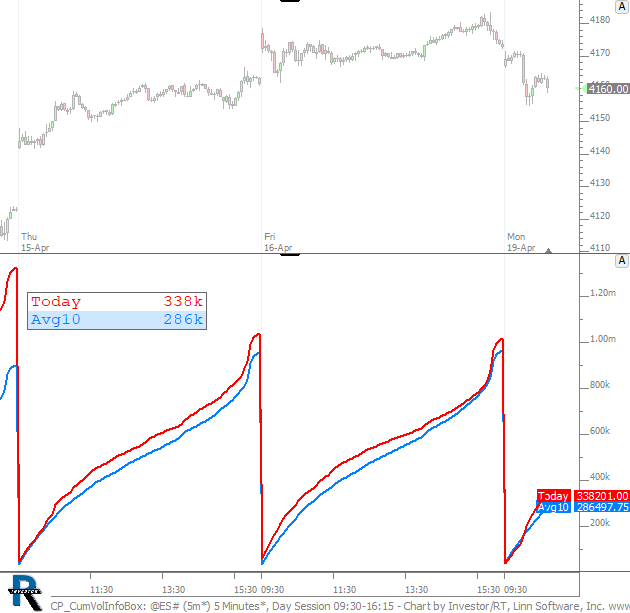 |
CP CumVolInfoBox (@ES#) cpayne [totalcount]
5 years 3 months ago
This chart was uploaded by Investor/RT 14.2.6 showing symbol: @ES#. |
View |
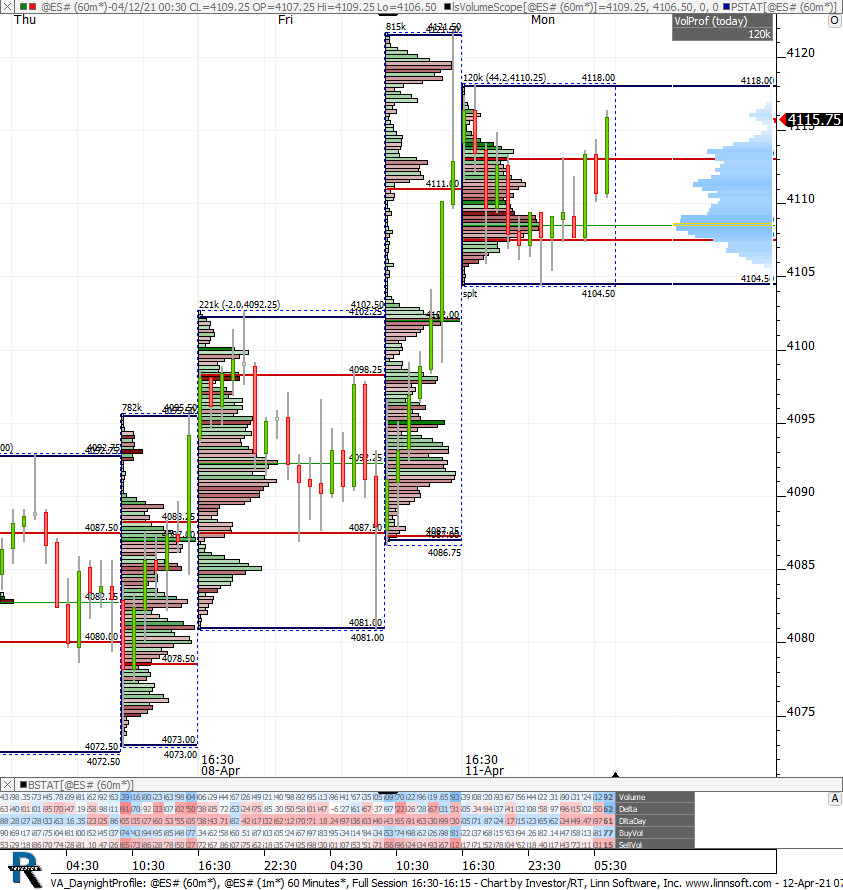 |
VA DaynightProfile (@ES#) cpayne [totalcount]
5 years 3 months ago
This chart was uploaded by Investor/RT 14.2.6 showing symbol: @ES#. |
View |
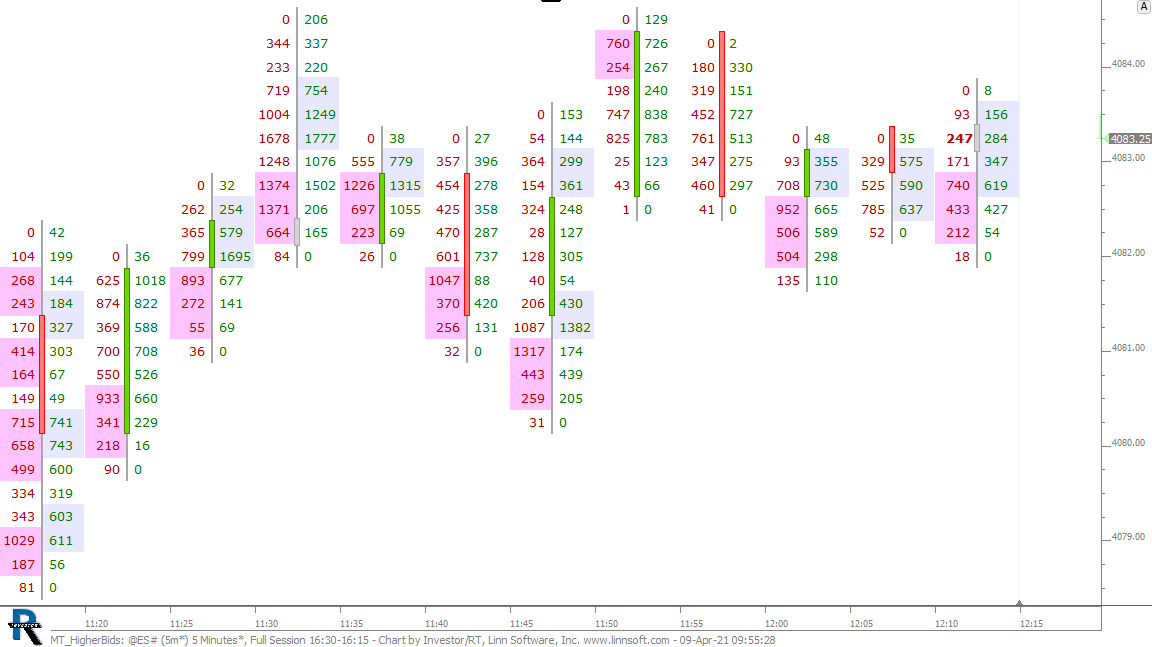 |
MT HigherBids (@ES#) cpayne [totalcount]
5 years 3 months ago
This chart was uploaded by Investor/RT 14.2.6 showing symbol: @ES#. |
View |
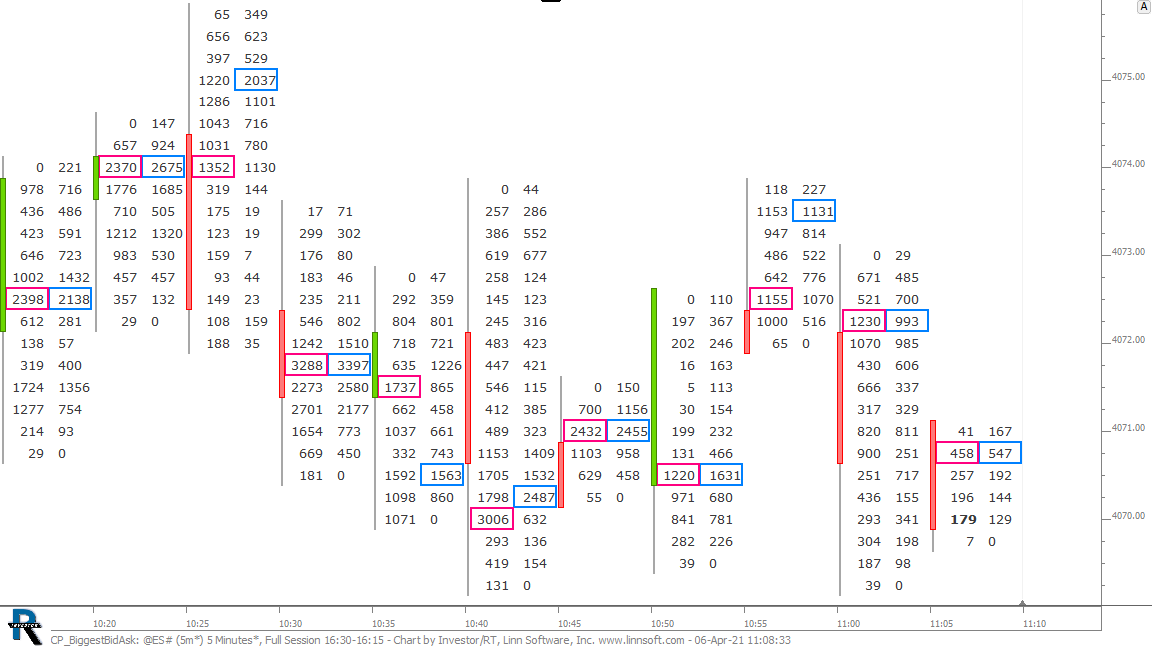 |
CP BiggestBidAsk (@ES#) cpayne [totalcount]
5 years 3 months ago
MPH highlights the biggest bid and ask volume within each bar. This chart was uploaded by Investor/RT 14.2.6 showing symbol: @ES#. |
View |
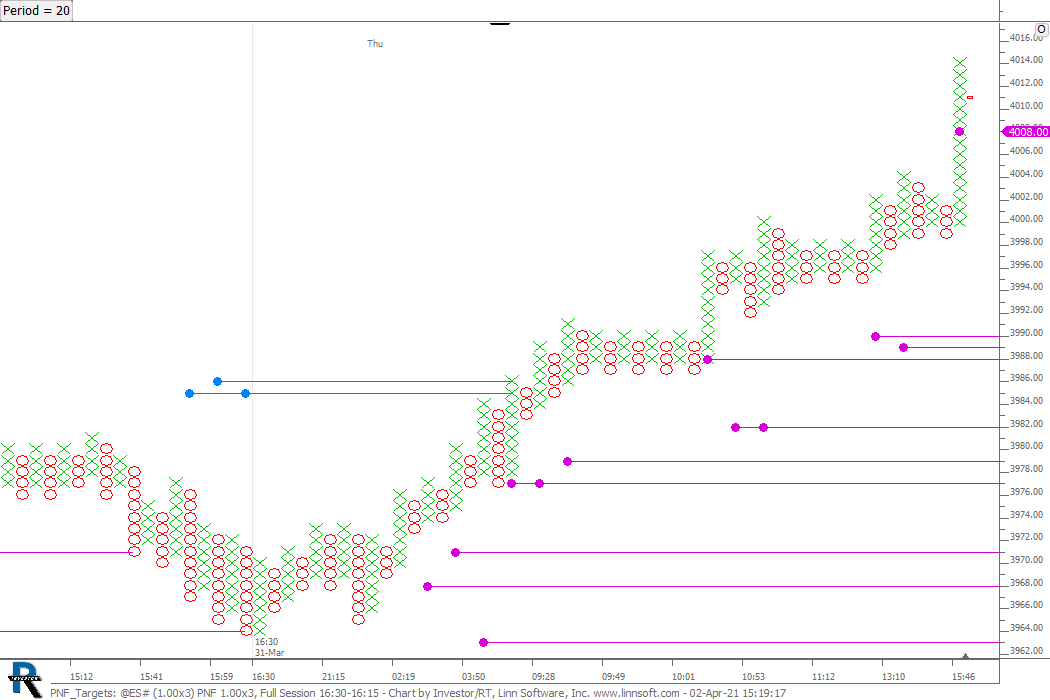 |
PNF Targets (@ES#) cpayne [totalcount]
5 years 3 months ago
PNF Targets. This chart was uploaded by Investor/RT 14.2.6 showing symbol: @ES#. |
View |
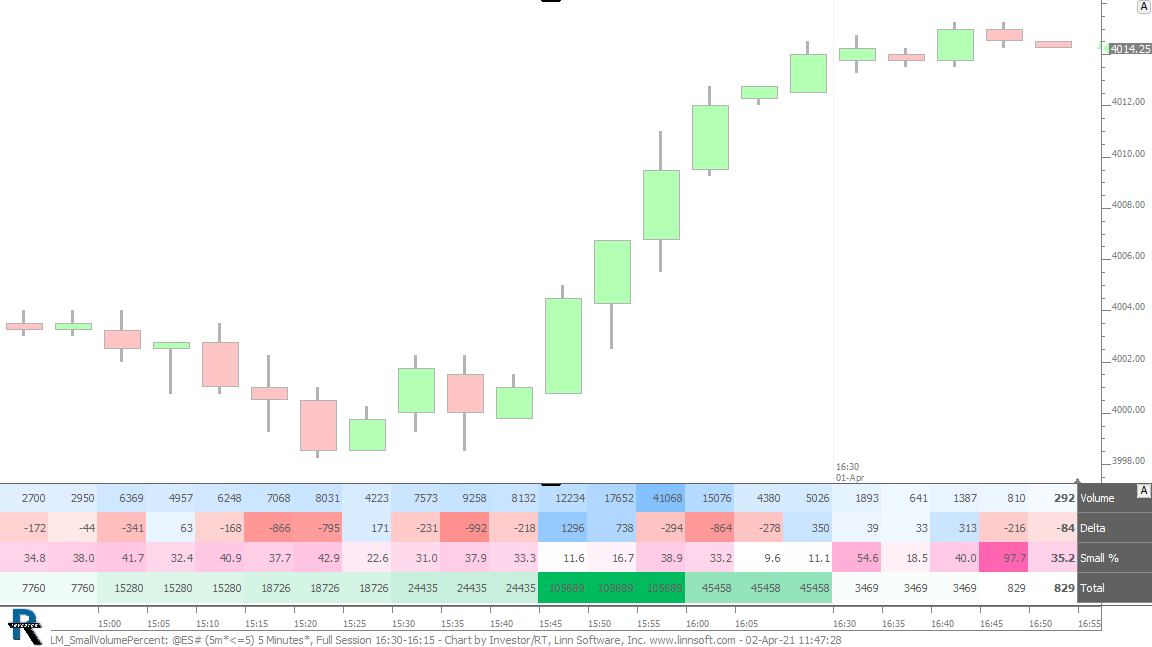 |
LM SmallVolumePercent (@ES#) cpayne [totalcount]
5 years 3 months ago
This chart was uploaded by Investor/RT 14.2.6 showing symbol: @ES#. |
View |
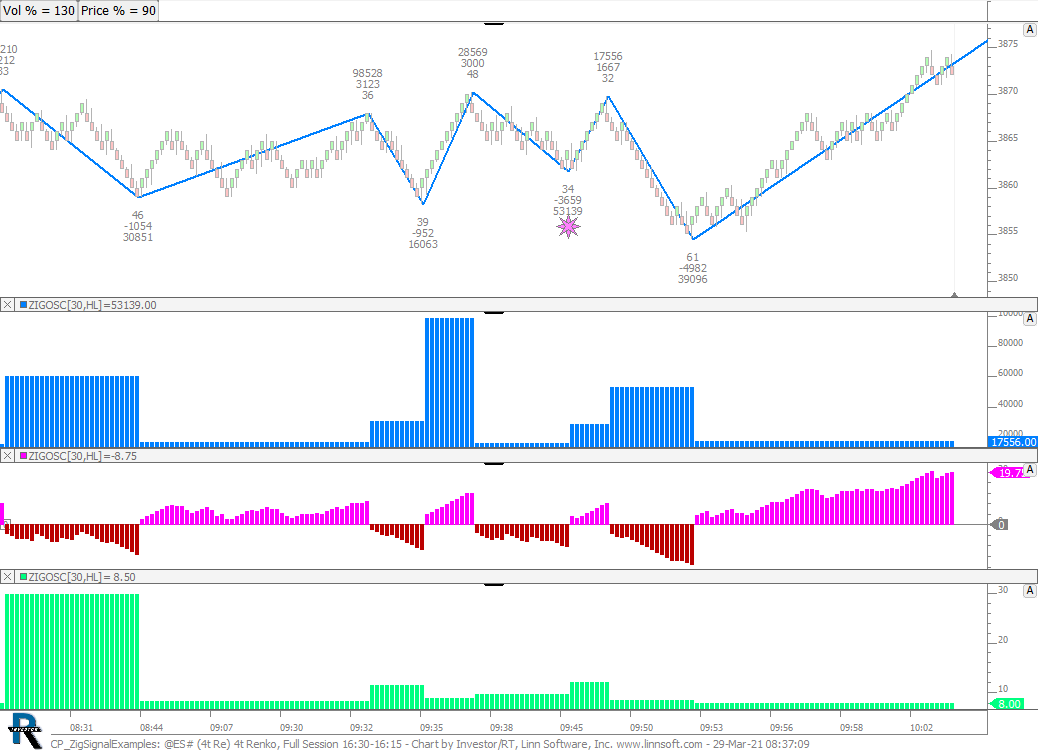 |
CP ZigSignalExamples (@ES#) cpayne [totalcount]
5 years 4 months ago
This chart was uploaded by Investor/RT 14.2.6 showing symbol: @ES#. |
View |
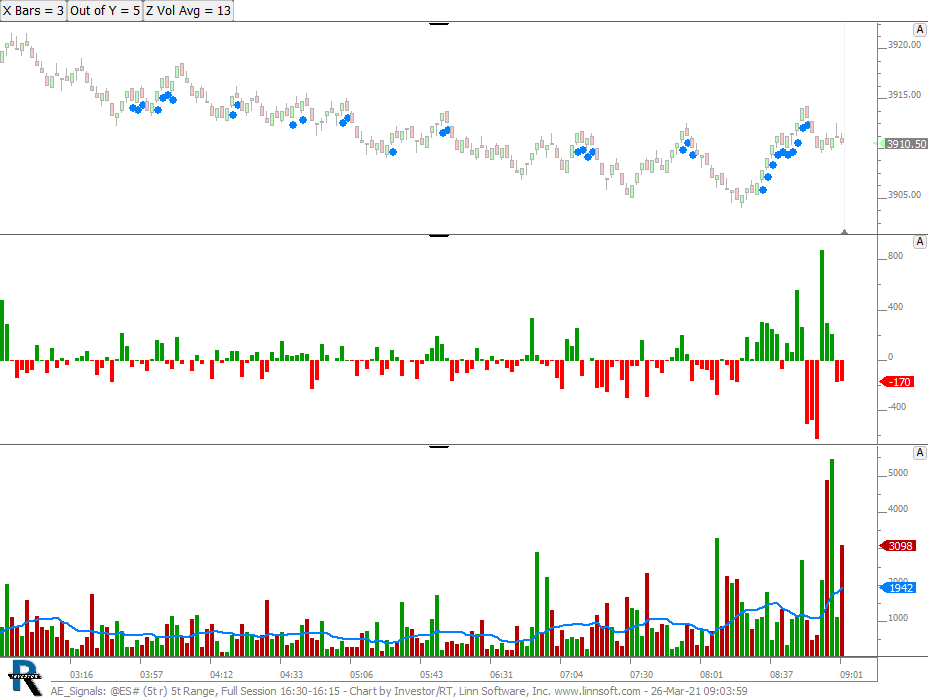 |
AE Signals (@ES#) cpayne [totalcount]
5 years 4 months ago
This chart was uploaded by Investor/RT 14.2.6 showing symbol: @ES#. |
View |
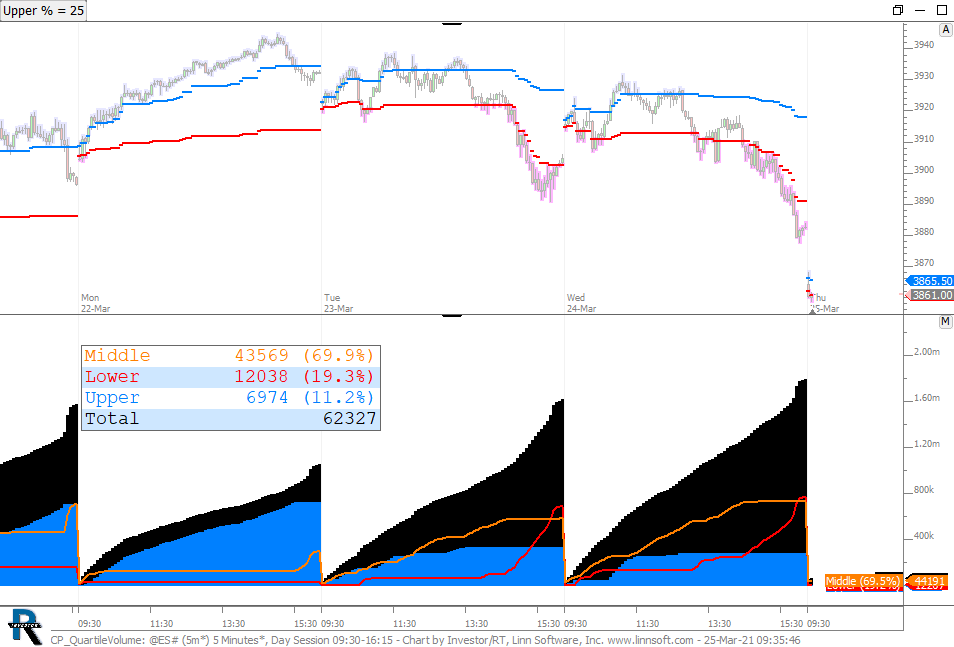 |
CP QuartileVolume (@ES#) cpayne [totalcount]
5 years 4 months ago
Volume of Upper Quartile Prices. This chart was uploaded by Investor/RT 14.2.6 showing symbol: @ES#. |
View |
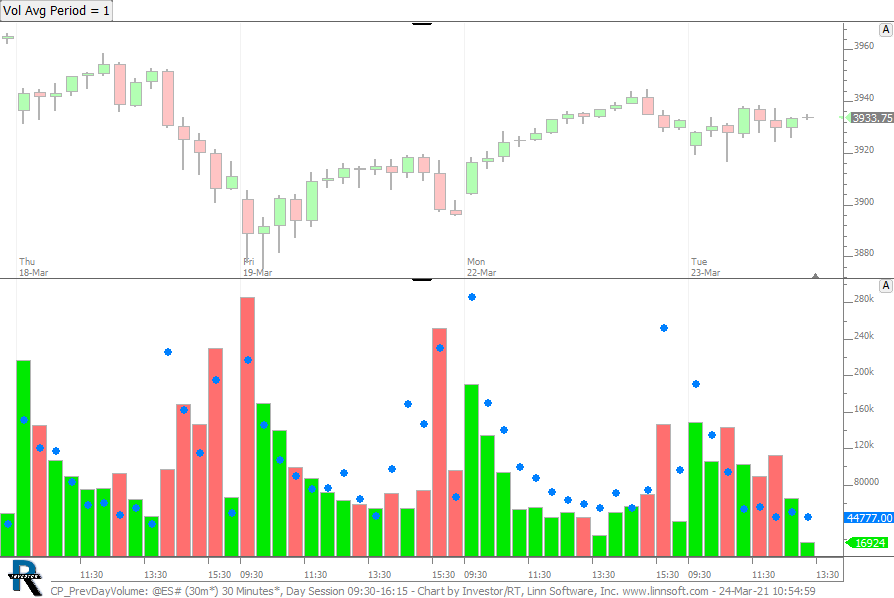 |
CP PrevDayVolume (@ES#) cpayne [totalcount]
5 years 4 months ago
Shows previous days volume on current session. Use button to change bars to the average of previous days at that time. |
View |
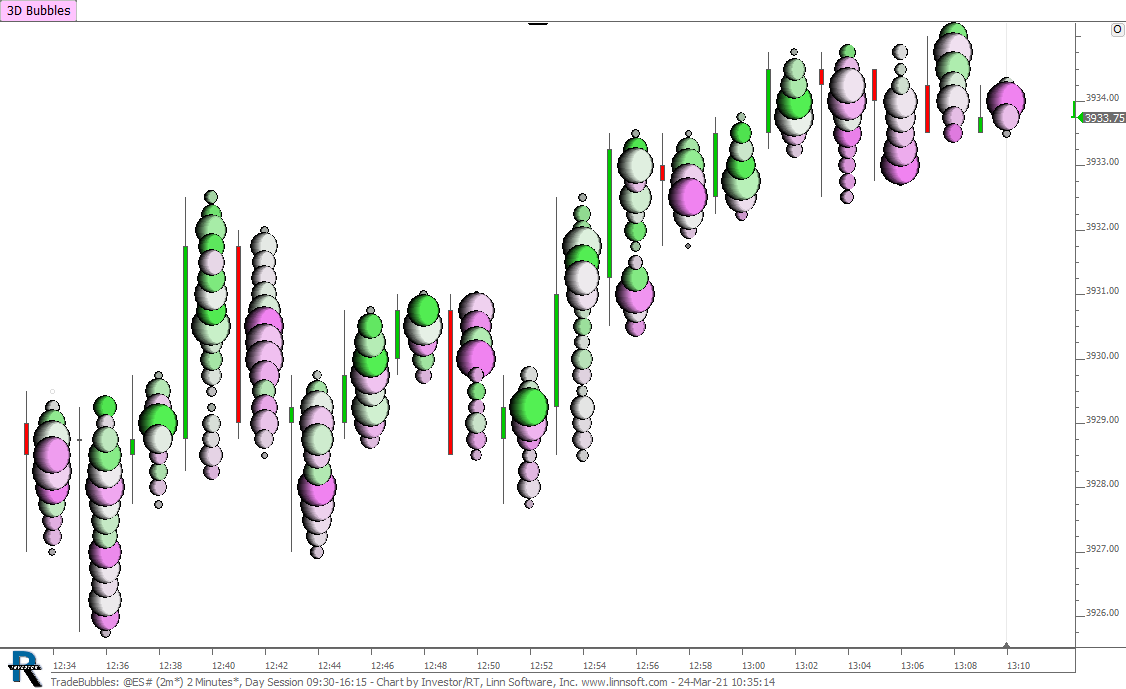 |
TradeBubbles (@ES#) cpayne [totalcount]
5 years 4 months ago
TradeBubbles. This chart was uploaded by Investor/RT 14.2.6 showing symbol: @ES#. |
View |
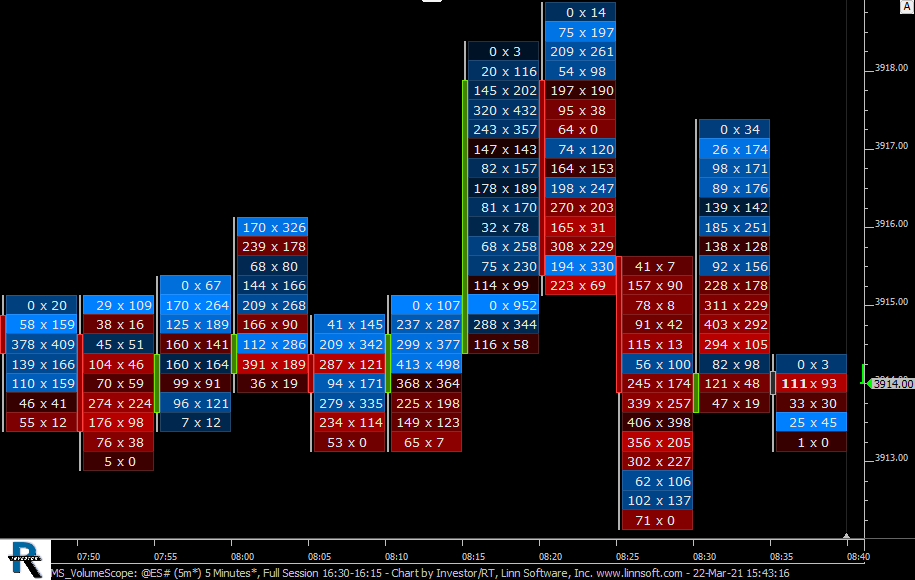 |
MS VolumeScope (@ES#) cpayne [totalcount]
5 years 4 months ago
This chart was uploaded by Investor/RT 14.2.6 showing symbol: @ES#. |
View |
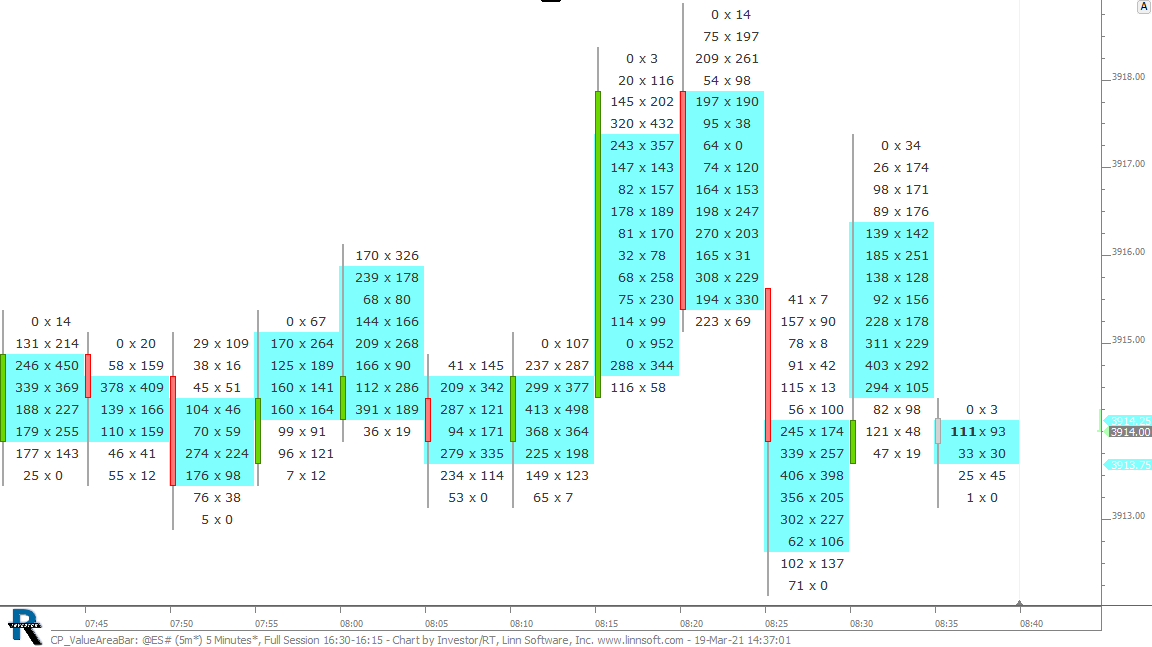 |
CP ValueAreaBar (@ES#) cpayne [totalcount]
5 years 4 months ago
Value Area of Bar highlighted with Bands Indicator. This chart was uploaded by Investor/RT 14.2.6 showing symbol: @ES#. |
View |
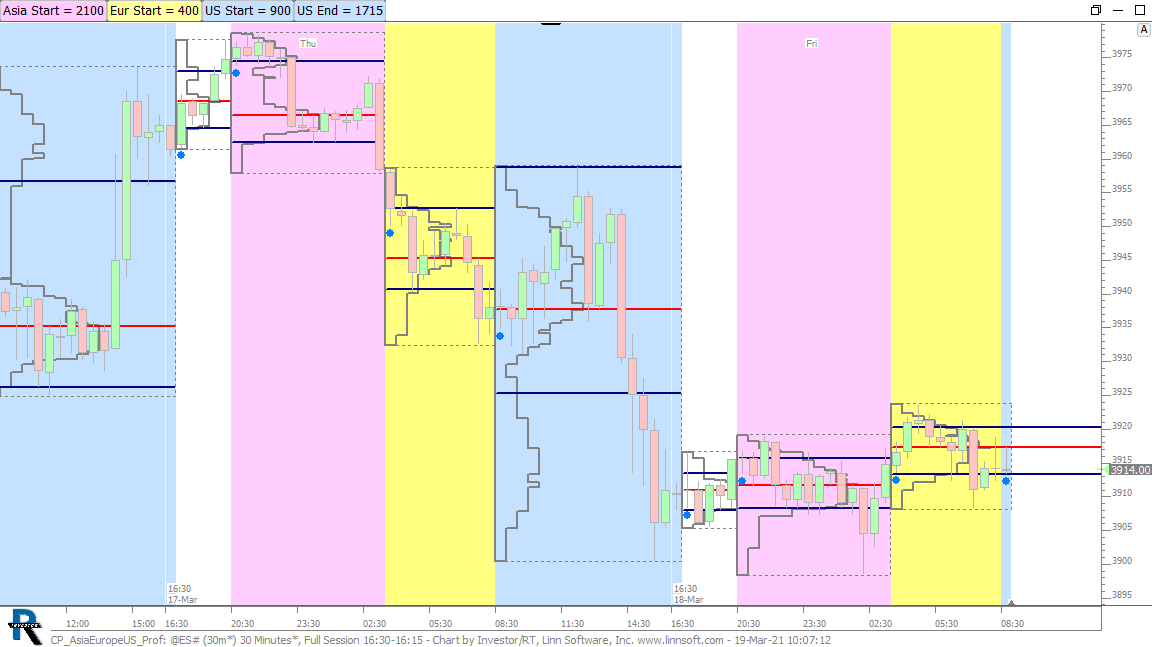 |
CP AsiaEuropeUS Prof (@ES#) cpayne [totalcount]
5 years 4 months ago
Asia, Europe, and US Profiles. This chart was uploaded by Investor/RT 14.2.6 showing symbol: @ES#. |
View |
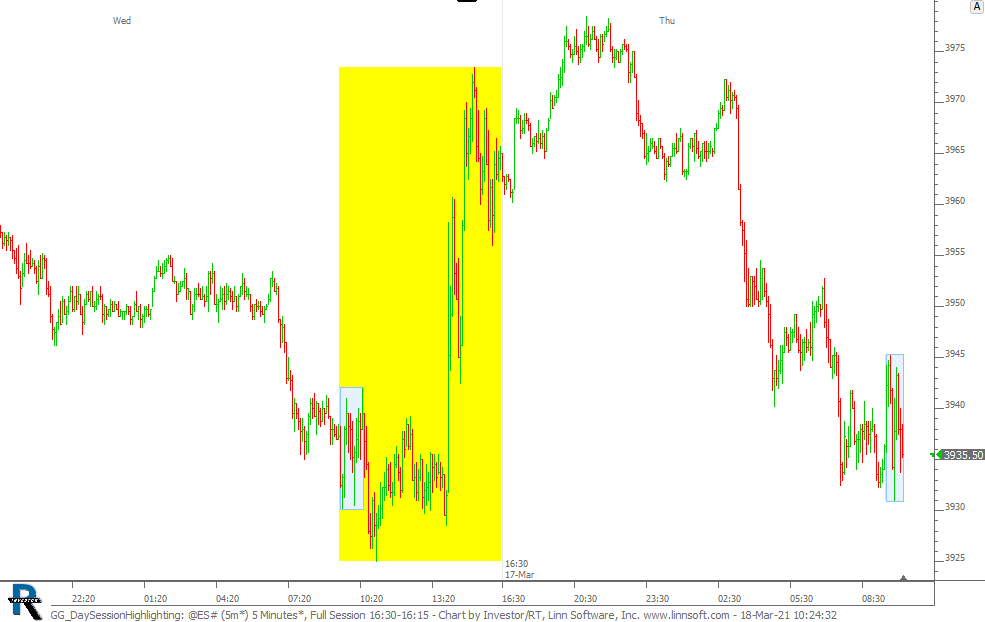 |
GG DaySessionHighlighting (@ES#) cpayne [totalcount]
5 years 4 months ago
This chart was uploaded by Investor/RT 14.2.6 showing symbol: @ES#. |
View |
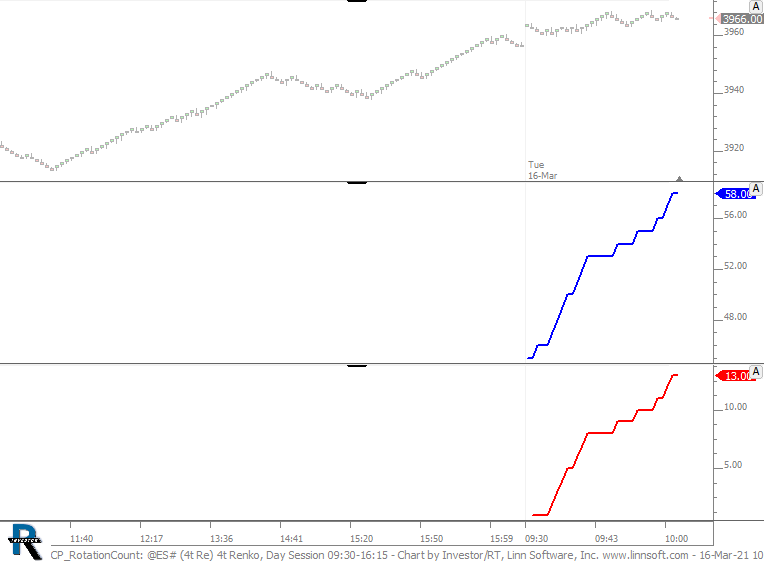 |
CP RotationCount (@ES#) cpayne [totalcount]
5 years 4 months ago
This chart was uploaded by Investor/RT 14.2.6 showing symbol: @ES#. |
View |
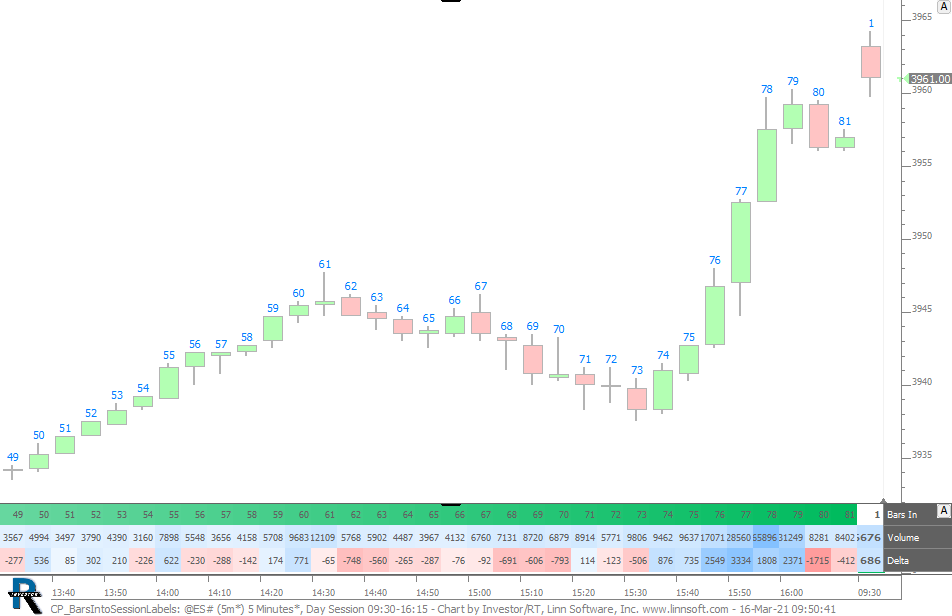 |
CP BarsIntoSessionLabels (@ES#) cpayne [totalcount]
5 years 4 months ago
Show Bars Into Session as Text as either Signal Marker labels or Bar Statistics. This chart was uploaded by Investor/RT 14.2.6 showing symbol: @ES#. |
View |
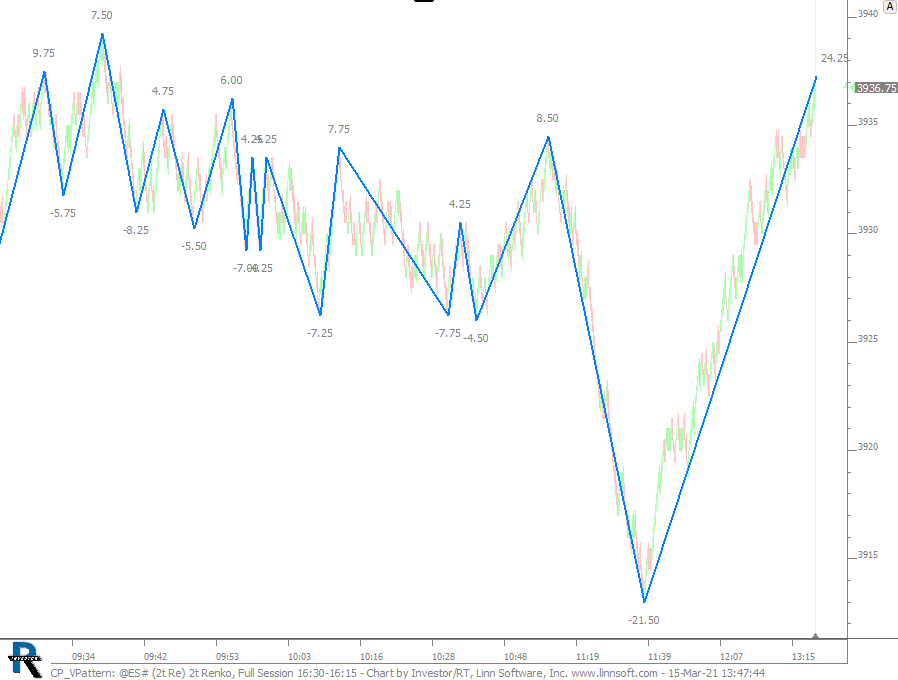 |
CP VPattern (@ES#) cpayne [totalcount]
5 years 4 months ago
This chart was uploaded by Investor/RT 14.2.6 showing symbol: @ES#. |
View |
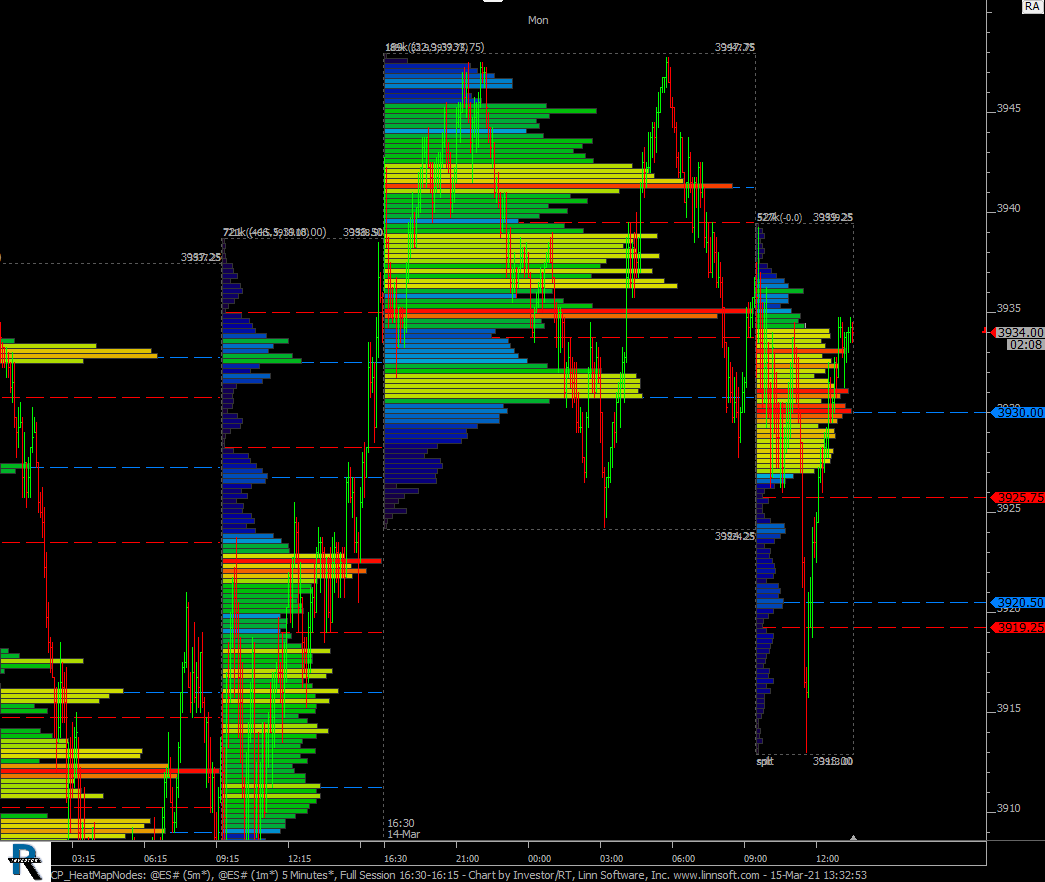 |
CP HeatMapNodes (@ES#) cpayne [totalcount]
5 years 4 months ago
This chart was uploaded by Investor/RT 14.2.6 showing symbol: @ES#. |
View |
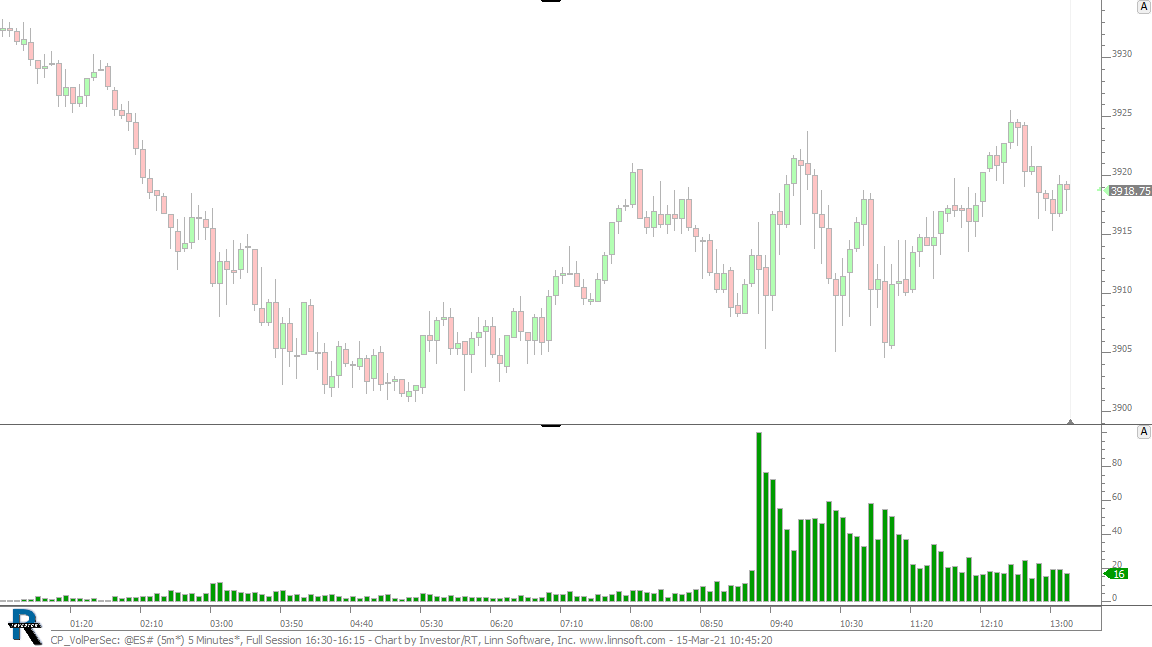 |
CP VolPerSec (@ES#) cpayne [totalcount]
5 years 4 months ago
Volume Per Second with Volume Breakdown. This chart was uploaded by Investor/RT 14.2.6 showing symbol: @ES#. |
View |
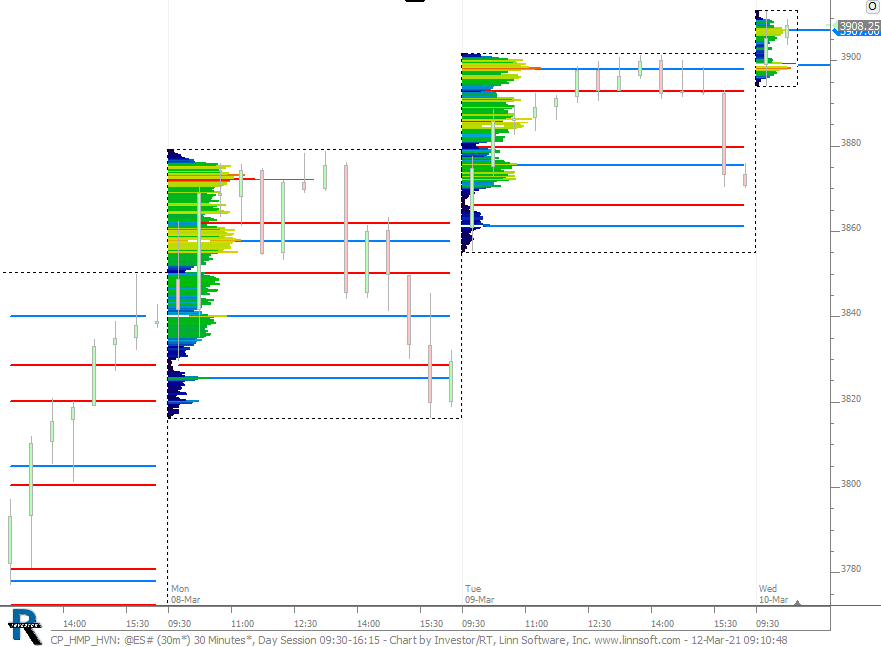 |
CP HMP HVN (@ES#) cpayne [totalcount]
5 years 4 months ago
This chart was uploaded by Investor/RT 14.2.6 showing symbol: @ES#. |
View |