 |
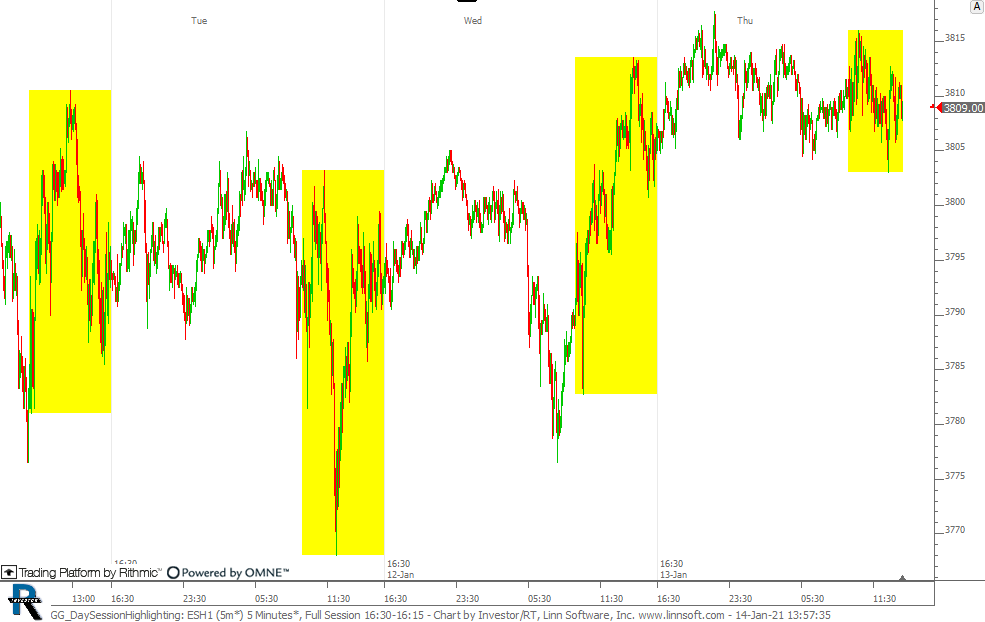
GG DaySessionHighlighting (ESH1) cpayne [totalcount]
4 years 11 months ago
Chart highlights the day session range in yellow. This chart was uploaded by Investor/RT 14.2.6 showing symbol: ESH1. |
View |
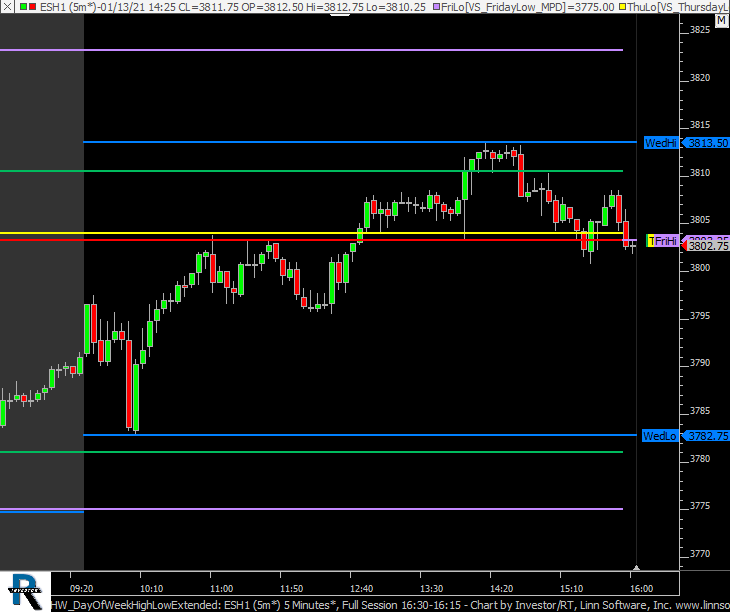 |
HW DayOfWeekHighLowExtended (ESH1) cpayne [totalcount]
4 years 11 months ago
The day session high and low of each day of the week is extended through the week until it resets on same day of week on following week. |
View |
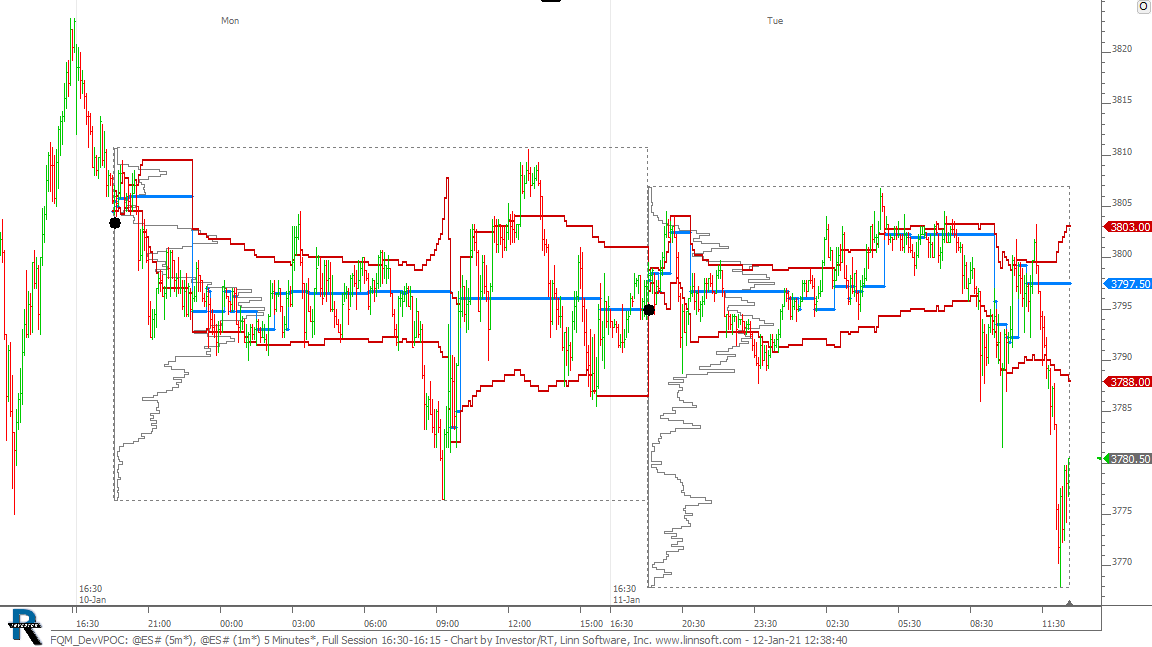 |
FQM DevVPOC (@ES#) cpayne [totalcount]
4 years 11 months ago
This chart was uploaded by Investor/RT 14.2.6 showing symbol: @ES#. |
View |
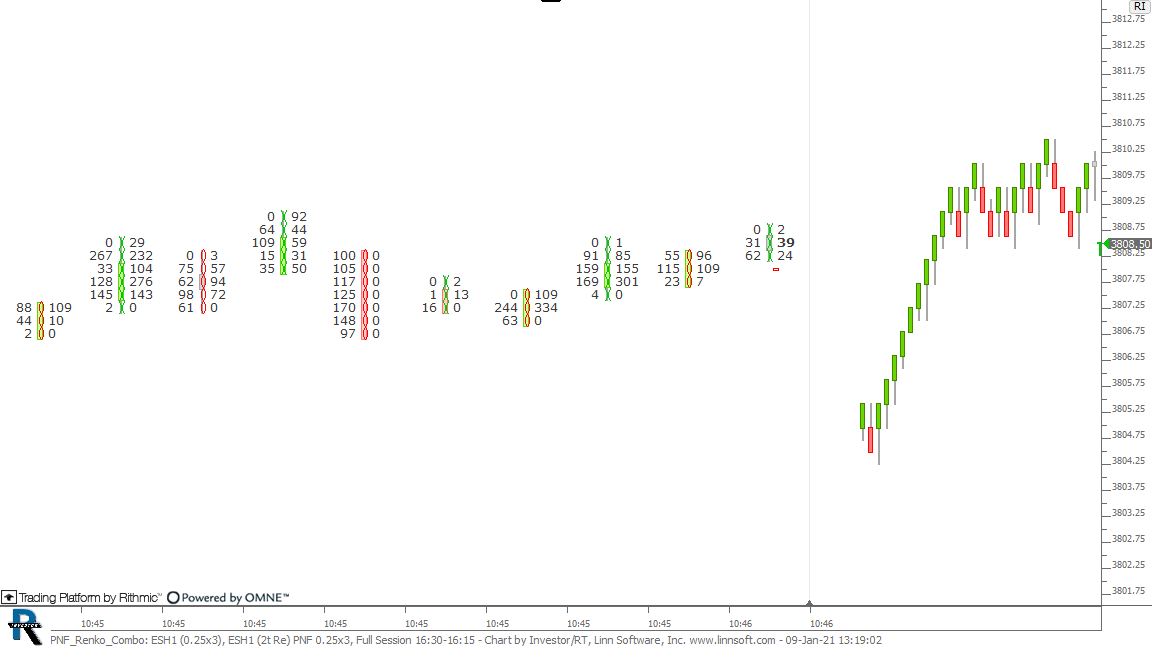 |
PNF Renko Combo (ESH1) cpayne [totalcount]
4 years 11 months ago
This chart was uploaded by Investor/RT 14.2.6 showing symbol: ESH1. |
View |
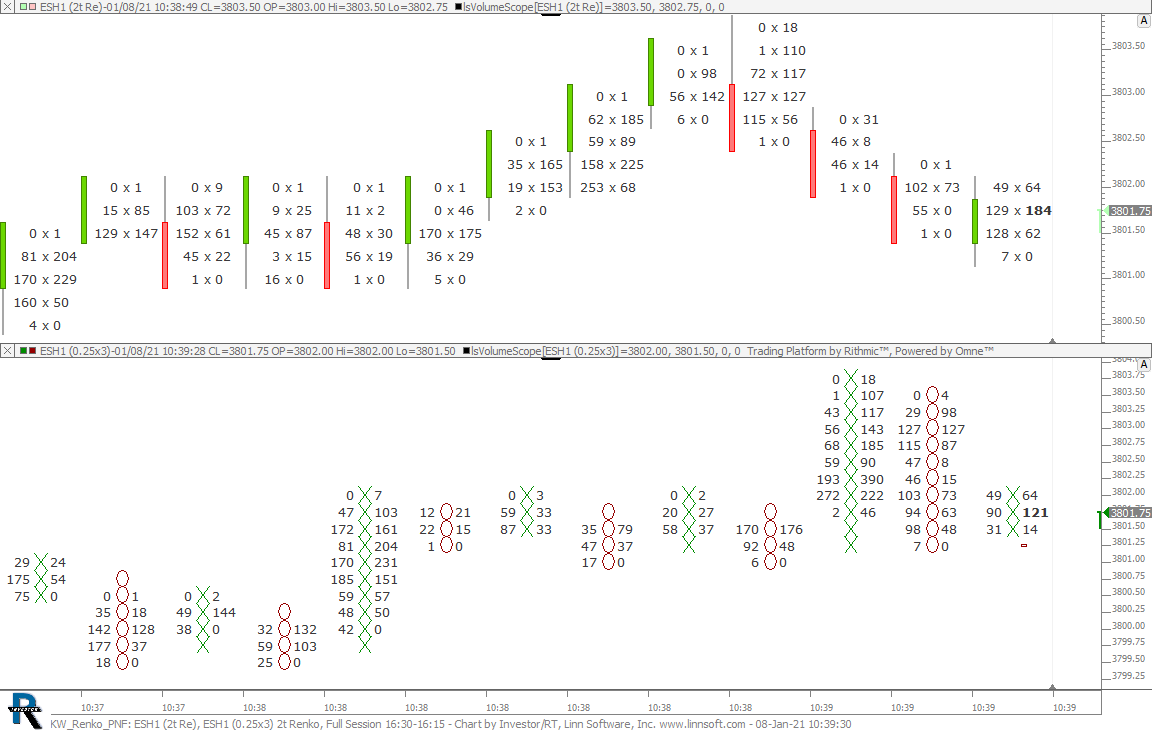 |
KW Renko PNF (ESH1) cpayne [totalcount]
4 years 11 months ago
Renko mixed with PNF. This chart was uploaded by Investor/RT 14.2.6 showing symbol: ESH1. |
View |
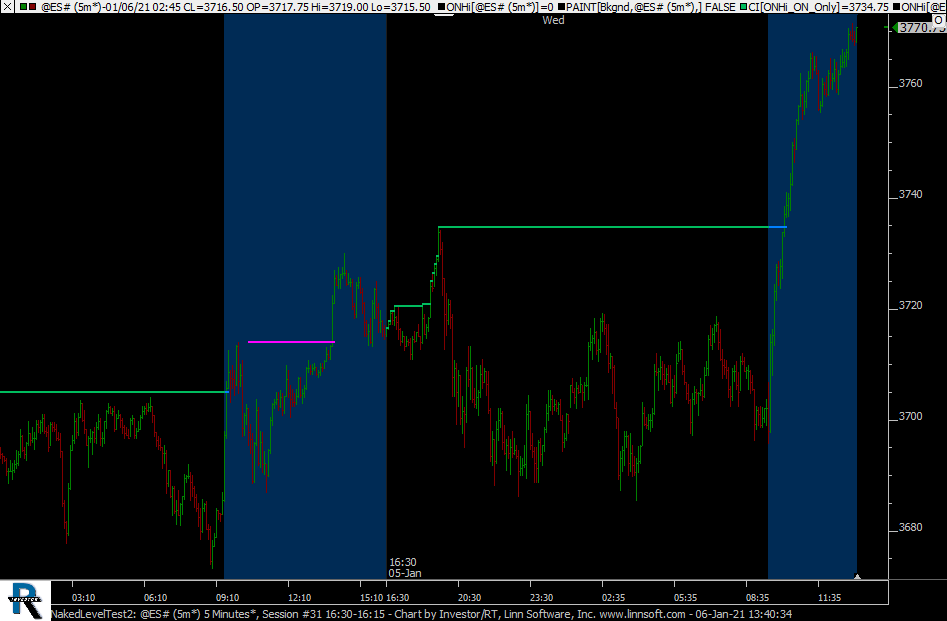 |
NakedLevelTest2 (@ES#) cpayne [totalcount]
4 years 11 months ago
This chart was uploaded by Investor/RT 14.2.6 showing symbol: @ES#. |
View |
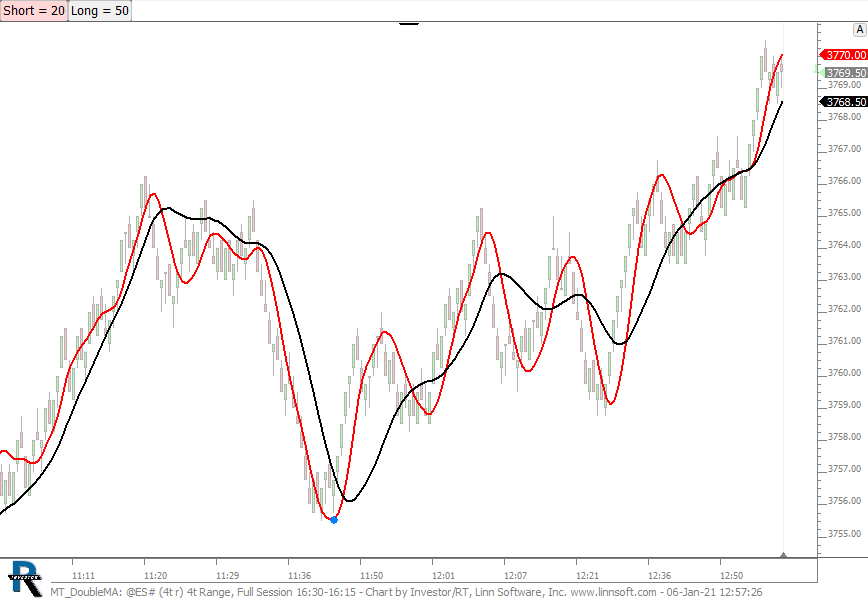 |
MT DoubleMA (@ES#) cpayne [totalcount]
4 years 11 months ago
This chart was uploaded by Investor/RT 14.2.6 showing symbol: @ES#. |
View |
|
|
ClearChart (@ES#) cpayne [totalcount]
4 years 11 months ago
This chart was uploaded by Investor/RT 14.2.6 showing symbol: @ES#. |
View |
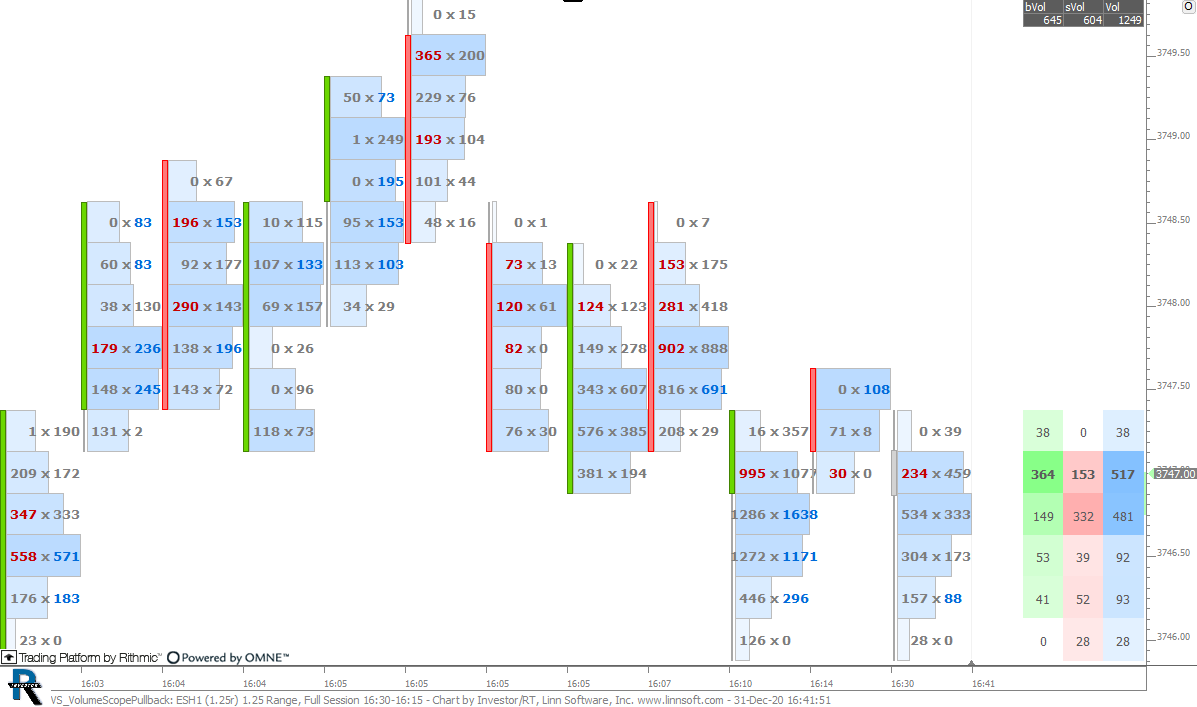 |
VS VolumeScopePullback (ESH1) cpayne [totalcount]
4 years 11 months ago
This chart was uploaded by Investor/RT 14.2.5 showing symbol: ESH1. |
View |
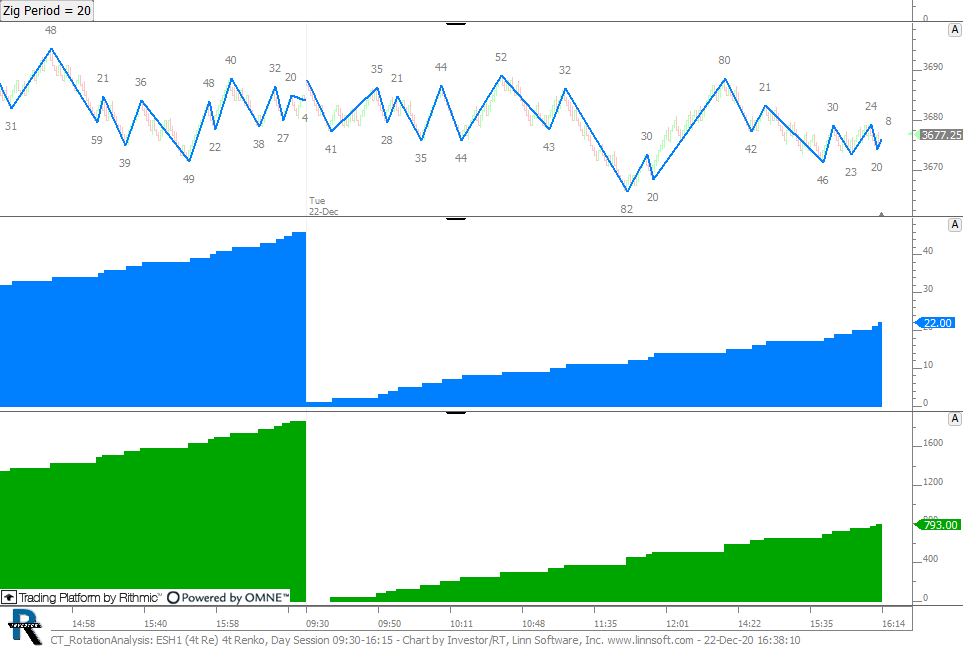 |
CT RotationAnalysis (ESH1) cpayne [totalcount]
4 years 12 months ago
This chart was uploaded by Investor/RT 14.2.5 showing symbol: ESH1. |
View |
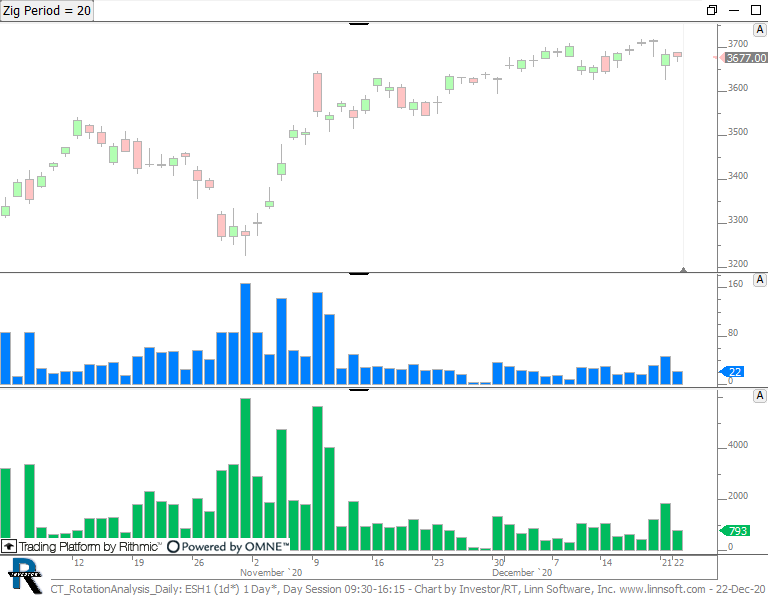 |
CT RotationAnalysis Daily (ESH1) cpayne [totalcount]
4 years 12 months ago
This chart was uploaded by Investor/RT 14.2.5 showing symbol: ESH1. |
View |
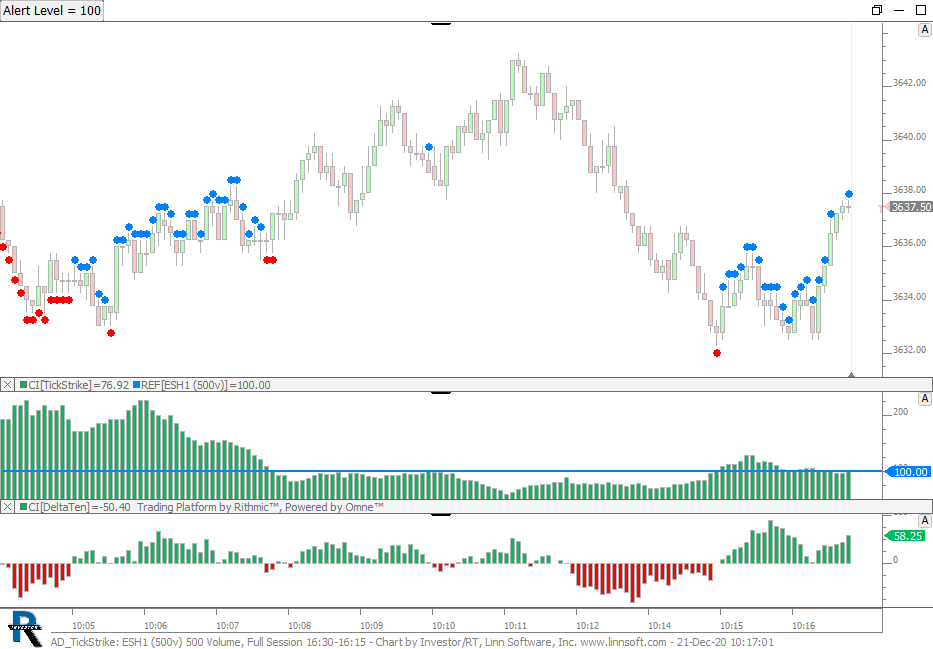 |
AD TickStrike (ESH1) cpayne [totalcount]
4 years 12 months ago
This chart was uploaded by Investor/RT 14.2.5 showing symbol: ESH1. |
View |
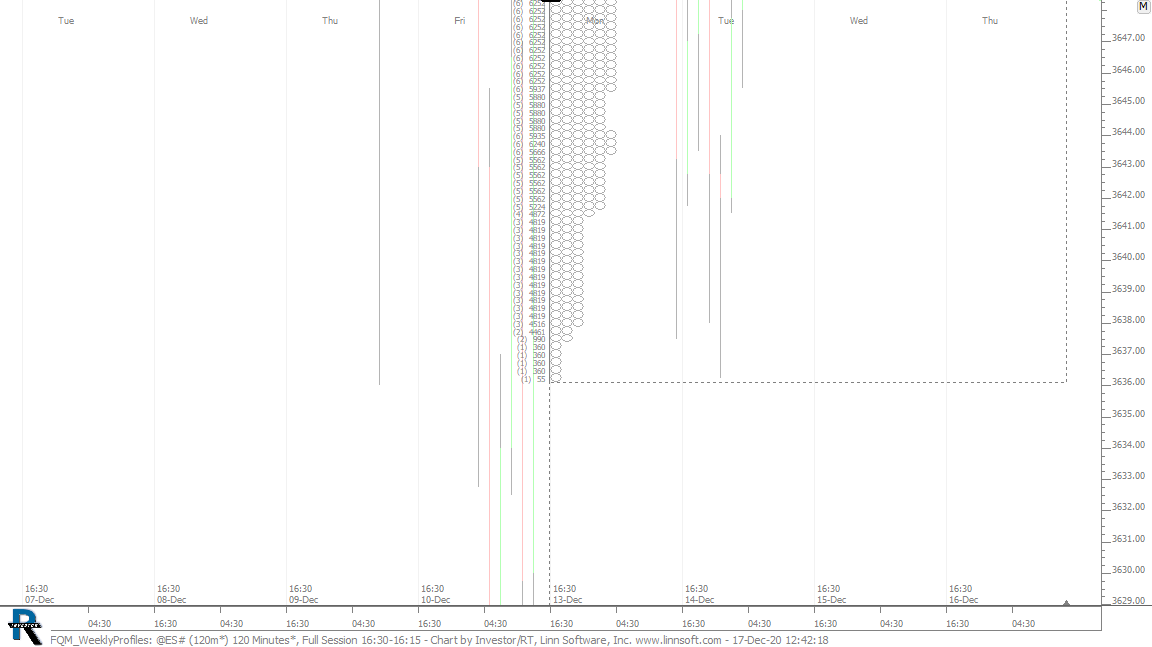 |
FQM WeeklyProfiles (@ES#) cpayne [totalcount]
5 years 2 days ago
Weekly Profiles - 120 Minute TPOs. This chart was uploaded by Investor/RT 14.2.5 showing symbol: @ES#. |
View |
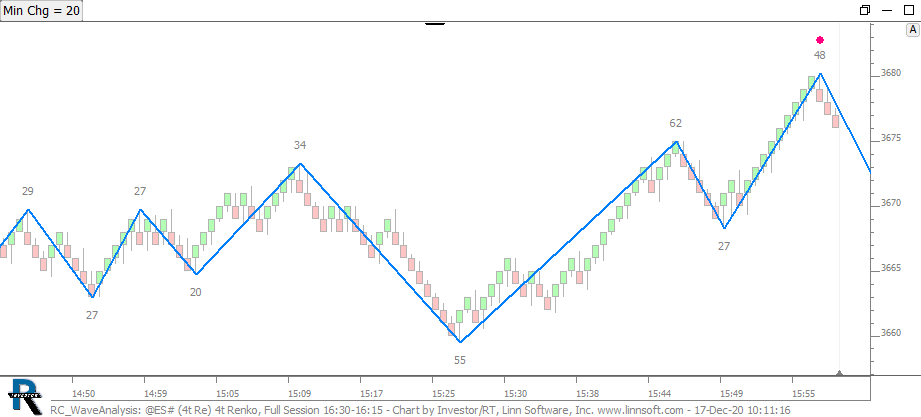 |
RC WaveAnalysis (@ES#) cpayne [totalcount]
5 years 2 days ago
Wave Study. This chart was uploaded by Investor/RT 14.2.5 showing symbol: @ES#. |
View |
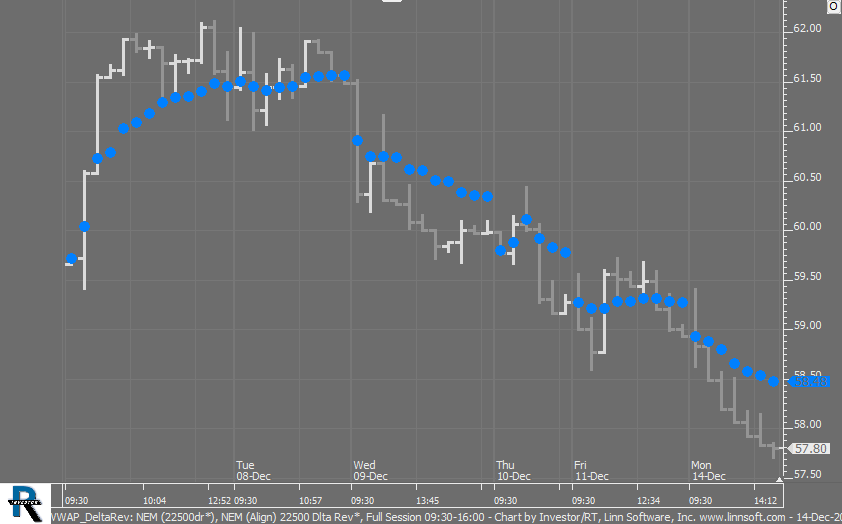 |
VWAP DeltaRev (NEM) cpayne [totalcount]
5 years 5 days ago
This chart was uploaded by Investor/RT 14.2.5 showing symbol: NEM. |
View |
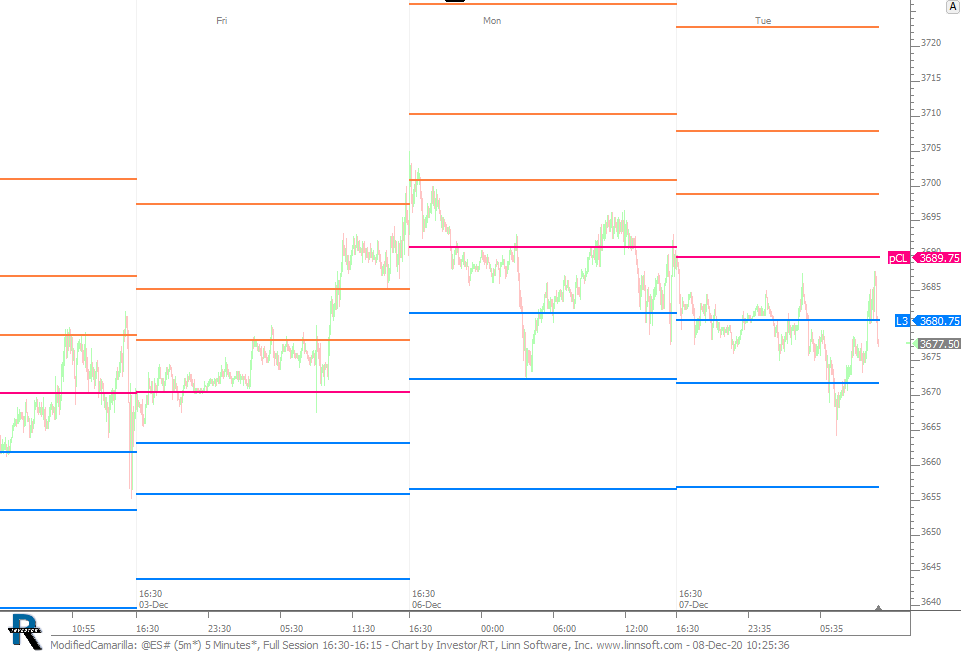 |
ModifiedCamarilla (@ES#) cpayne [totalcount]
5 years 1 week ago
Modified Camarilla. This chart was uploaded by Investor/RT 14.2.5 showing symbol: @ES#. |
View |
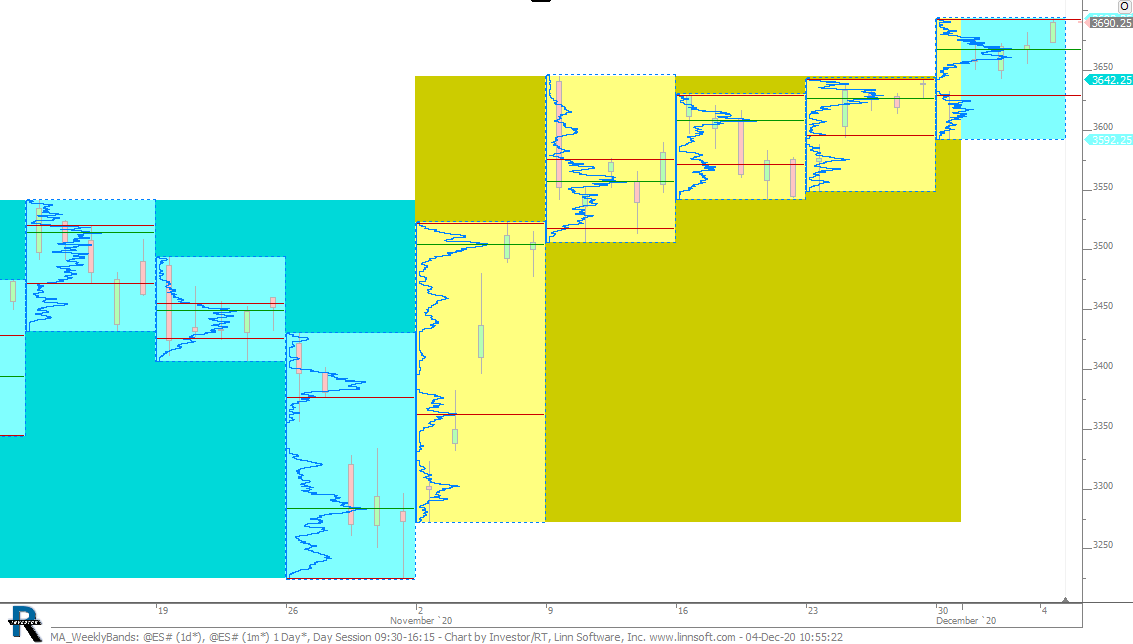 |
MA WeeklyBands (@ES#) cpayne [totalcount]
5 years 2 weeks ago
Weekly Profiles with Alternating Months Highlighted. This chart was uploaded by Investor/RT 14.2.5 showing symbol: @ES#. |
View |
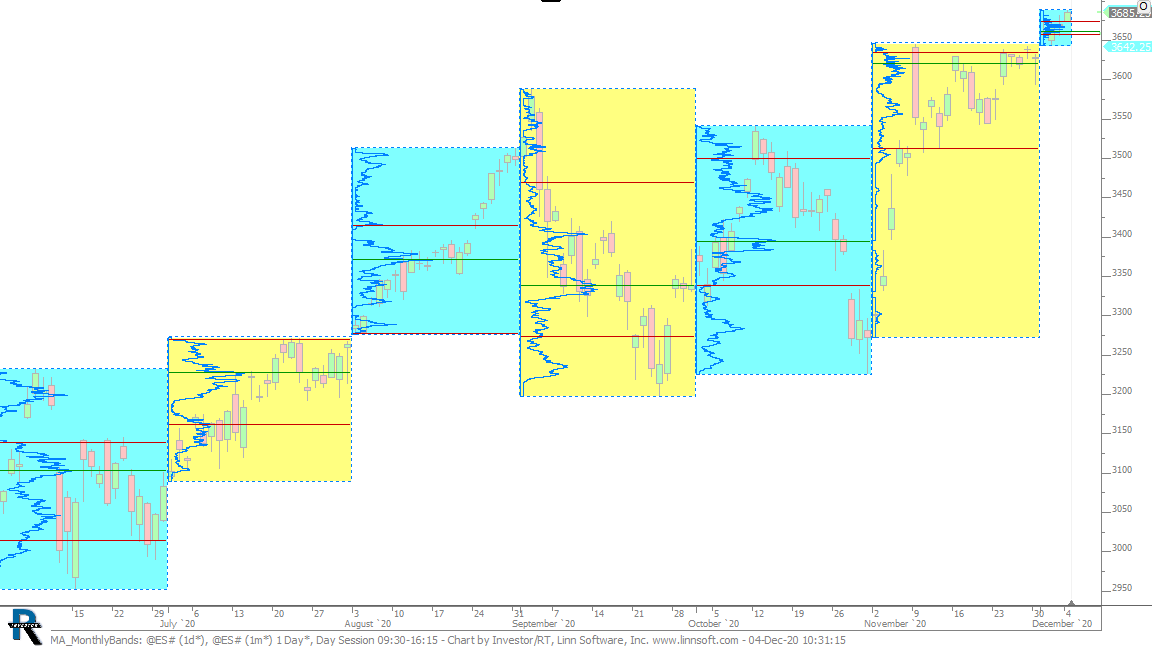 |
MA MonthlyBands (@ES#) cpayne [totalcount]
5 years 2 weeks ago
Alternating Months Highlighted and Profiled. This chart was uploaded by Investor/RT 14.2.5 showing symbol: @ES#. |
View |
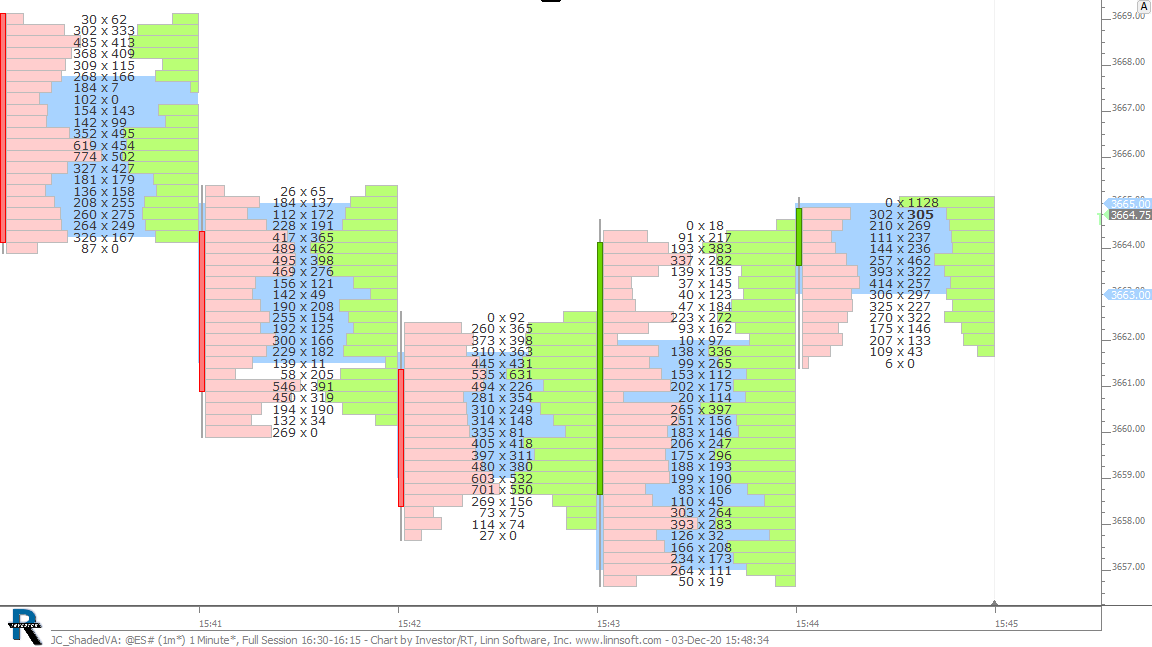 |
JC ShadedVA (@ES#) cpayne [totalcount]
5 years 2 weeks ago
This chart was uploaded by Investor/RT 14.2.5 showing symbol: @ES#. |
View |
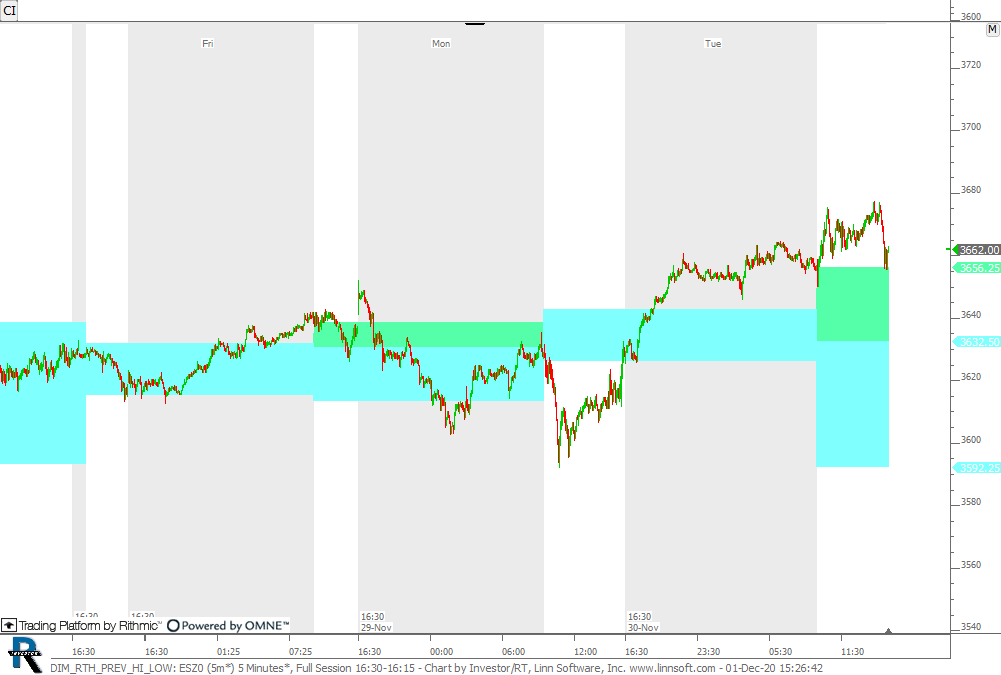 |
DIM RTH PREV HI LOW (ESZ0) cpayne [totalcount]
5 years 2 weeks ago
This chart was uploaded by Investor/RT 14.2.5 showing symbol: ESZ0. |
View |
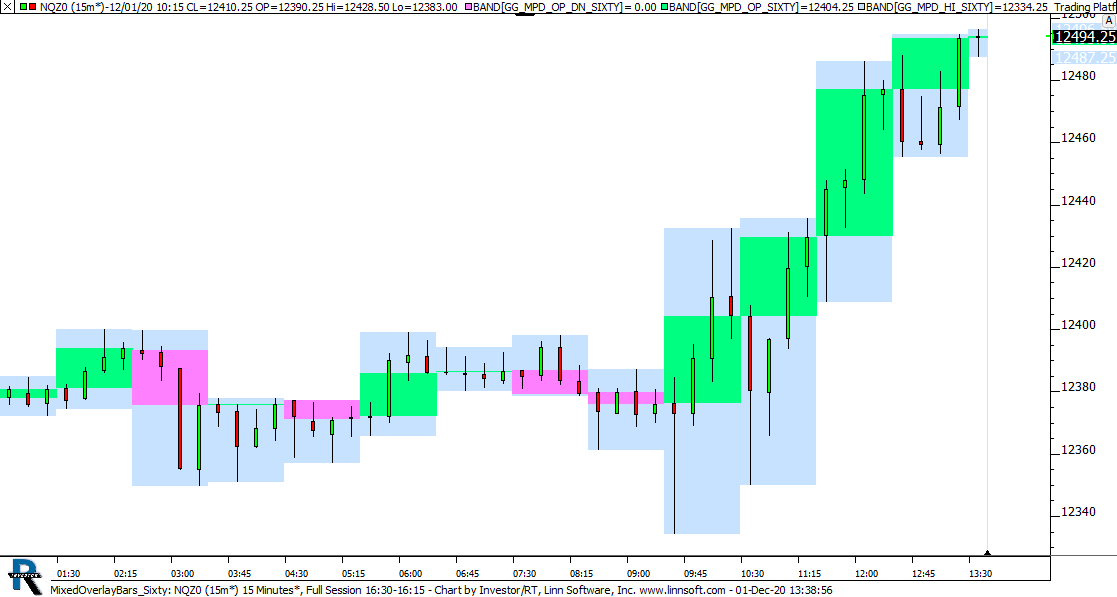 |
MixedOverlayBars Sixty (NQZ0) cpayne [totalcount]
5 years 2 weeks ago
This chart was uploaded by Investor/RT 14.2.5 showing symbol: NQZ0. |
View |
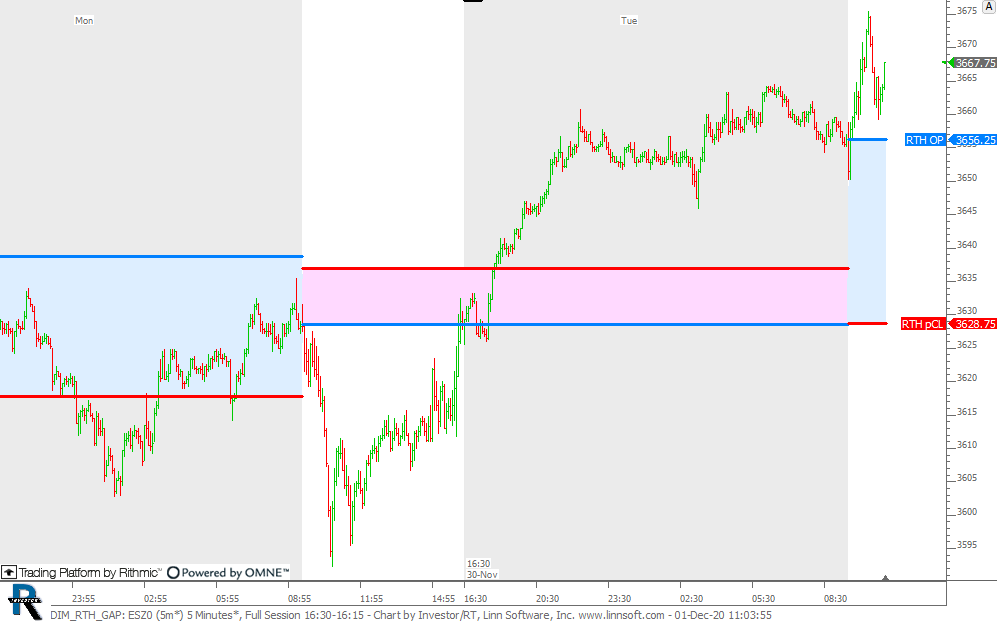 |
DIM RTH GAP (ESZ0) cpayne [totalcount]
5 years 2 weeks ago
RTH Gap on Full Session Chart. Blue on Gap Up and Pink on Gap Down. This chart was uploaded by Investor/RT 14.2.5 showing symbol: ESZ0. |
View |
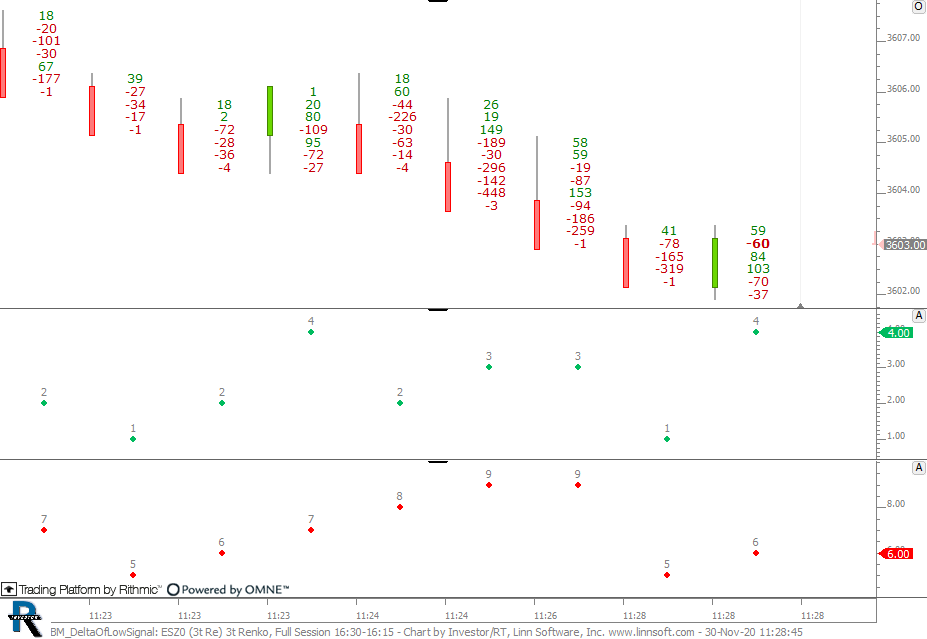 |
BM DeltaOfLowSignal (ESZ0) cpayne [totalcount]
5 years 2 weeks ago
This chart was uploaded by Investor/RT 14.2.5 showing symbol: ESZ0. |
View |
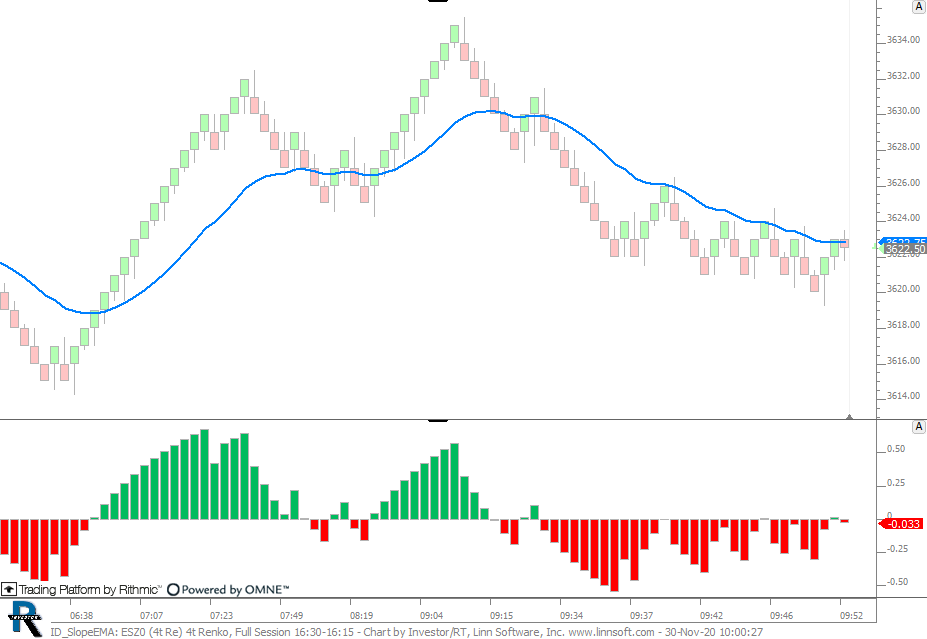 |
ID SlopeEMA (ESZ0) cpayne [totalcount]
5 years 2 weeks ago
This chart was uploaded by Investor/RT 14.2.5 showing symbol: ESZ0. |
View |
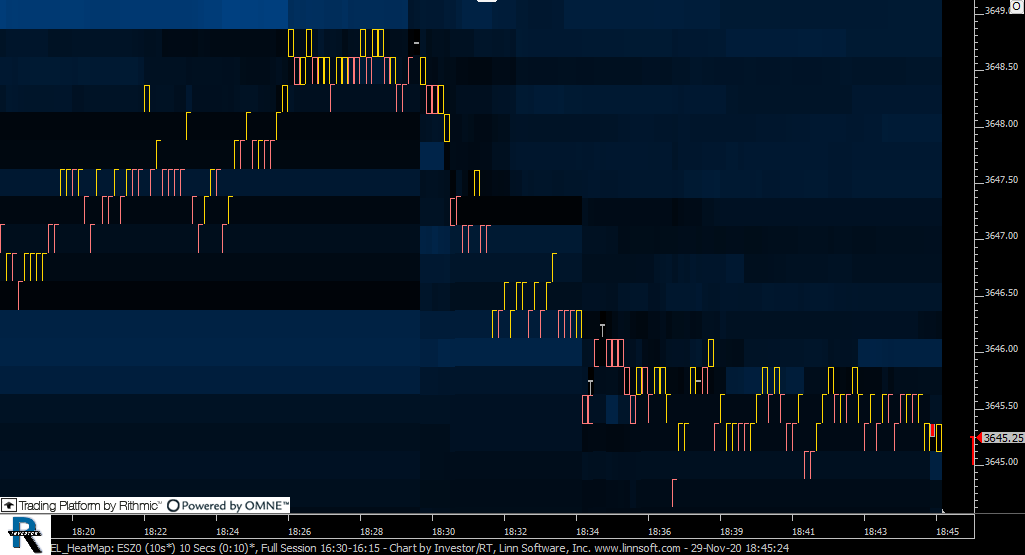 |
EL HeatMap (ESZ0) cpayne [totalcount]
5 years 2 weeks ago
This chart was uploaded by Investor/RT 14.2.5 showing symbol: ESZ0. |
View |