 |
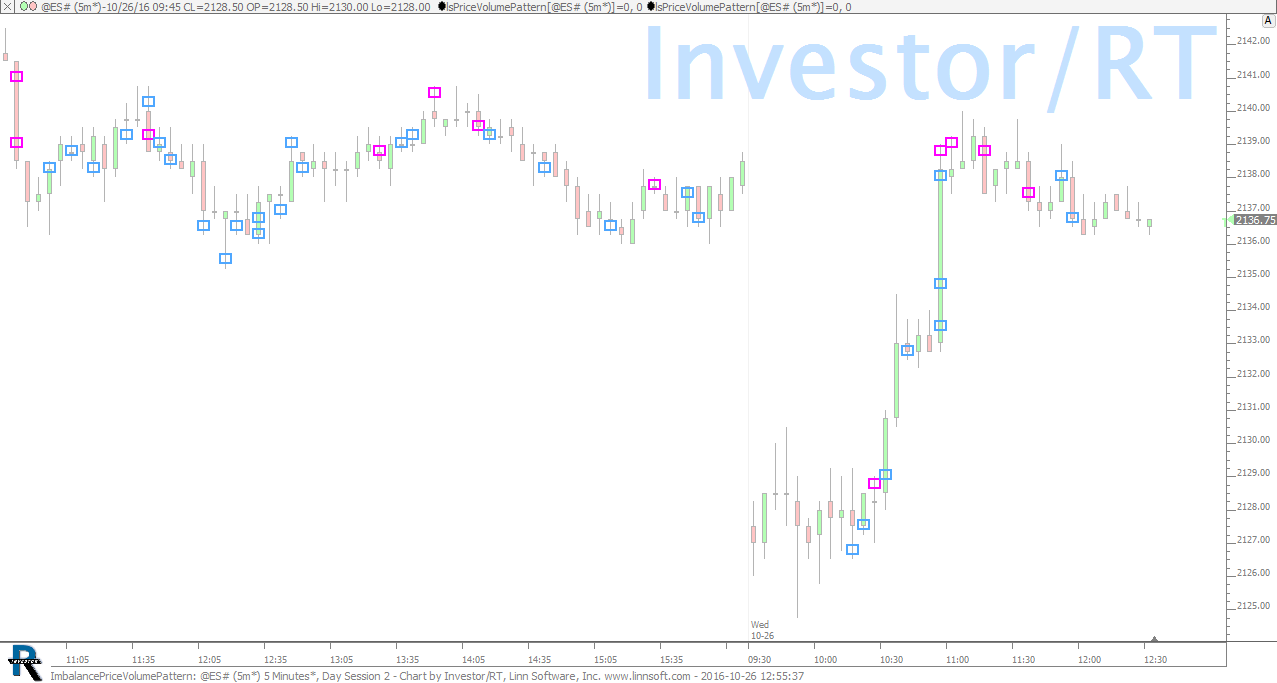
ImbalancePriceVolumePattern (@ES#) cpayne [totalcount]
9 years 9 months ago
Identifying Buying and Selling Volume Imbalance Using the Price Volume Pattern (PVP) RTX Indicator. |
View |
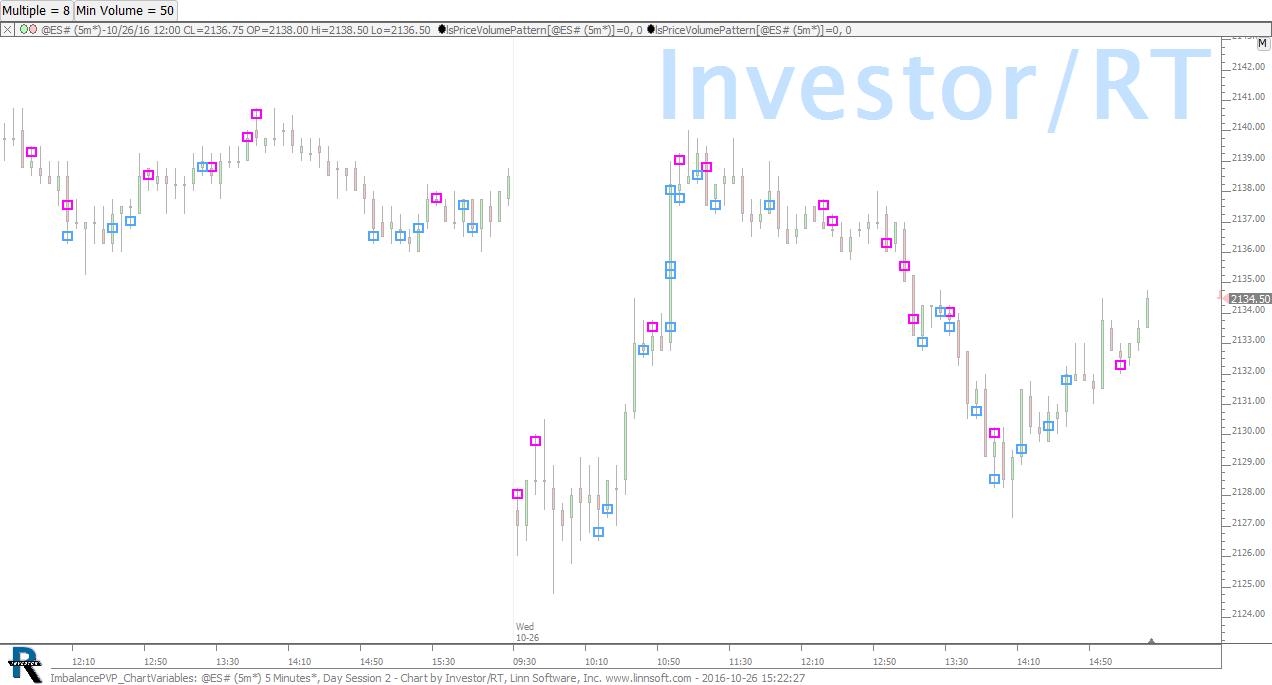 |
ImbalancePVP ChartVariables (@ES#) cpayne [totalcount]
9 years 9 months ago
Identifying Buying and Selling Volume Imbalance Using the Price Volume Pattern (PVP) RTX Indicator - And Using Chart Variables. |
View |
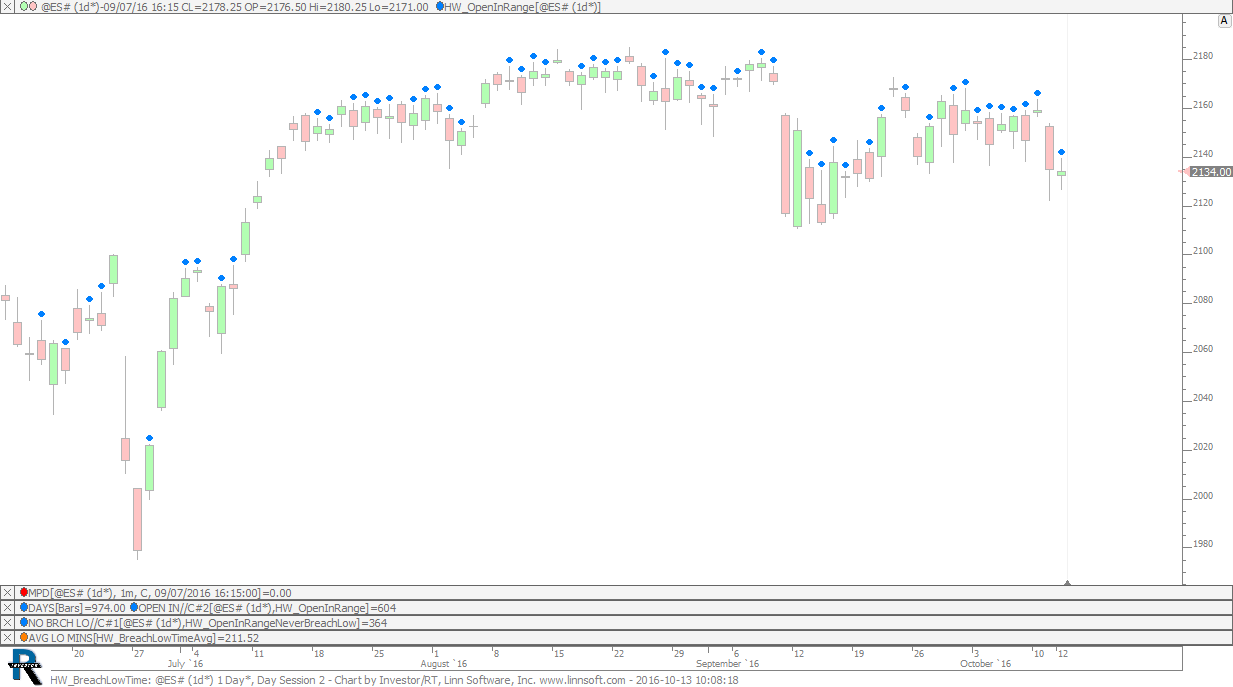 |
HW BreachLowTime (@ES#) cpayne [totalcount]
9 years 9 months ago
Homework 27: Breached Day Session Low Time. |
View |
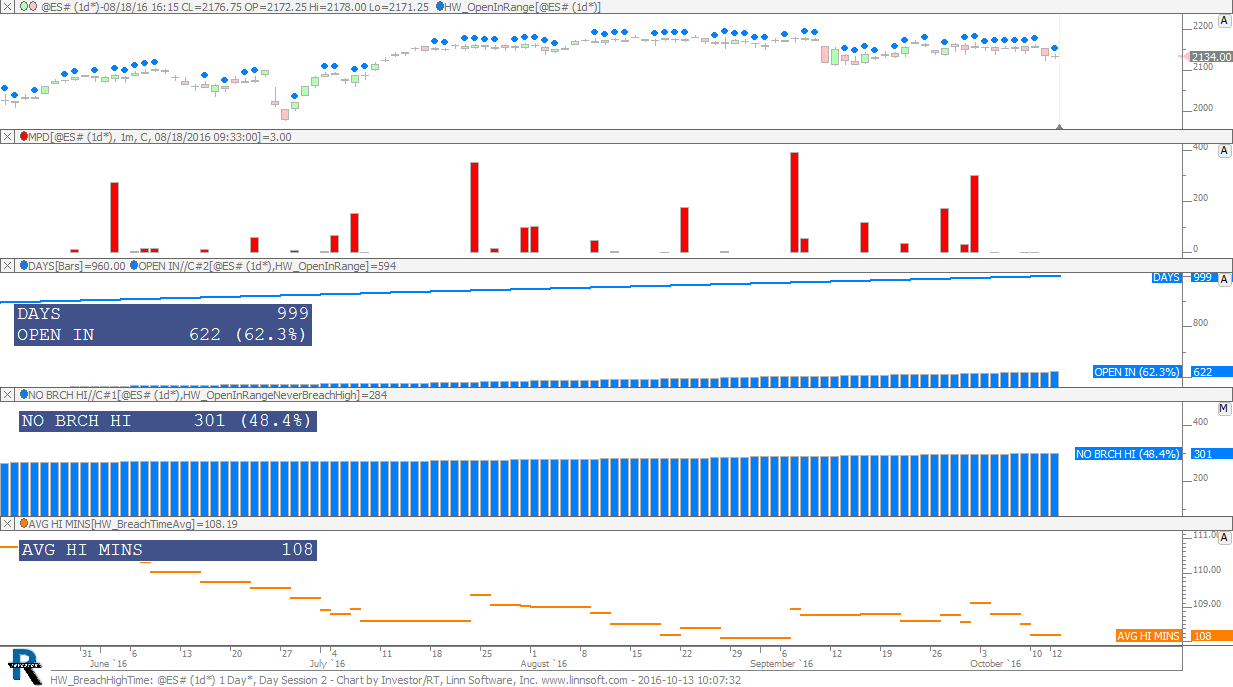 |
HW BreachHighTime (@ES#) cpayne [totalcount]
9 years 9 months ago
Homework 27: Breached Day Session High Time. |
View |
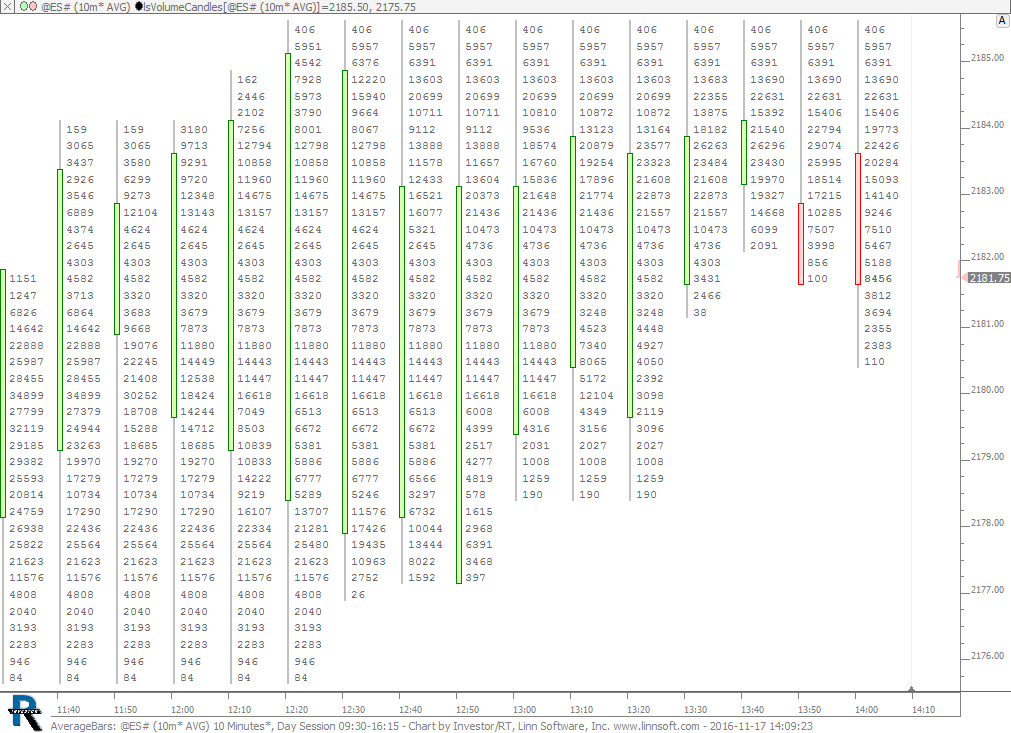 |
AverageBars (@ES#) cpayne [totalcount]
9 years 8 months ago
Average Bars. This chart was uploaded by Investor/RT 12.6.1 showing symbol: @ES#. This chart is explained in the webinar Average Bars. |
View |
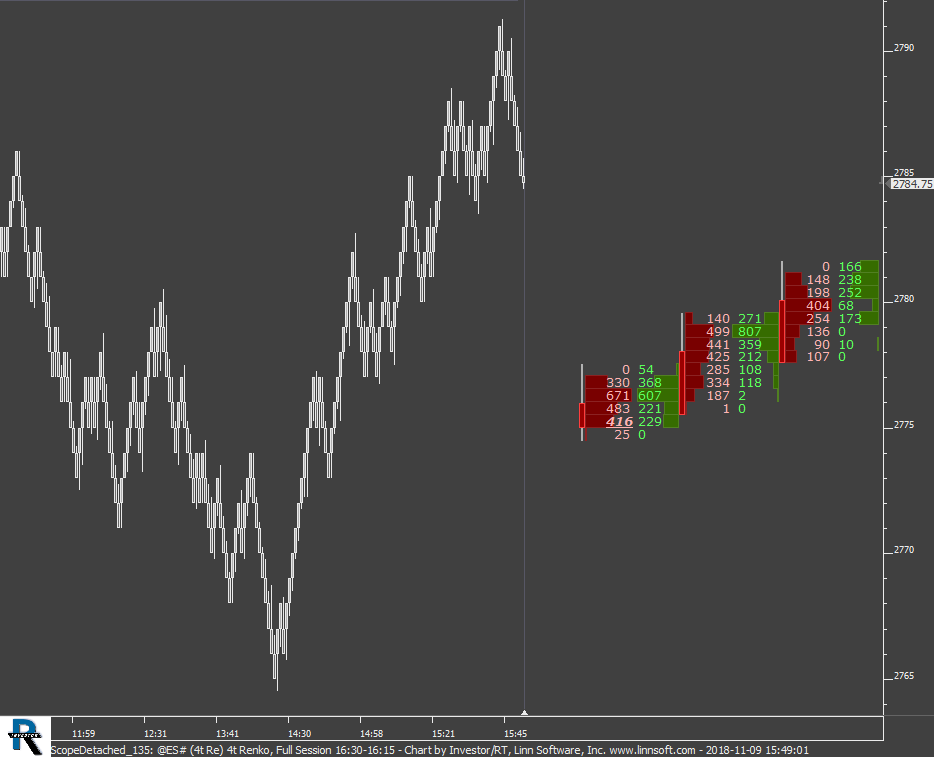 |
ScopeDetached 135 (@ES#) cpayne [totalcount]
7 years 8 months ago
Scope Detached - Investor/RT 13.5 Webinar. This chart was uploaded by Investor/RT 13.5.9 showing symbol: @ES#. |
View |
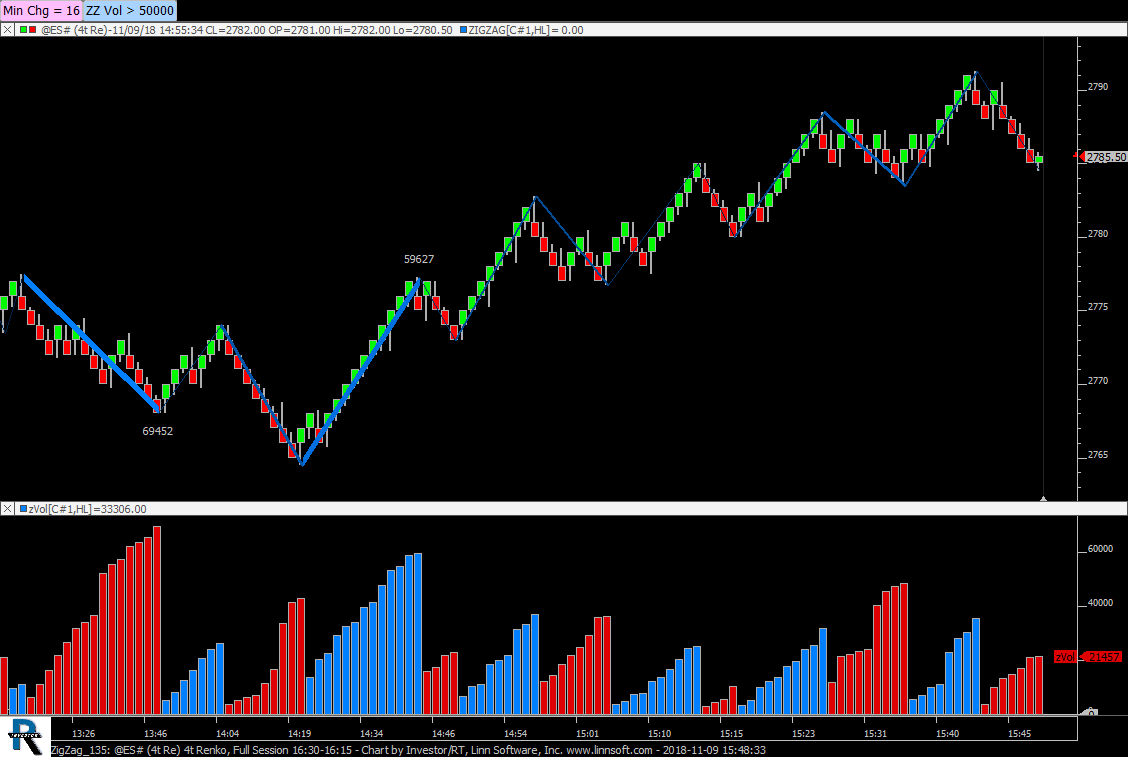 |
ZigZag 135 (@ES#) cpayne [totalcount]
7 years 8 months ago
ZigZag - Investor/RT 13.5 Webinar. This chart was uploaded by Investor/RT 13.5.9 showing symbol: @ES#. |
View |
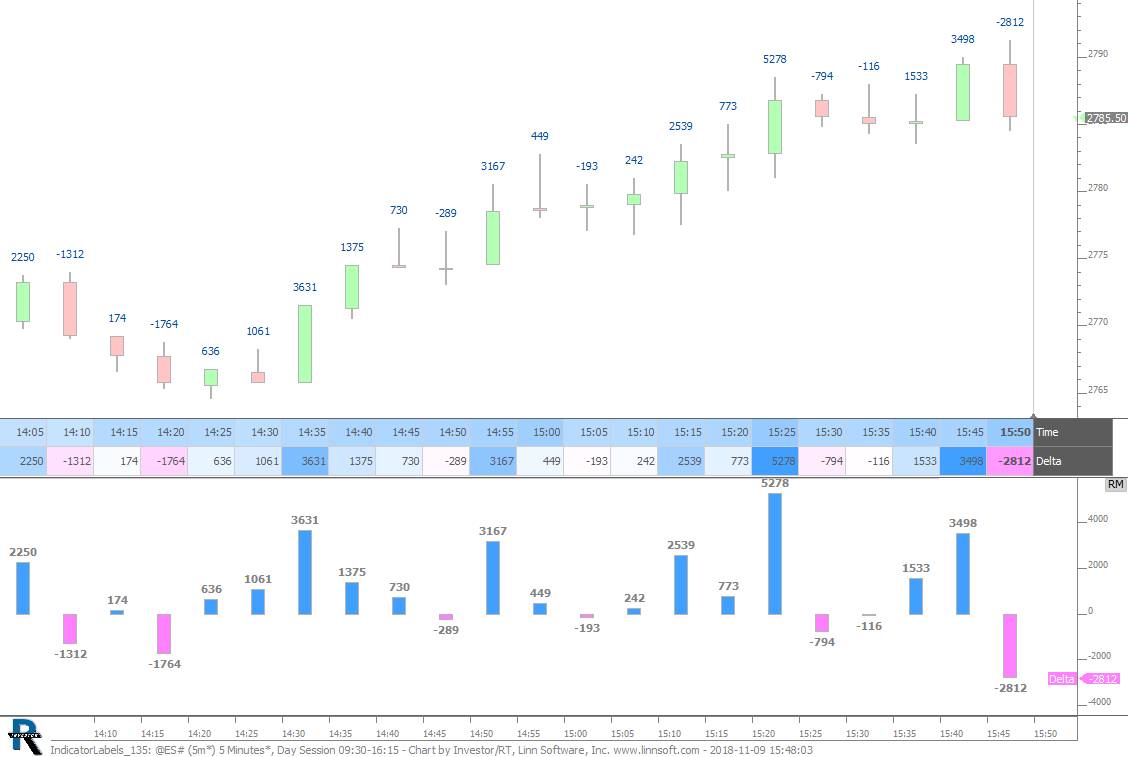 |
IndicatorLabels 135 (@ES#) cpayne [totalcount]
7 years 8 months ago
IndicatorLabels - Investor/RT 13.5 Webinar. This chart was uploaded by Investor/RT 13.5.9 showing symbol: @ES#. |
View |
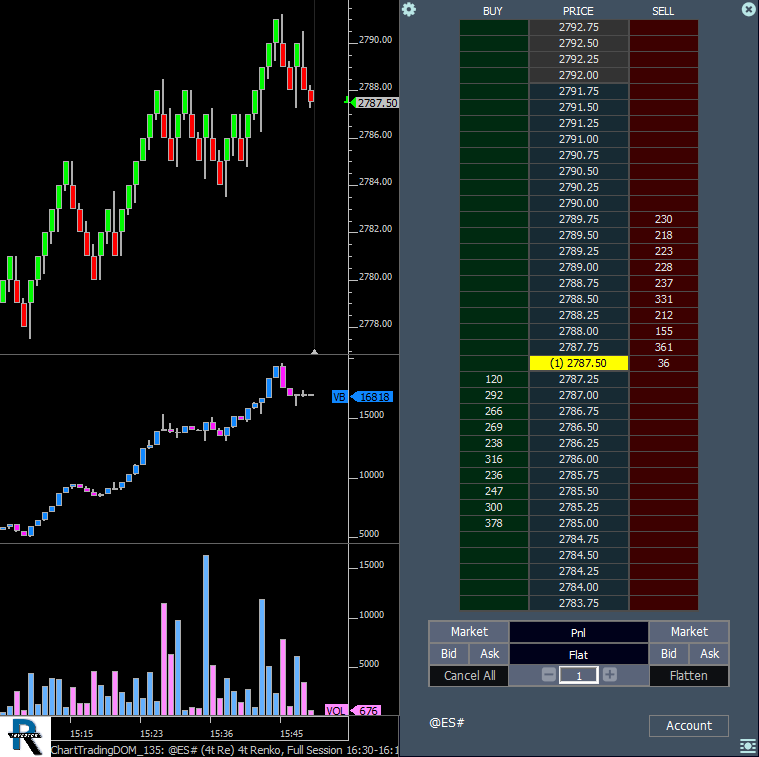 |
ChartTradingDOM 135 (@ES#) cpayne [totalcount]
7 years 8 months ago
ChartTradingDOM - Invesor/RT 13.5 Webinar. This chart was uploaded by Investor/RT 13.5.9 showing symbol: @ES#. |
View |
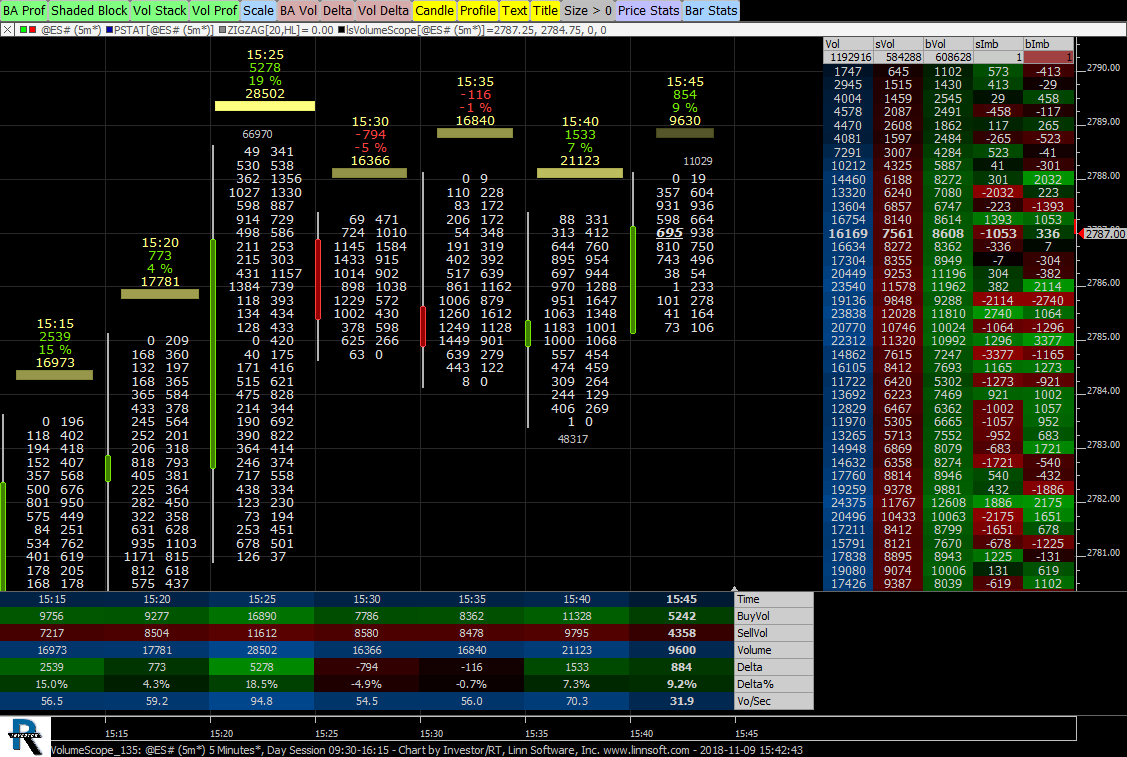 |
VolumeScope 135 (@ES#) cpayne [totalcount]
7 years 8 months ago
VolumeScope - Investor/RT 13.5 Webinar. This chart was uploaded by Investor/RT 13.5.9 showing symbol: @ES#. |
View |
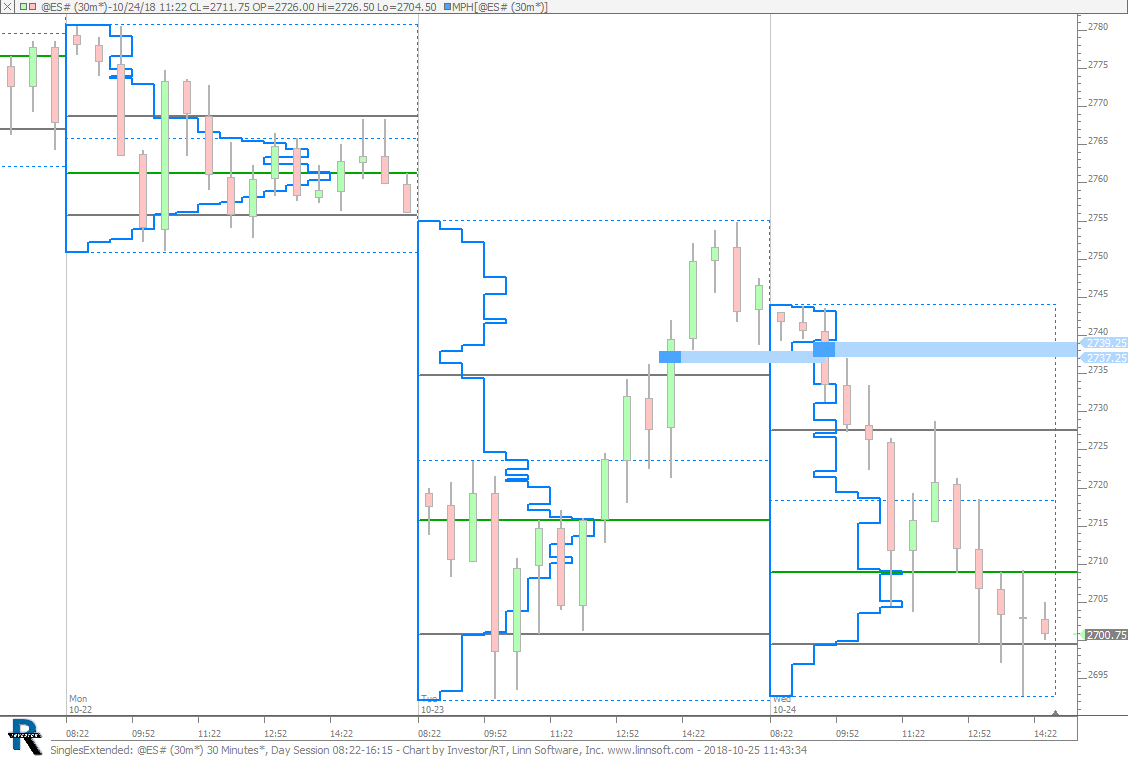 |
SinglesExtended (@ES#) cpayne [totalcount]
7 years 9 months ago
Singles Extended with MPH. This chart was uploaded by Investor/RT 13.5.8 showing symbol: @ES#. |
View |
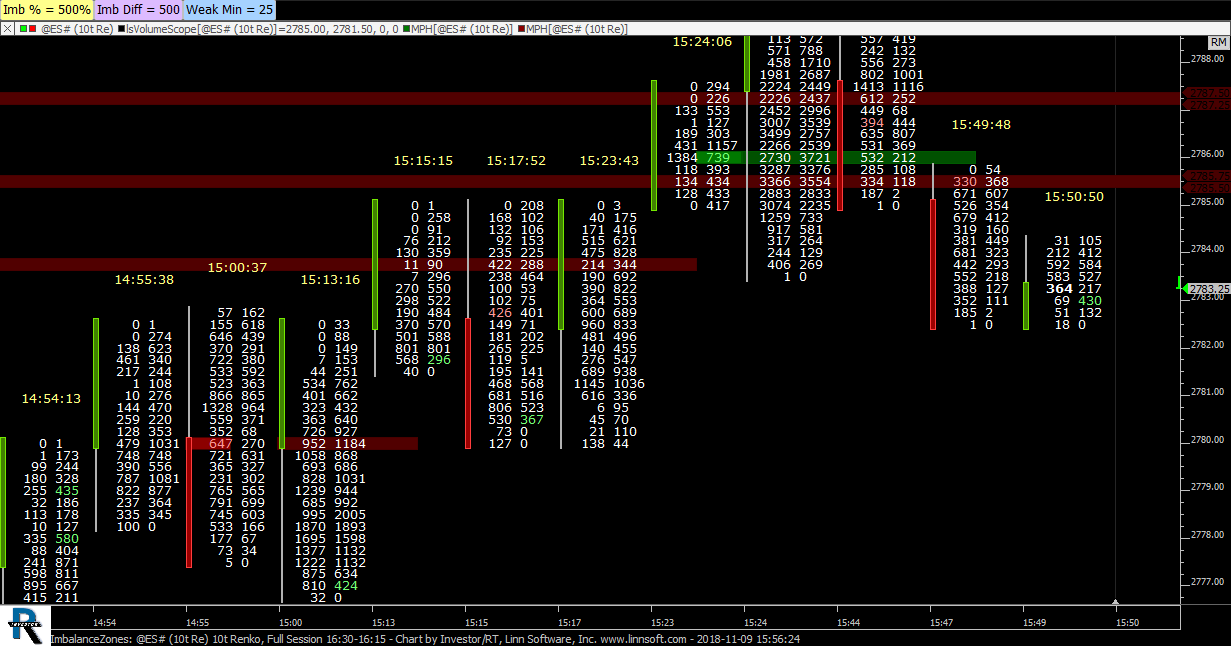 |
ImbalanceZones (@ES#) cpayne [totalcount]
7 years 8 months ago
Imbalance Zones. This chart was uploaded by Investor/RT 13.3.5 showing symbol: @ES#. |
View |
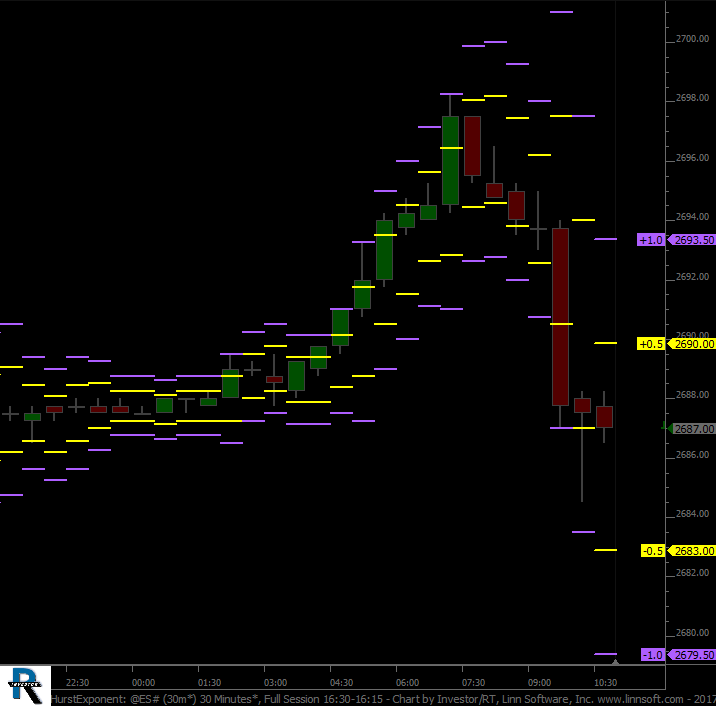 |
HurstExponent (@ES#) cpayne [totalcount]
8 years 7 months ago
Hurst Exponent. This chart was uploaded by Investor/RT 13.1.4 showing symbol: @ES#. |
View |
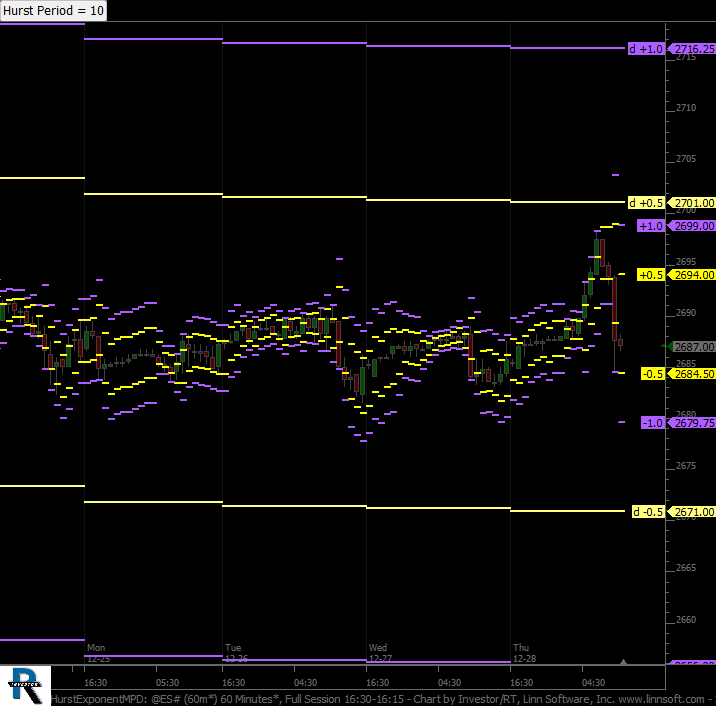 |
HurstExponentMPD (@ES#) cpayne [totalcount]
8 years 7 months ago
Hurst Exponent with Daily Levels via MPD. This chart was uploaded by Investor/RT 13.1.4 showing symbol: @ES#. |
View |
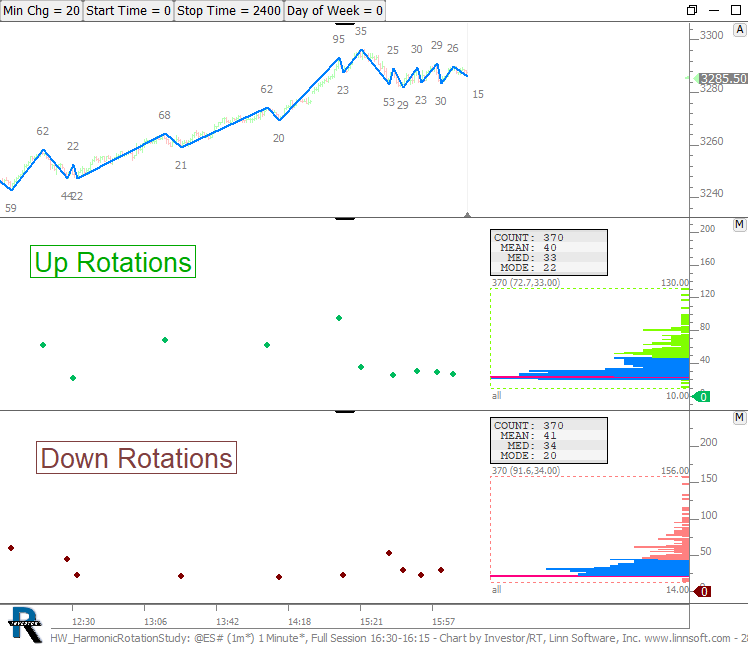 |
HW HarmonicRotationStudy (@ES#) cpayne [totalcount]
5 years 10 months ago
Harmonic Rotation Study. This chart was uploaded by Investor/RT 14.1.9 showing symbol: @ES#. |
View |
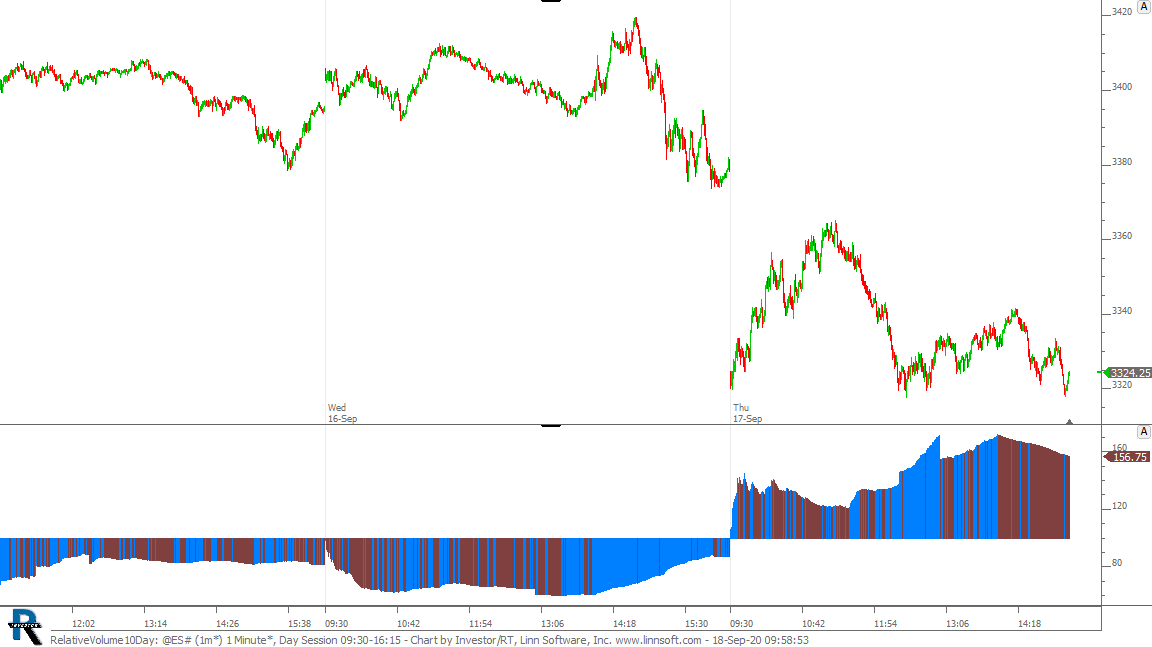 |
RelativeVolume10Day (@ES#) cpayne [totalcount]
5 years 10 months ago
This chart was uploaded by Investor/RT 14.1.6 showing symbol: @ES#. |
View |
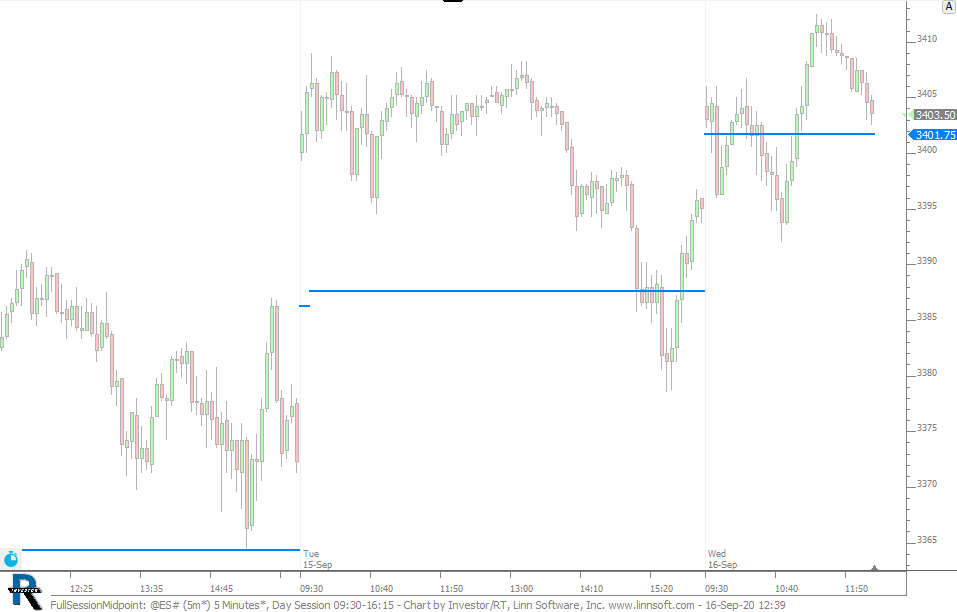 |
FullSessionMidpoint (@ES#) cpayne [totalcount]
5 years 10 months ago
Blue line plots the full session mindpoint on a day session chart. Drag and drop to any other chart. This chart was uploaded by Investor/RT 14.1.6 showing symbol: @ES#. |
View |
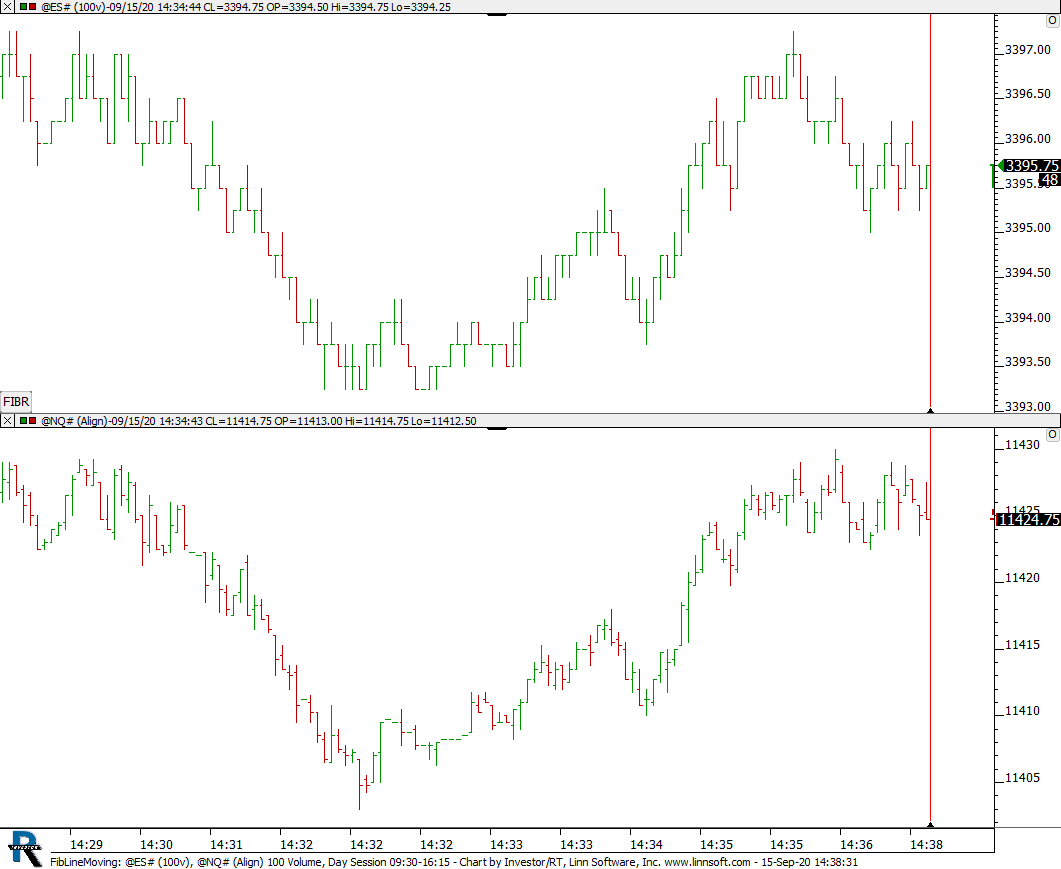 |
FibLineMoving (@ES#) cpayne [totalcount]
5 years 10 months ago
This chart was uploaded by Investor/RT 14.1.6 showing symbol: @ES#. |
View |
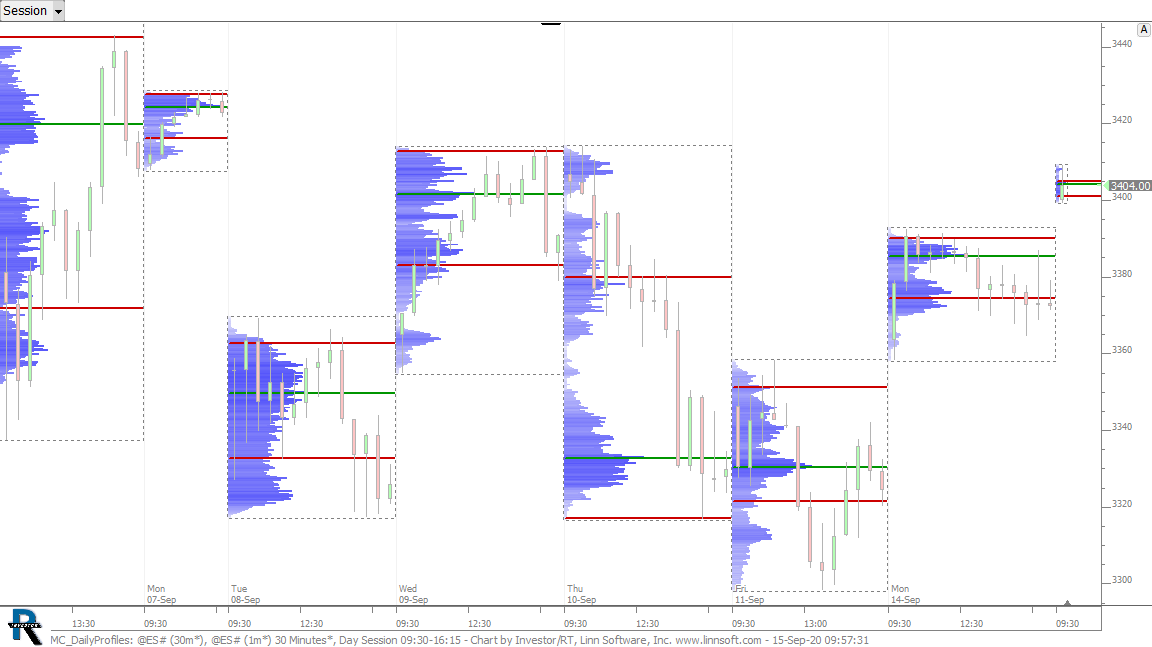 |
MC DailyProfiles (@ES#) cpayne [totalcount]
5 years 10 months ago
Daily Profiles on 30 Minute Chart. This chart was uploaded by Investor/RT 14.1.6 showing symbol: @ES#. |
View |
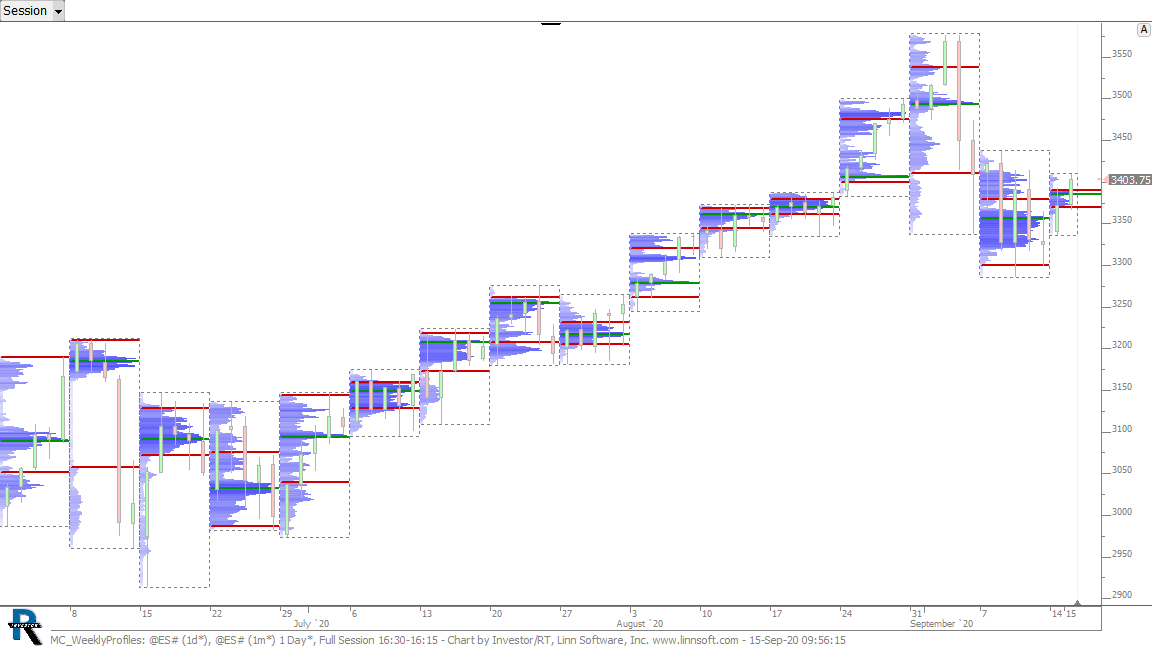 |
MC WeeklyProfiles (@ES#) cpayne [totalcount]
5 years 10 months ago
Weekly Profiles on Daily Chart. This chart was uploaded by Investor/RT 14.1.6 showing symbol: @ES#. |
View |
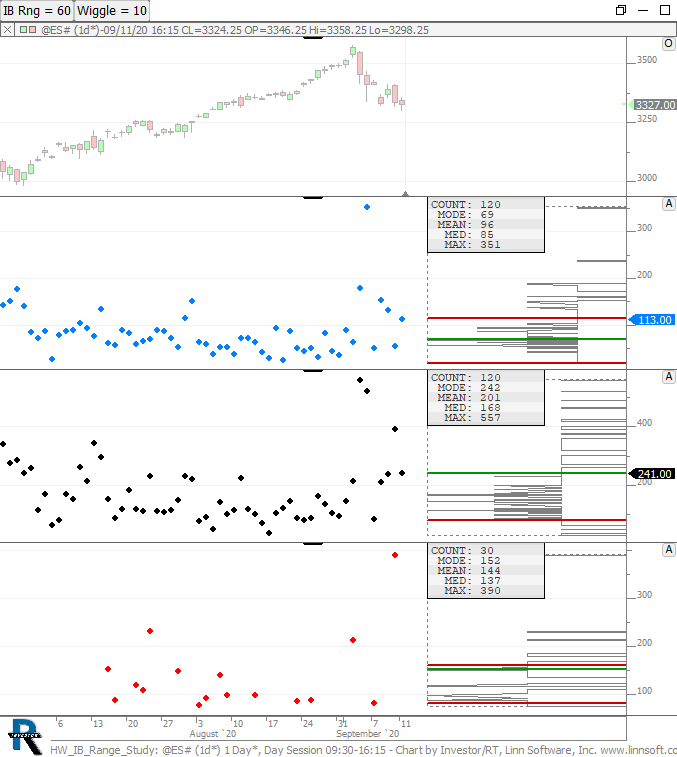 |
HW IB Range Study (@ES#) cpayne [totalcount]
5 years 10 months ago
This chart was uploaded by Investor/RT 14.1.5 showing symbol: @ES#. |
View |
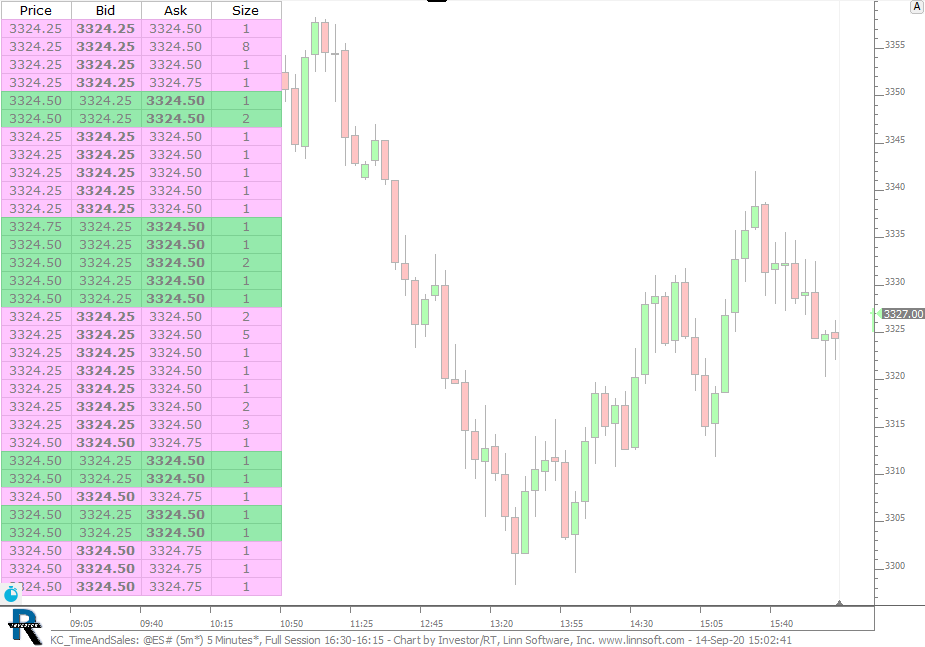 |
KC TimeAndSales (@ES#) cpayne [totalcount]
5 years 10 months ago
This chart was uploaded by Investor/RT 14.1.6 showing symbol: @ES#. |
View |
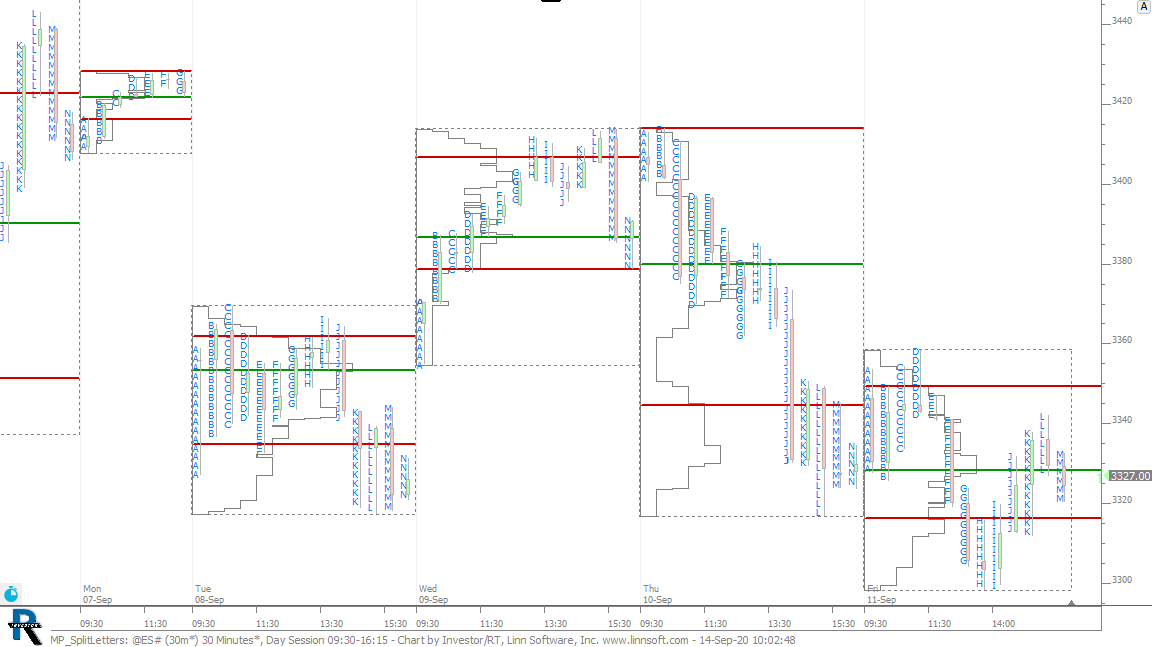 |
MP SplitLetters (@ES#) cpayne [totalcount]
5 years 10 months ago
This chart was uploaded by Investor/RT 14.1.6 showing symbol: @ES#. |
View |
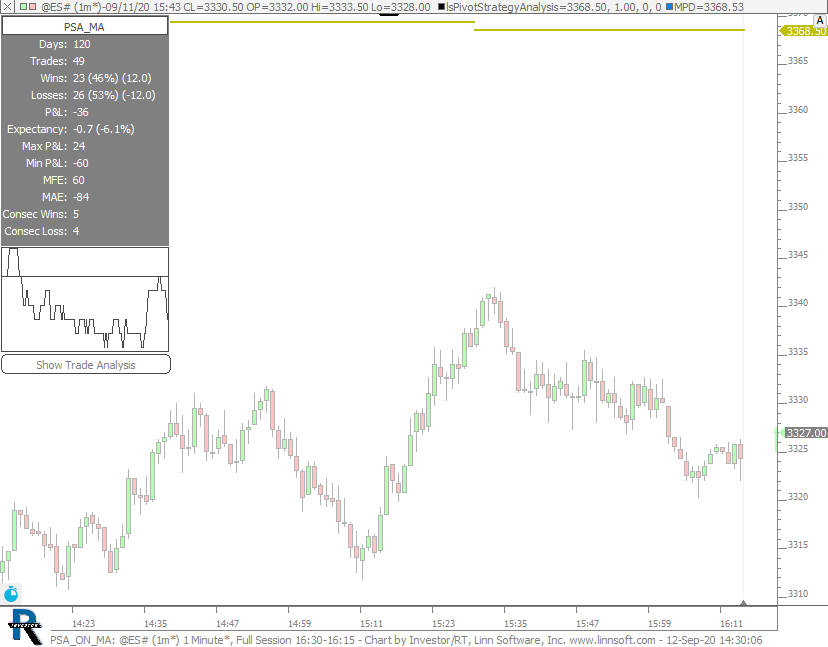 |
PSA ON MA (@ES#) cpayne [totalcount]
5 years 10 months ago
PSA on touch of 60-min 100-period MA. This chart was uploaded by Investor/RT 14.1.6 showing symbol: @ES#. |
View |
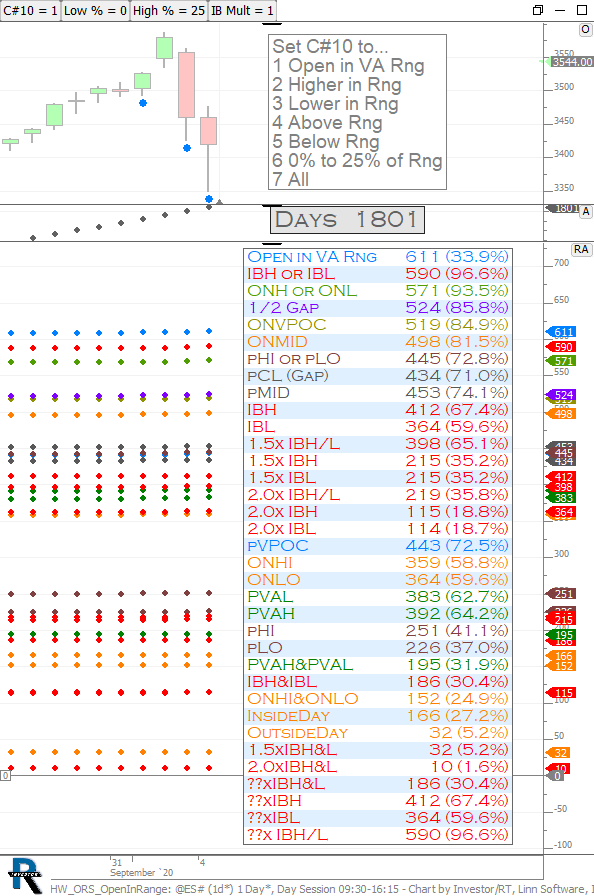 |
HW ORS OpenInRange (@ES#) cpayne [totalcount]
5 years 10 months ago
Homework - Open In Range Statistics. This chart was uploaded by Investor/RT 14.1.5 showing symbol: @ES#. |
View |