 |
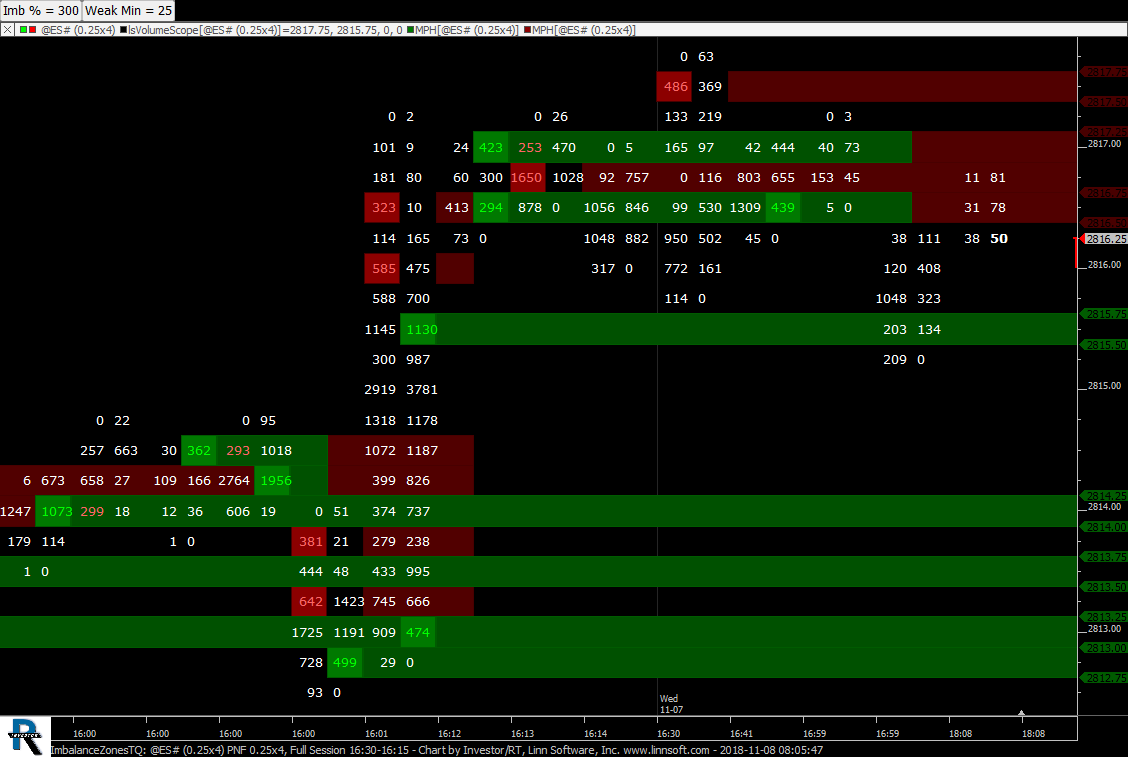
ImbalanceZonesTQ (@ES#) cpayne [totalcount]
7 years 1 month ago
This chart was uploaded by Investor/RT 13.5.9 showing symbol: @ES#. |
View |
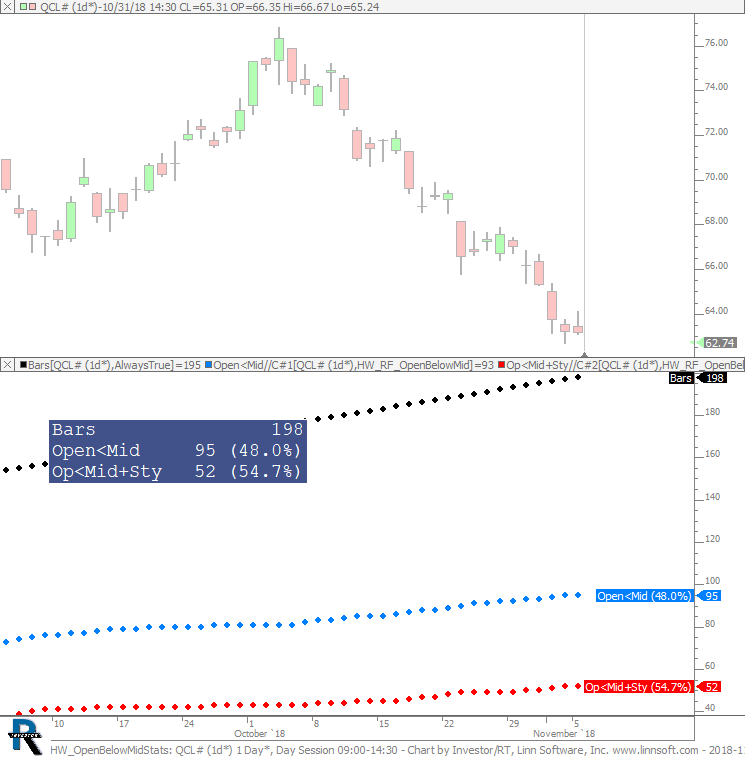 |
HW OpenBelowMidStats (QCL#) cpayne [totalcount]
7 years 1 month ago
Open Below Mid Stats. This chart was uploaded by Investor/RT 13.5.9 showing symbol: QCL#. |
View |
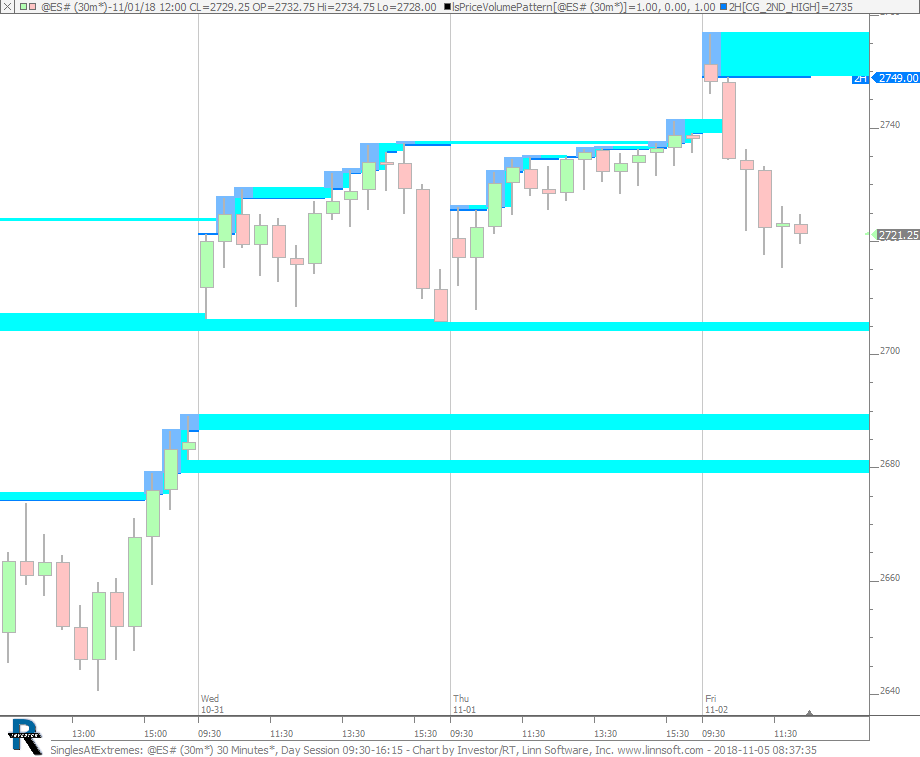 |
SinglesAtExtremes (@ES#) cpayne [totalcount]
7 years 1 month ago
Singles At Extremes. This chart was uploaded by Investor/RT 13.5.9 showing symbol: @ES#. |
View |
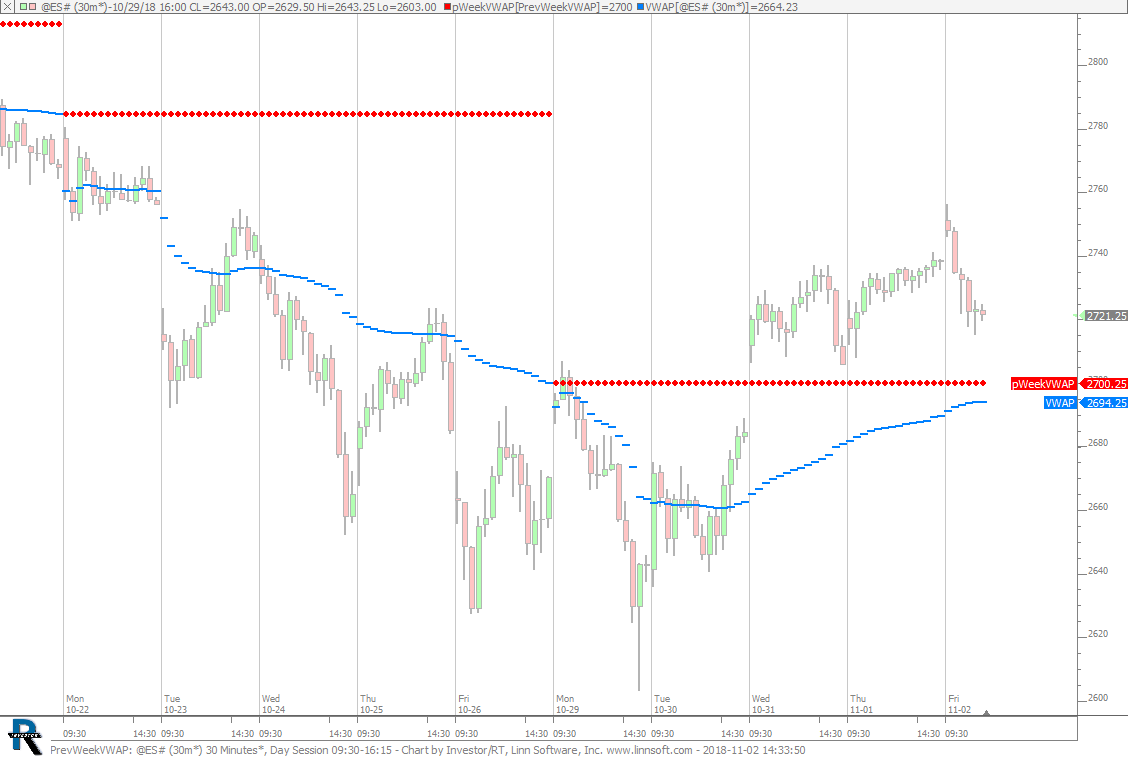 |
PrevWeekVWAP (@ES#) cpayne [totalcount]
7 years 1 month ago
Previous Week VWAP. This chart was uploaded by Investor/RT 13.5.9 showing symbol: @ES#. |
View |
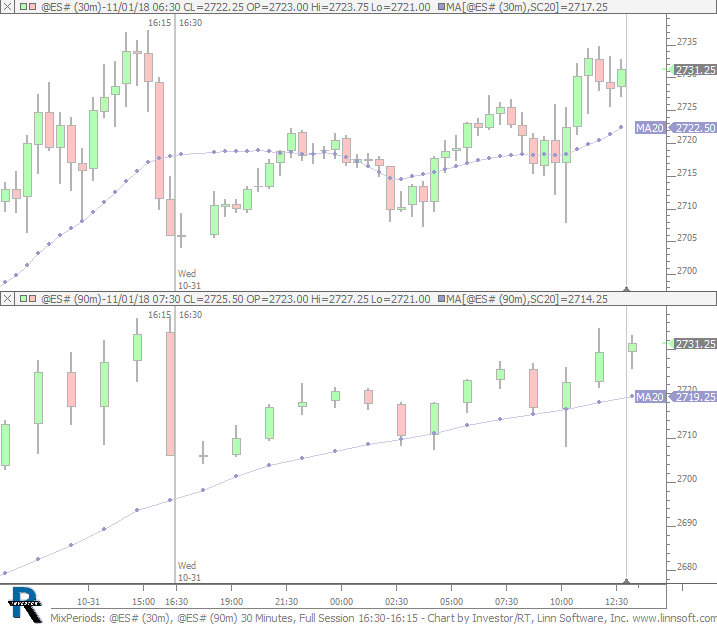 |
MixPeriods (@ES#) cpayne [totalcount]
7 years 1 month ago
This chart was uploaded by Investor/RT 13.5.9 showing symbol: @ES#. |
View |
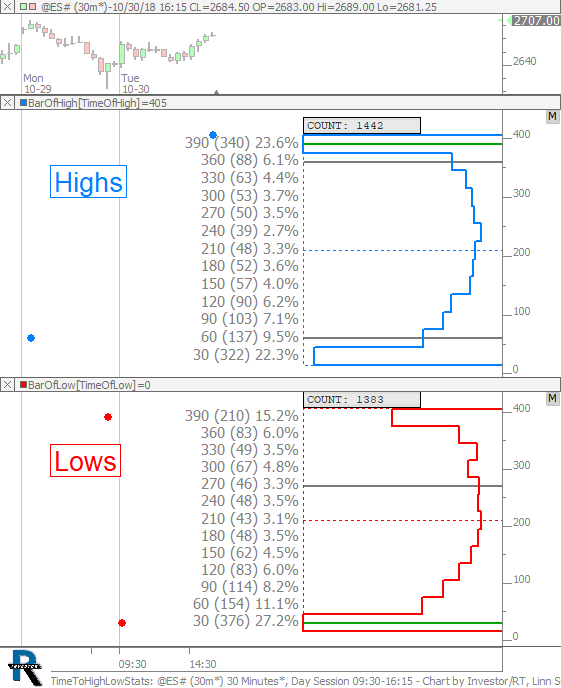 |
TimeToHighLowStats (@ES#) cpayne [totalcount]
7 years 1 month ago
Number of Times the High or Low was made during each Period. This chart was uploaded by Investor/RT 13.5.9 showing symbol: @ES#. |
View |
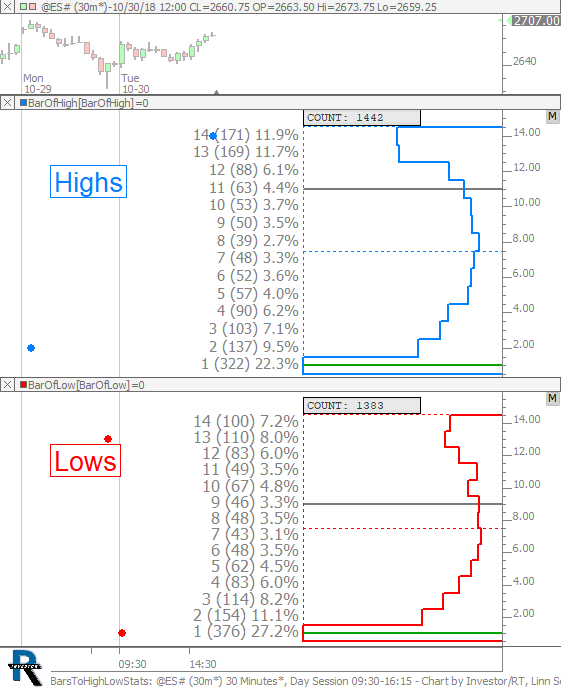 |
BarsToHighLowStats (@ES#) cpayne [totalcount]
7 years 1 month ago
Number of Times the High or Low was made during each bar/period. This chart was uploaded by Investor/RT 13.5.9 showing symbol: @ES#. |
View |
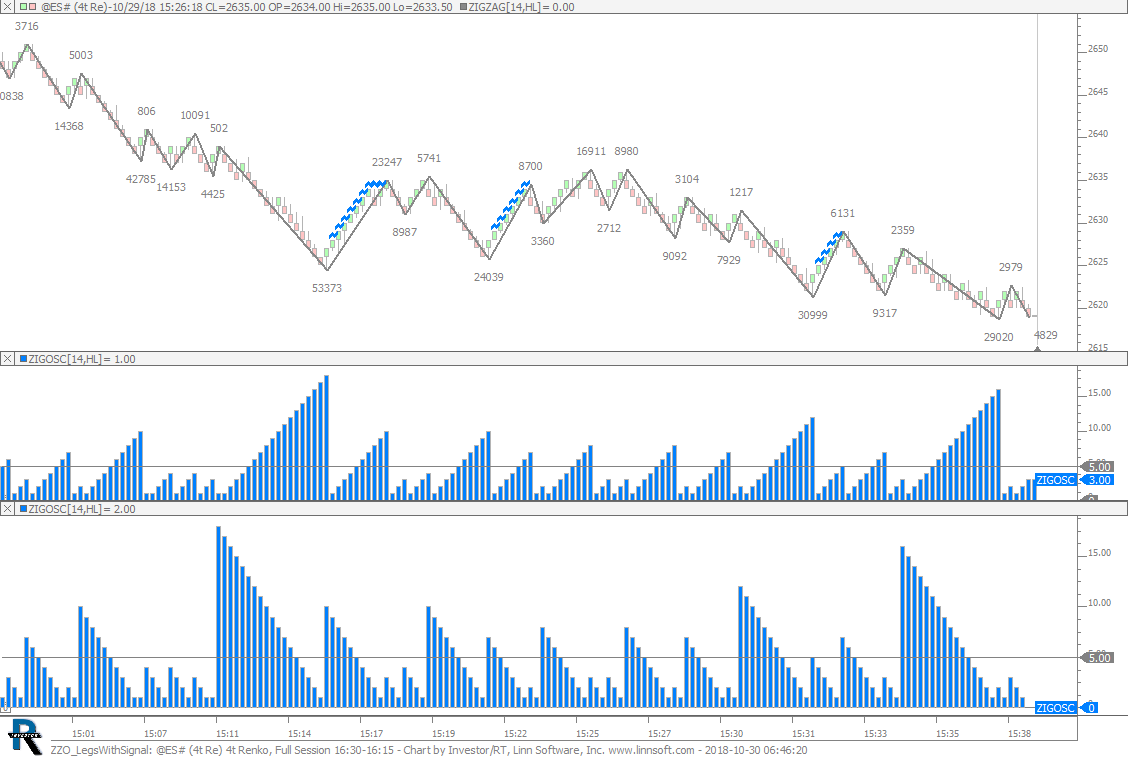 |
ZZO LegsWithSignal (@ES#) cpayne [totalcount]
7 years 1 month ago
Identifying Zig Zag Legs that contain signal. This chart was uploaded by Investor/RT 13.5.9 showing symbol: @ES#. |
View |
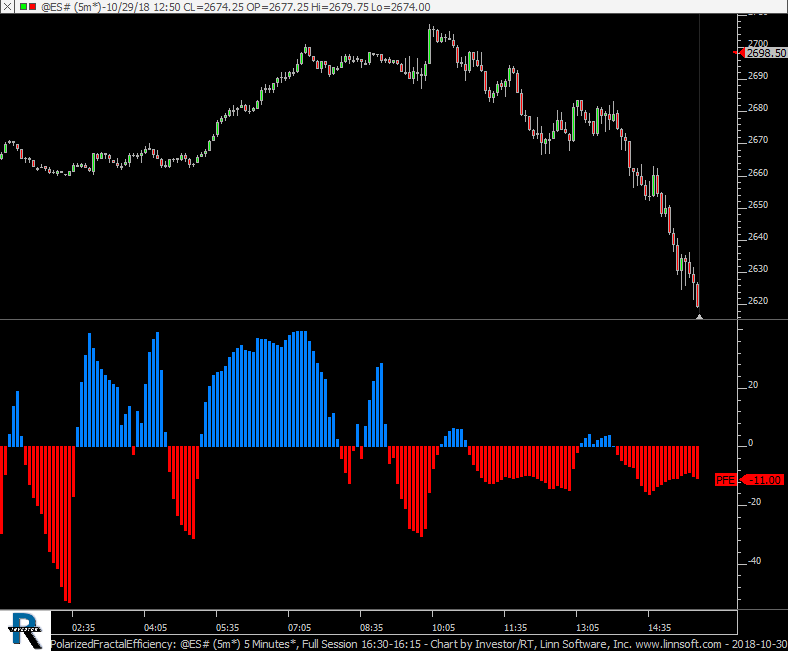 |
PolarizedFractalEfficiency (@ES#) cpayne [totalcount]
7 years 1 month ago
Polarized Fractal Effiiciency. This chart was uploaded by Investor/RT 13.5.9 showing symbol: @ES#. |
View |
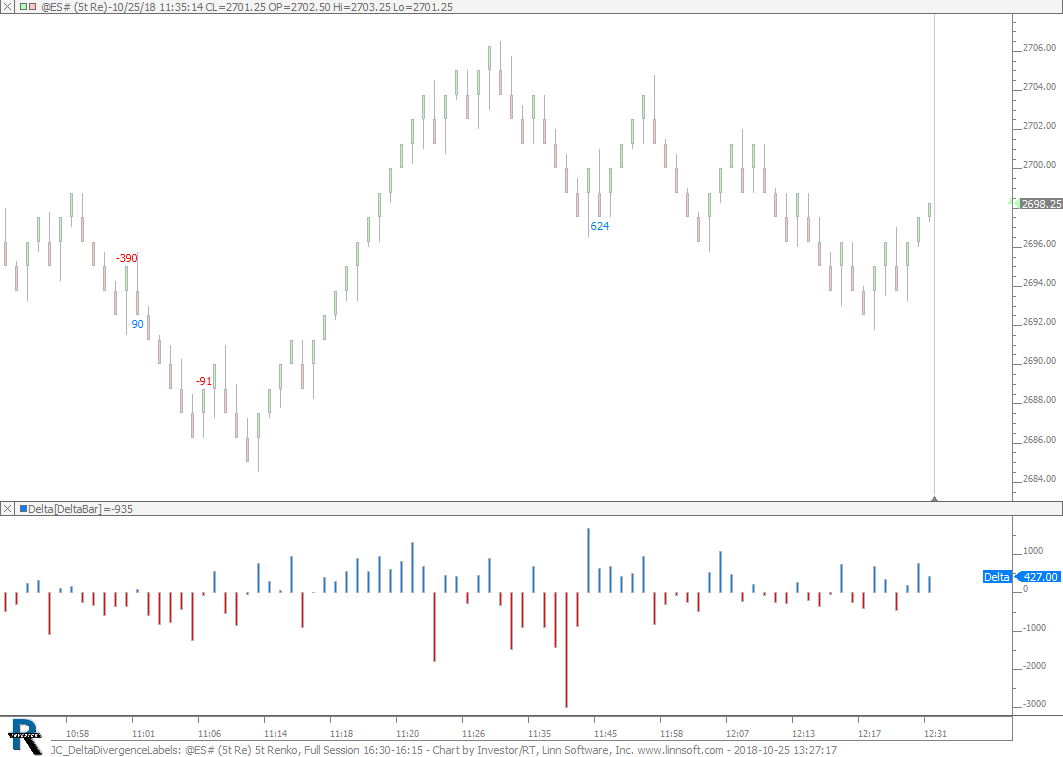 |
JC DeltaDivergenceLabels (@ES#) cpayne [totalcount]
7 years 1 month ago
Delta Divergence Labels. This chart was uploaded by Investor/RT 13.5.8 showing symbol: @ES#. |
View |
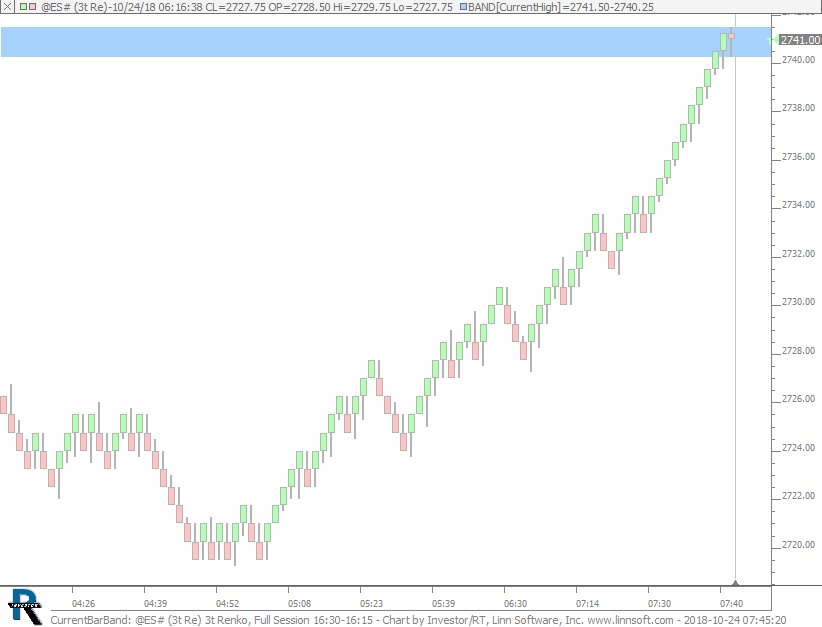 |
CurrentBarBand (@ES#) cpayne [totalcount]
7 years 1 month ago
Band on Current Bar High and Low. This chart was uploaded by Investor/RT 13.5.8 showing symbol: @ES#. |
View |
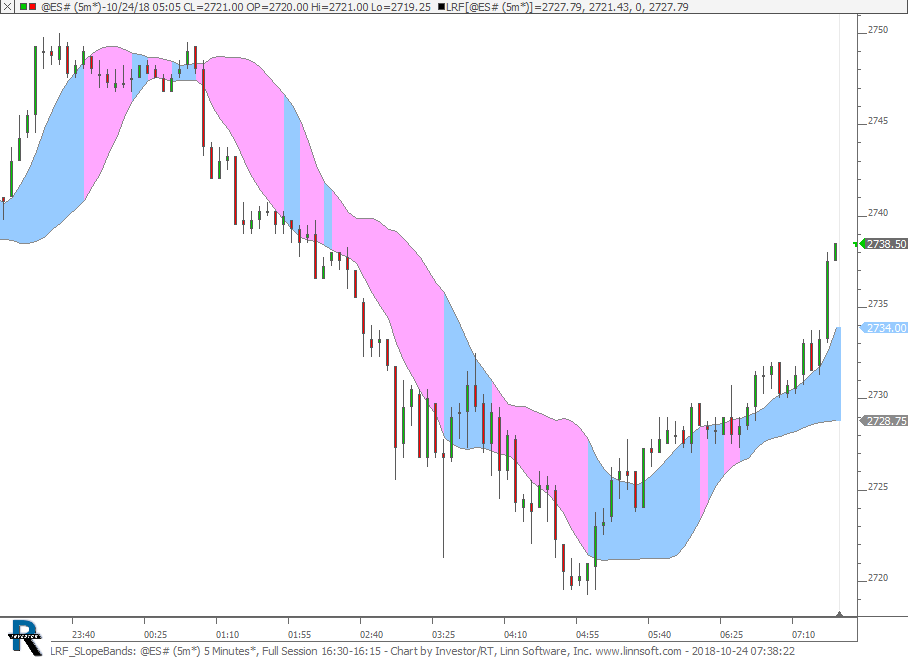 |
LRF SLopeBands (@ES#) cpayne [totalcount]
7 years 1 month ago
Linear Regression Standarad Deviation Bands - Painted based on Slope with PaintIndicator. This chart was uploaded by Investor/RT 13.5.8 showing symbol: @ES#. |
View |
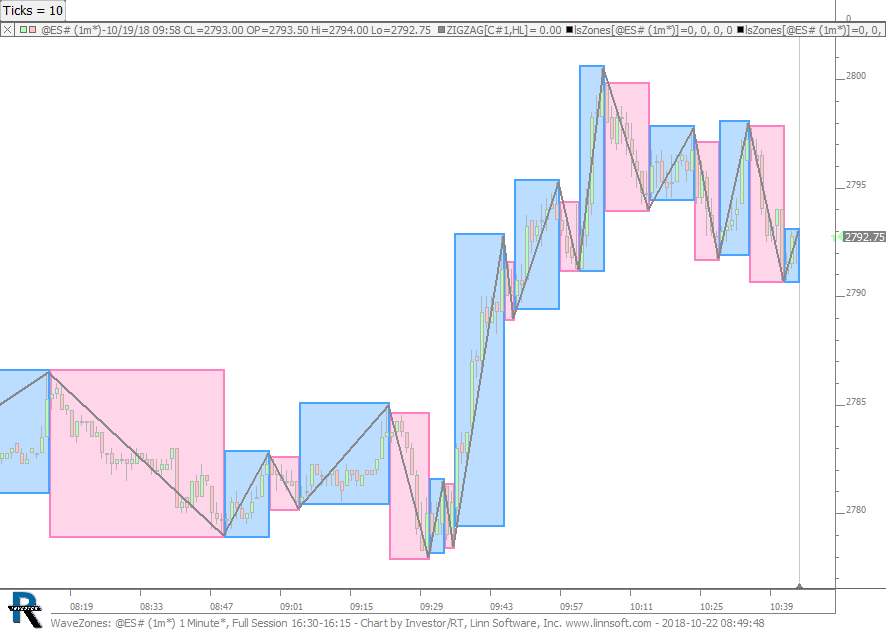 |
WaveZones (@ES#) cpayne [totalcount]
7 years 2 months ago
Wave Zones. This chart was uploaded by Investor/RT 13.5.8 showing symbol: @ES#. |
View |
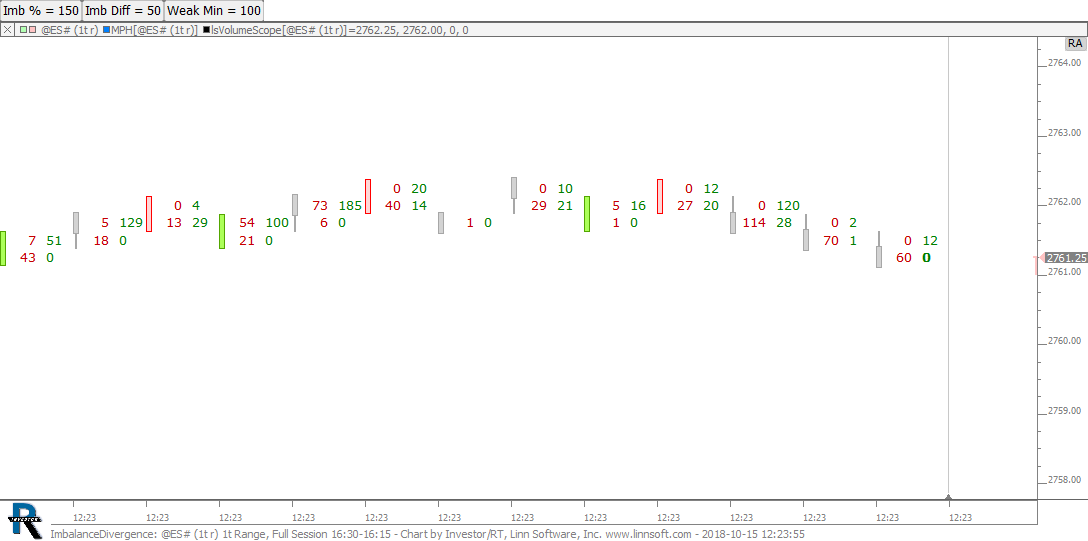 |
ImbalanceDivergence (@ES#) cpayne [totalcount]
7 years 2 months ago
This chart was uploaded by Investor/RT 13.5.7 showing symbol: @ES#. |
View |
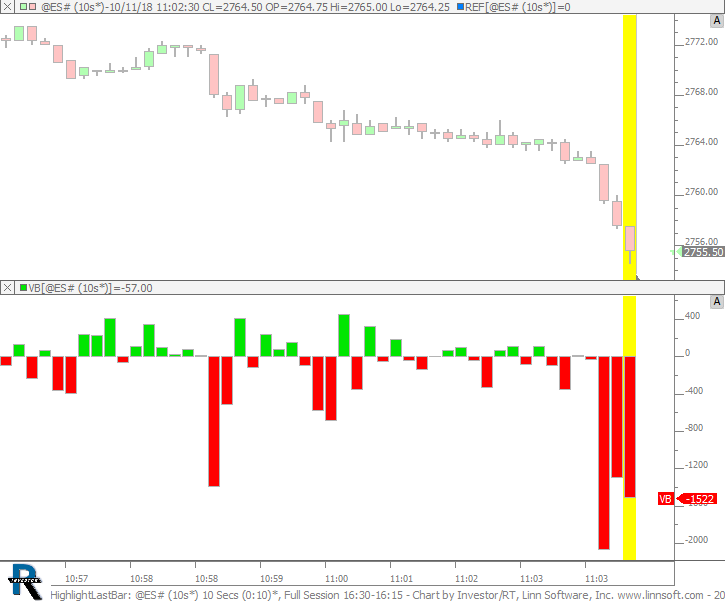 |
HighlightLastBar (@ES#) cpayne [totalcount]
7 years 2 months ago
This chart was uploaded by Investor/RT 13.5.7 showing symbol: @ES#. |
View |
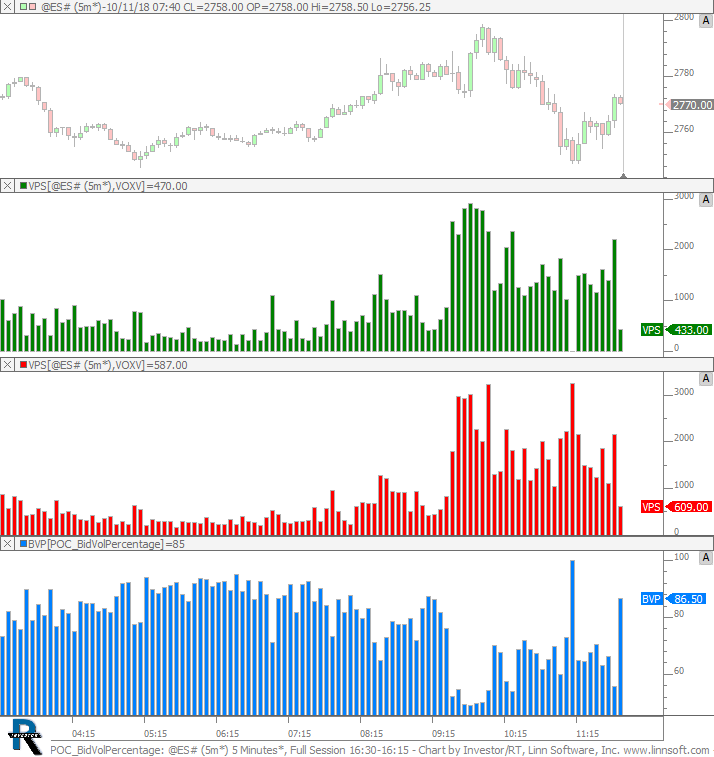 |
POC BidVolPercentage (@ES#) cpayne [totalcount]
7 years 2 months ago
POC Bid Volume Percentage. This chart was uploaded by Investor/RT 13.5.7 showing symbol: @ES#. |
View |
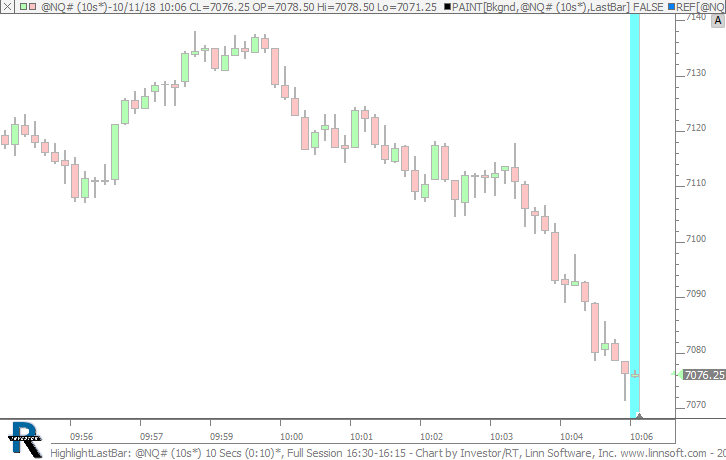 |
HighlightLastBar (@NQ#) cpayne [totalcount]
7 years 2 months ago
Highlight Last Bar. This chart was uploaded by Investor/RT 13.5.7 showing symbol: @NQ#. |
View |
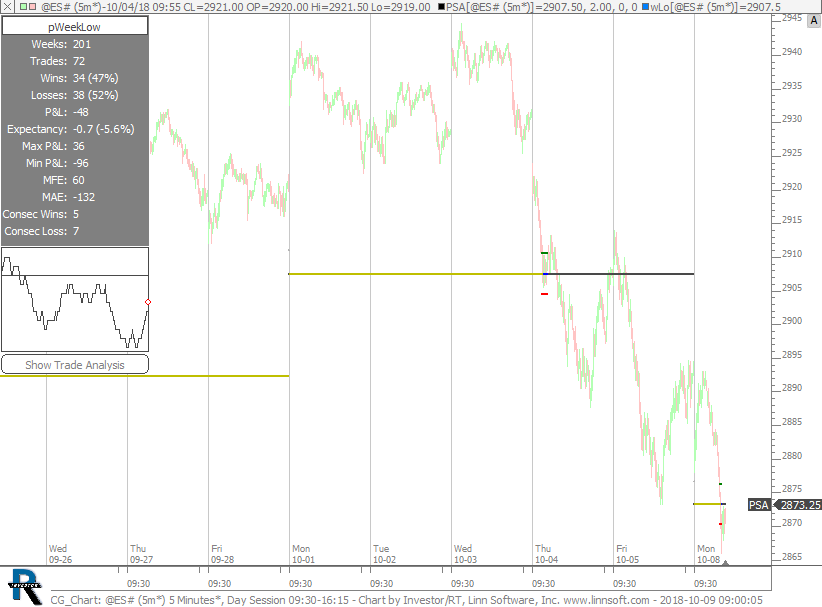 |
CG Chart (@ES#) cpayne [totalcount]
7 years 2 months ago
This chart was uploaded by Investor/RT 13.5.6 showing symbol: @ES#. |
View |
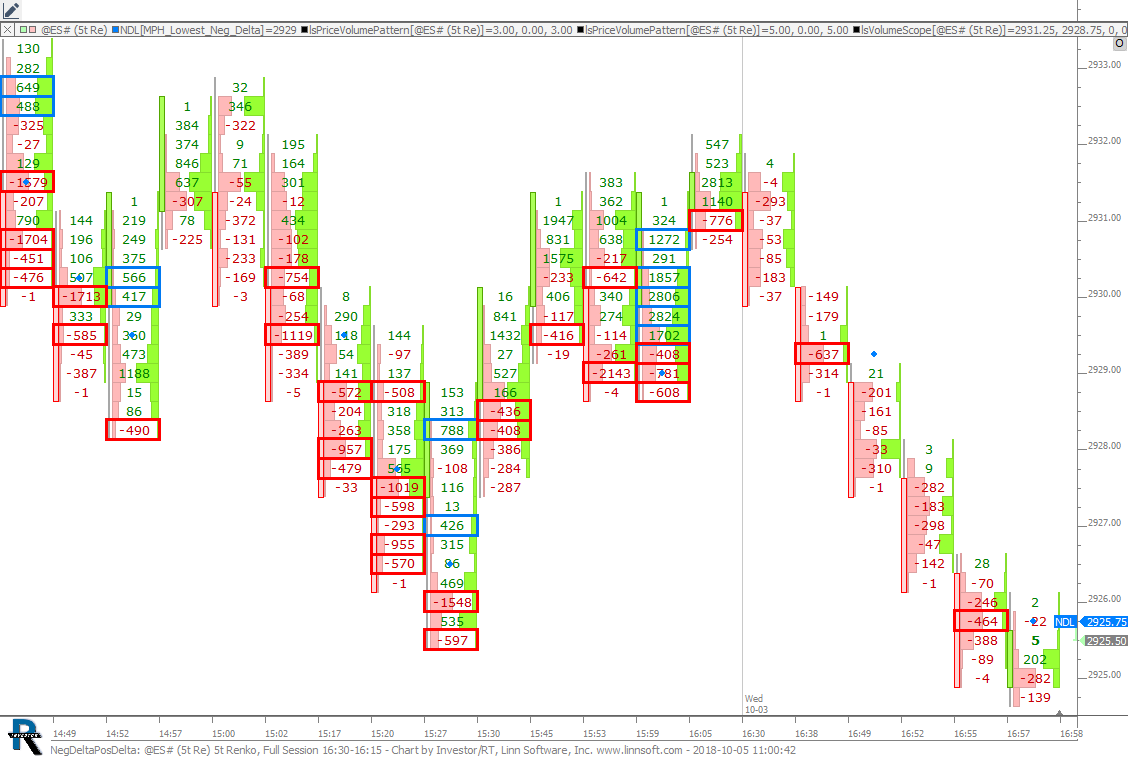 |
NegDeltaPosDelta (@ES#) cpayne [totalcount]
7 years 2 months ago
This chart was uploaded by Investor/RT 13.5.6 showing symbol: @ES#. |
View |
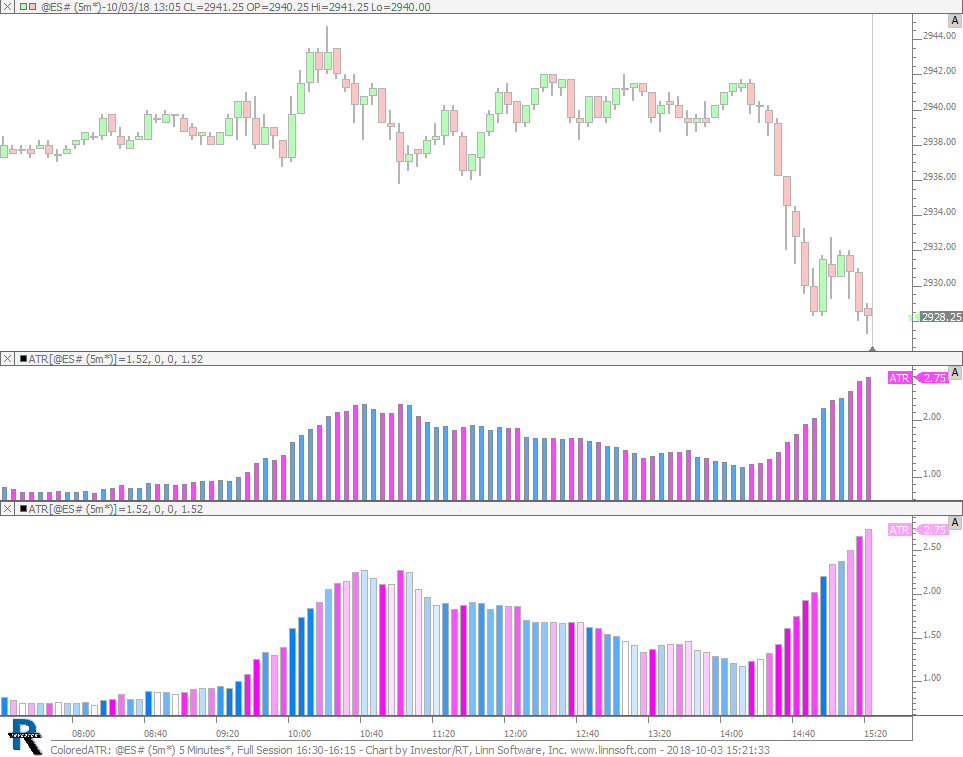 |
ColoredATR (@ES#) cpayne [totalcount]
7 years 2 months ago
Colored ATR based on up or down bars. Using Paint Indicator. This chart was uploaded by Investor/RT 13.5.6 showing symbol: @ES#. |
View |
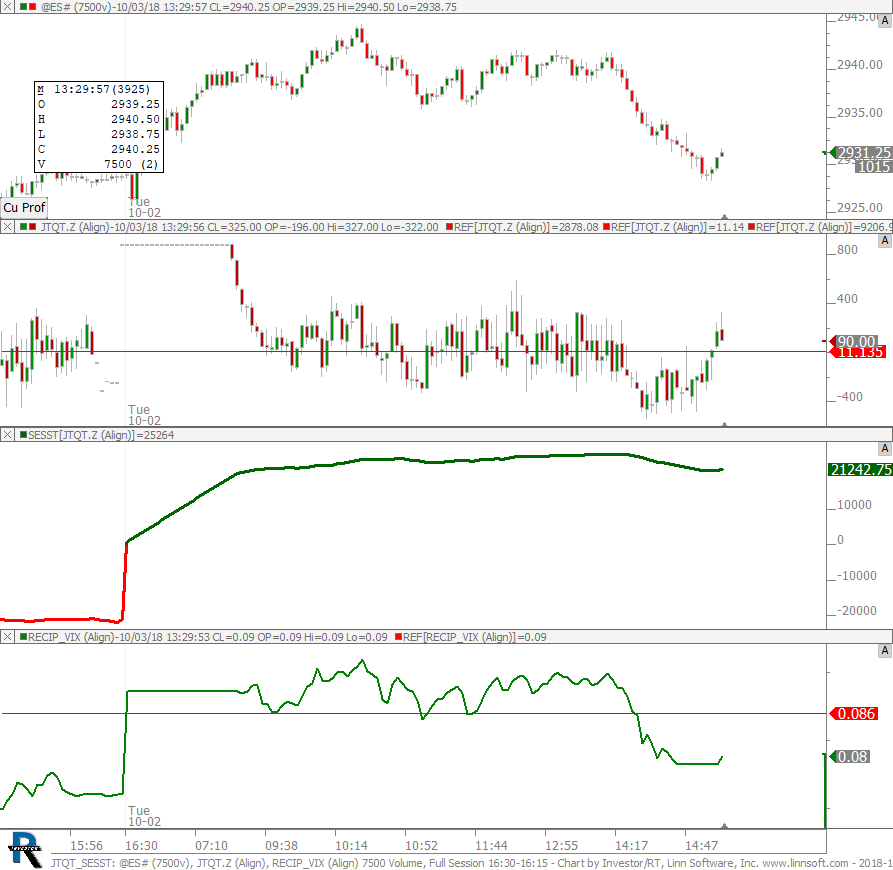 |
JTQT SESST (@ES#) cpayne [totalcount]
7 years 2 months ago
This chart was uploaded by Investor/RT 13.5.6 showing symbol: @ES#. |
View |
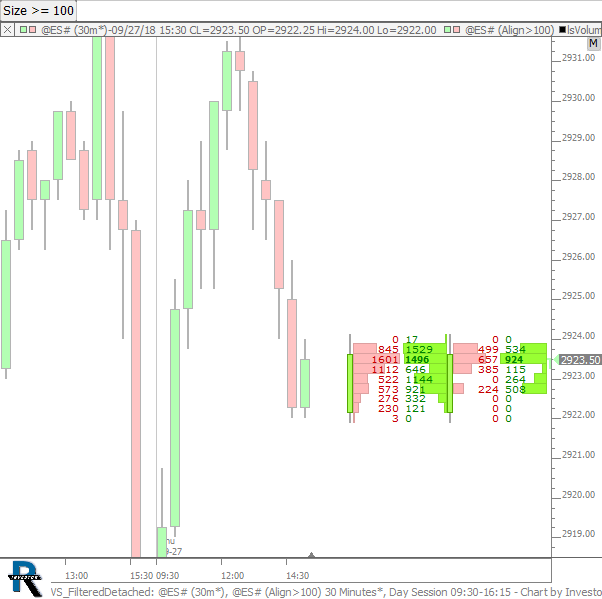 |
VS FilteredDetached (@ES#) cpayne [totalcount]
7 years 2 months ago
This chart was uploaded by Investor/RT 13.5.6 showing symbol: @ES#. |
View |
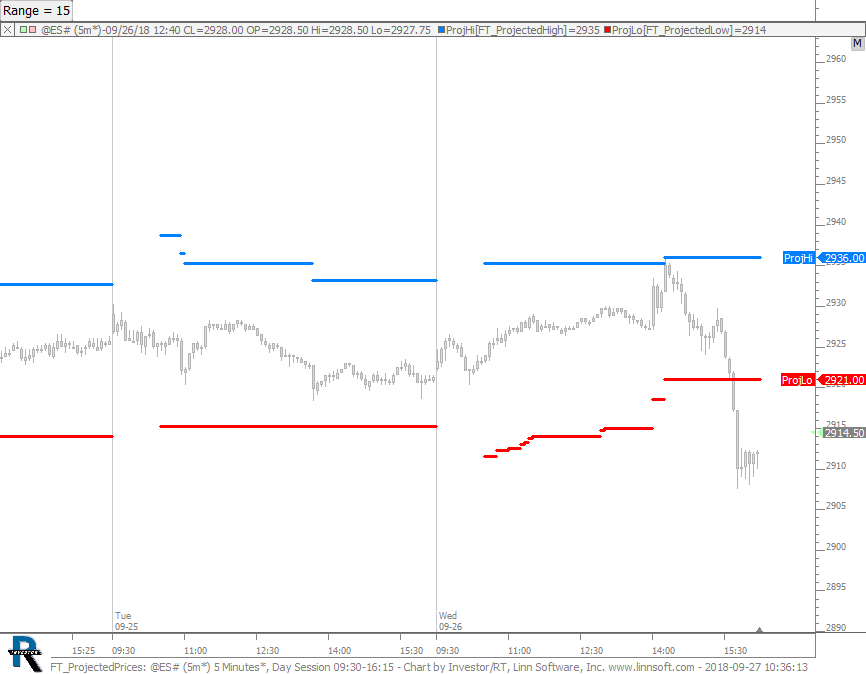 |
FT ProjectedPrices (@ES#) cpayne [totalcount]
7 years 2 months ago
This chart was uploaded by Investor/RT 13.5.6 showing symbol: @ES#. |
View |
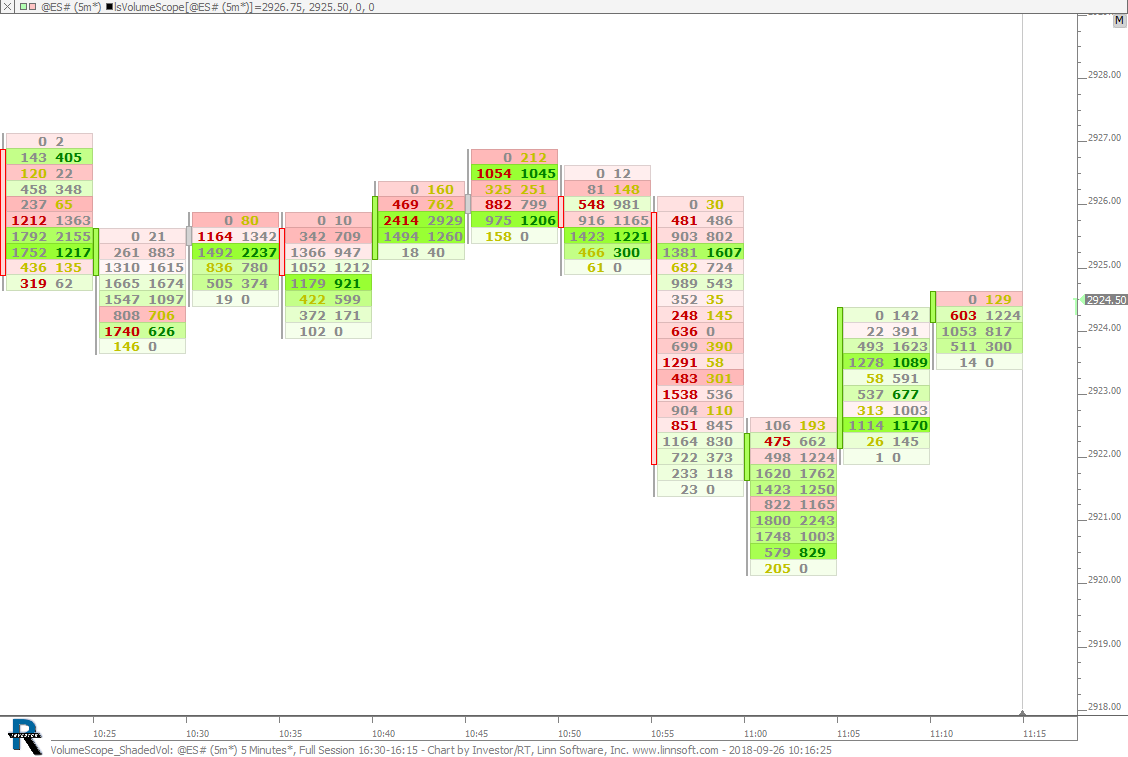 |
VolumeScope ShadedVol (@ES#) cpayne [totalcount]
7 years 2 months ago
This chart was uploaded by Investor/RT 13.5.6 showing symbol: @ES#. |
View |
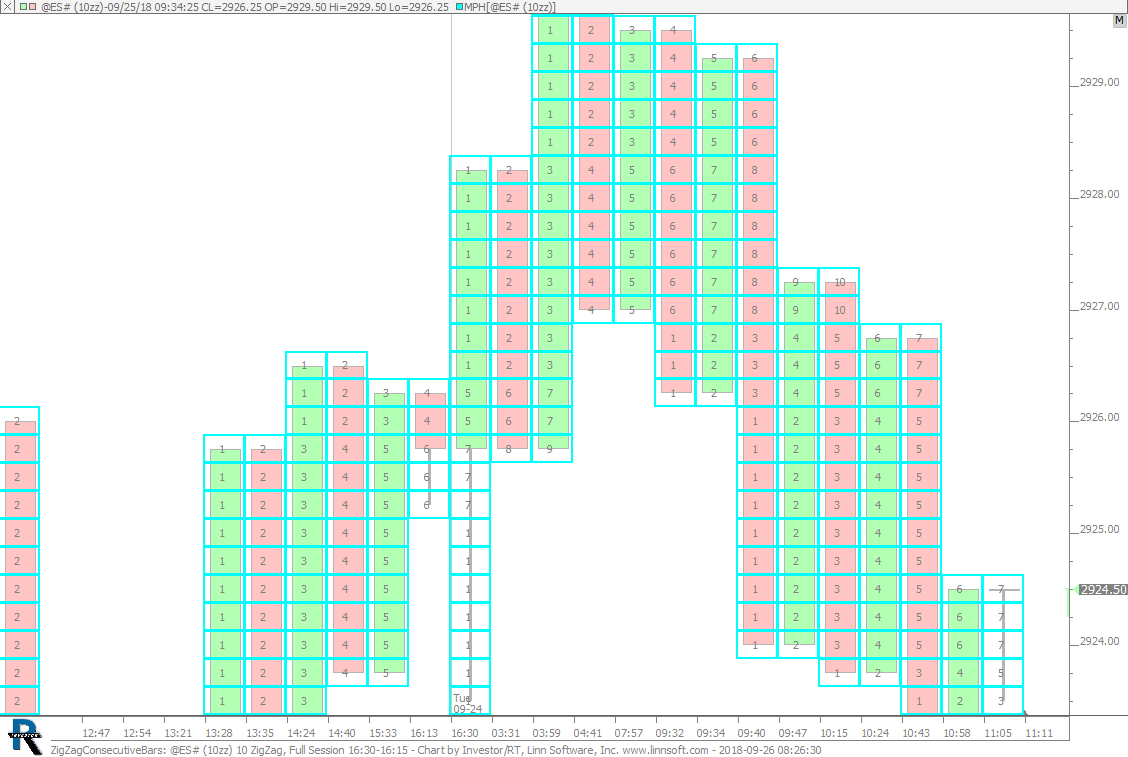 |
ZigZagConsecutiveBars (@ES#) cpayne [totalcount]
7 years 2 months ago
Zig Zag Periodicity Showing how many consecutive bars touched each price. This chart was uploaded by Investor/RT 13.5.6 showing symbol: @ES#. |
View |