 |
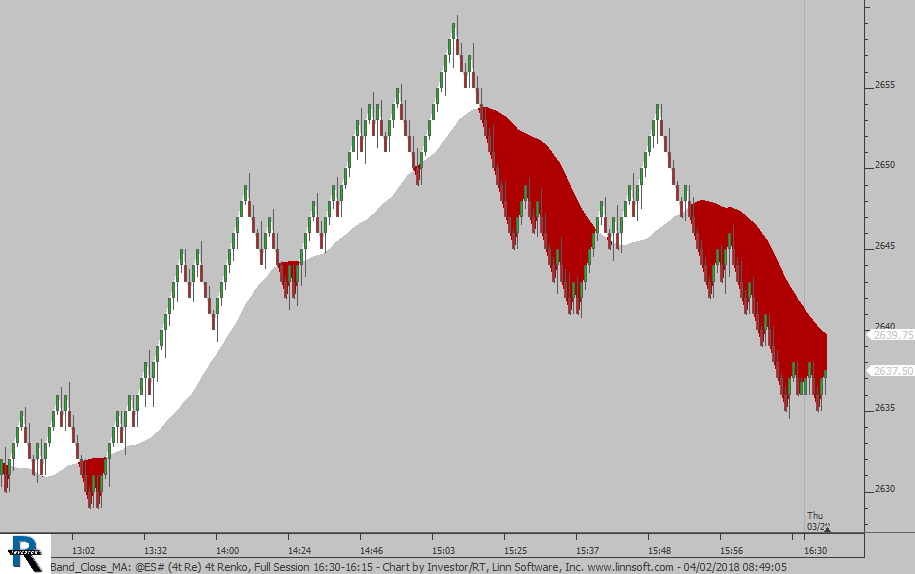
Band Close MA (@ES#) cpayne [totalcount]
8 years 3 months ago
Band between close and moving average. This chart was uploaded by Investor/RT 13.2.7 showing symbol: @ES#. |
View |
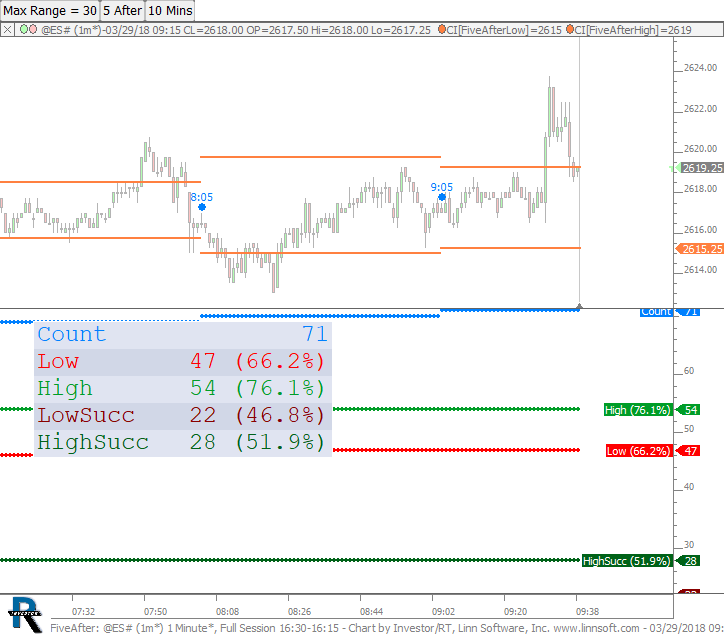 |
FiveAfter (@ES#) cpayne [totalcount]
8 years 4 months ago
IB every hour. This chart was uploaded by Investor/RT 13.2.7 showing symbol: @ES#. |
View |
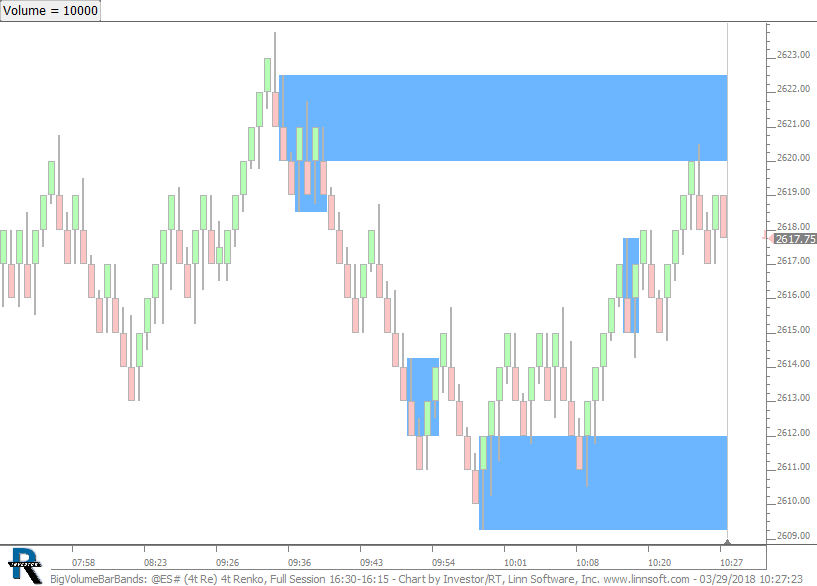 |
BigVolumeBarBands (@ES#) cpayne [totalcount]
8 years 4 months ago
Extends the range of high volume bars until filled. Volume level is dictated by button at top. This chart was uploaded by Investor/RT 13.2.7 showing symbol: @ES#. |
View |
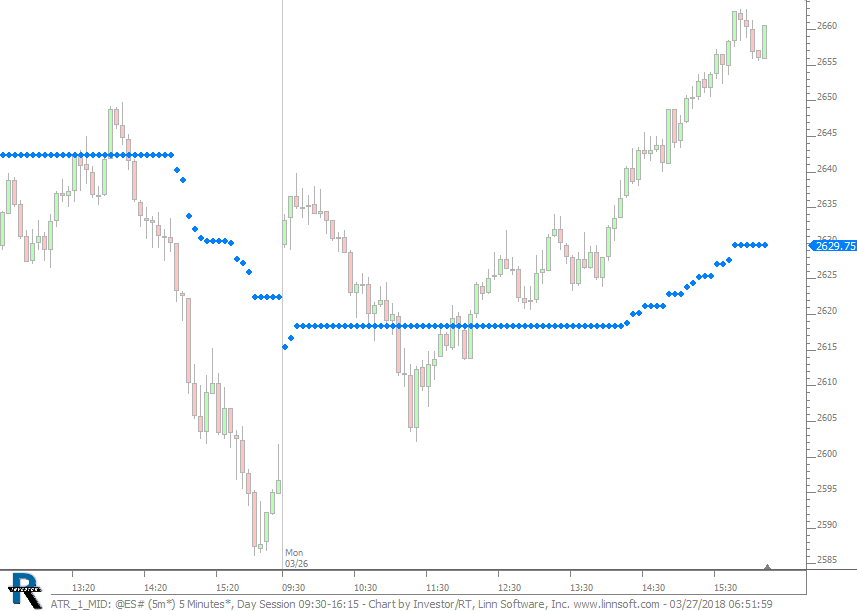 |
ATR 1 MID (@ES#) cpayne [totalcount]
8 years 4 months ago
ATR Midpoint - 1 Day Lookback. This chart was uploaded by Investor/RT 13.2.7 showing symbol: @ES#. |
View |
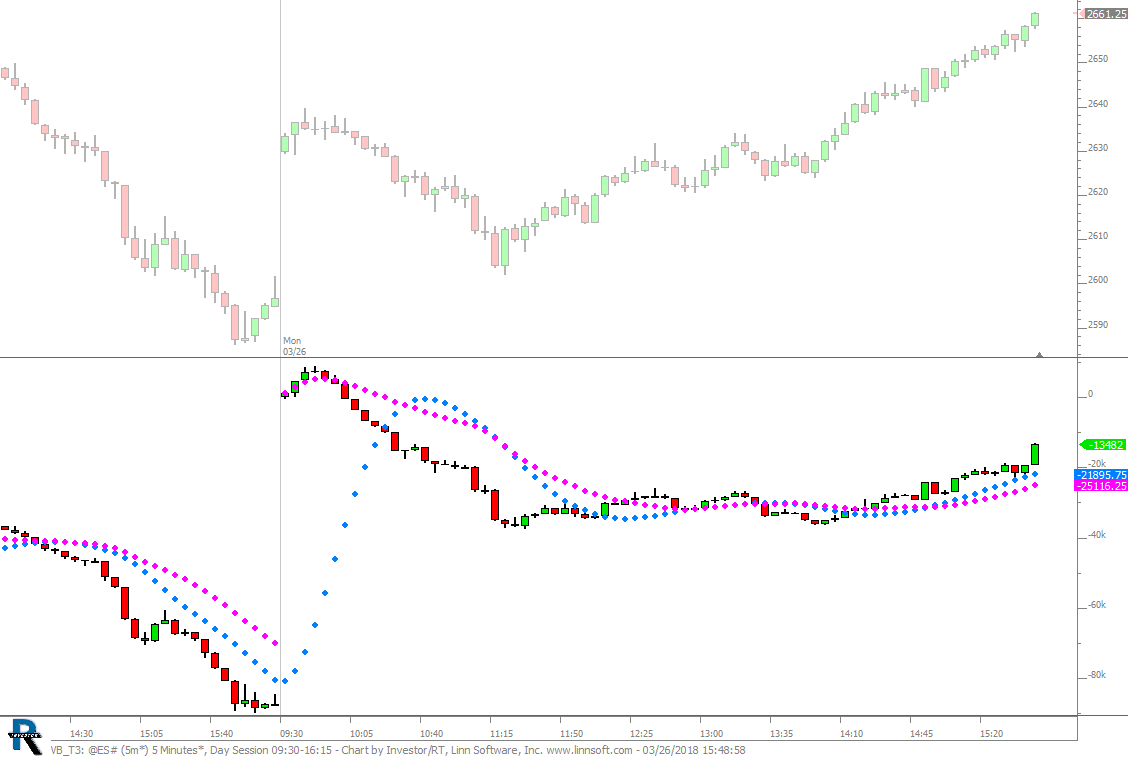 |
VB T3 (@ES#) cpayne [totalcount]
8 years 4 months ago
This chart was uploaded by Investor/RT 13.2.7 showing symbol: @ES#. |
View |
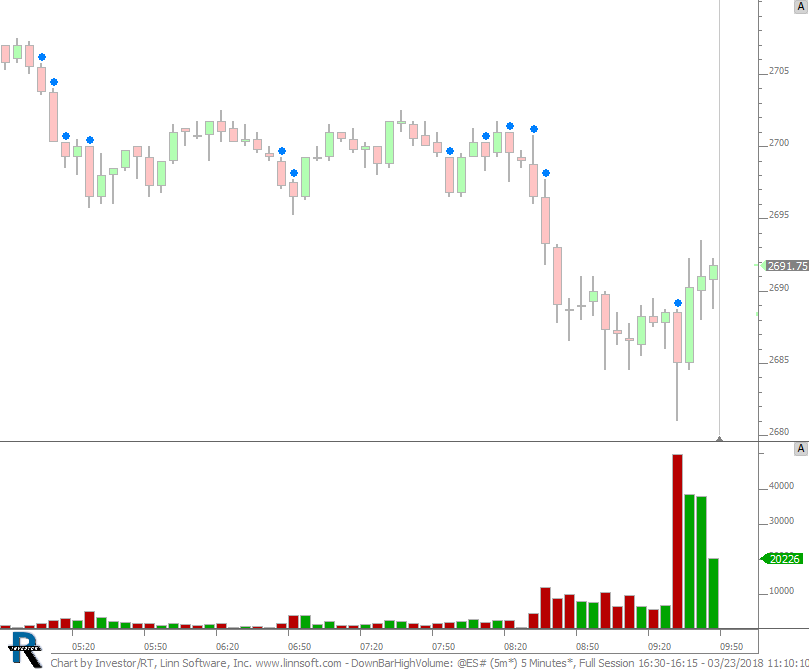 |
DownBarHighVolume (@ES#) cpayne [totalcount]
8 years 4 months ago
Identifies Down Bars whose volume is greater than the volume of the previous 5 down bars. This chart was uploaded by Investor/RT 13.2.7 showing symbol: @ES#. |
View |
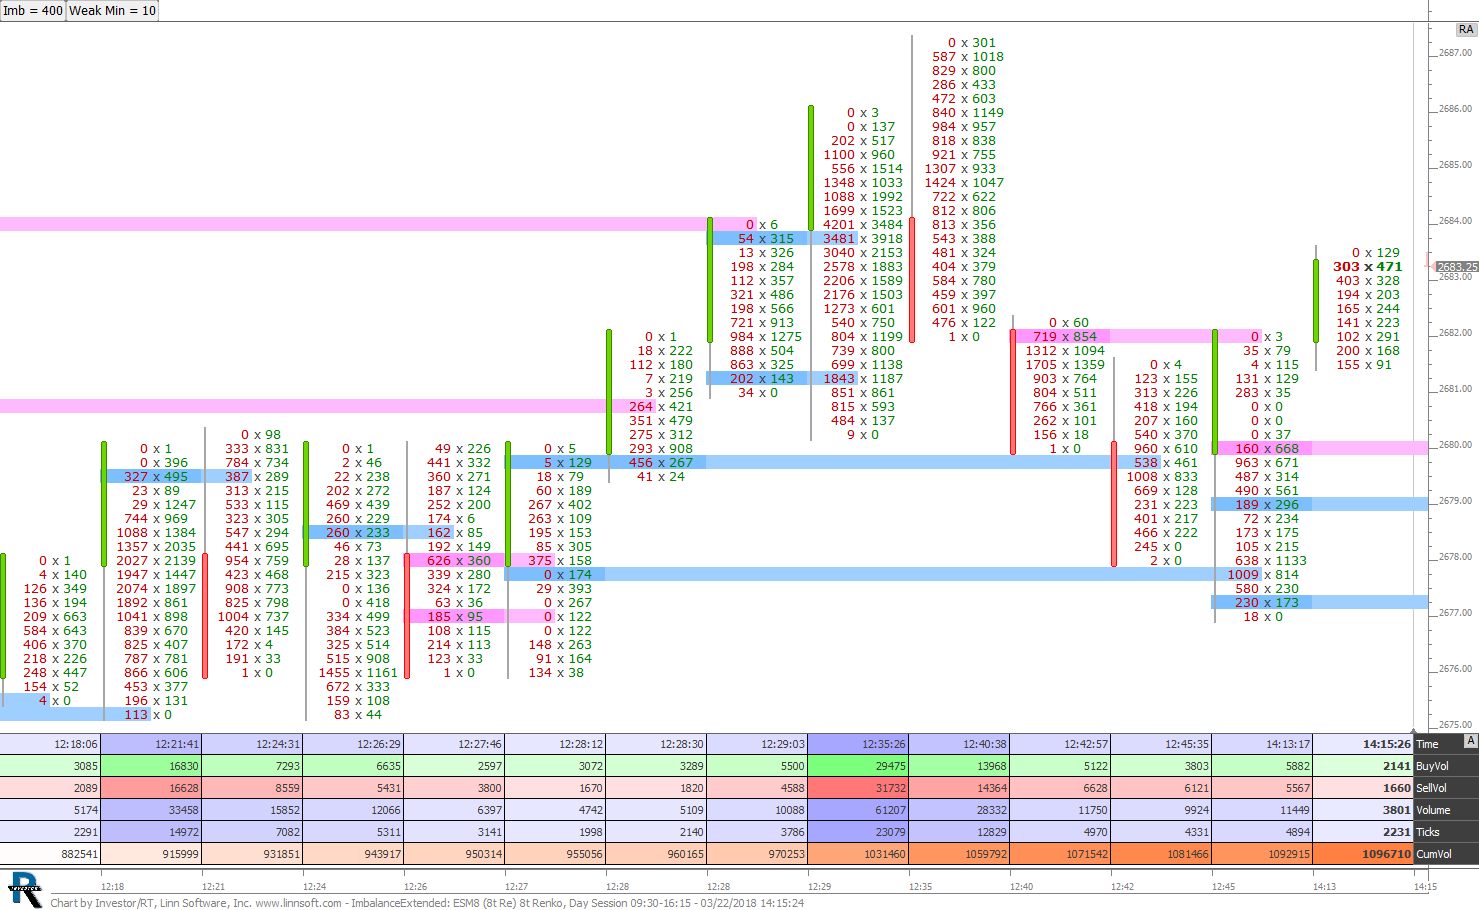 |
ImbalanceExtended (ESM8) cpayne [totalcount]
8 years 4 months ago
Buy (blue) and Sell (pink) imbalance are identified and extended while naked using MPH. The buttons at top control the imbalance percent and the minimum volume required on the weak side. |
View |
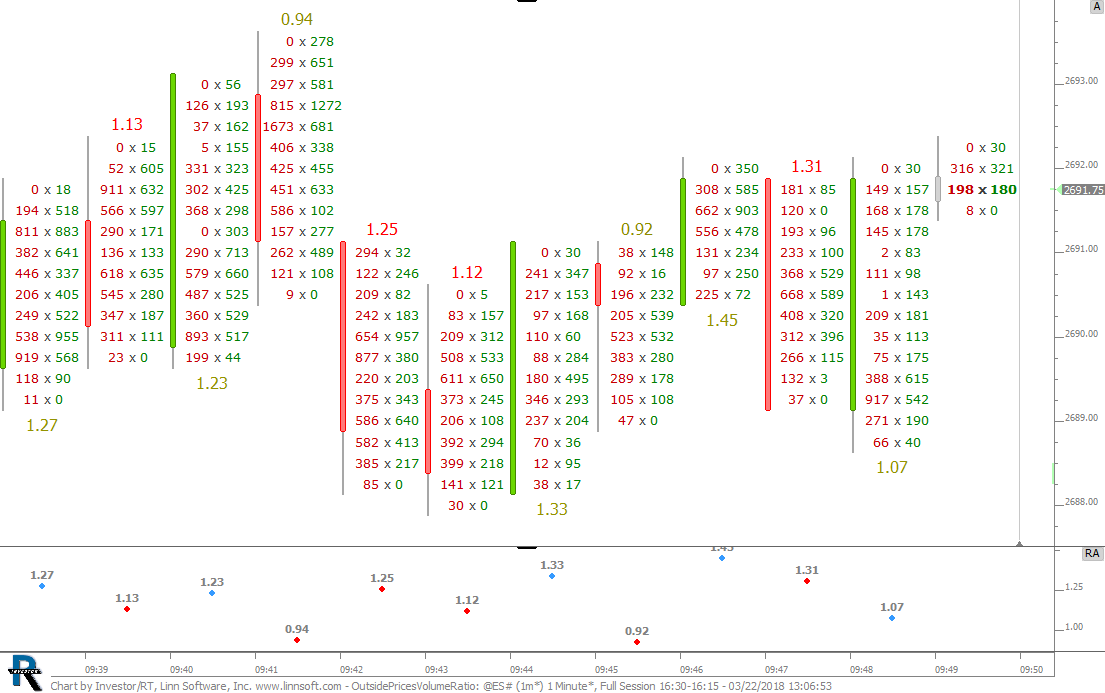 |
OutsidePricesVolumeRatio (@ES#) cpayne [totalcount]
8 years 4 months ago
Ratio of Buy or Sell Volume of Outside Prices depending on cancle is up or down. This chart was uploaded by Investor/RT 13.2.5 showing symbol: @ES#. |
View |
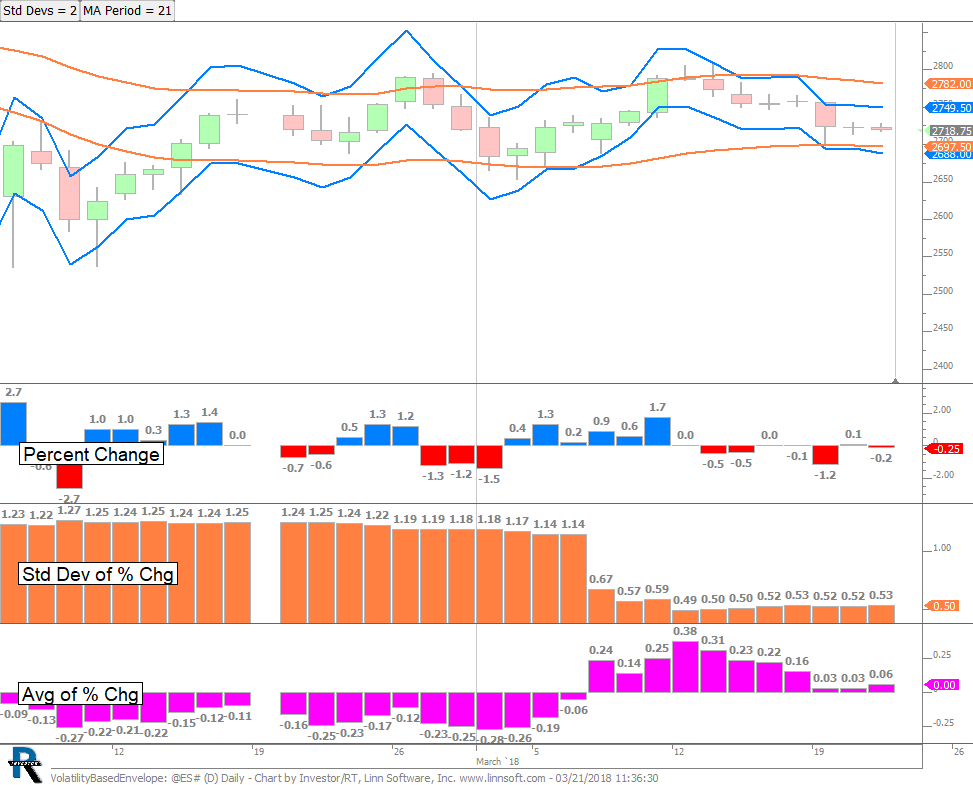 |
VolatilityBasedEnvelope (@ES#) cpayne [totalcount]
8 years 4 months ago
Volatility Based Envelope (VBE). This chart was uploaded by Investor/RT 13.2.6 showing symbol: @ES#. |
View |
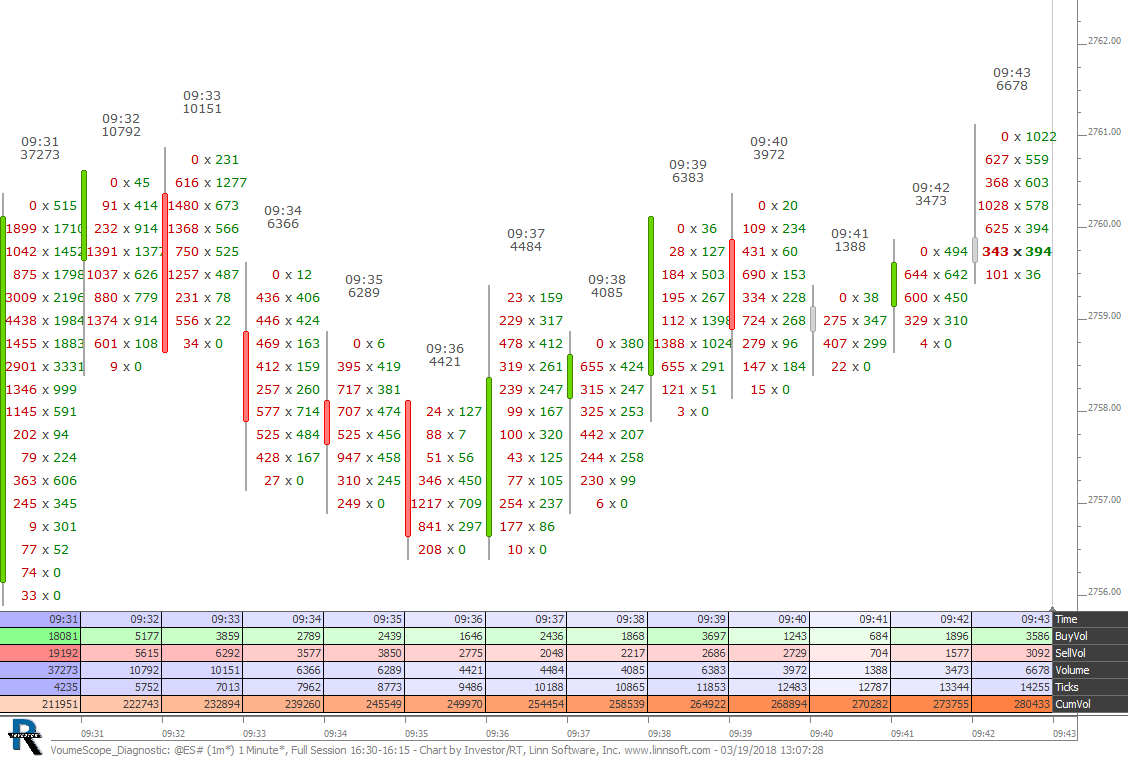 |
VoumeScope Diagnostic (@ES#) cpayne [totalcount]
8 years 4 months ago
This chart was uploaded by Investor/RT 13.2.6 showing symbol: @ES#. |
View |
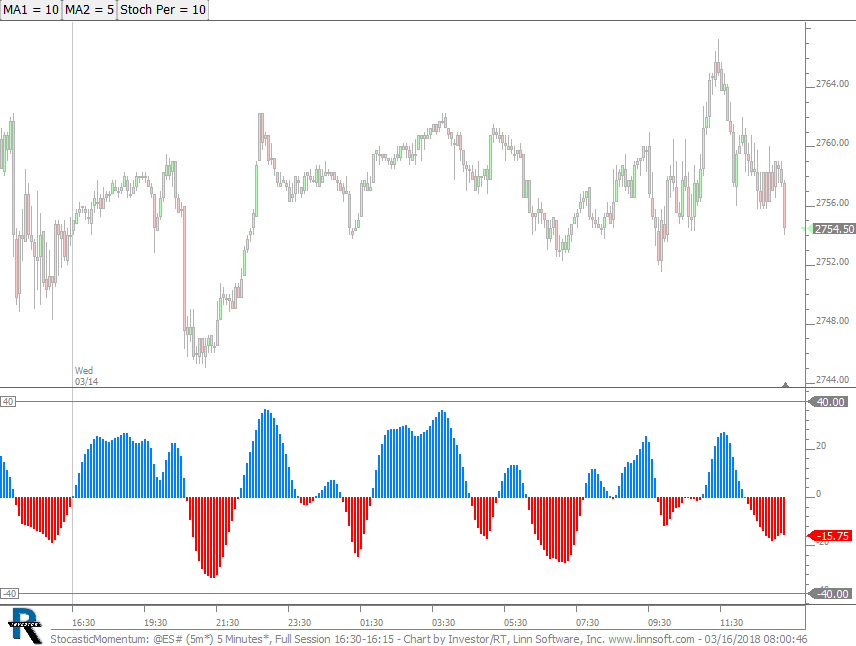 |
StocasticMomentum (@ES#) cpayne [totalcount]
8 years 4 months ago
Stochastic Momentum. This chart was uploaded by Investor/RT 13.2.6 showing symbol: @ES#. |
View |
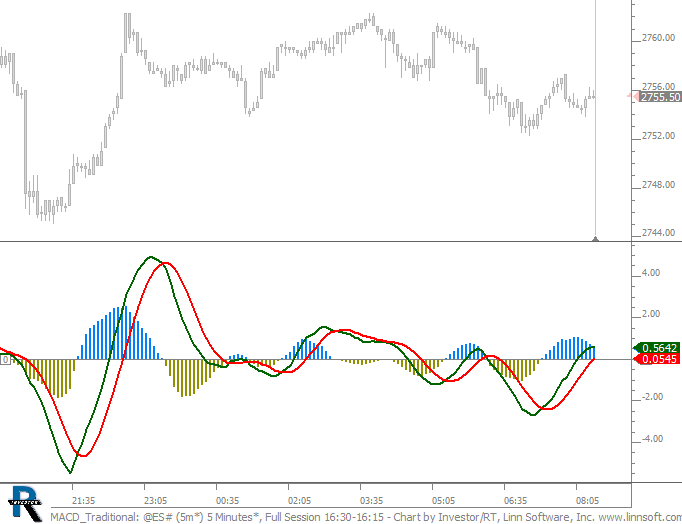 |
MACD Traditional (@ES#) cpayne [totalcount]
8 years 4 months ago
MACD Traditional. This chart was uploaded by Investor/RT 13.2.6 showing symbol: @ES#. |
View |
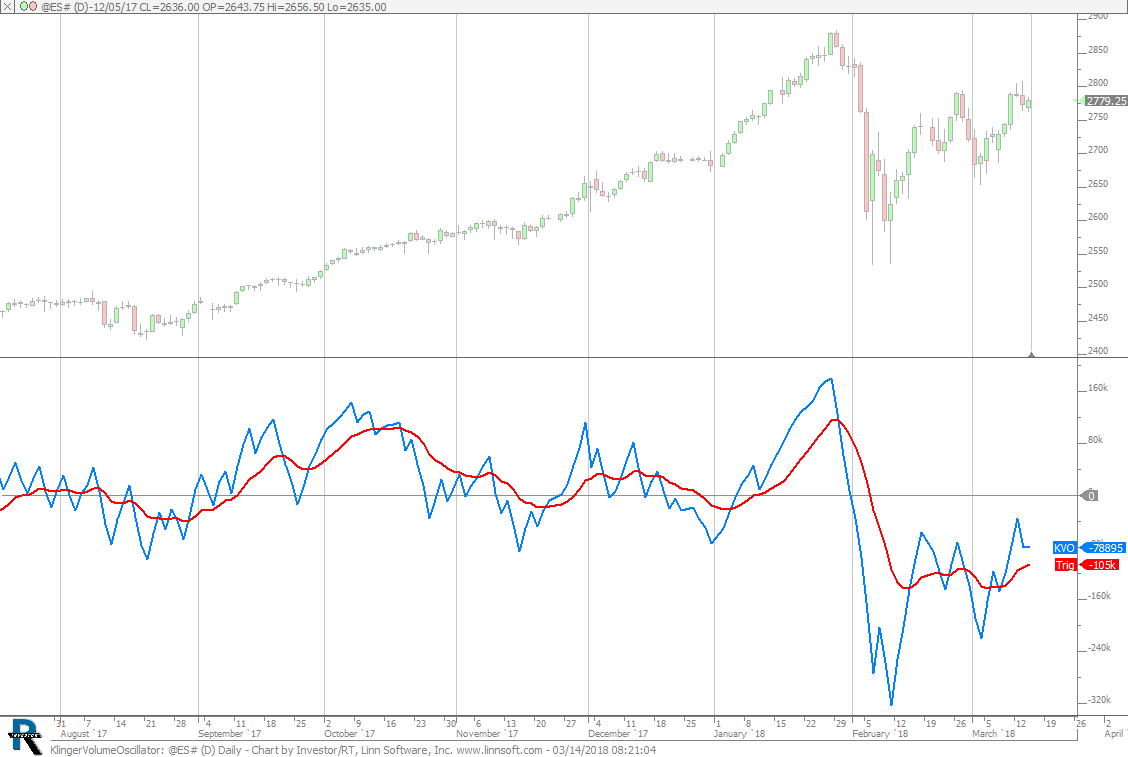 |
KlingerVolumeOscillator (@ES#) cpayne [totalcount]
8 years 4 months ago
Klinger Volume Oscillator. This chart was uploaded by Investor/RT 13.2.5 showing symbol: @ES#. |
View |
 |
ATR Ticks QP cpayne [totalcount]
8 years 4 months ago
Quotepage has ATR_Ticks column computing the daily ATR in tick increments (to feed Renko). This chart was uploaded by Investor/RT 13.2.5. |
View |
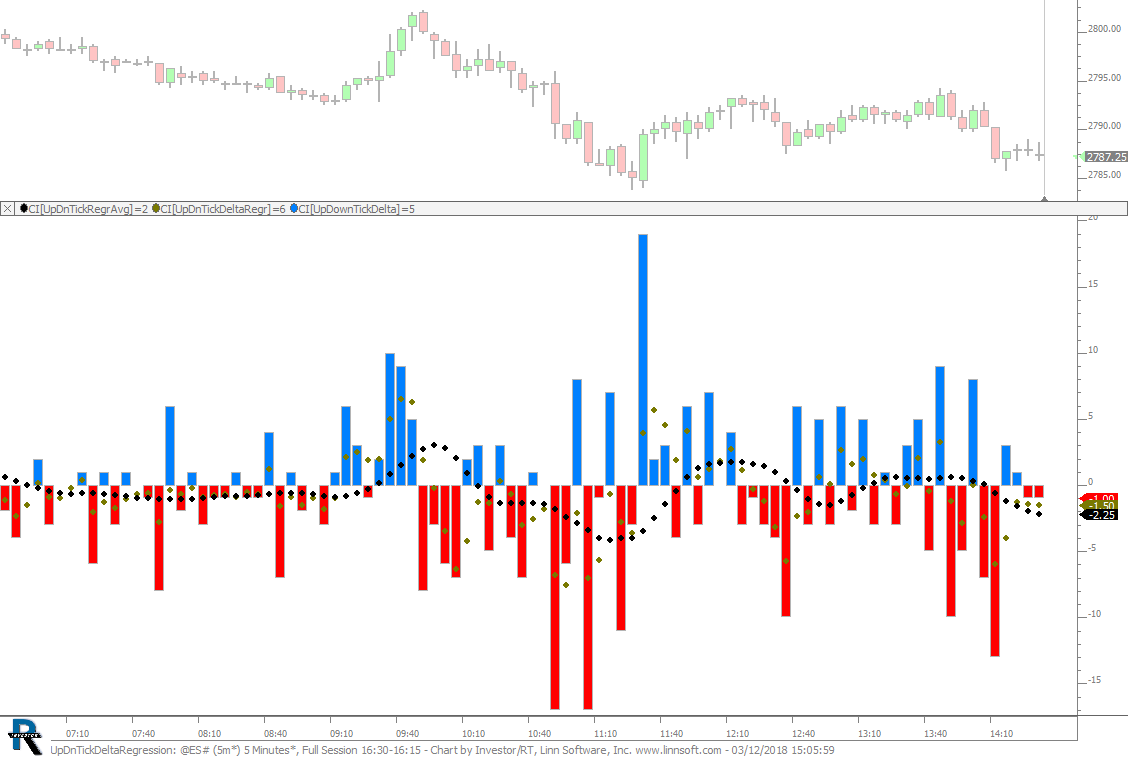 |
UpDnTickDeltaRegression (@ES#) cpayne [totalcount]
8 years 4 months ago
Up Down Tick Delta Regression Analysis. This chart was uploaded by Investor/RT 13.2.5 showing symbol: @ES#. |
View |
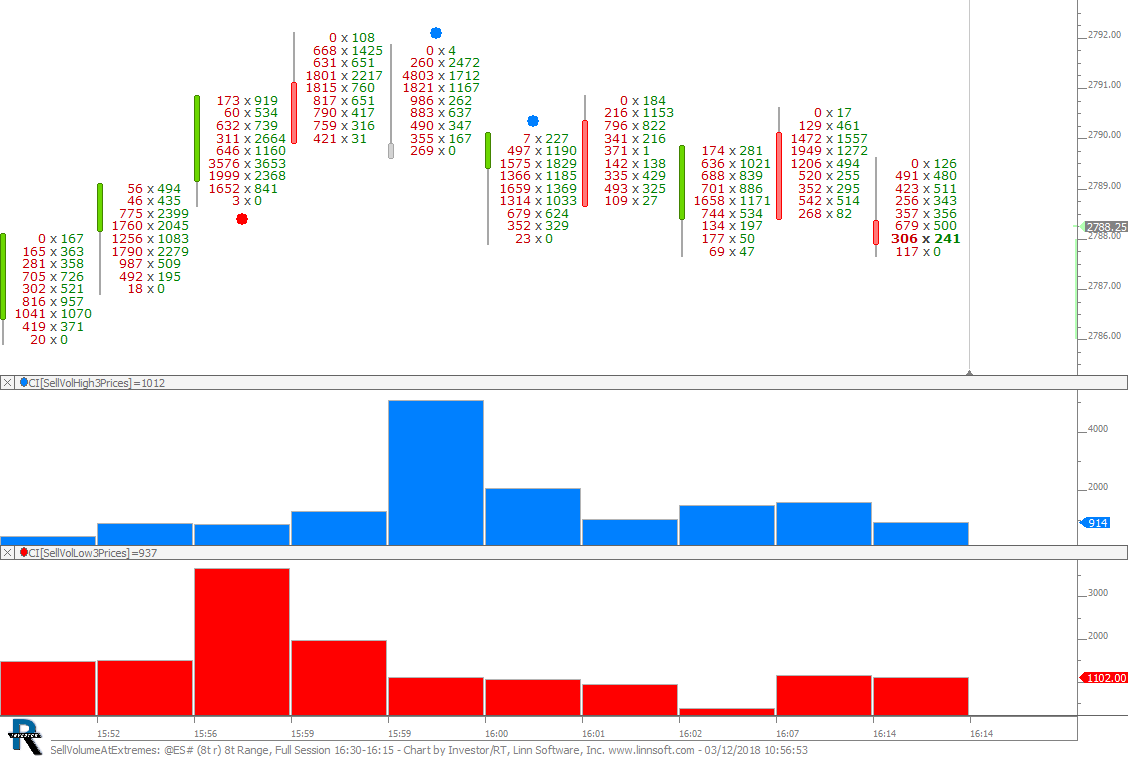 |
SellVolumeAtExtremes (@ES#) cpayne [totalcount]
8 years 4 months ago
Sell Volume at High and Low 3 Prices of bar. This chart was uploaded by Investor/RT 13.2.5 showing symbol: @ES#. |
View |
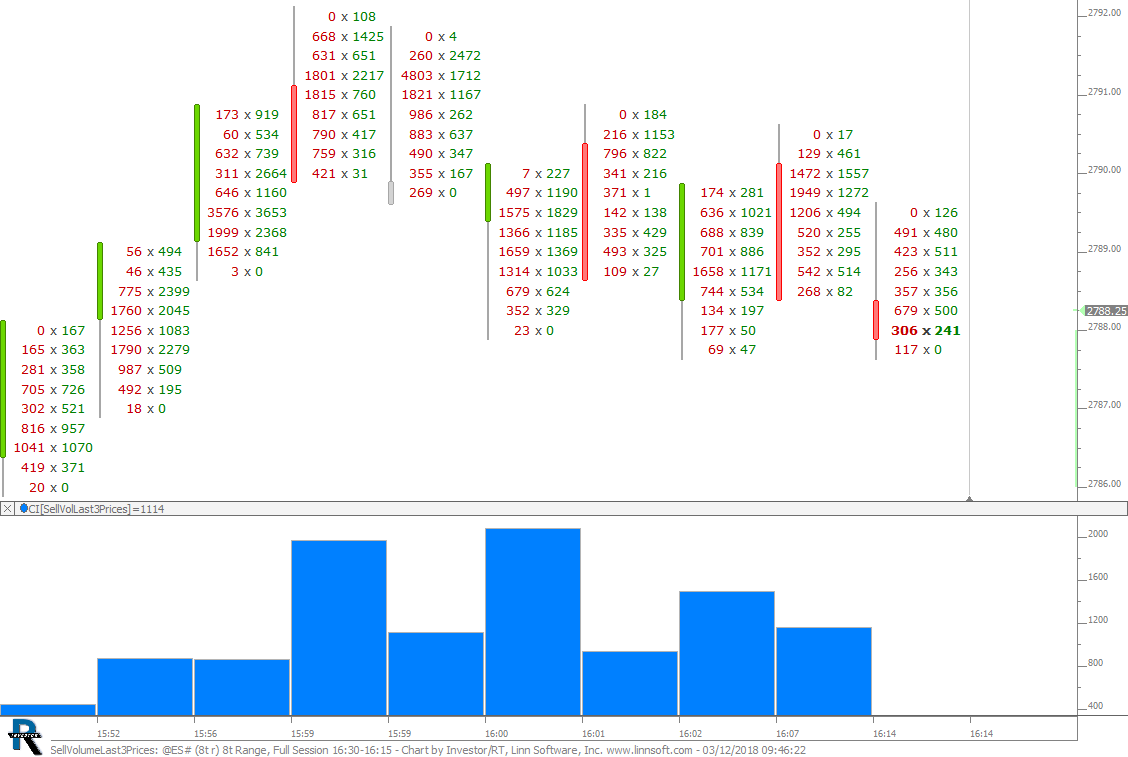 |
SellVolumeLast3Prices (@ES#) cpayne [totalcount]
8 years 4 months ago
Sell Volume of Last 3 Prices. This chart was uploaded by Investor/RT 13.2.5 showing symbol: @ES#. |
View |
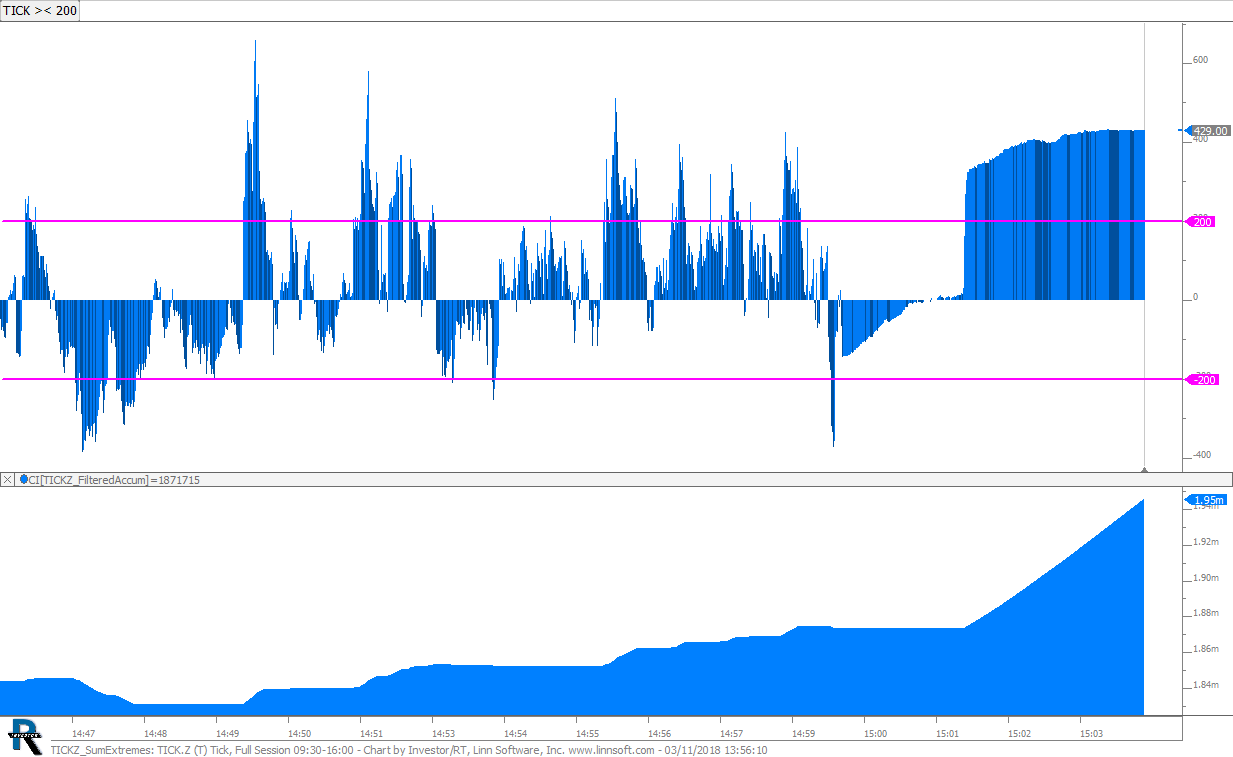 |
TICKZ SumExtremes (TICK.Z) cpayne [totalcount]
8 years 4 months ago
Filtered Cumulative Tick - Consideres every tick on TICK.Z and sums for the session, ignoring values inside of -200 to 200 (change the 200 magnitude with button). |
View |
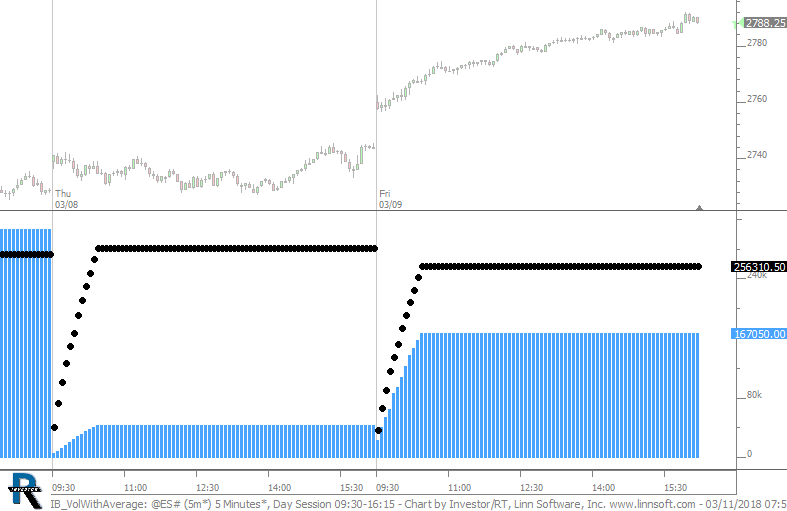 |
IB VolWithAverage (@ES#) cpayne [totalcount]
8 years 4 months ago
IB Volume (Blue Histogram) and average of volume at time of day of last 10 days (black). This chart was uploaded by Investor/RT 13.2.5 showing symbol: @ES#. |
View |
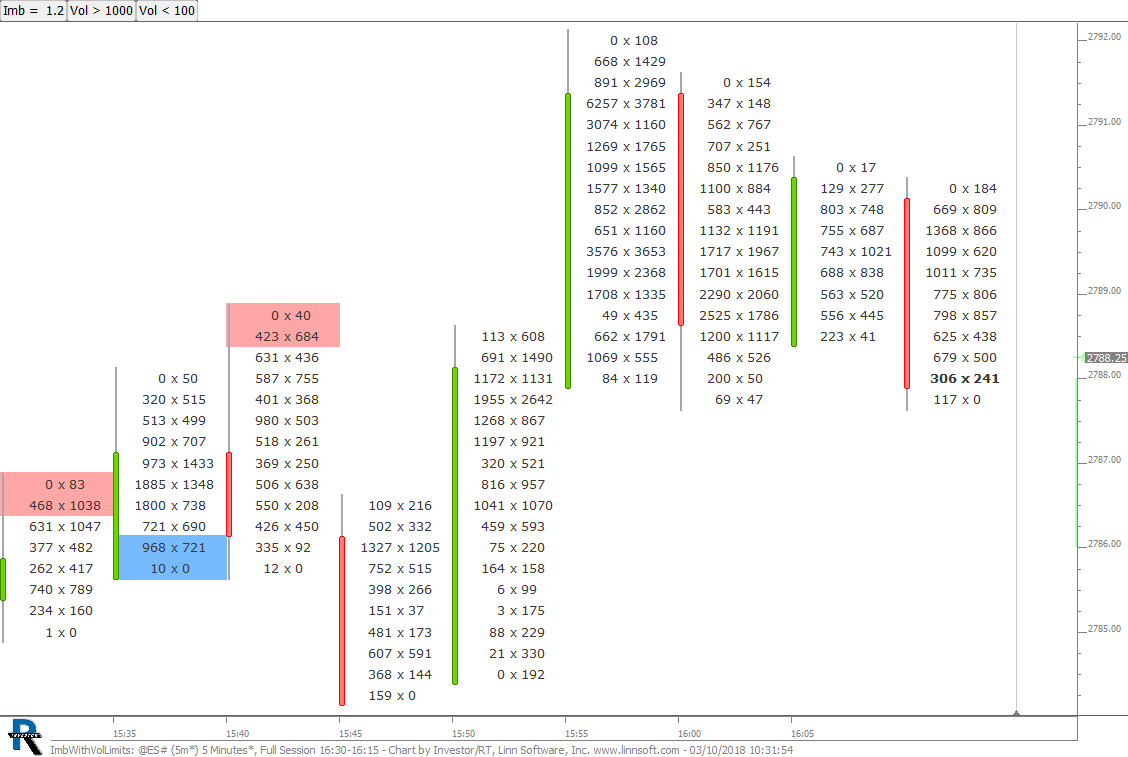 |
ImbWithVolLimits (@ES#) cpayne [totalcount]
8 years 4 months ago
Imbalance (C1) with Volume of price > C2 and volume of weak side < C3. This chart was uploaded by Investor/RT 13.2.5 showing symbol: @ES#. |
View |
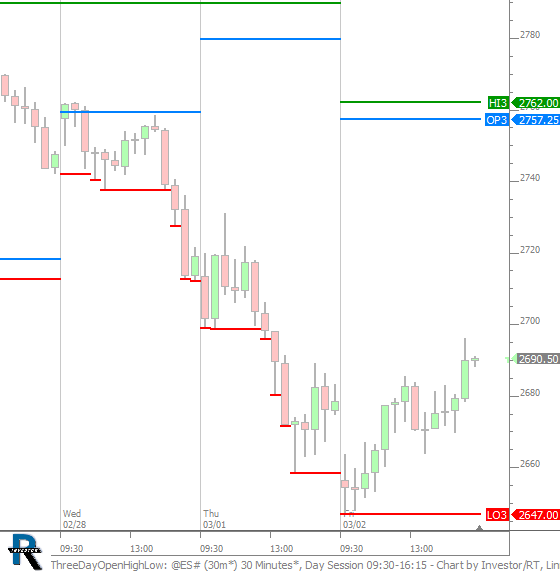 |
ThreeDayOpenHighLow (@ES#) cpayne [totalcount]
8 years 4 months ago
High, Low, and Open of Last Three Days. This chart was uploaded by Investor/RT 13.2.5 showing symbol: @ES#. |
View |
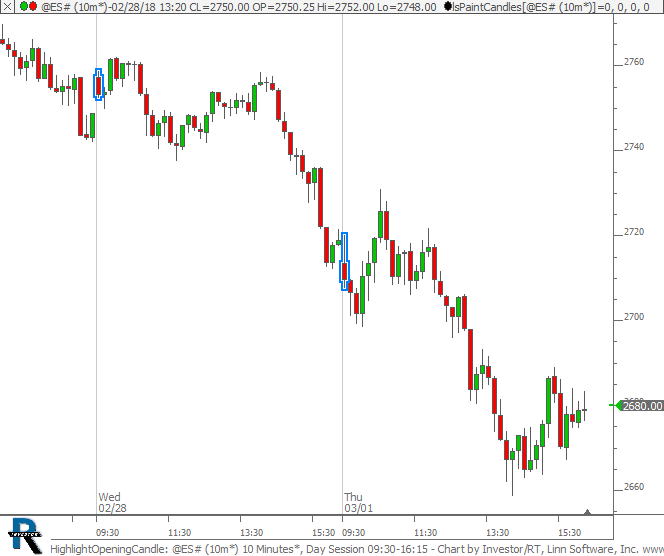 |
HighlightOpeningCandle (@ES#) cpayne [totalcount]
8 years 4 months ago
Highlight First Bar of Session. This chart was uploaded by Investor/RT 13.2.5 showing symbol: @ES#. |
View |
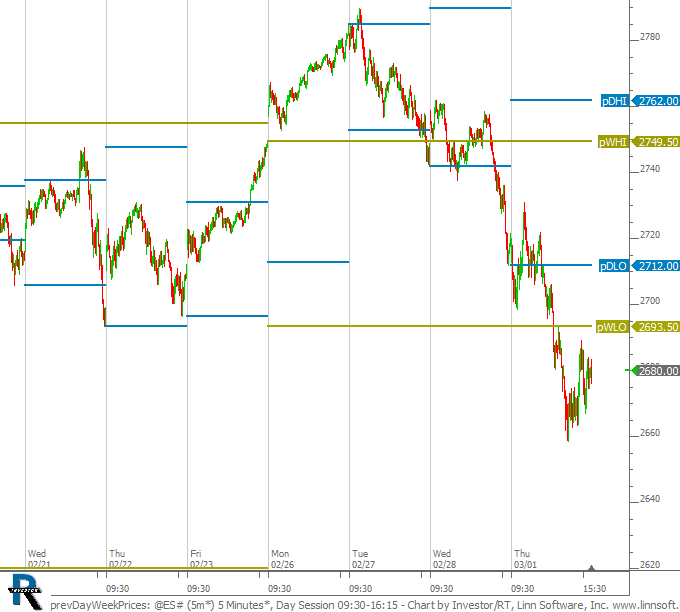 |
prevDayWeekPrices (@ES#) cpayne [totalcount]
8 years 4 months ago
Previous Day and Week High and Low Price Lines. This chart was uploaded by Investor/RT 13.2.5 showing symbol: @ES#. |
View |
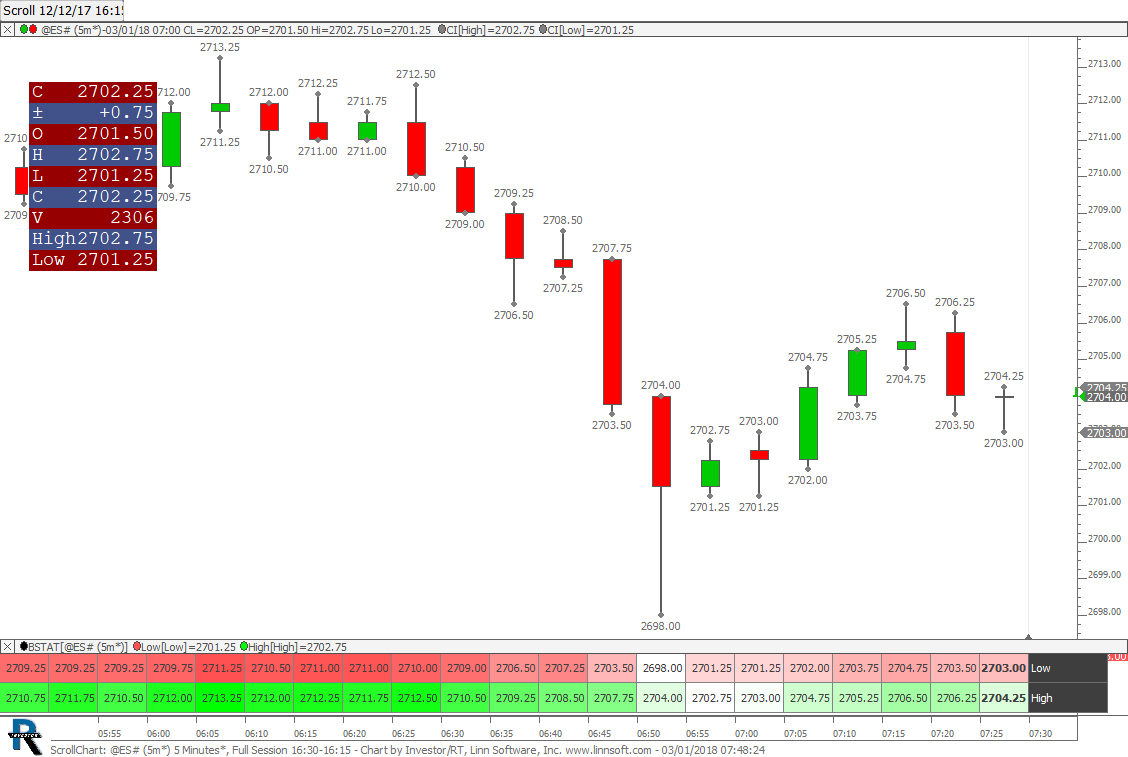 |
ScrollChart (@ES#) cpayne [totalcount]
8 years 4 months ago
Variety of ways to see the high and low of each bar. This chart was uploaded by Investor/RT 13.2.5 showing symbol: @ES#. |
View |
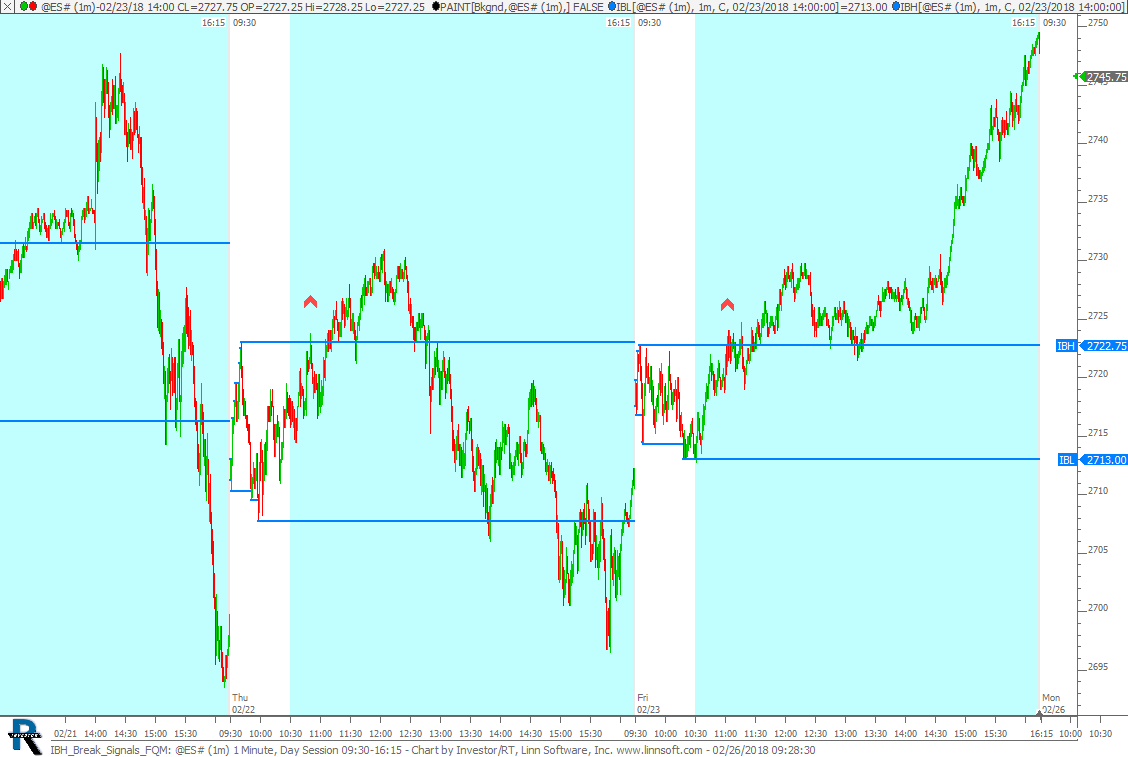 |
IBH Break Signals FQM (@ES#) cpayne [totalcount]
8 years 5 months ago
This chart was uploaded by Investor/RT 13.2.4 showing symbol: @ES#. |
View |