 |
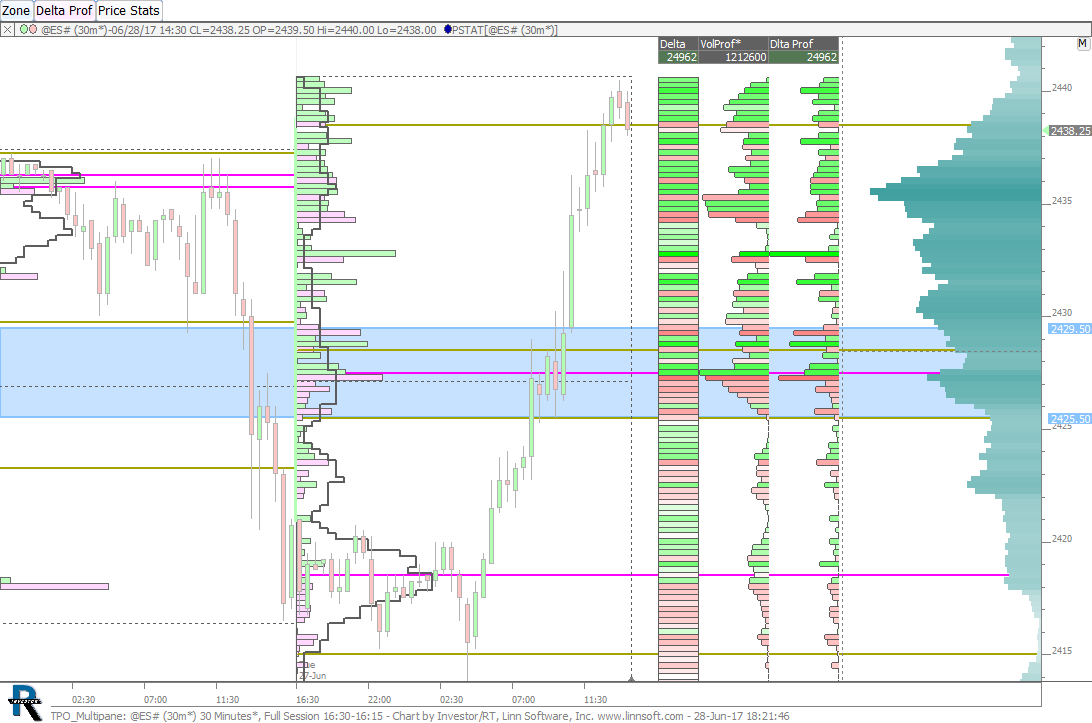
TPO MultiPane (@ES#) cpayne [totalcount]
9 years 1 month ago
TPO - MultiPane. This chart was uploaded by Investor/RT 12.7.2 showing symbol: @ES#. |
View |
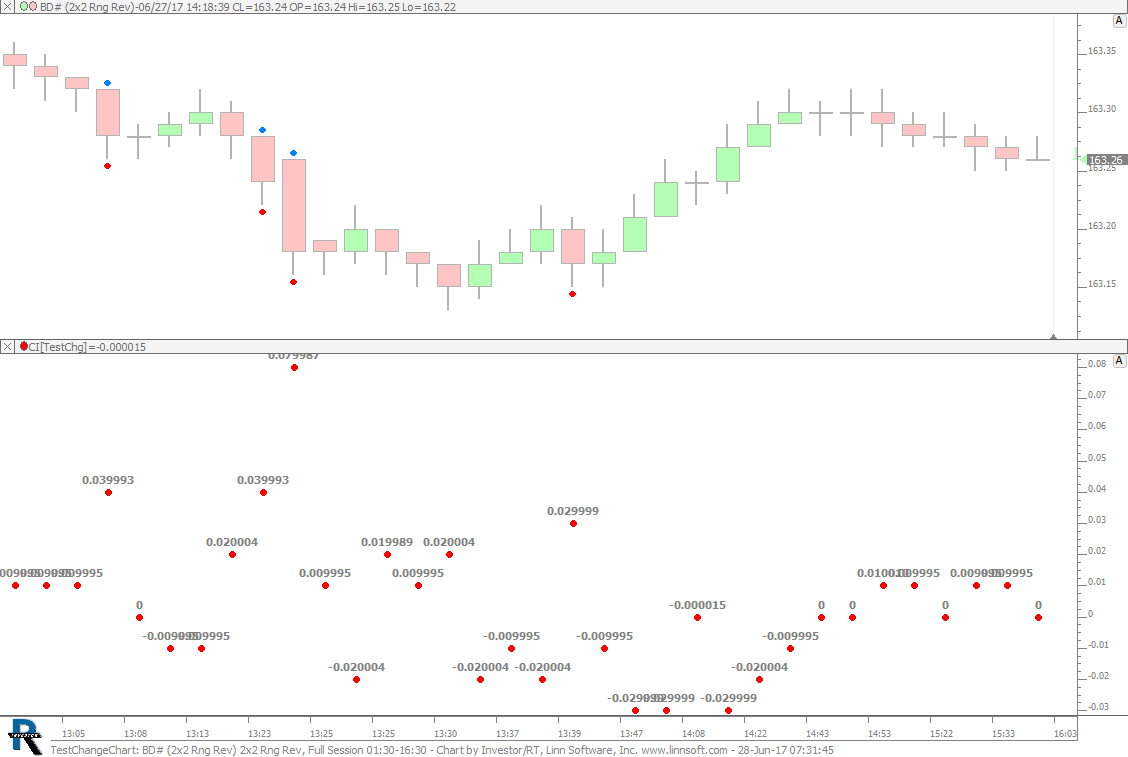 |
TestChangeChart (BD#) cpayne [totalcount]
9 years 1 month ago
This chart was uploaded by Investor/RT 12.7.7 showing symbol: BD#. |
View |
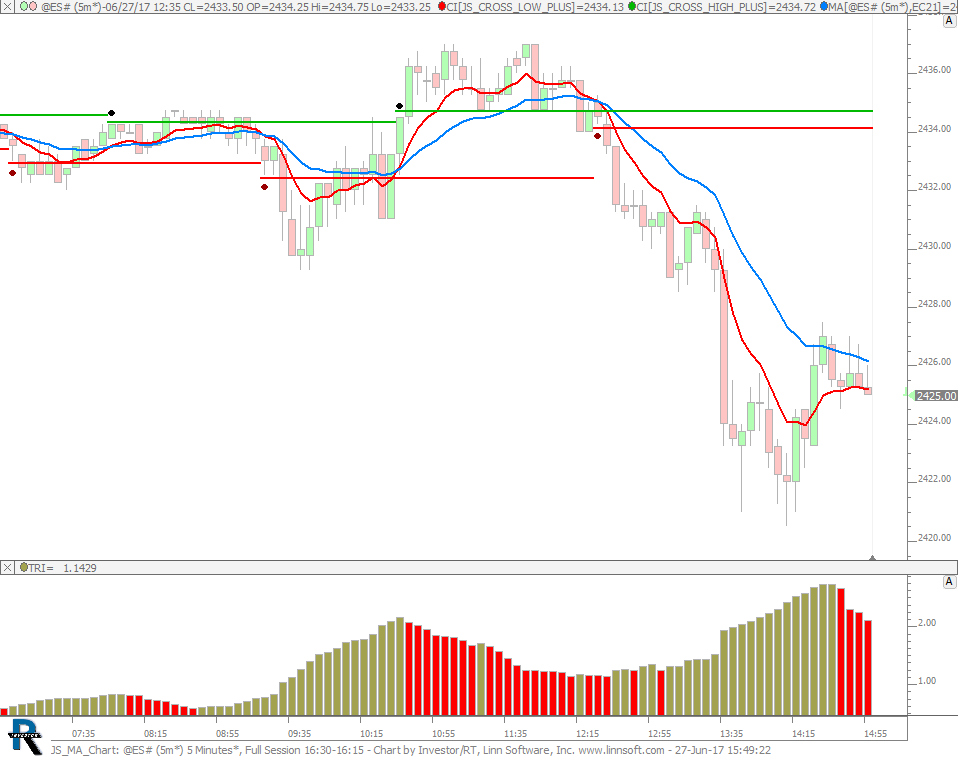 |
JS MA Chart (@ES#) cpayne [totalcount]
9 years 1 month ago
This chart was uploaded by Investor/RT 12.7.6 showing symbol: @ES#. |
View |
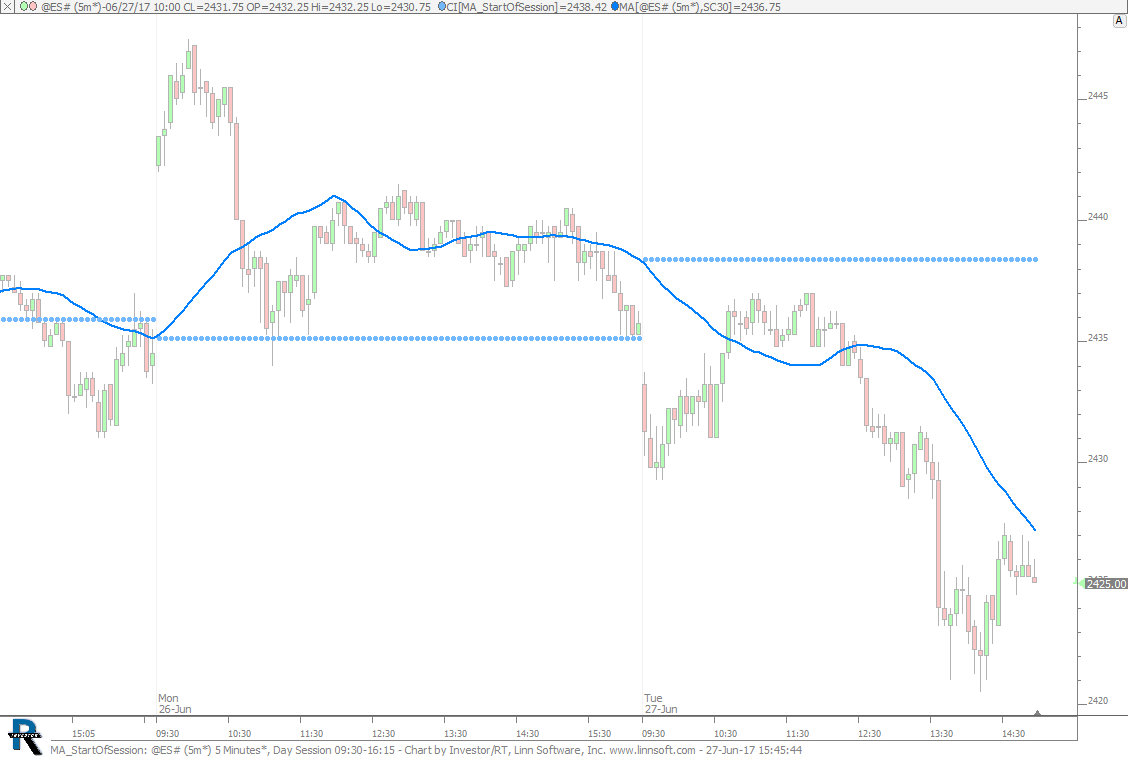 |
MA StartOfSession (@ES#) cpayne [totalcount]
9 years 1 month ago
Referencing Indicator Value at Start of Session. This chart was uploaded by Investor/RT 12.7.7 showing symbol: @ES#. |
View |
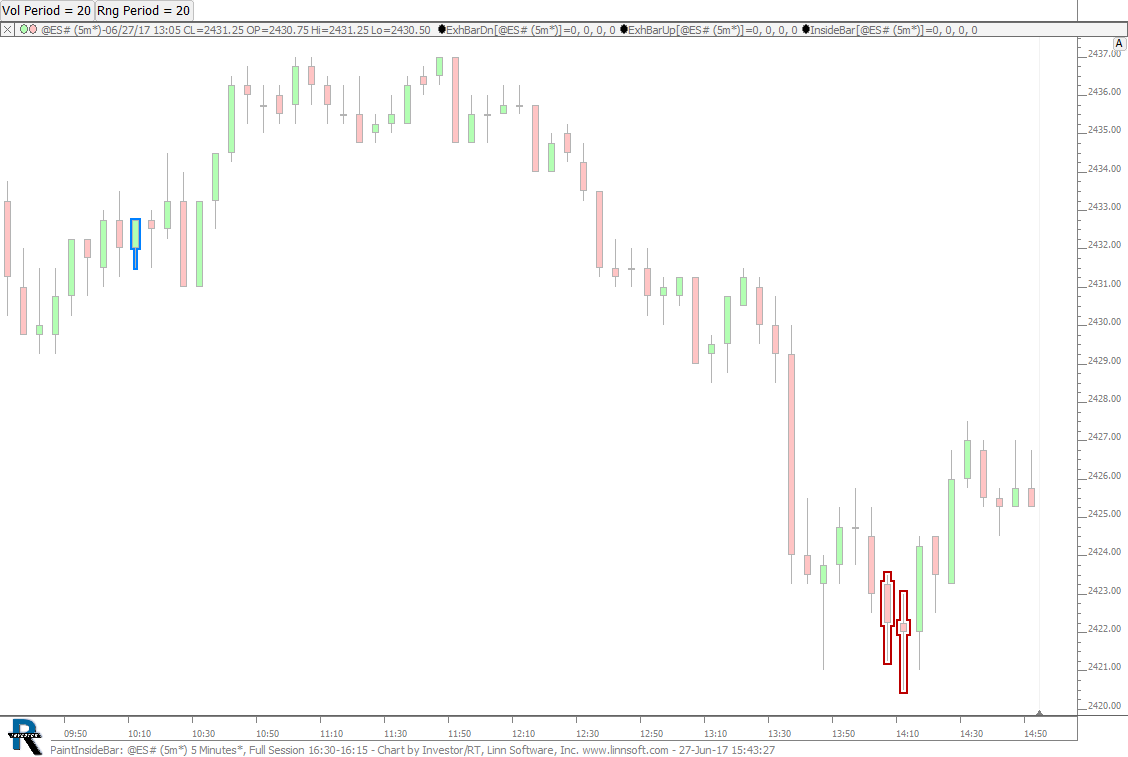 |
PaintInsideBar (@ES#) cpayne [totalcount]
9 years 1 month ago
Painted Candles - Inside Bar. This chart was uploaded by Investor/RT 12.7.7 showing symbol: @ES#. |
View |
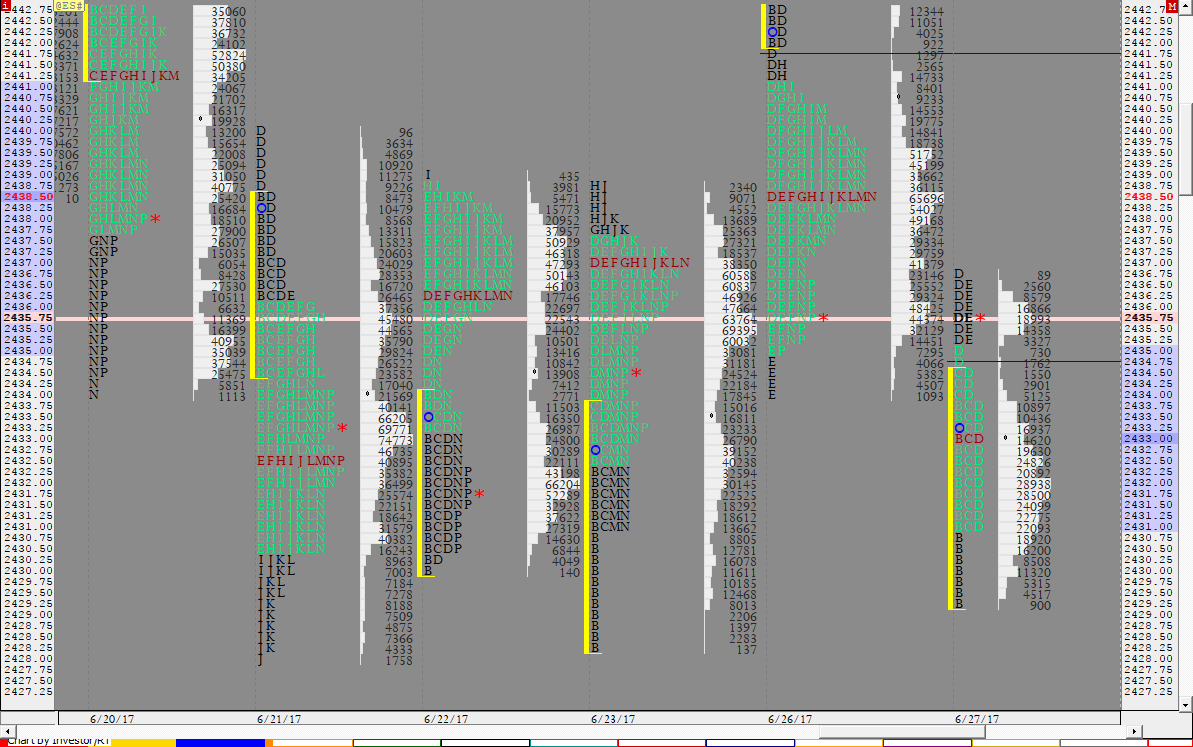 |
TPO CHART VOL TEXT (@ES#) cpayne [totalcount]
9 years 1 month ago
TPO Chart (Standalone). This chart was uploaded by Investor/RT 12.7.7 showing symbol: @ES#. |
View |
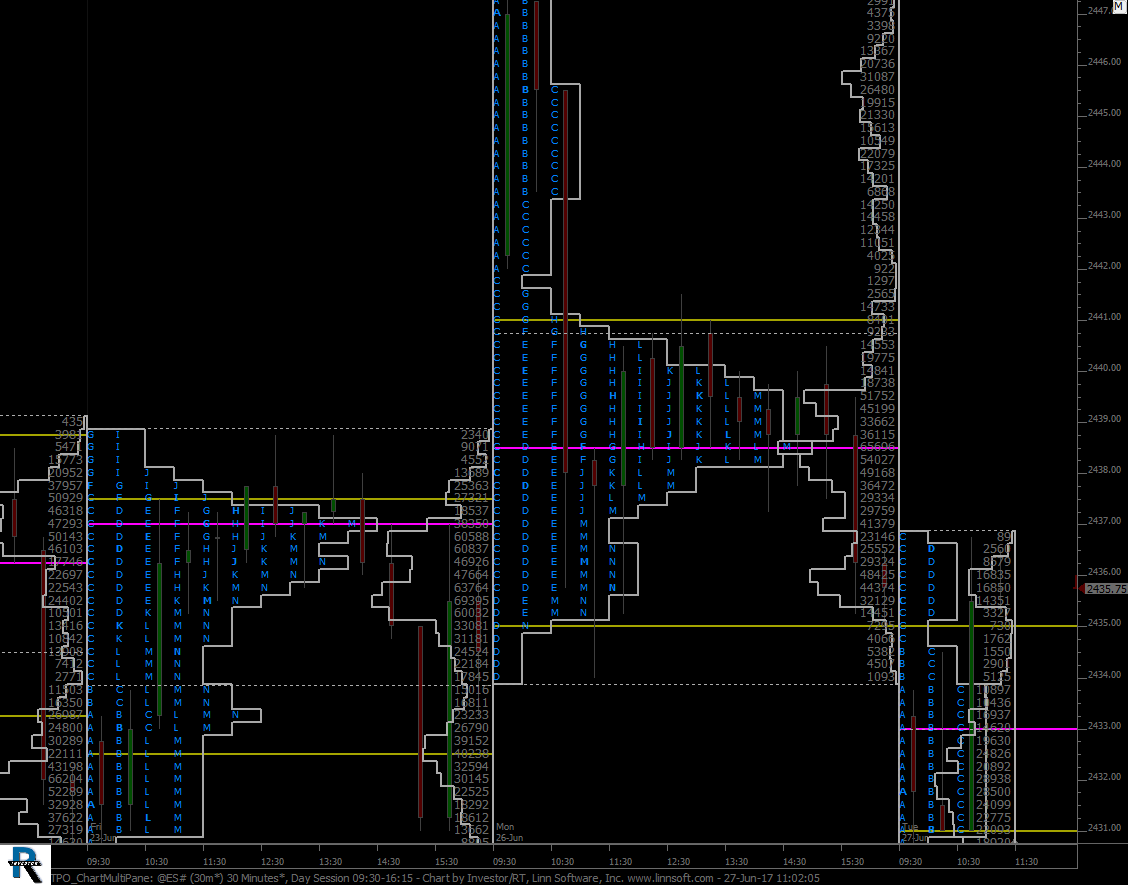 |
TPO ChartMultiPane (@ES#) cpayne [totalcount]
9 years 1 month ago
TPO Charts via Profile Indicator. This chart was uploaded by Investor/RT 12.7.7 showing symbol: @ES#. |
View |
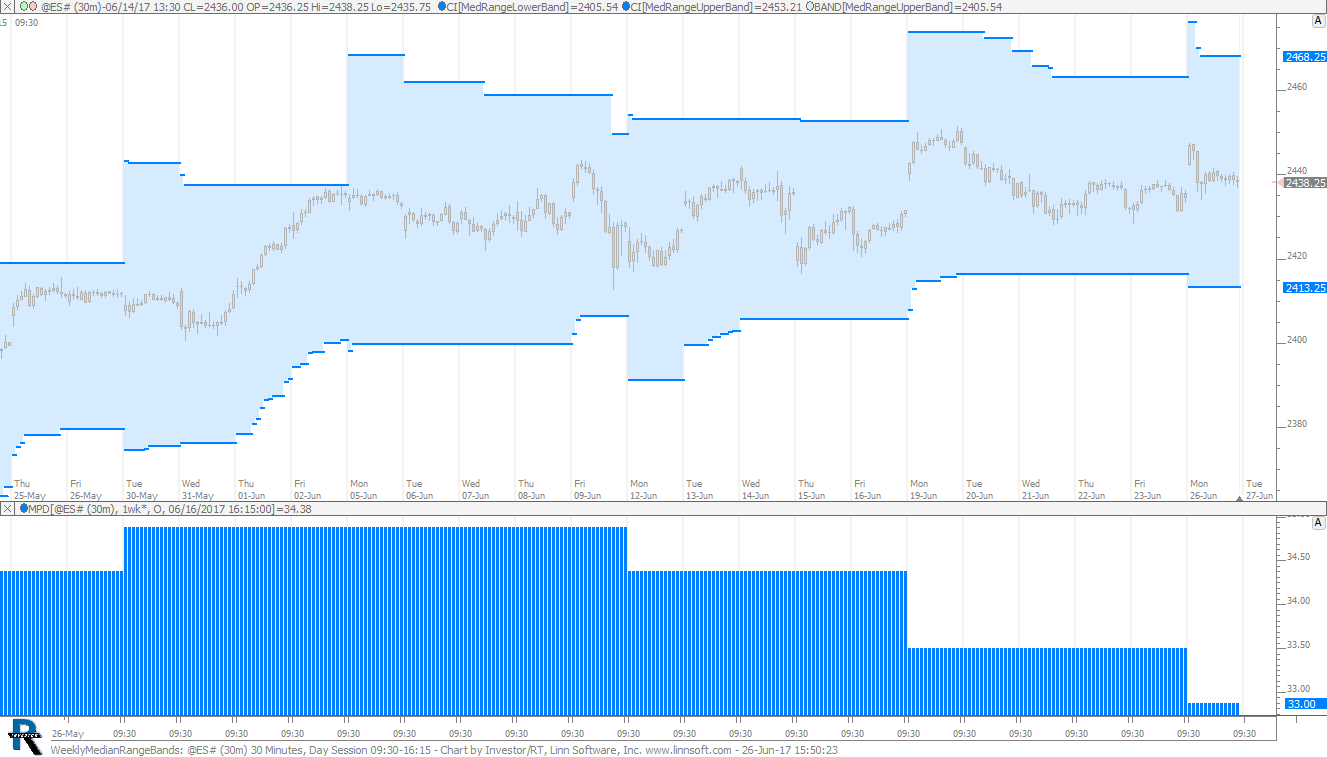 |
WeeklyMedianRangeBands (@ES#) cpayne [totalcount]
9 years 1 month ago
Weekly Median Range Bands. This chart was uploaded by Investor/RT 12.7.7 showing symbol: @ES#. |
View |
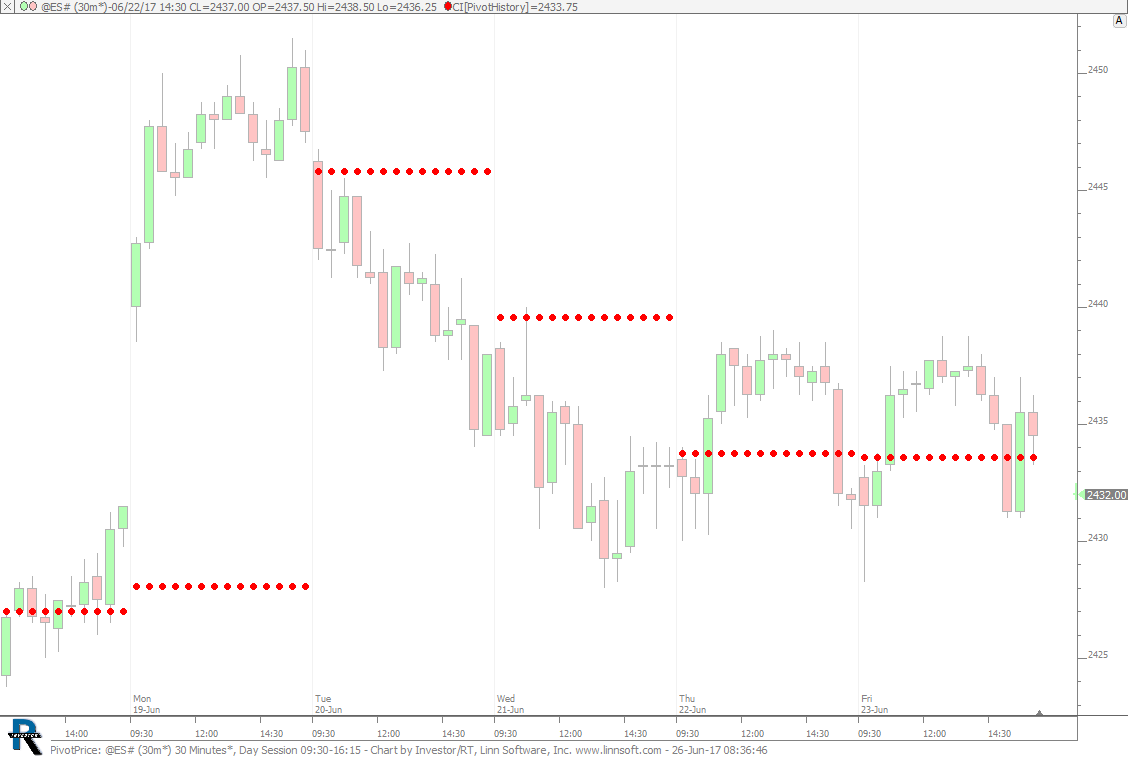 |
PivotPrice (@ES#) cpayne [totalcount]
9 years 1 month ago
Pivot Price. This chart was uploaded by Investor/RT 12.7.7 showing symbol: @ES#. |
View |
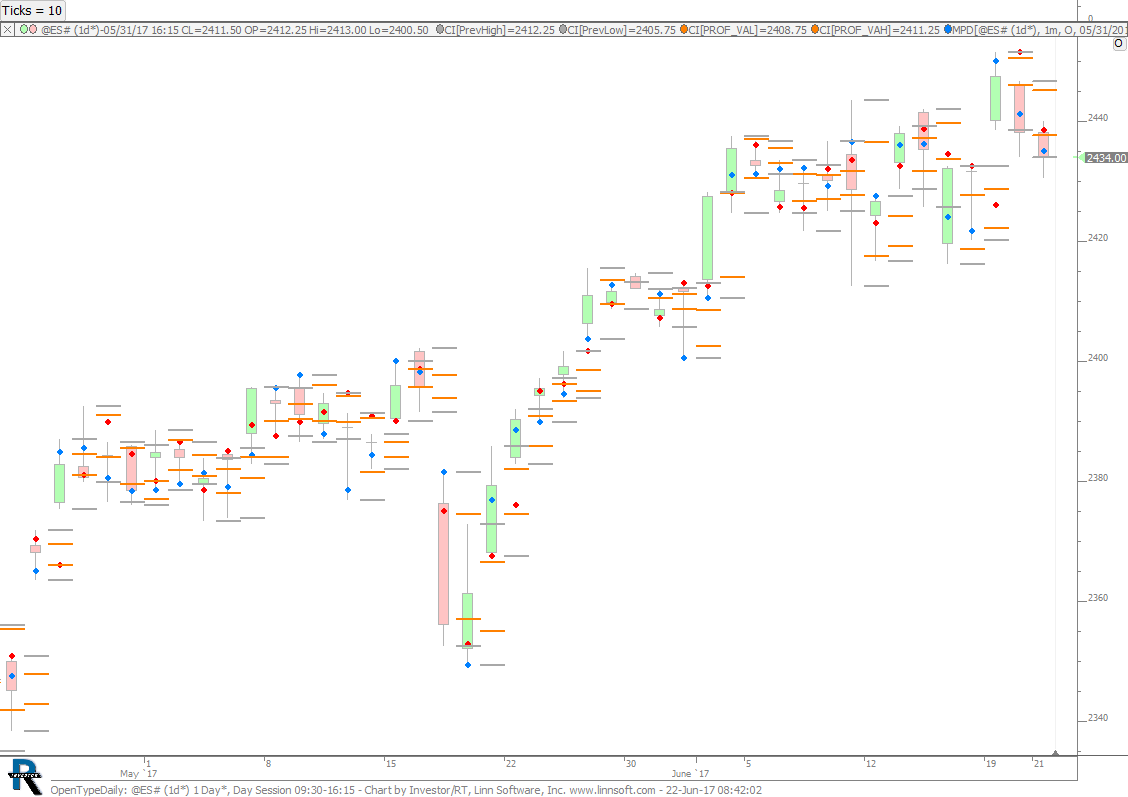 |
OpenTypeDaily (@ES#) cpayne [totalcount]
9 years 1 month ago
Open Types Daily. This chart was uploaded by Investor/RT 12.7.6 showing symbol: @ES#. |
View |
 |
OpenType (@ES#) cpayne [totalcount]
9 years 1 month ago
Open Type. This chart was uploaded by Investor/RT 12.7.6 showing symbol: @ES#. |
View |
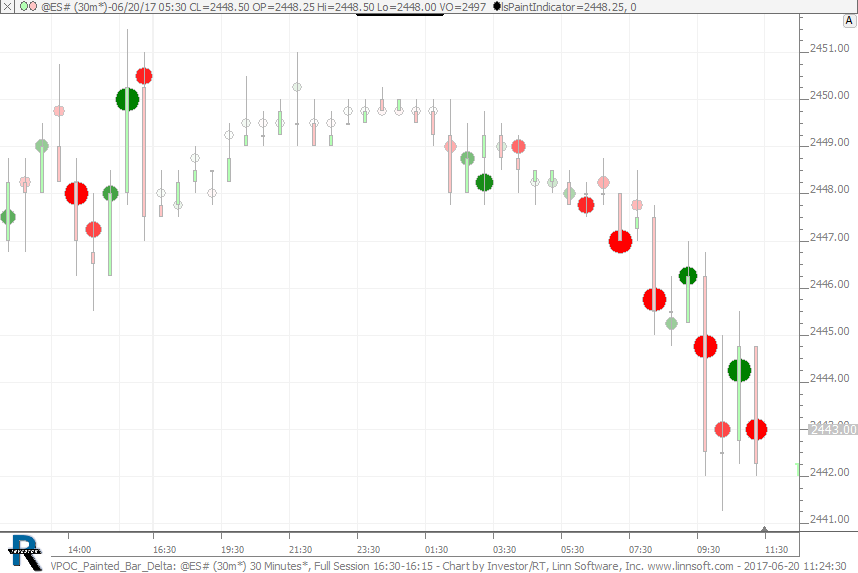 |
VPOC Painted Bar Delta (@ES#) cpayne [totalcount]
9 years 1 month ago
VPOC Painted with size and color relative to delta of bar. This chart was uploaded by Investor/RT 12.7.6 showing symbol: @ES#. |
View |
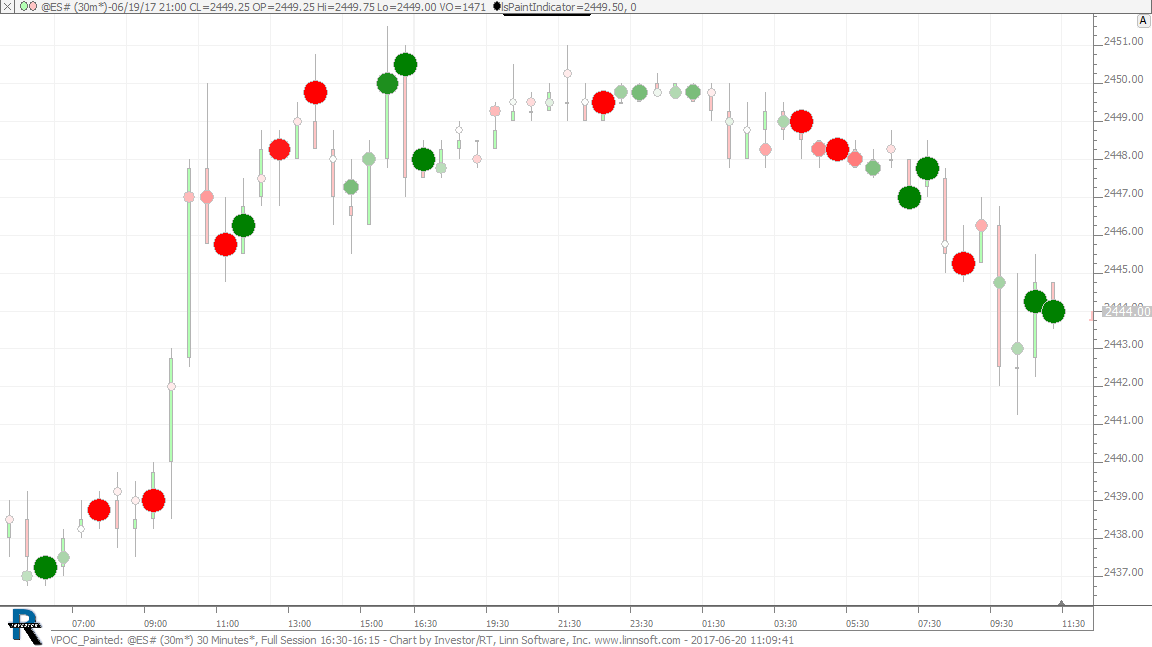 |
VPOC Painted (@ES#) cpayne [totalcount]
9 years 1 month ago
VPOC Painted with size and color relative to Delta of VPOC. This chart was uploaded by Investor/RT 12.7.6 showing symbol: @ES#. |
View |
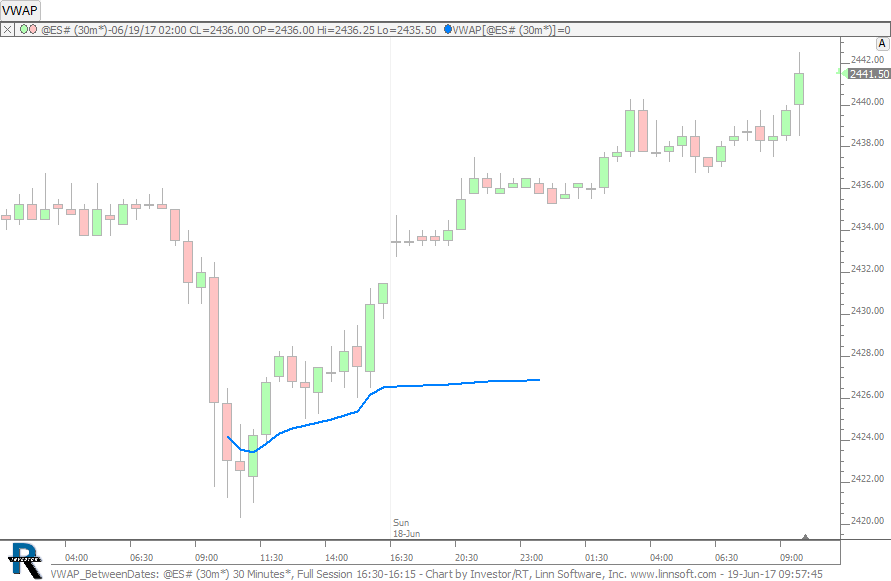 |
VWAP BetweenDates (@ES#) cpayne [totalcount]
9 years 1 month ago
VWAP Between Date/Times. This chart was uploaded by Investor/RT 12.7.6 showing symbol: @ES#. |
View |
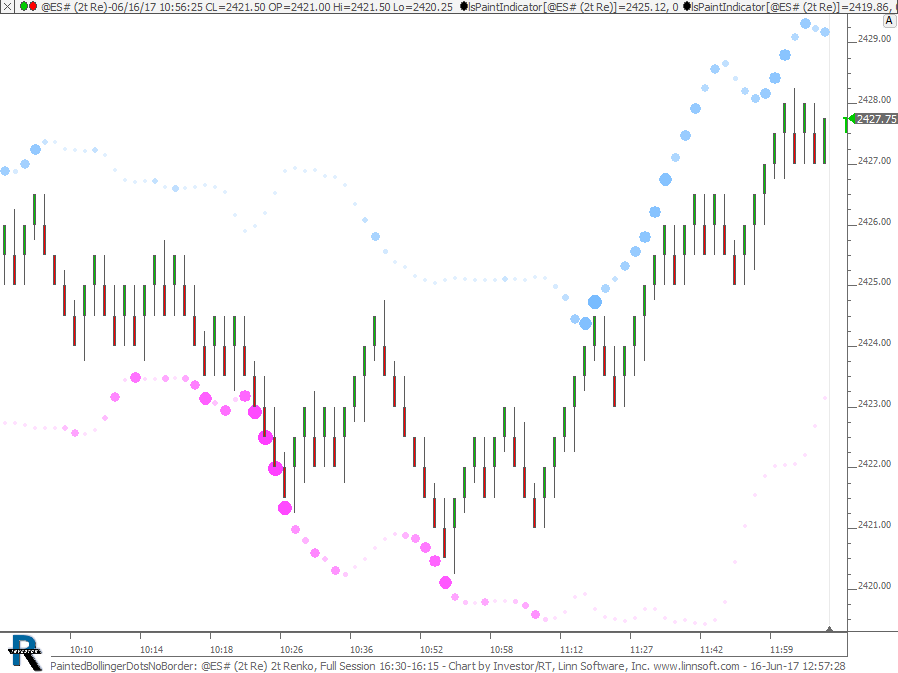 |
PaintedBollingerDotsNoBorder (@ES#) cpayne [totalcount]
9 years 1 month ago
Painted Bollinger Dots - No Borders. This chart was uploaded by Investor/RT 12.7.6 showing symbol: @ES#. |
View |
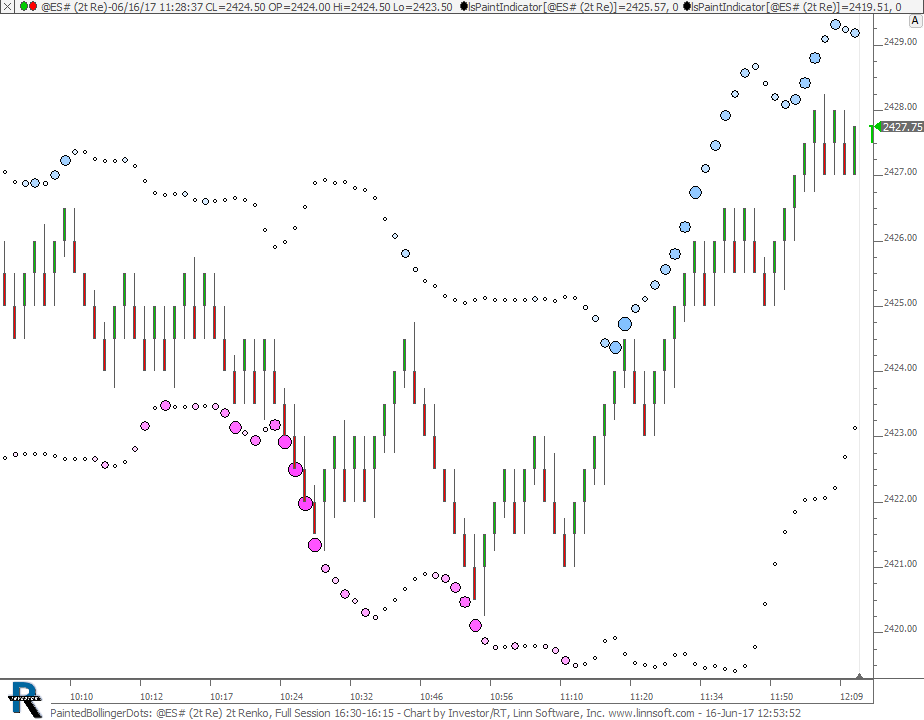 |
PaintedBollingerDots (@ES#) cpayne [totalcount]
9 years 1 month ago
Painted Bollinger Dots. This chart was uploaded by Investor/RT 12.7.6 showing symbol: @ES#. |
View |
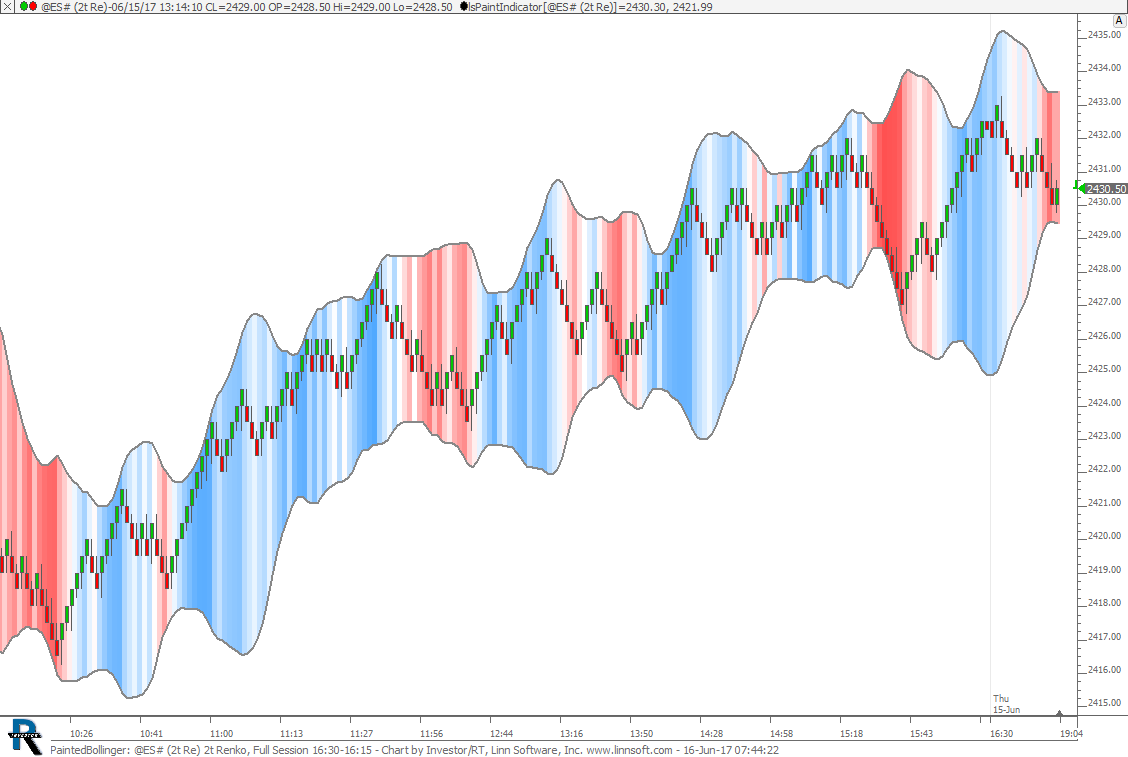 |
PaintedBollinger (@ES#) cpayne [totalcount]
9 years 1 month ago
Painted Bollinger. This chart was uploaded by Investor/RT 12.7.6 showing symbol: @ES#. |
View |
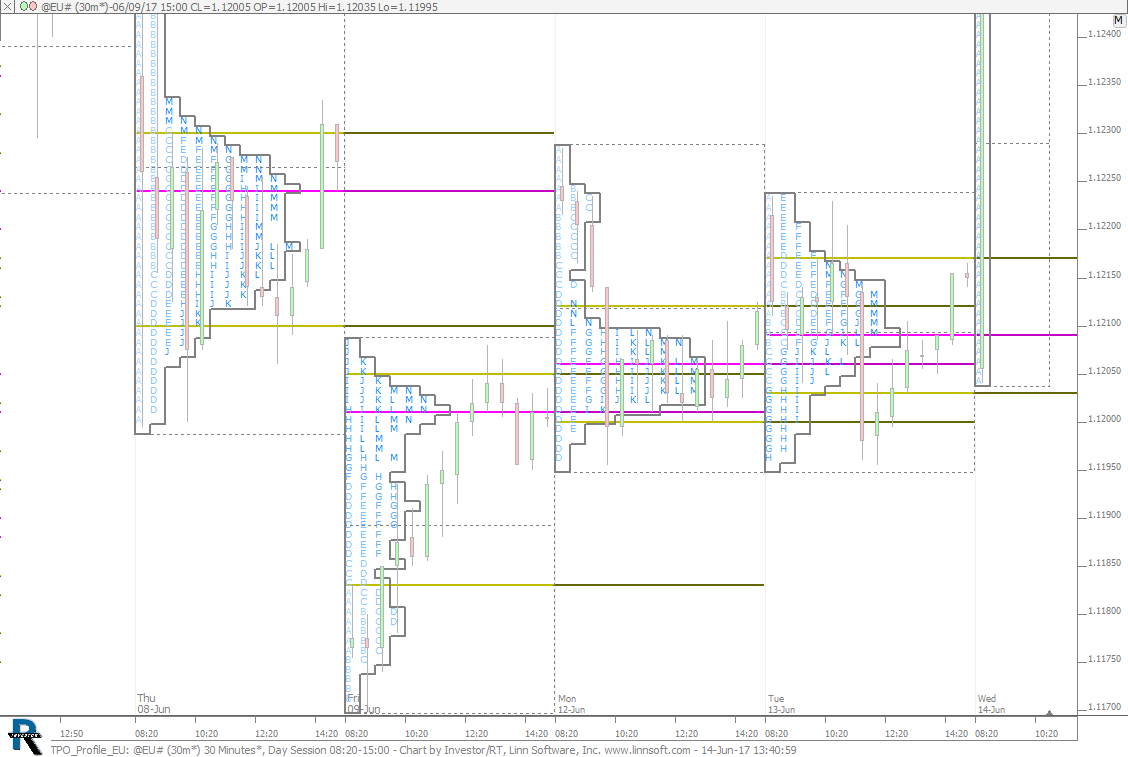 |
TPO Profile EU (@EU#) cpayne [totalcount]
9 years 1 month ago
TPO Profile EU. This chart was uploaded by Investor/RT 12.7.6 showing symbol: @EU#. |
View |
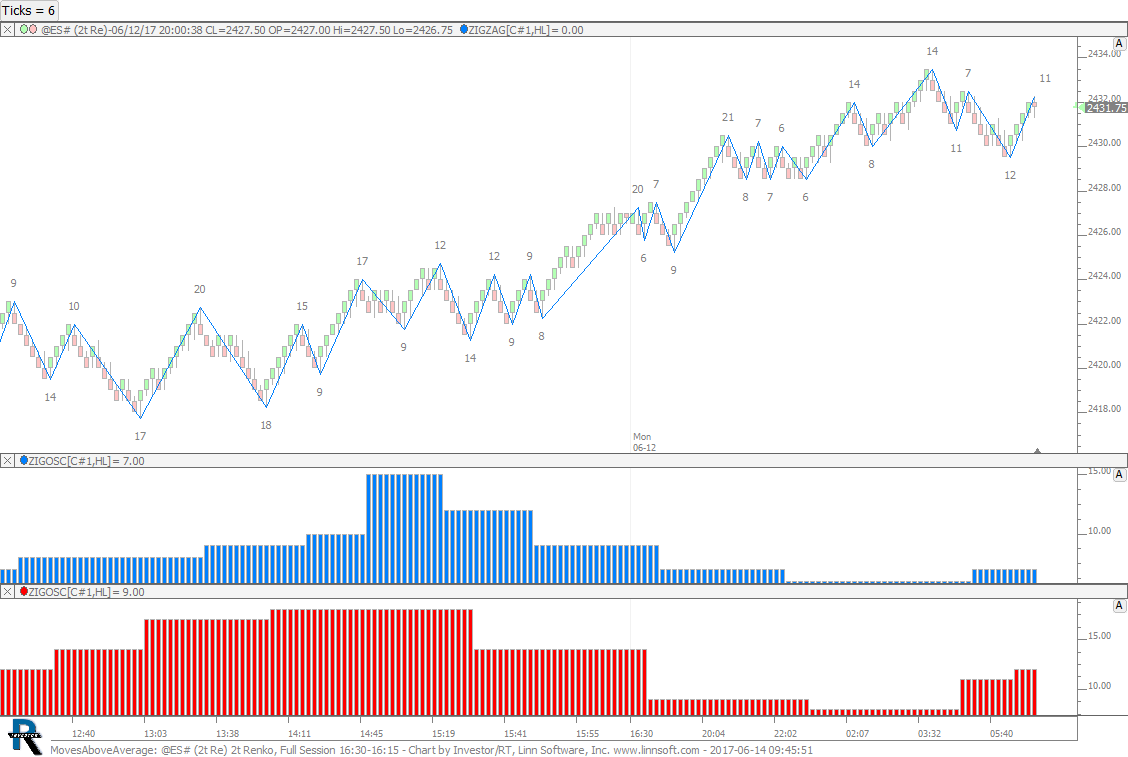 |
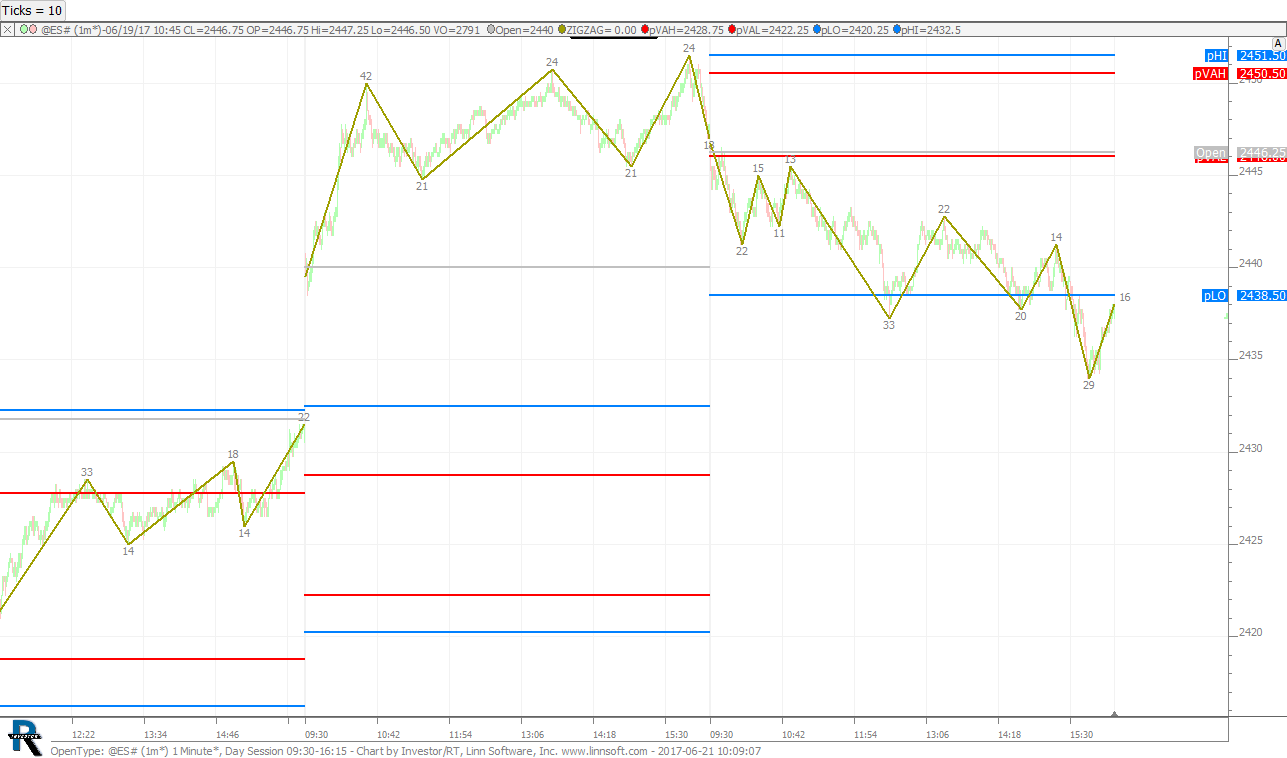
MovesAboveAverage (@ES#) cpayne [totalcount]
9 years 1 month ago
Zig Zag Moves Above/Below Average. This chart was uploaded by Investor/RT 12.7.5 showing symbol: @ES#. |
View |
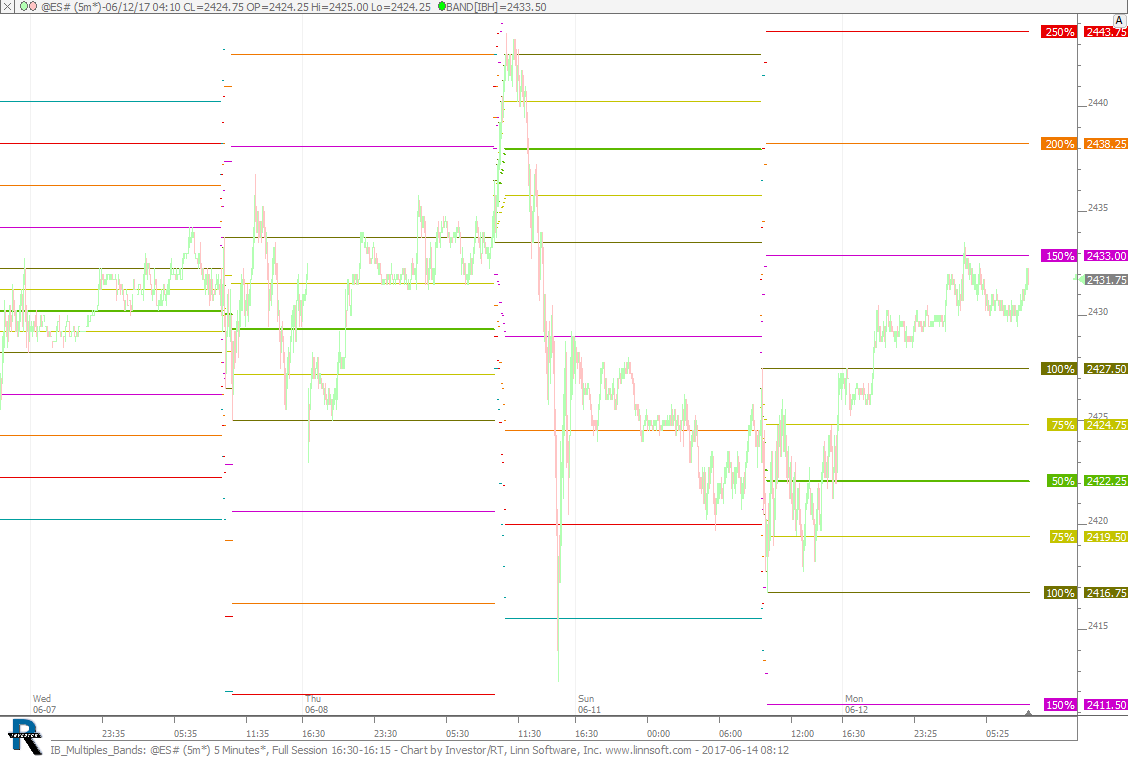 |
IB Multiples Bands (@ES#) cpayne [totalcount]
9 years 1 month ago
Initial Balance Multiples Using Bands Indicator. This chart was uploaded by Investor/RT 12.7.4 showing symbol: @ES#. |
View |
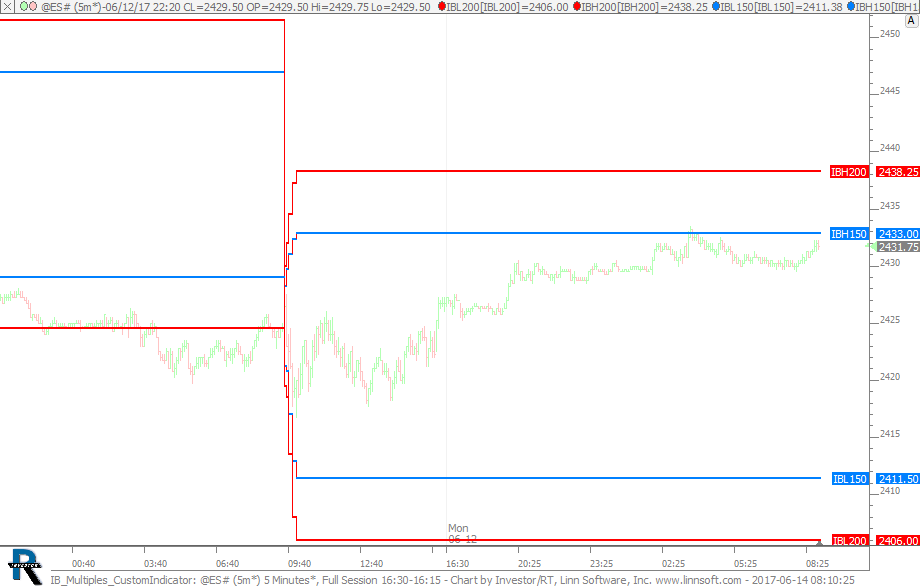 |
IB Multiples CustomIndicator (@ES#) cpayne [totalcount]
9 years 1 month ago
Initial Balance Multiples Using Custom Indicators. This chart was uploaded by Investor/RT 12.7.4 showing symbol: @ES#. |
View |
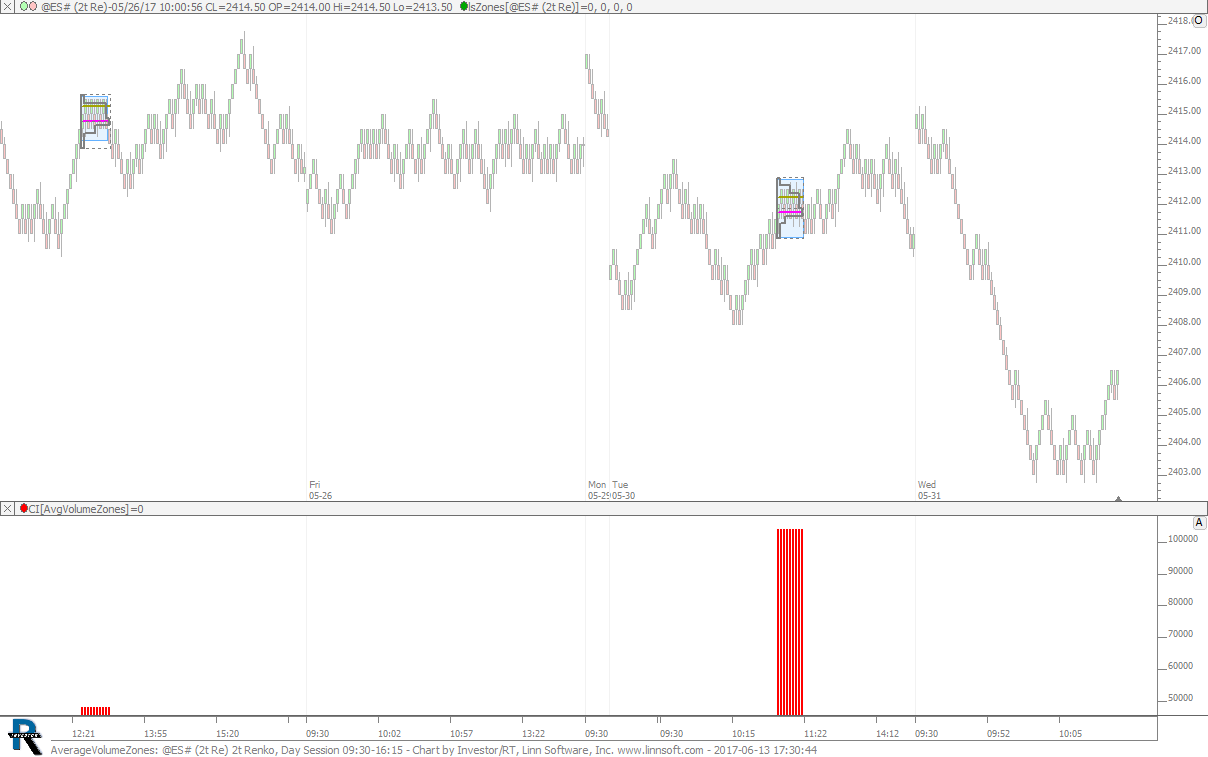 |
AverageVolumeZones (@ES#) cpayne [totalcount]
9 years 1 month ago
Average Volume Zones. This chart was uploaded by Investor/RT 12.7.5 showing symbol: @ES#. |
View |
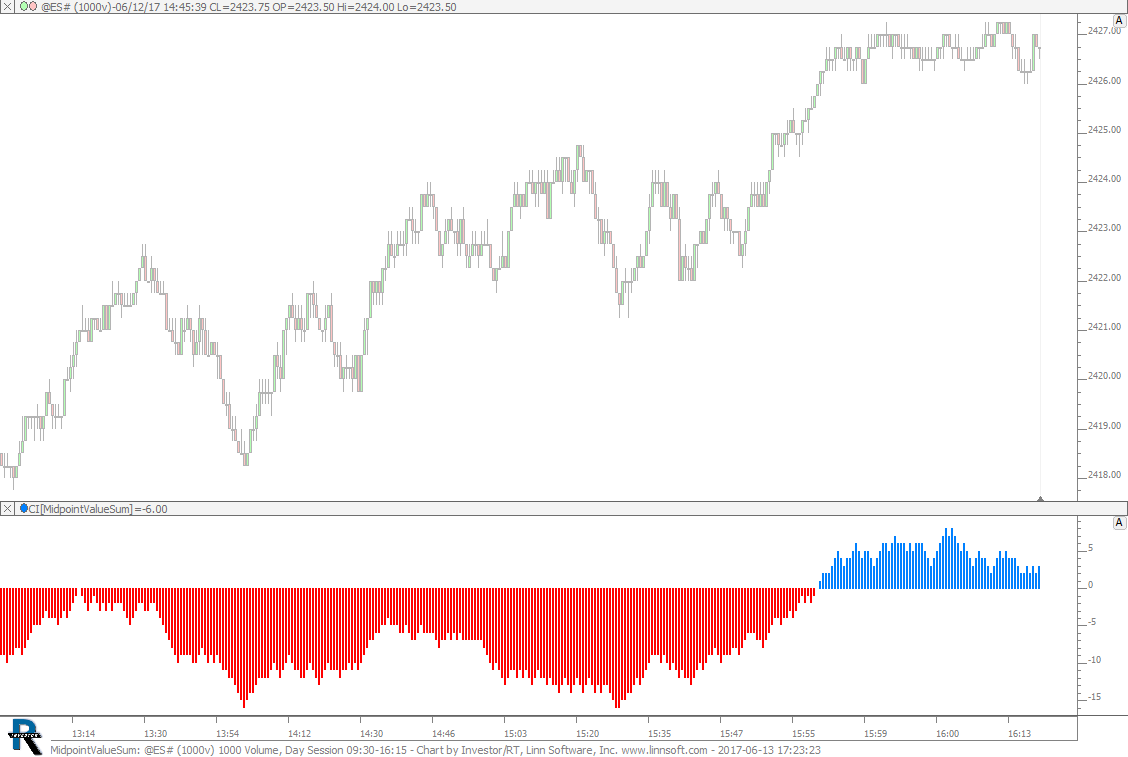 |
MidpointValueSum (@ES#) cpayne [totalcount]
9 years 1 month ago
Midpoint Value Summation. This chart was uploaded by Investor/RT 12.7.5 showing symbol: @ES#. |
View |
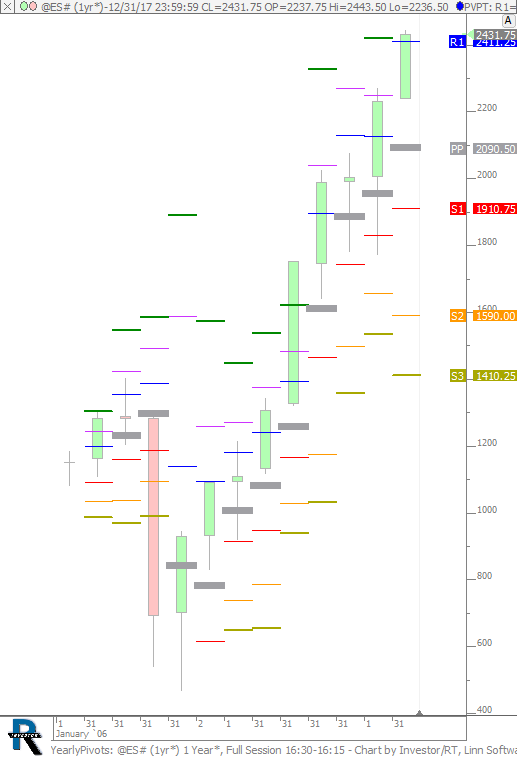 |
YearlyPivots (@ES#) cpayne [totalcount]
9 years 1 month ago
Yearly Pivots. This chart was uploaded by Investor/RT 12.7.5 showing symbol: @ES#. |
View |
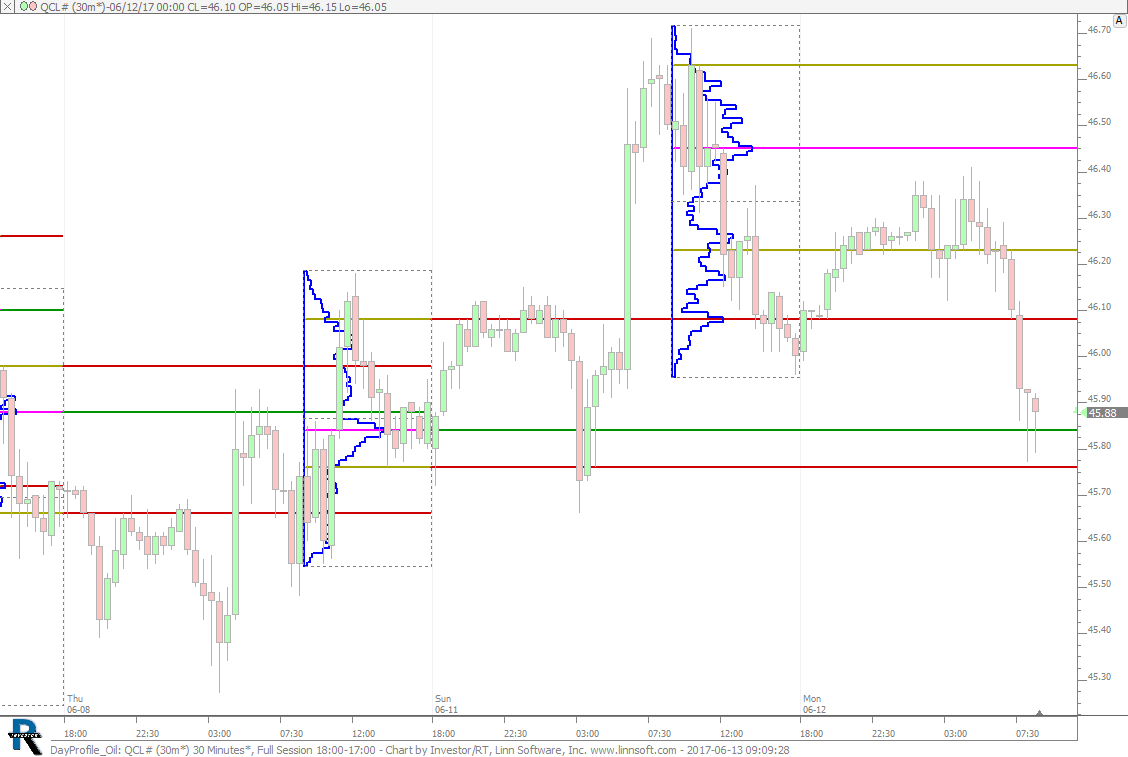 |
DayProfile Oil (QCL#) cpayne [totalcount]
9 years 1 month ago
Day Session Profiles - Oil. This chart was uploaded by Investor/RT 12.7.5 showing symbol: QCL#. |
View |