 |
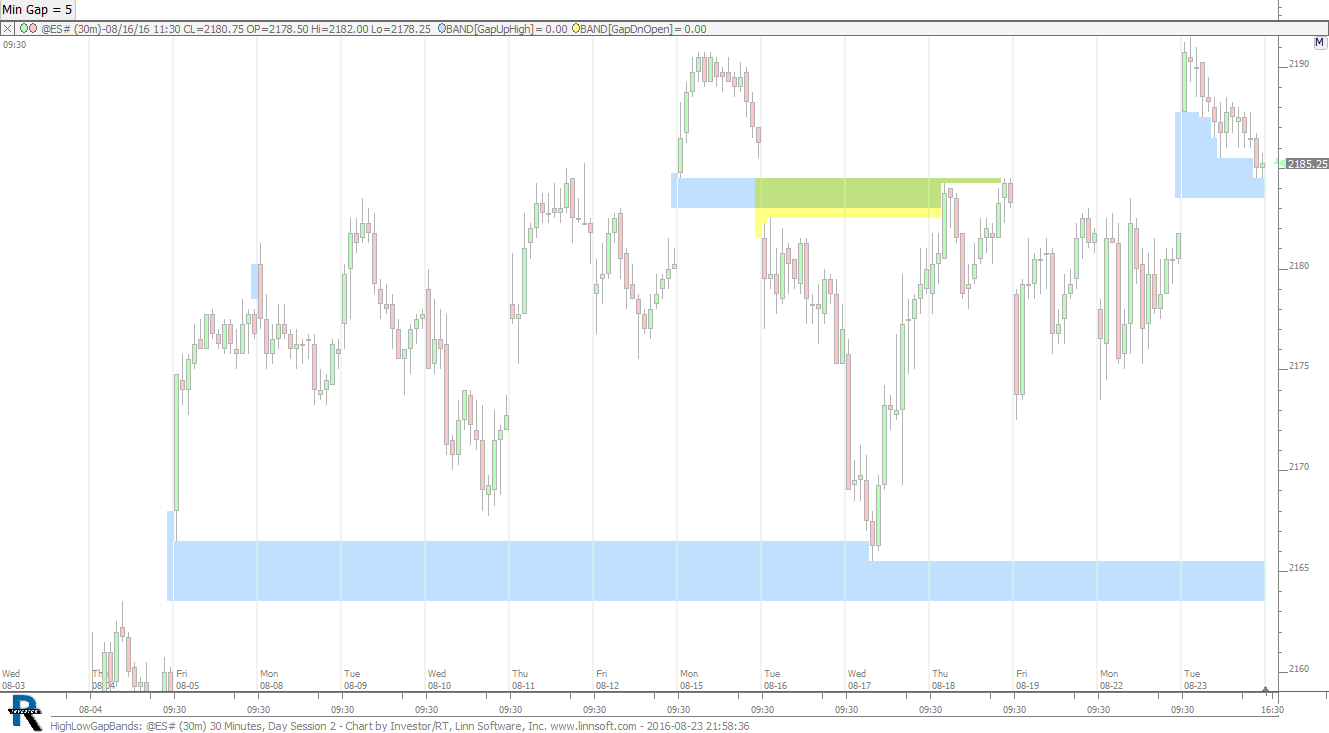
HighLowGapBands (@ES#) cpayne [totalcount]
9 years 11 months ago
Naked Gap Bands with Minimum Size in Ticks (Prev High to Low, Prev Low to High). This chart was uploaded by Investor/RT 12.6.1 showing symbol: @ES#. |
View |
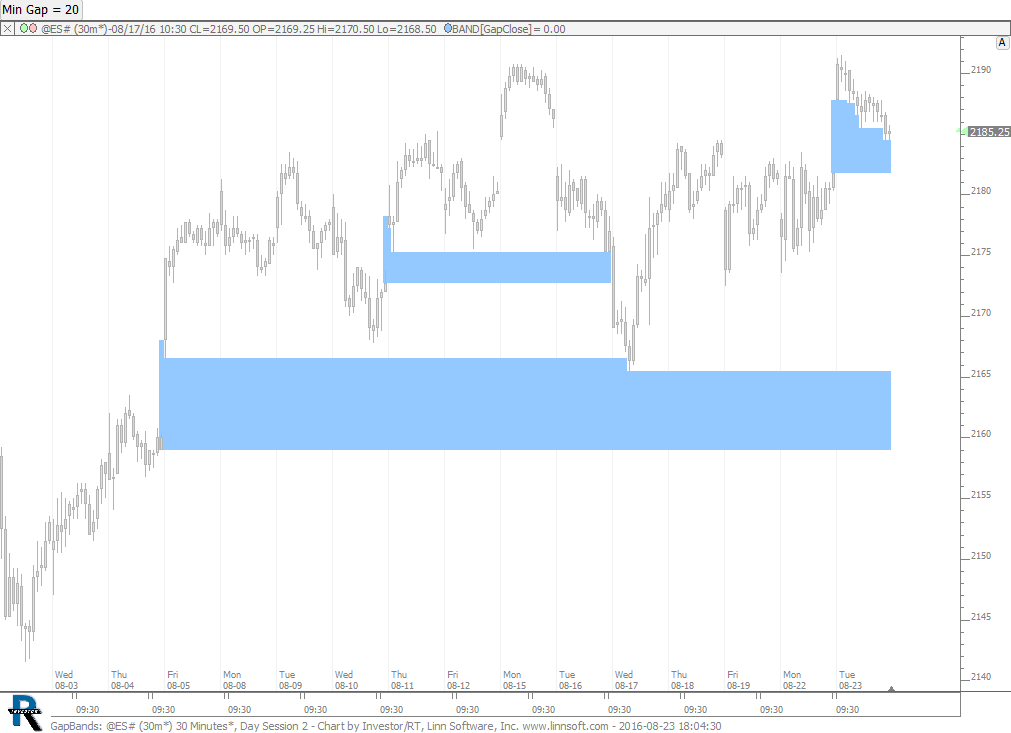 |
GapBands (@ES#) cpayne [totalcount]
9 years 11 months ago
Naked Gap Bands with Minimum Size in Ticks. This chart was uploaded by Investor/RT 12.6.1 showing symbol: @ES#. |
View |
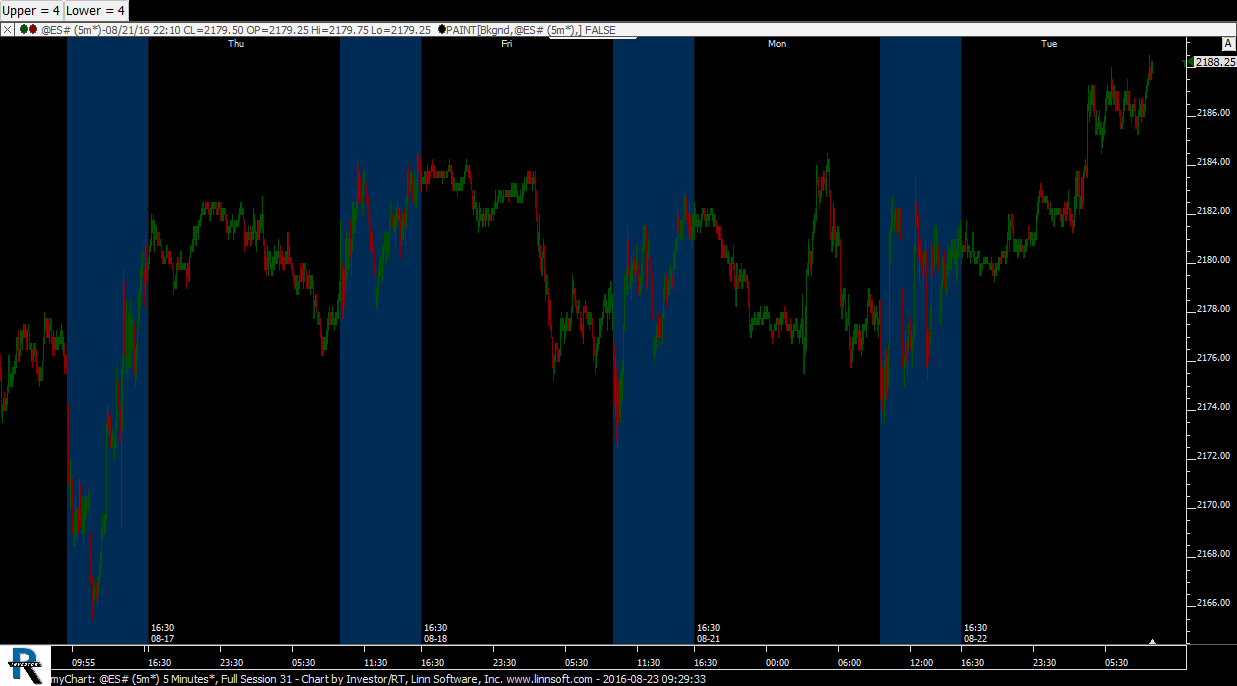 |
myChart (@ES#) cpayne [totalcount]
9 years 11 months ago
Painted Day Session. This chart was uploaded by Investor/RT 12.6.1 showing symbol: @ES#. |
View |
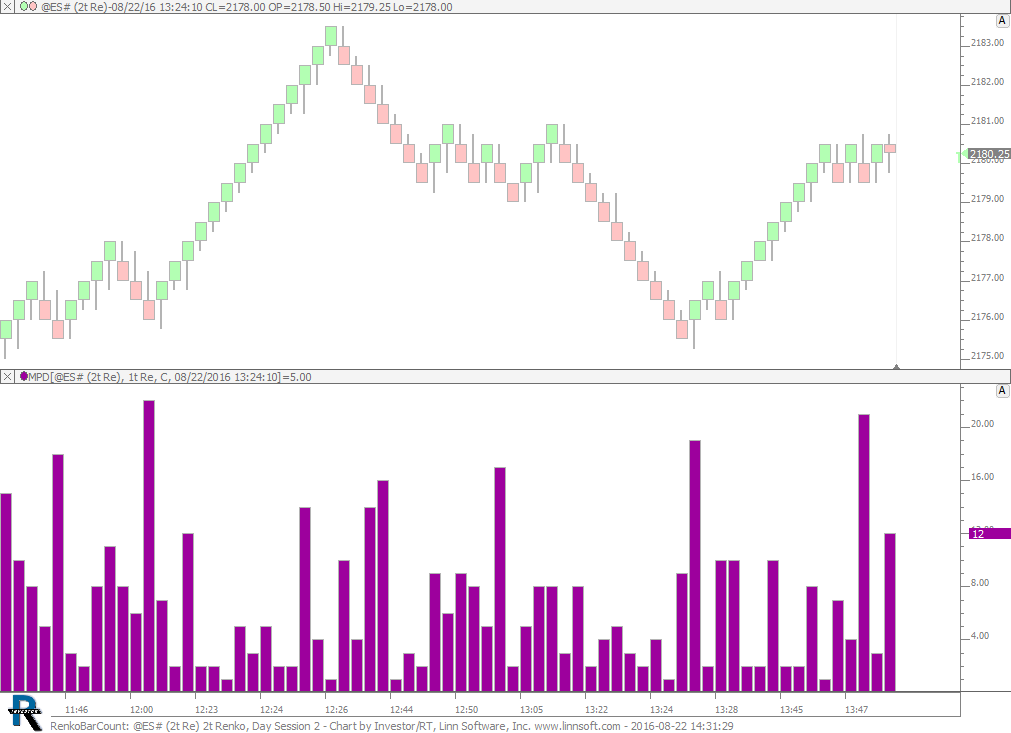 |
RenkoBarCount (@ES#) cpayne [totalcount]
9 years 11 months ago
Renko Bar Counts. This chart was uploaded by Investor/RT 12.6.1 showing symbol: @ES#. |
View |
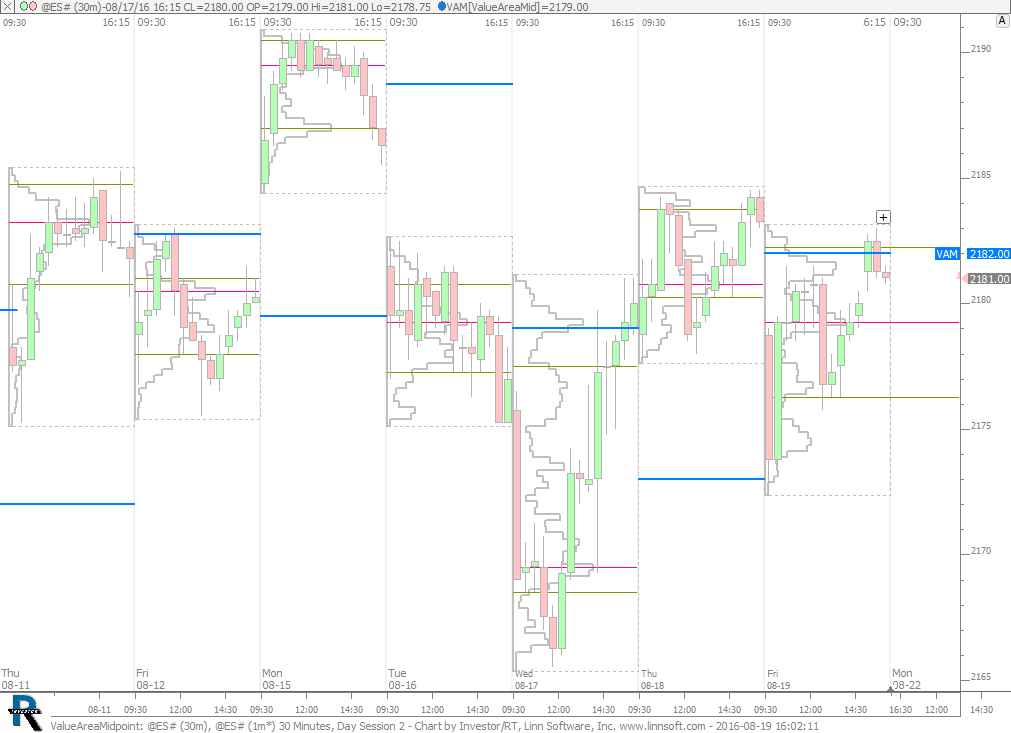 |
ValueAreaMidpoint (@ES#) cpayne [totalcount]
9 years 11 months ago
Midpoint of Previous Day Value Area. This chart was uploaded by Investor/RT 12.6.1 showing symbol: @ES#. |
View |
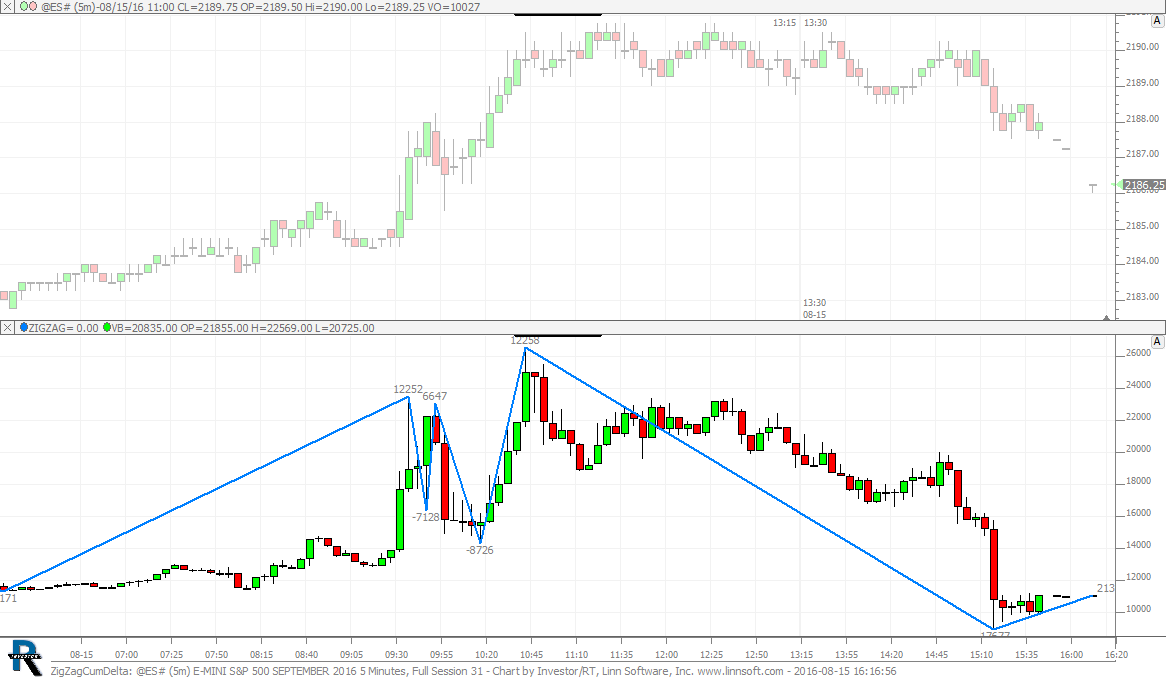 |
ZigZagCumDelta (@ES#) cpayne [totalcount]
9 years 11 months ago
Zig Zag of Cumulative Delta. This chart was uploaded by Investor/RT 12.6.1 showing symbol: @ES#. |
View |
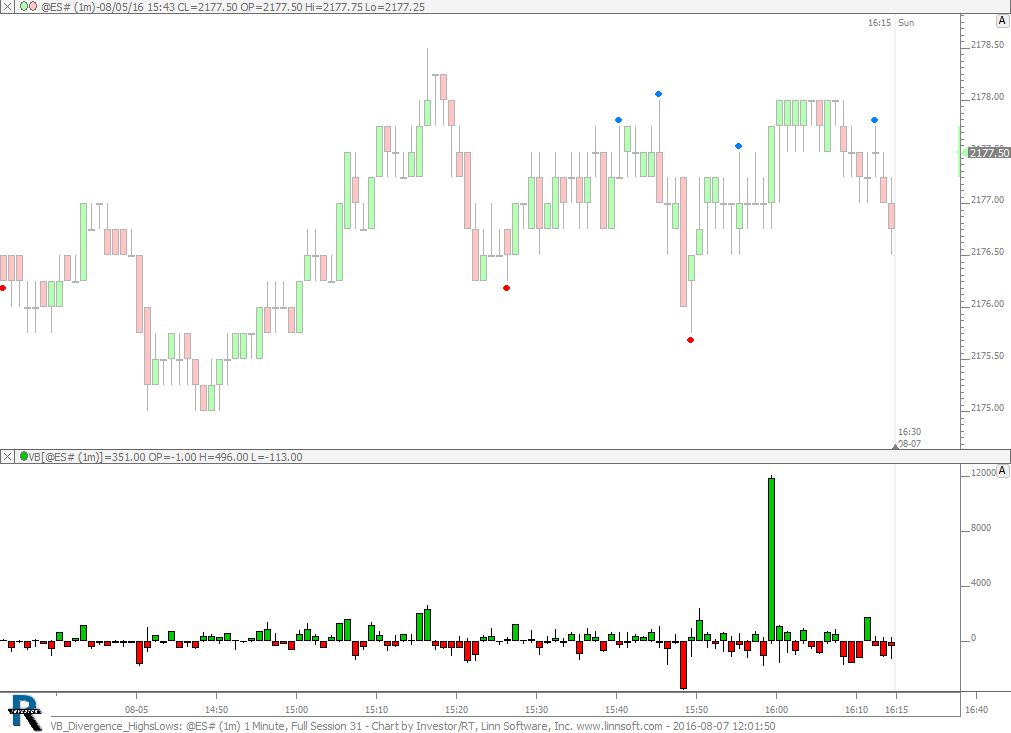 |
VB Divergence HighsLows (@ES#) cpayne [totalcount]
9 years 11 months ago
High High on Negative Delta (Blue) and Lower Low with Positive Delta (Red). This chart was uploaded by Investor/RT 12.6.1 showing symbol: @ES#. |
View |
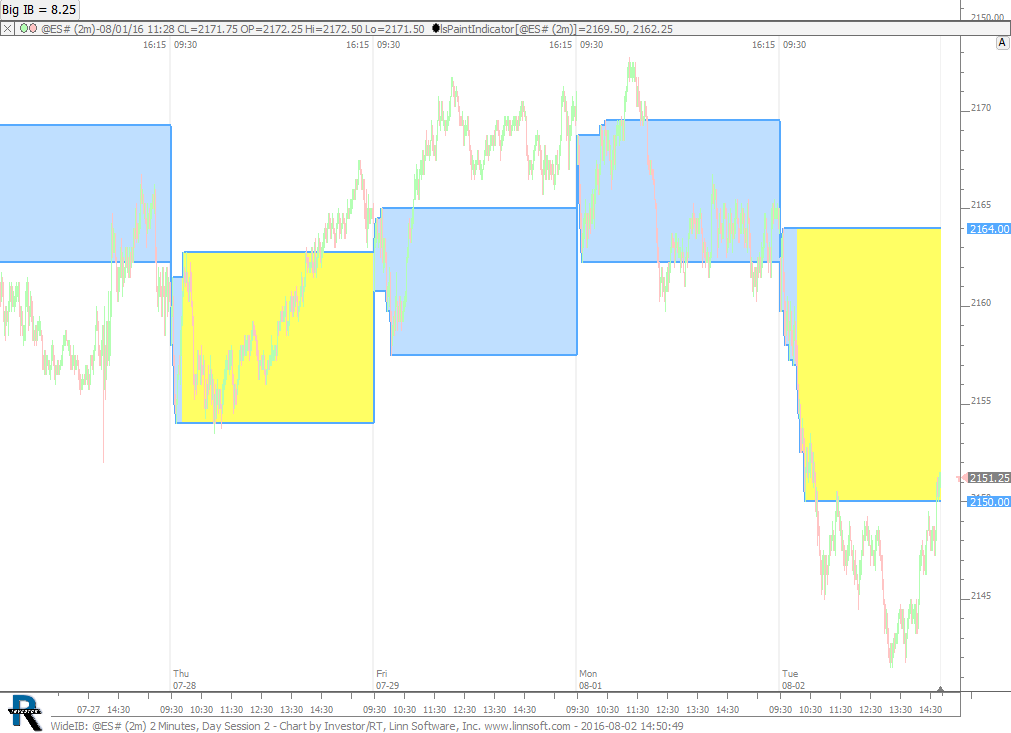 |
WideIB (@ES#) cpayne [totalcount]
9 years 12 months ago
IB Bands painted when wide. This chart was uploaded by Investor/RT 12.6.1 showing symbol: @ES#. |
View |
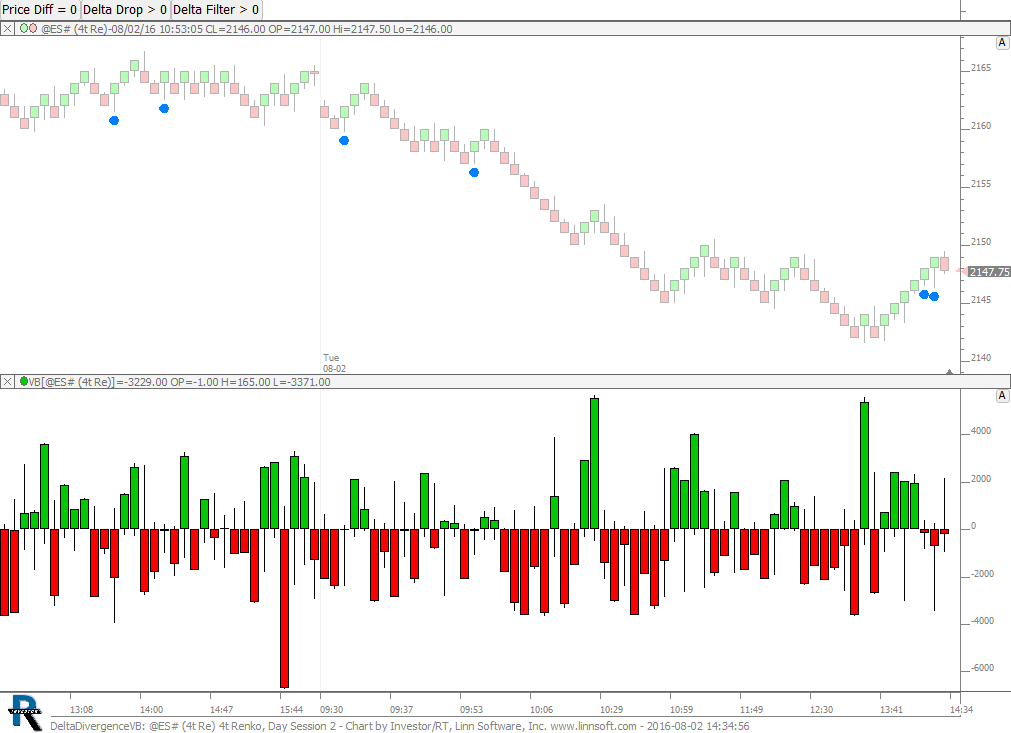 |
DeltaDivergenceVB (@ES#) cpayne [totalcount]
9 years 12 months ago
Delta Divergence - Price vs Delta Bars. This chart was uploaded by Investor/RT 12.6.1 showing symbol: @ES#. |
View |
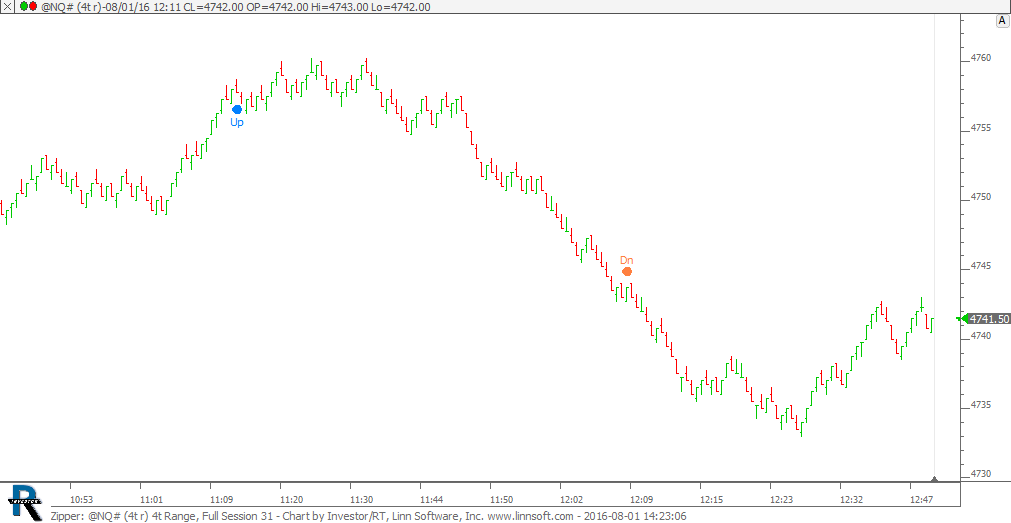 |
Zipper (@NQ#) cpayne [totalcount]
9 years 12 months ago
Zipper. This chart was uploaded by Investor/RT 12.6.1 showing symbol: @NQ#. |
View |
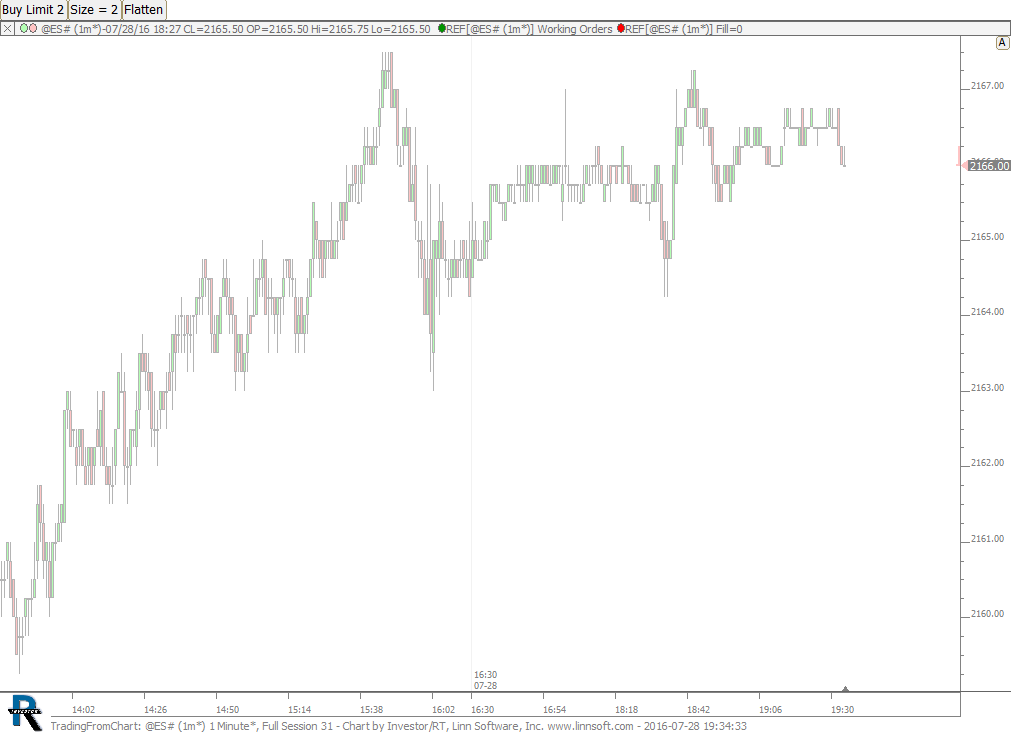 |
TradingFromChart (@ES#) cpayne [totalcount]
10 years 4 hours ago
Trading from Charts with Button Indicator. This chart was uploaded by Investor/RT 12.6.1 showing symbol: @ES#. |
View |
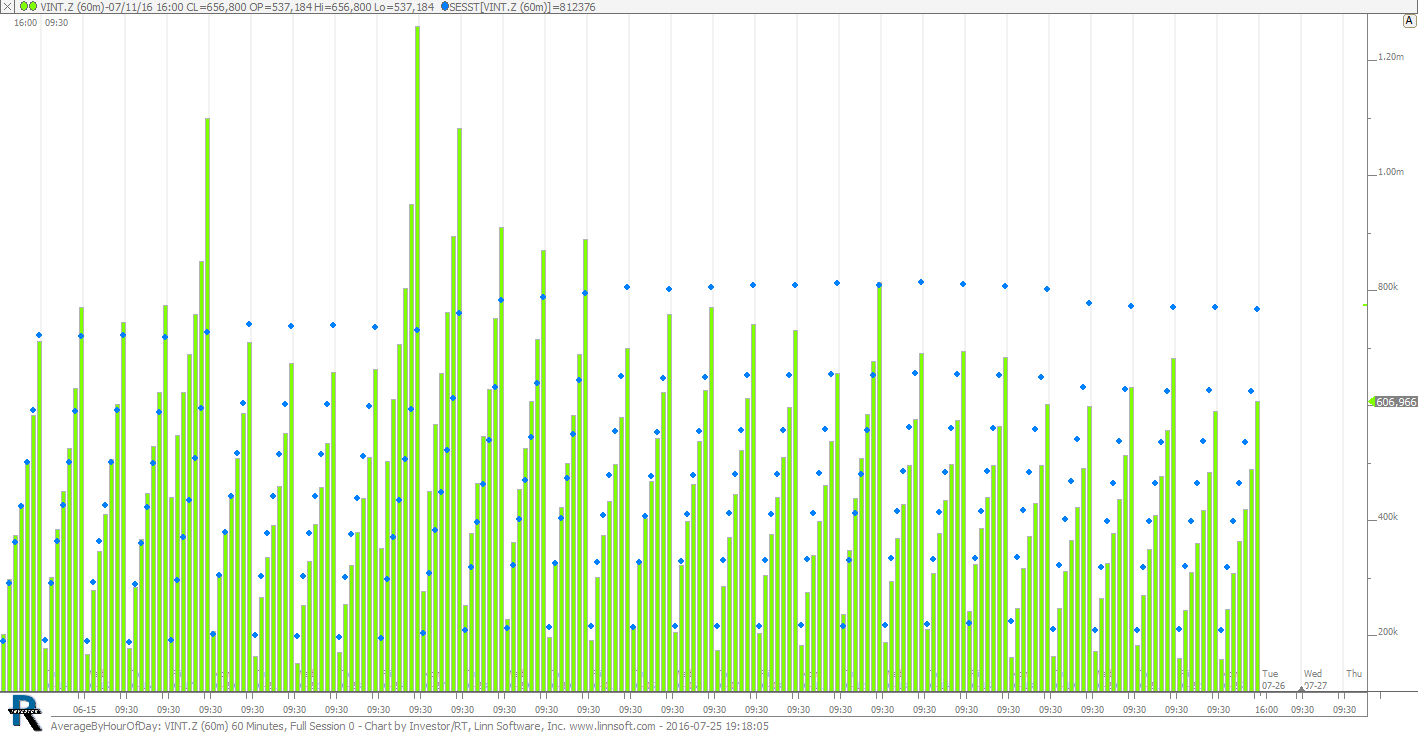 |
AverageByHourOfDay (VINT.Z) 2 cpayne [totalcount]
10 years 3 days ago
Average by Time of Day VINT.Z. This chart was uploaded by Investor/RT 12.6.1 showing symbol: VINT.Z. |
View |
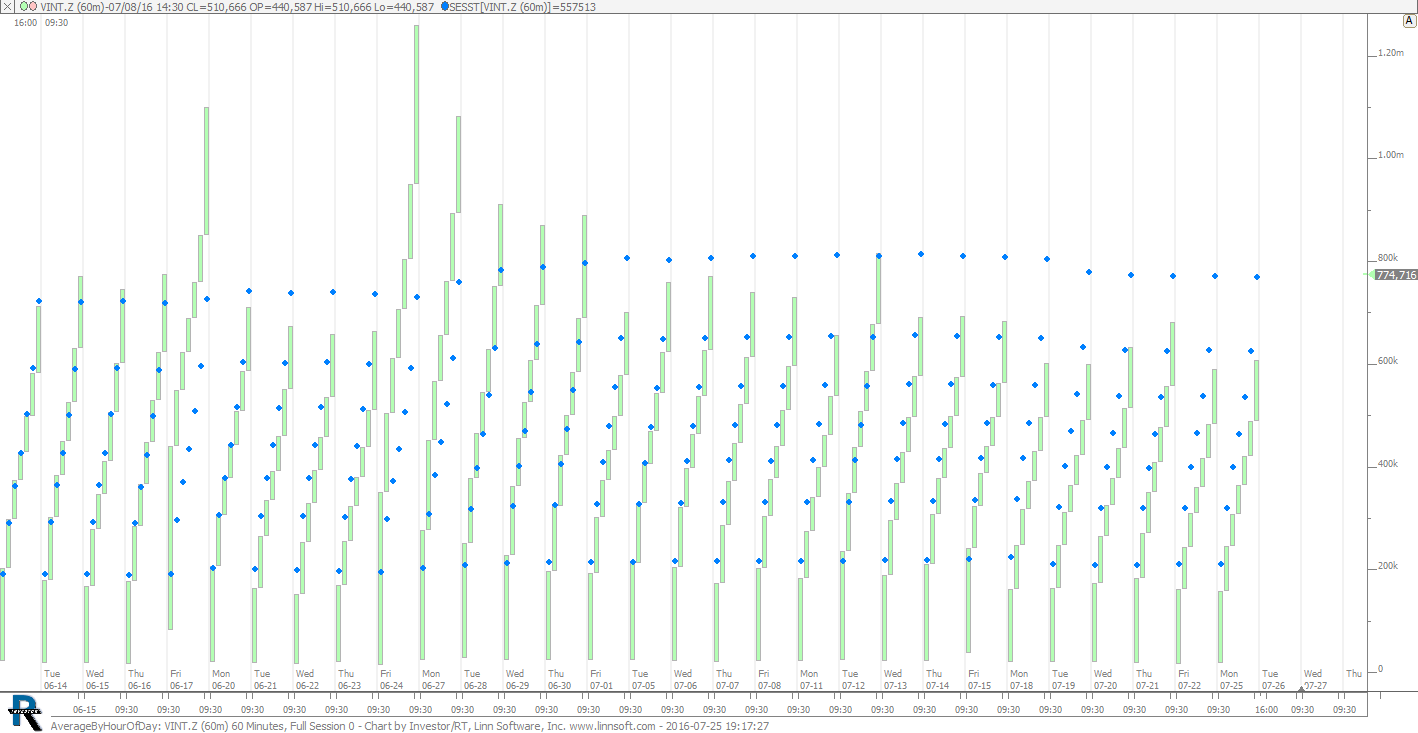 |
AverageByHourOfDay (VINT.Z) cpayne [totalcount]
10 years 3 days ago
Average by Time of Day VINT.Z. This chart was uploaded by Investor/RT 12.6.1 showing symbol: VINT.Z. |
View |
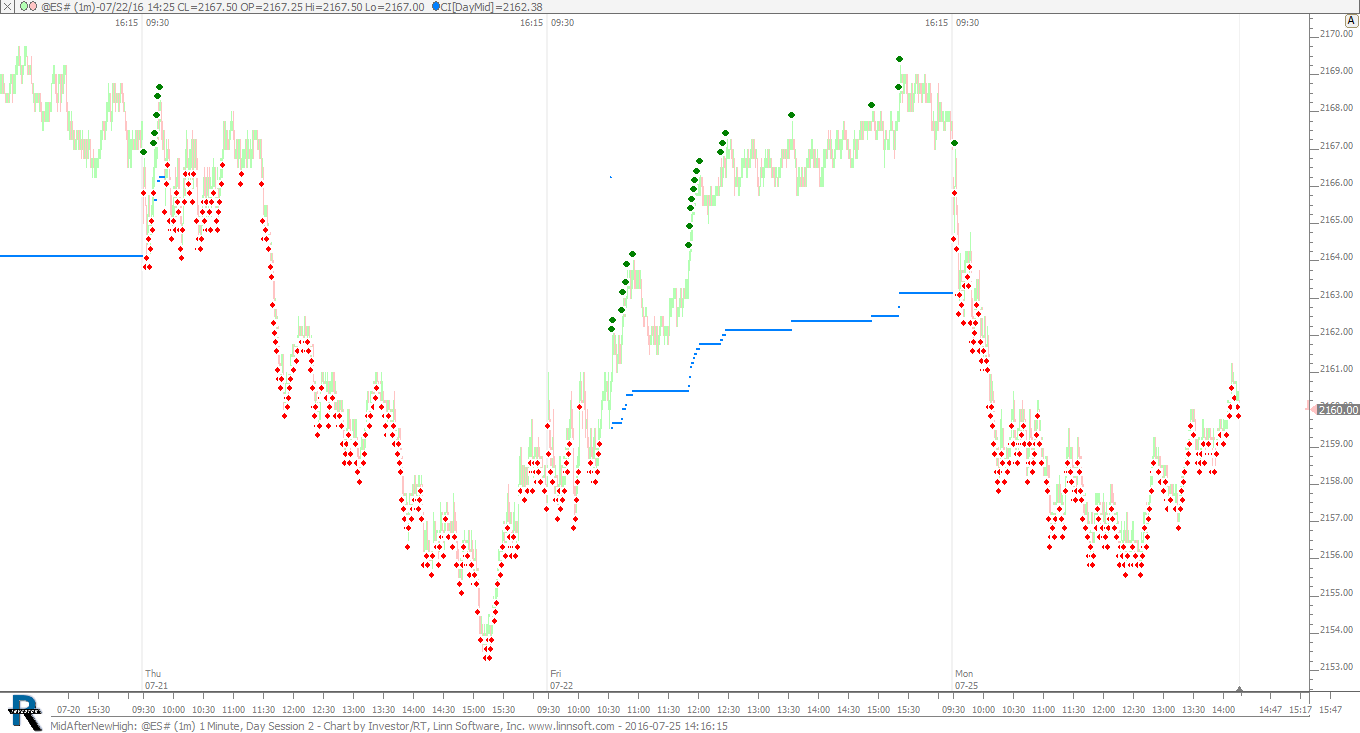 |
MidAfterNewHigh (@ES#) cpayne [totalcount]
10 years 3 days ago
Return To Mid after New High. This chart was uploaded by Investor/RT 12.6.1 showing symbol: @ES#. |
View |
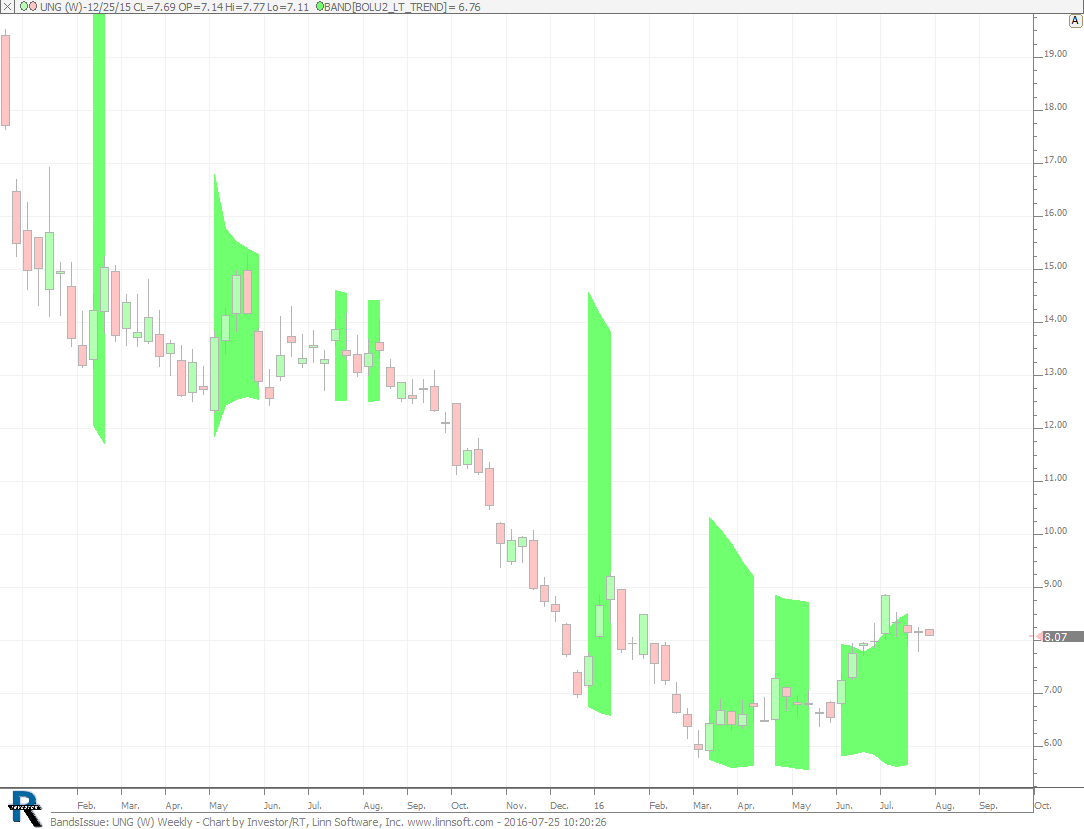 |
BandsIssue (UNG) cpayne [totalcount]
10 years 3 days ago
Painted Bands. This chart was uploaded by Investor/RT 12.6.1 showing symbol: UNG. |
View |
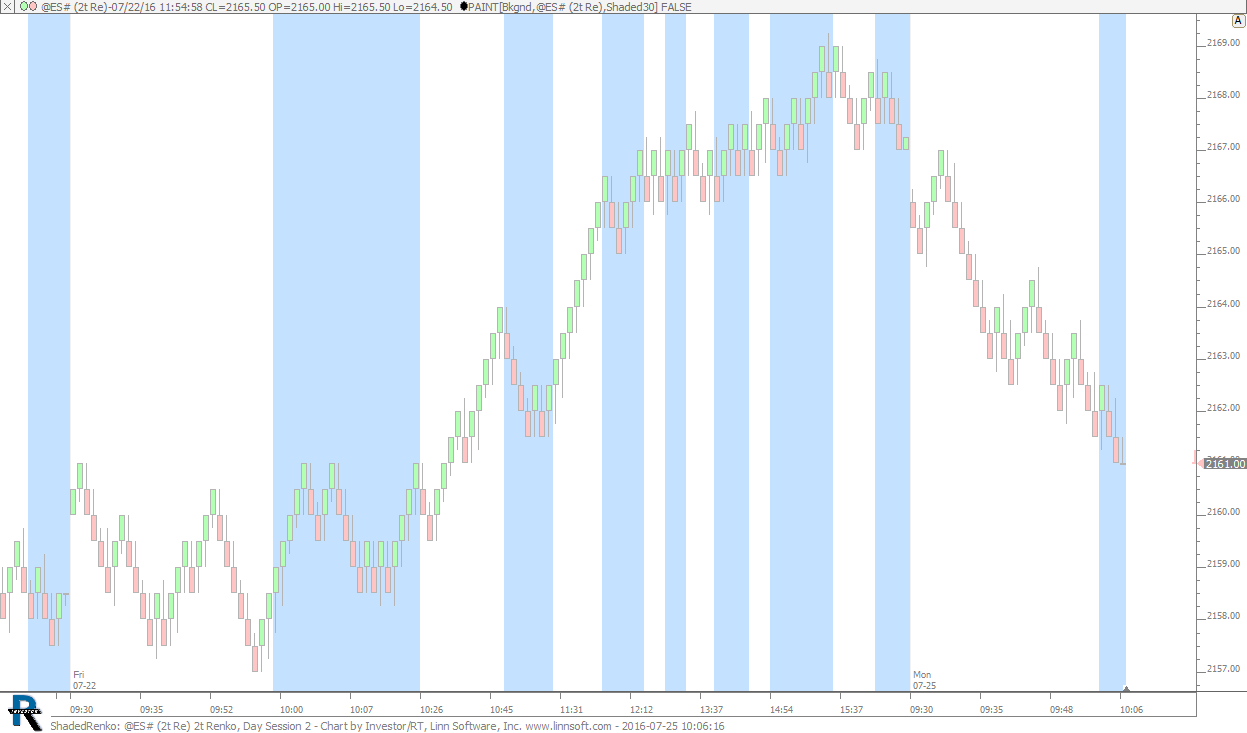 |
ShadedRenko (@ES#) cpayne [totalcount]
10 years 3 days ago
Shading every alternating 30 minute bracket. This chart was uploaded by Investor/RT 12.6.1 showing symbol: @ES#. |
View |
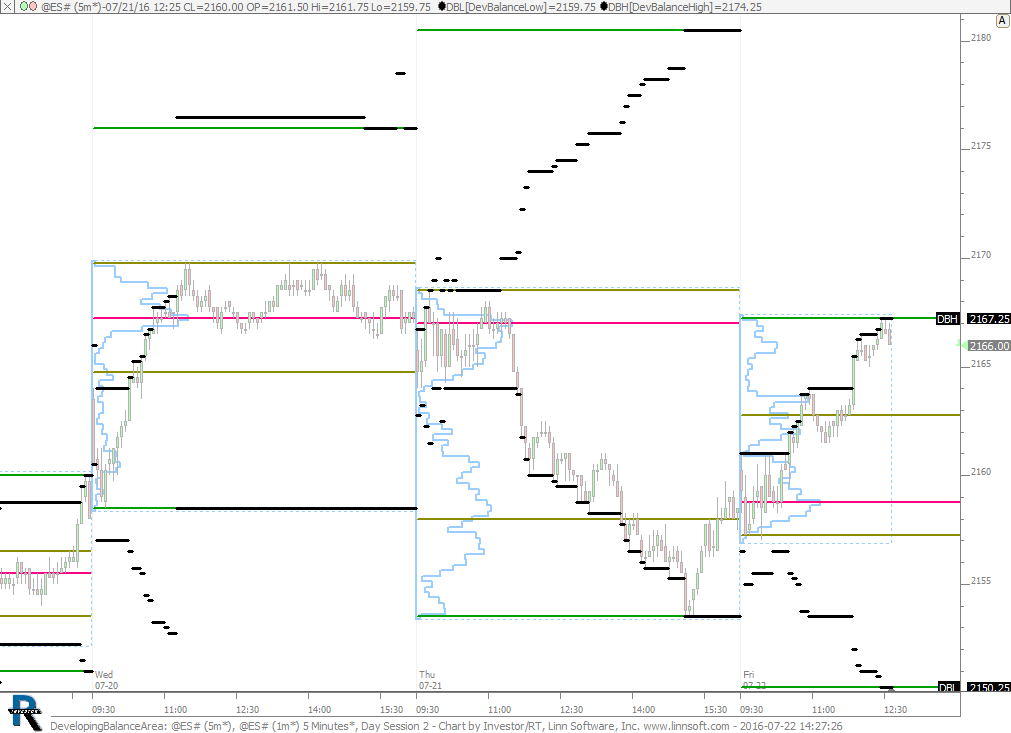 |
DevelopingBalanceArea (@ES#) cpayne [totalcount]
10 years 6 days ago
Developing Balance Area. This chart was uploaded by Investor/RT 12.6.1 showing symbol: @ES#. |
View |
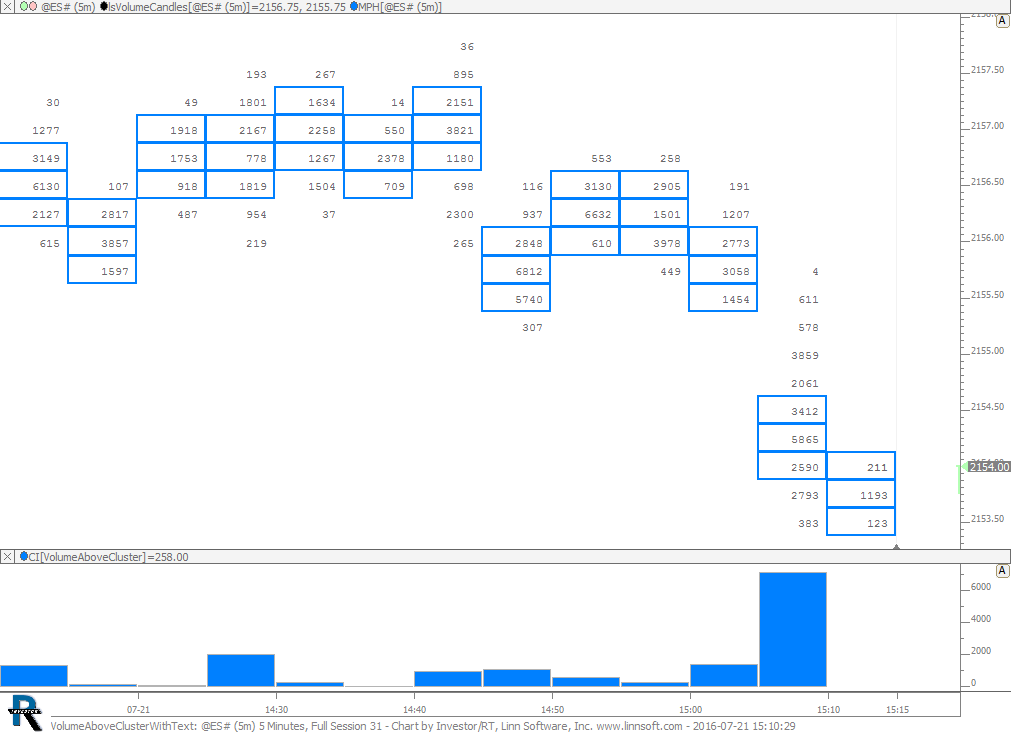 |
VolumeAboveClusterWithText (@ES#) cpayne [totalcount]
10 years 1 week ago
This chart was uploaded by Investor/RT 12.6.1 showing symbol: @ES#. |
View |
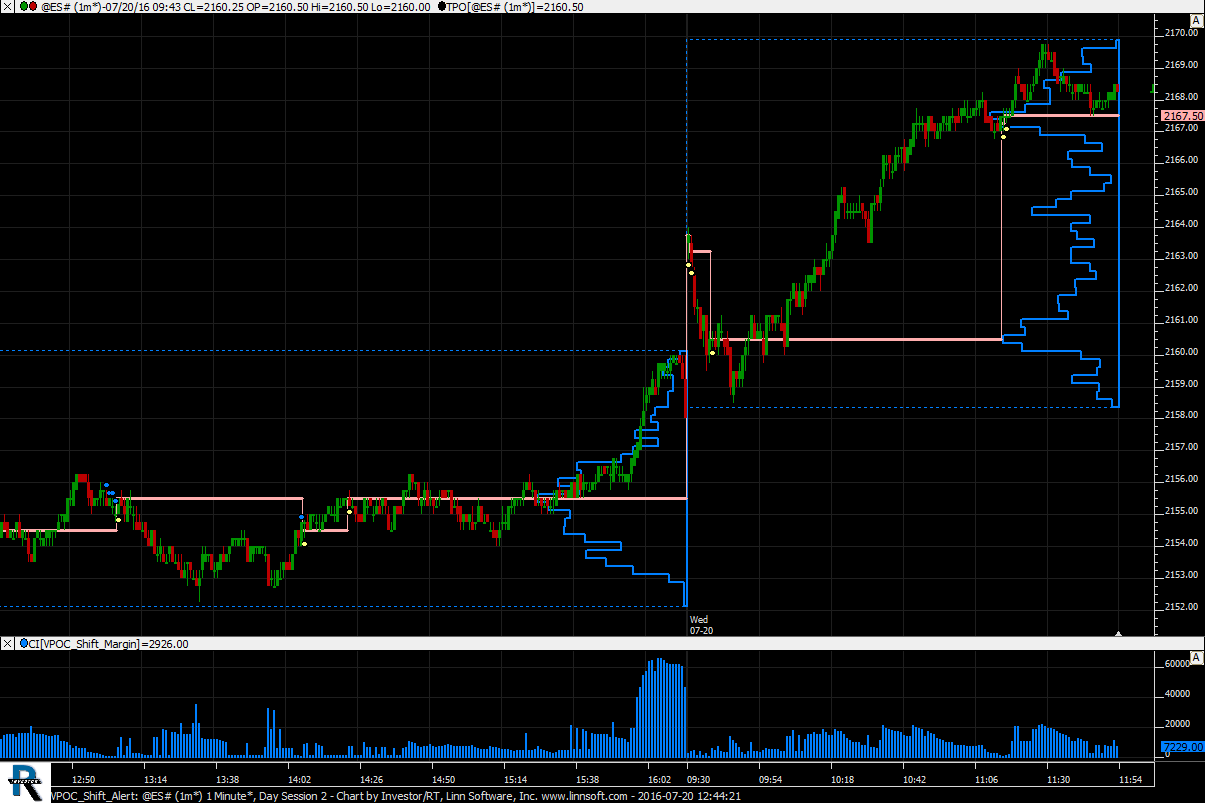 |
VPOC Shift Alert (@ES#) cpayne [totalcount]
10 years 1 week ago
VPOC Shift Alerts - Chime when VPOC Shift Imminent, Corkpop when VPOC Shift occurs. This chart was uploaded by Investor/RT 12.6.1 showing symbol: @ES#. |
View |
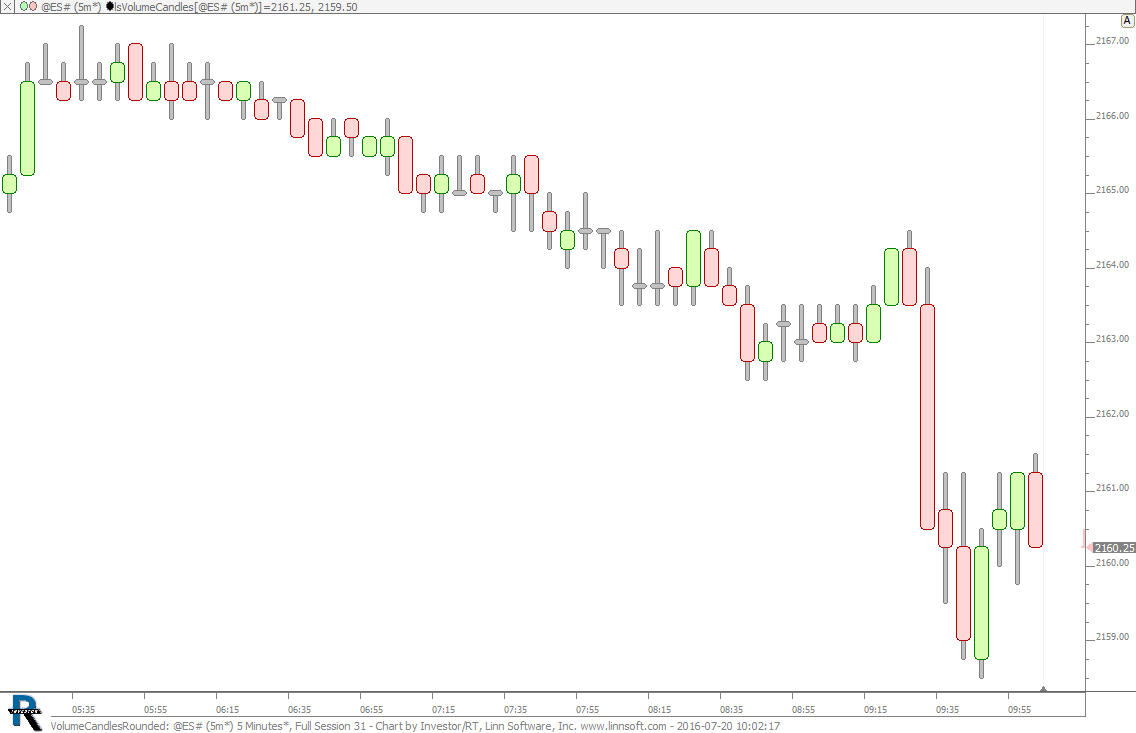 |
VolumeCandlesRounded (@ES#) cpayne [totalcount]
10 years 1 week ago
Rounded Candles using Volume Candles. This chart was uploaded by Investor/RT 12.6.1 showing symbol: @ES#. |
View |
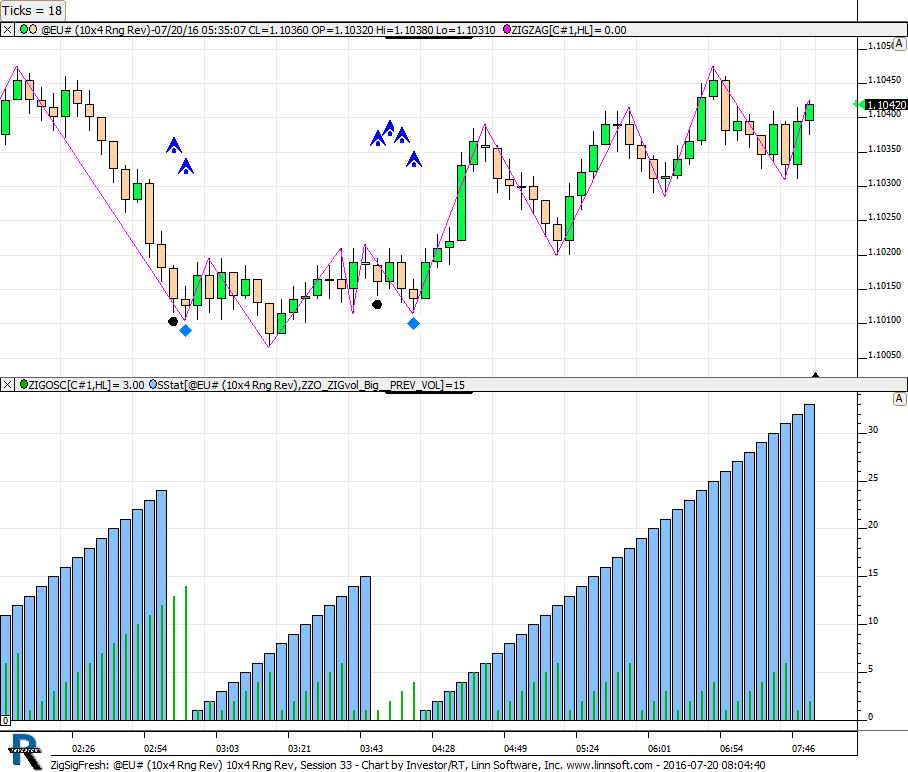 |
ZigSigFresh (@EU#) cpayne [totalcount]
10 years 1 week ago
This chart was uploaded by Investor/RT 12.6.1 showing symbol: @EU#. |
View |
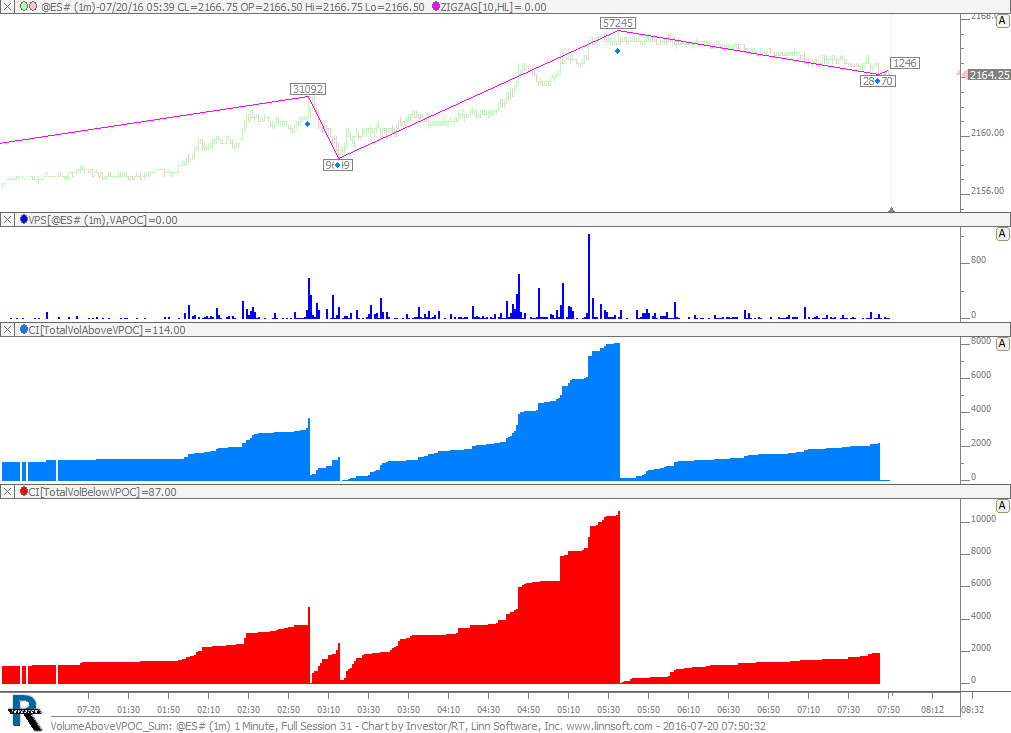 |
VolumeAboveVPOC Sum (@ES#) cpayne [totalcount]
10 years 1 week ago
Sums the Volume Above VPOC of each Bar on each Zig Swing. This chart was uploaded by Investor/RT 12.6.1 showing symbol: @ES#. |
View |
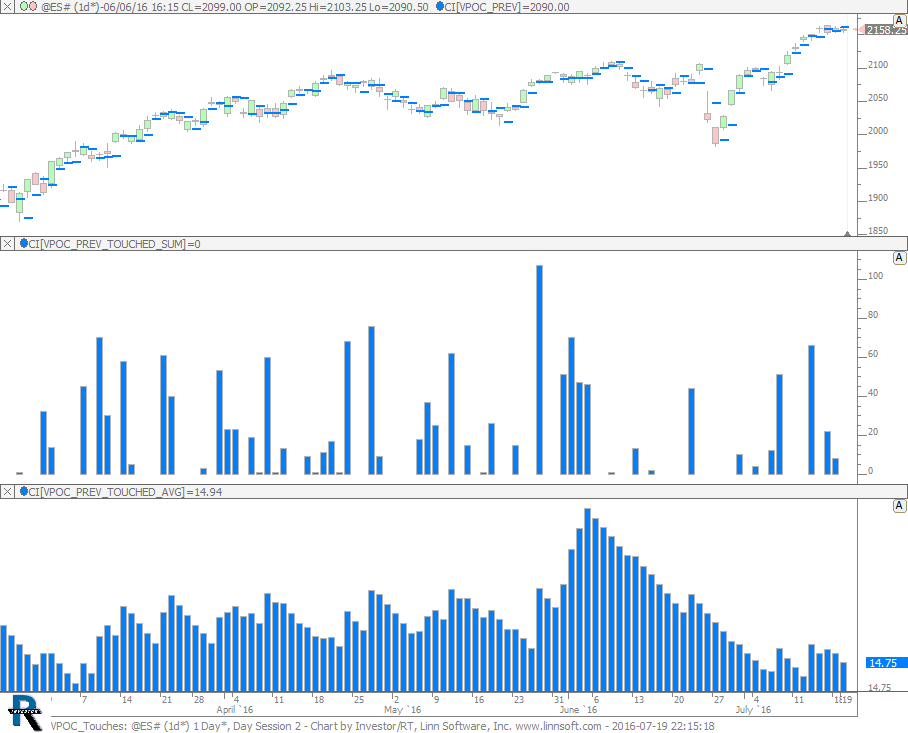 |
VPOC Touches (@ES#) cpayne [totalcount]
10 years 1 week ago
Number of VPOC Test and Average Number. This chart was uploaded by Investor/RT 12.6.1 showing symbol: @ES#. |
View |
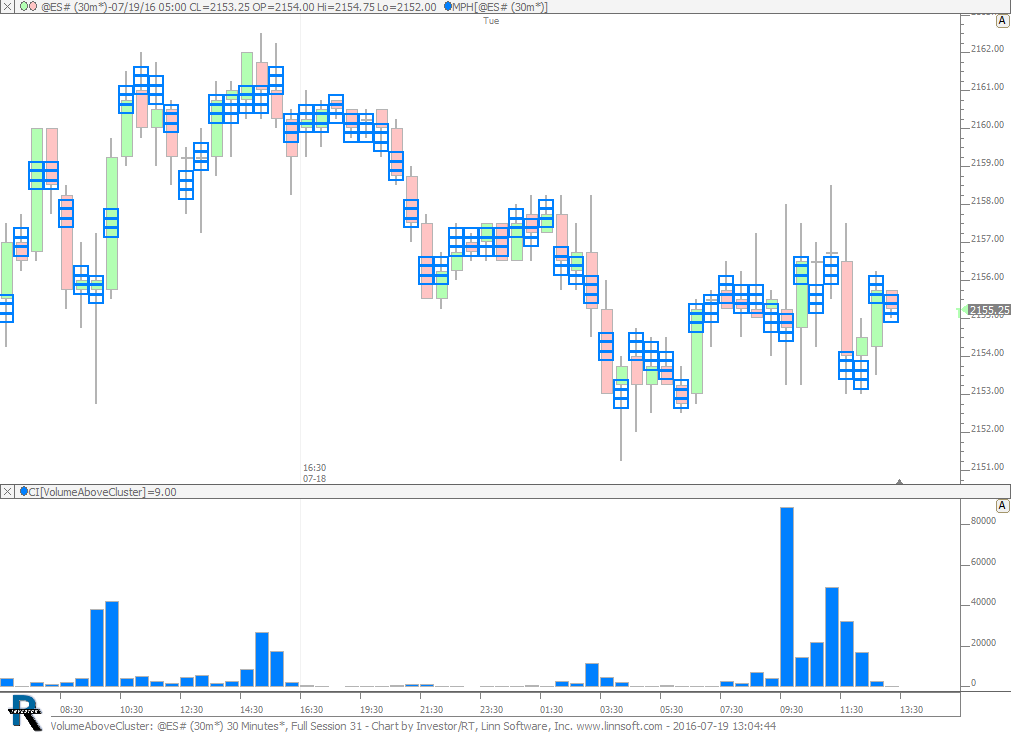 |
VolumeAboveCluster (@ES#) cpayne [totalcount]
10 years 1 week ago
Volume Above Cluster. This chart was uploaded by Investor/RT 12.6.1 showing symbol: @ES#. |
View |
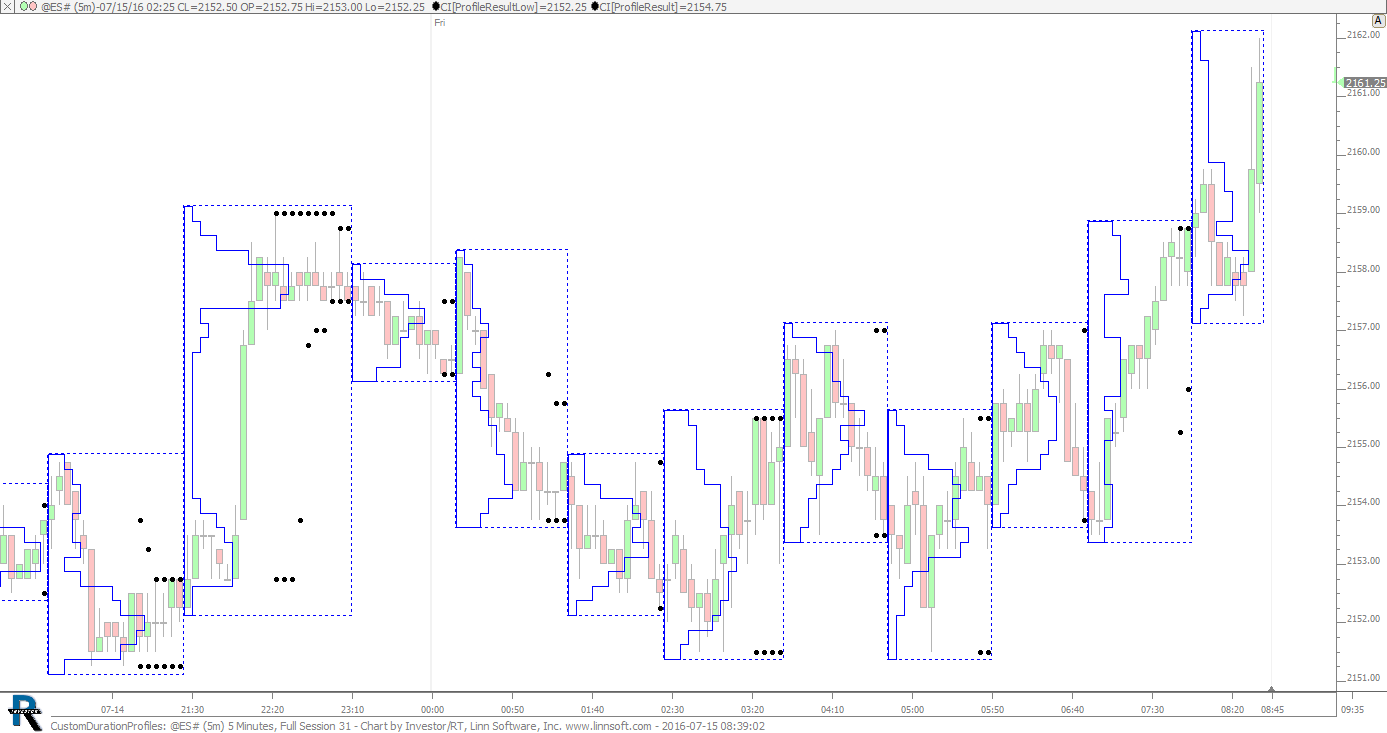 |
CustomDurationProfiles (@ES#) cpayne [totalcount]
10 years 1 week ago
Custom Duration Profiles with Highs and Lows. This chart was uploaded by Investor/RT 12.6.1 showing symbol: @ES#. |
View |