 |
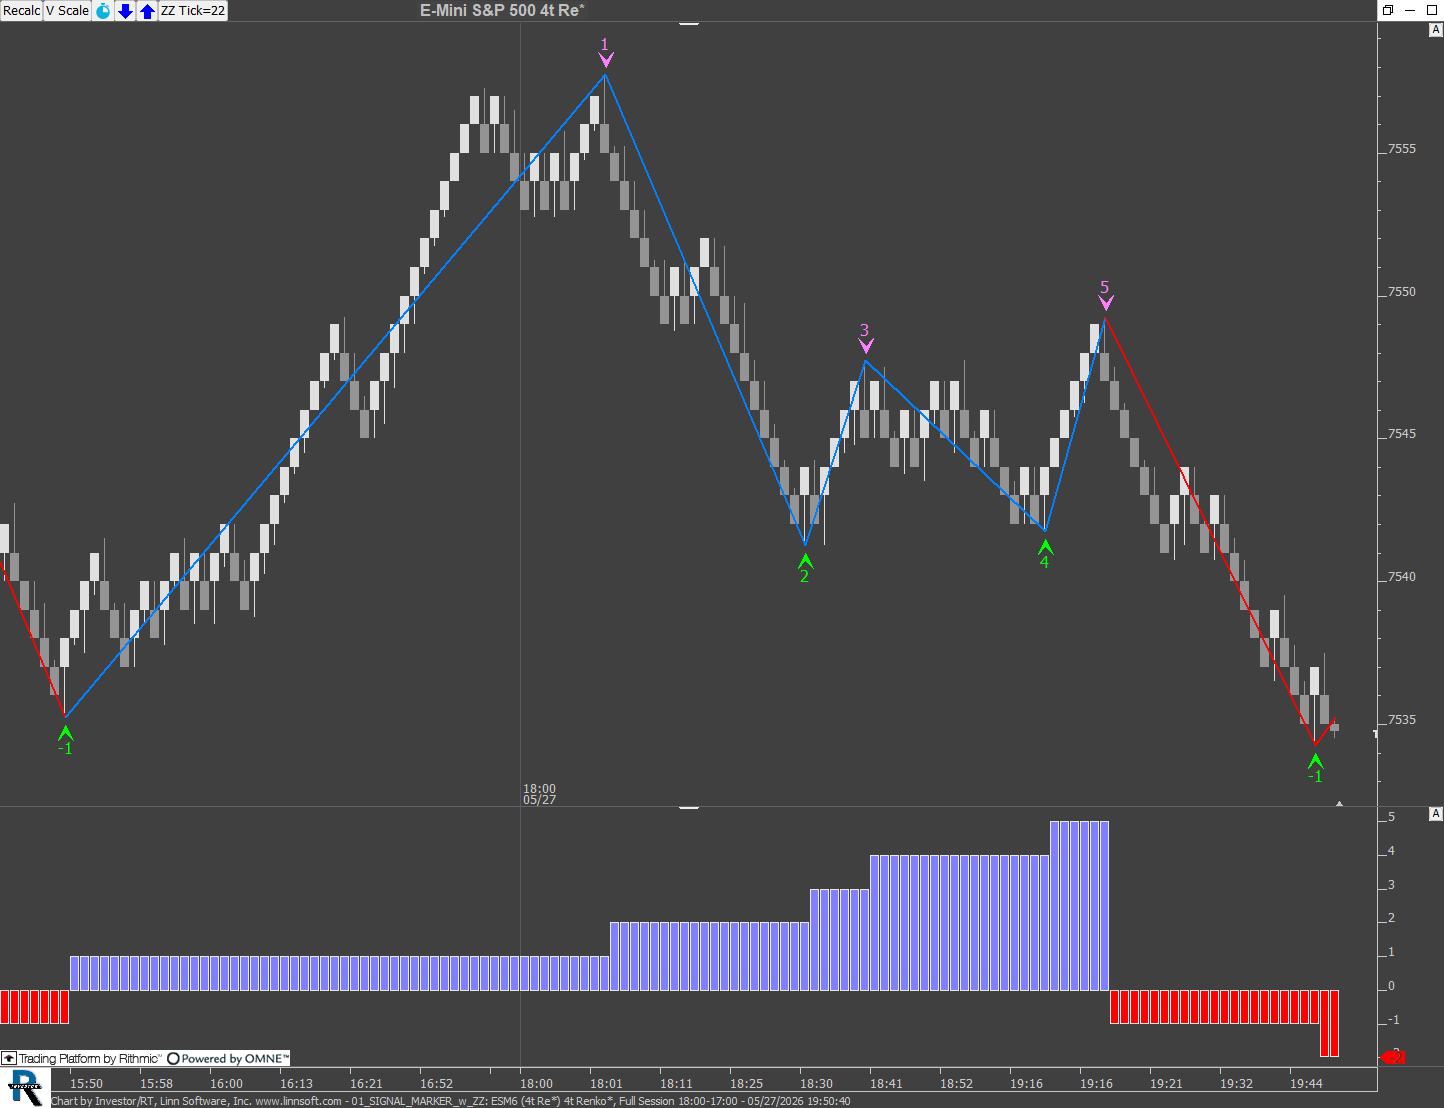
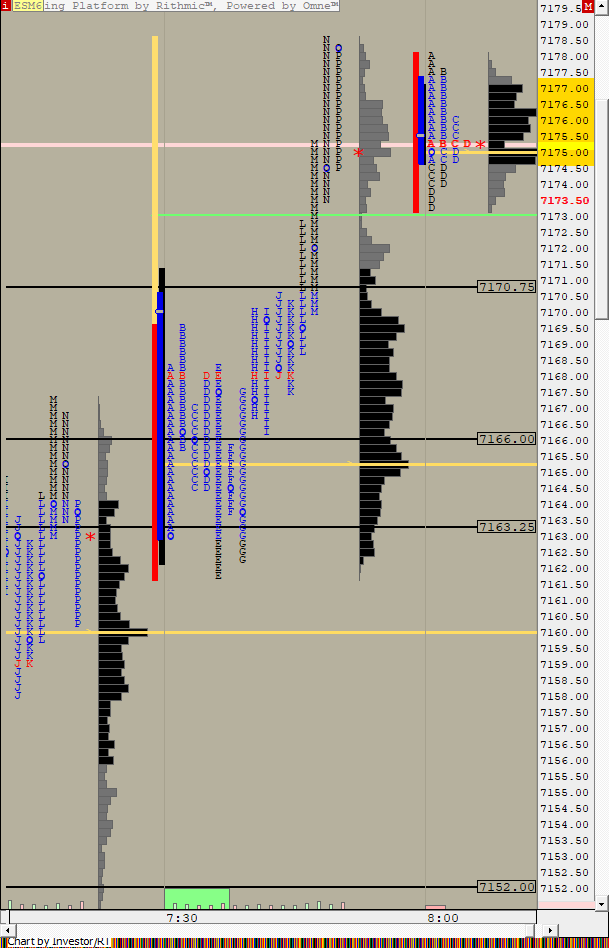
01 SIGNAL MARKER w ZZ (ESM6) Eddy [totalcount]
1 month 3 days ago
Example of ALL:ALL display/compute settings (required for Signal marker or CI with ZZO tokens). This chart was uploaded by Investor/RT 16.1.1 showing symbol: ESM6. |
View |
 |
001aPrimary NQEntry (NQM6) ES42 [totalcount]
1 month 3 days ago
This chart was uploaded by Investor/RT 16.1.1 showing symbol: NQM6. |
View |
 |
4 Hour Mathlines (NQM6) ES42 [totalcount]
1 month 3 days ago
This chart was uploaded by Investor/RT 16.1.1 showing symbol: NQM6. |
View |
 |
ESDAY (ESM6) ES42 [totalcount]
1 month 1 week ago
This chart was uploaded by Investor/RT 16.1.1 showing symbol: ESM6. |
View |
 |
NQTPO DAILY (NQM6) ES42 [totalcount]
1 month 1 week ago
This chart was uploaded by Investor/RT 16.1.1 showing symbol: NQM6. |
View |
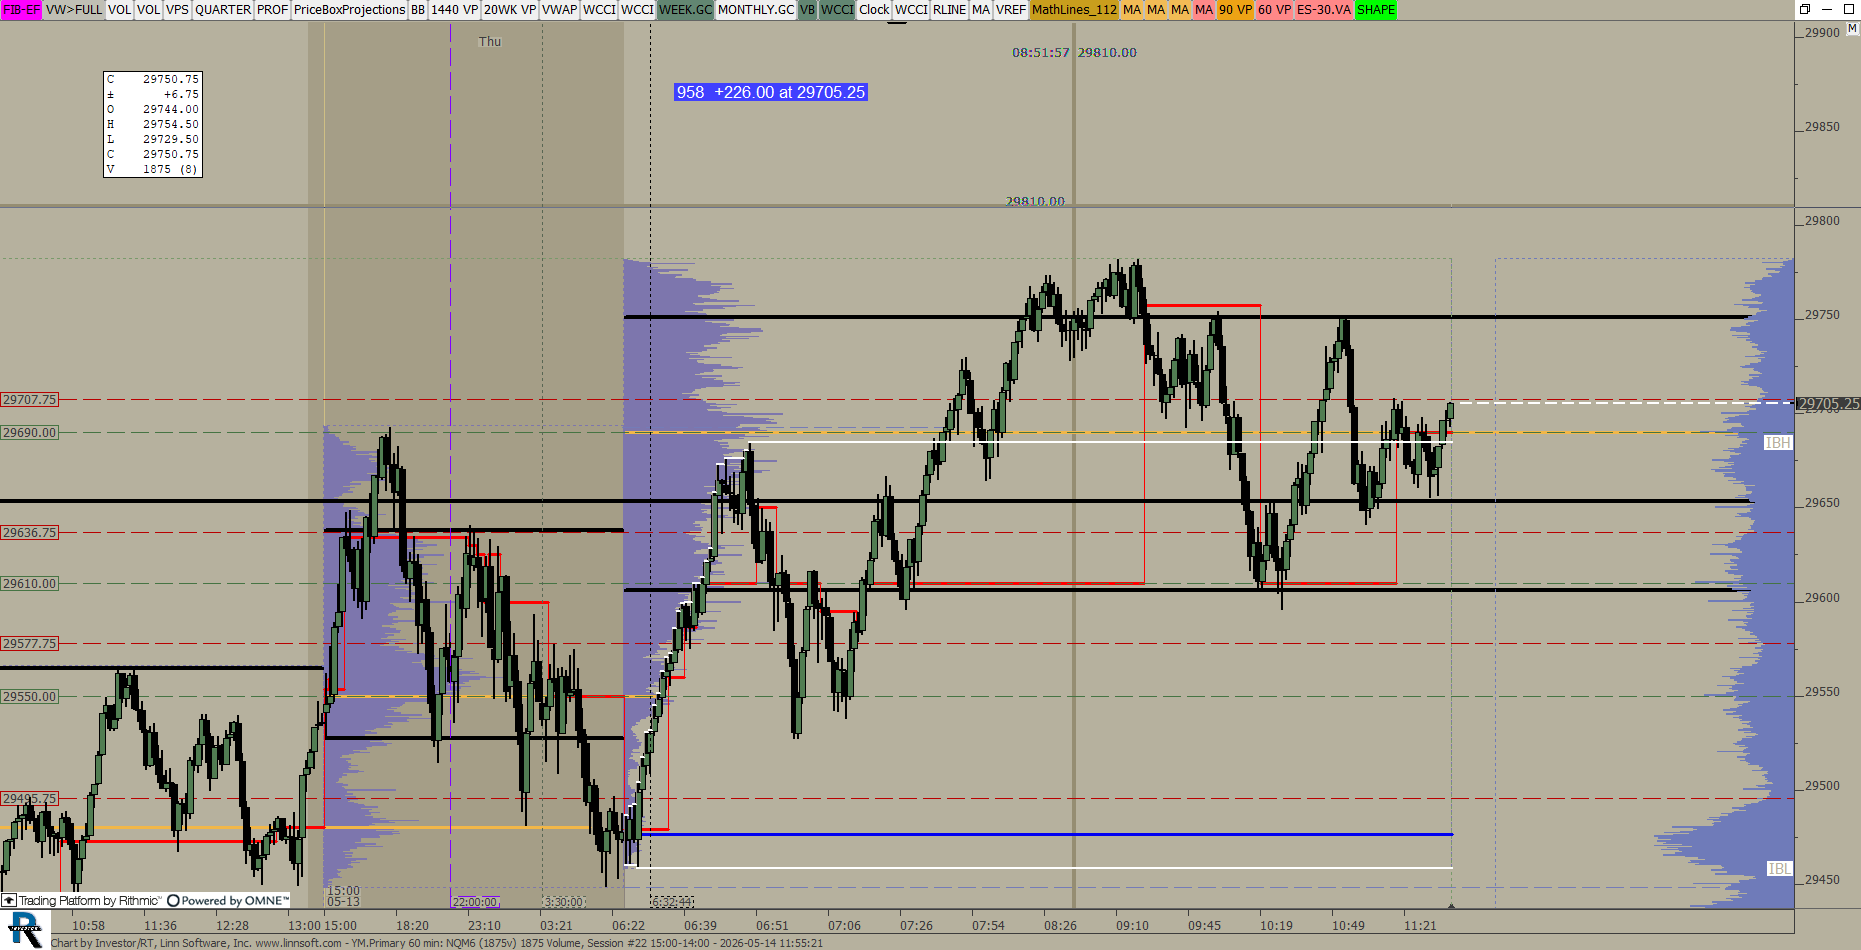 |
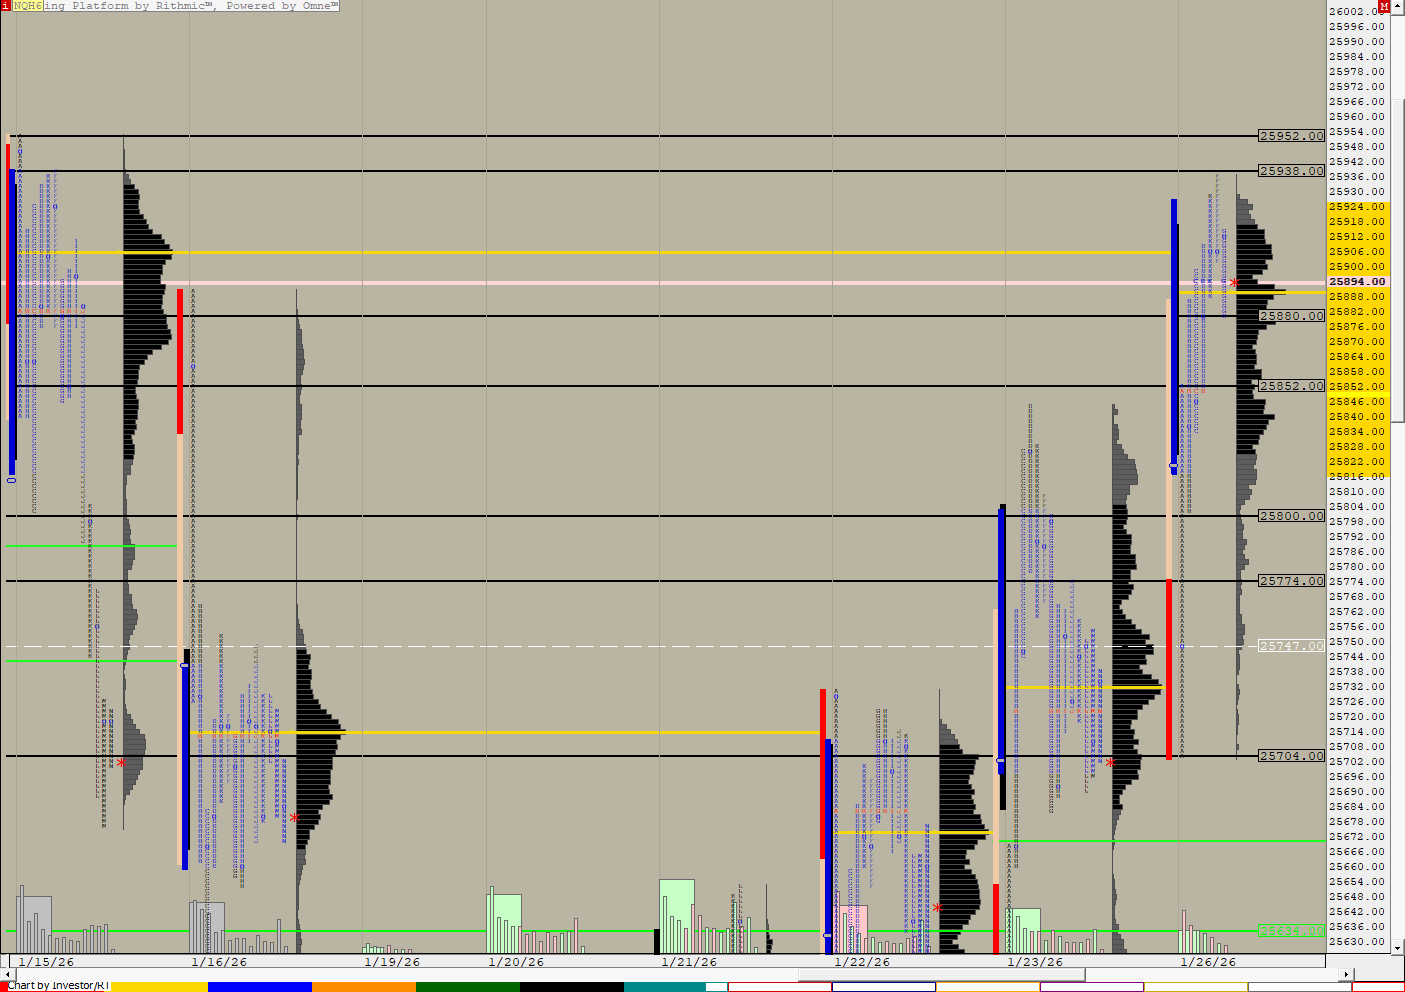
YMPrimary 60 min (NQM6) ES42 [totalcount]
1 month 2 weeks ago
This chart was uploaded by Investor/RT 16.1.1 showing symbol: NQM6. |
View |
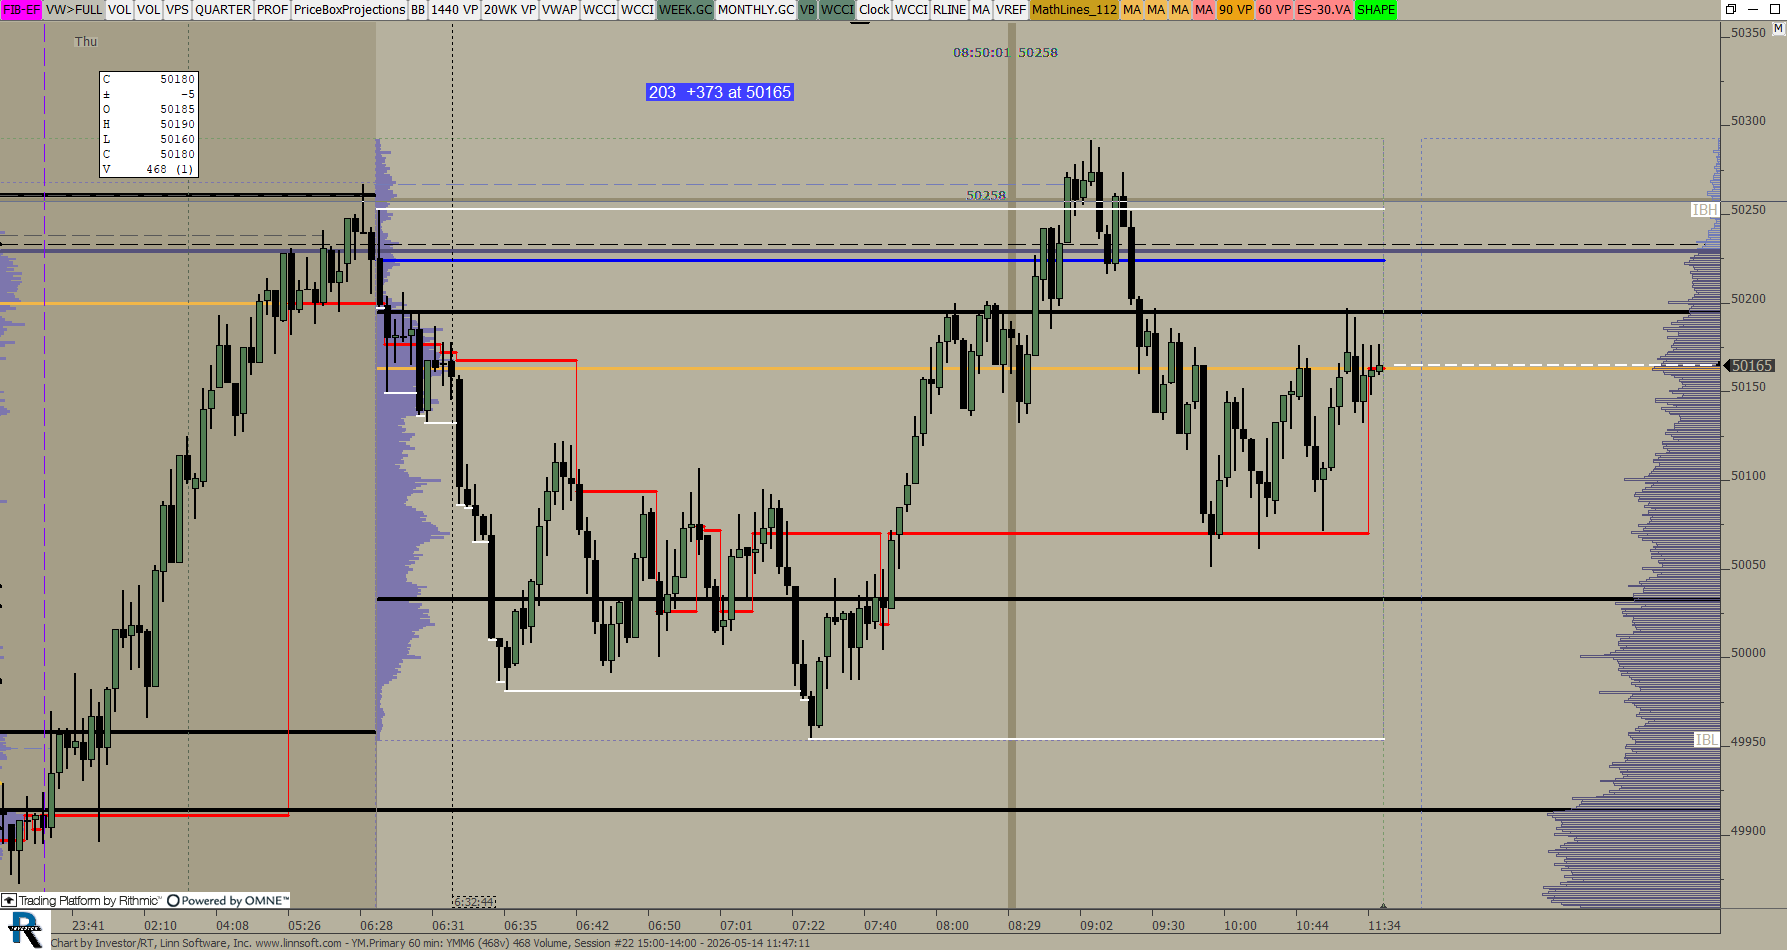 |
YMPrimary 60 min (YMM6) ES42 [totalcount]
1 month 2 weeks ago
This chart was uploaded by Investor/RT 16.1.1 showing symbol: YMM6. |
View |
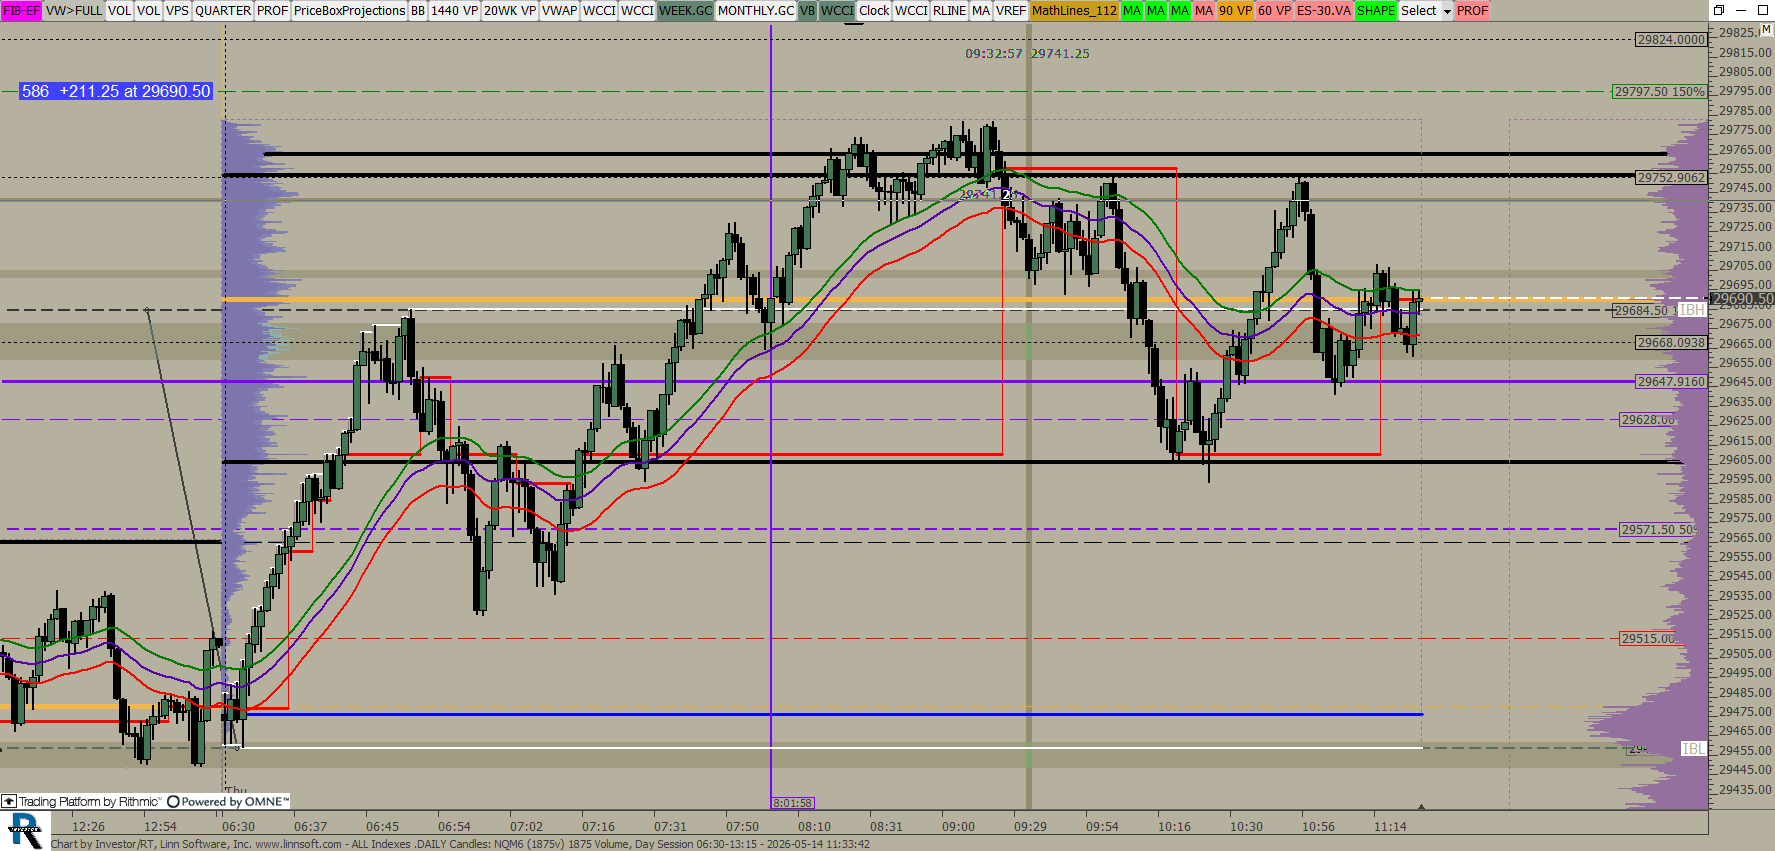 |
ALL Indexes DAILY Candles (NQM6) ES42 [totalcount]
1 month 2 weeks ago
This chart was uploaded by Investor/RT 16.1.1 showing symbol: NQM6. |
View |
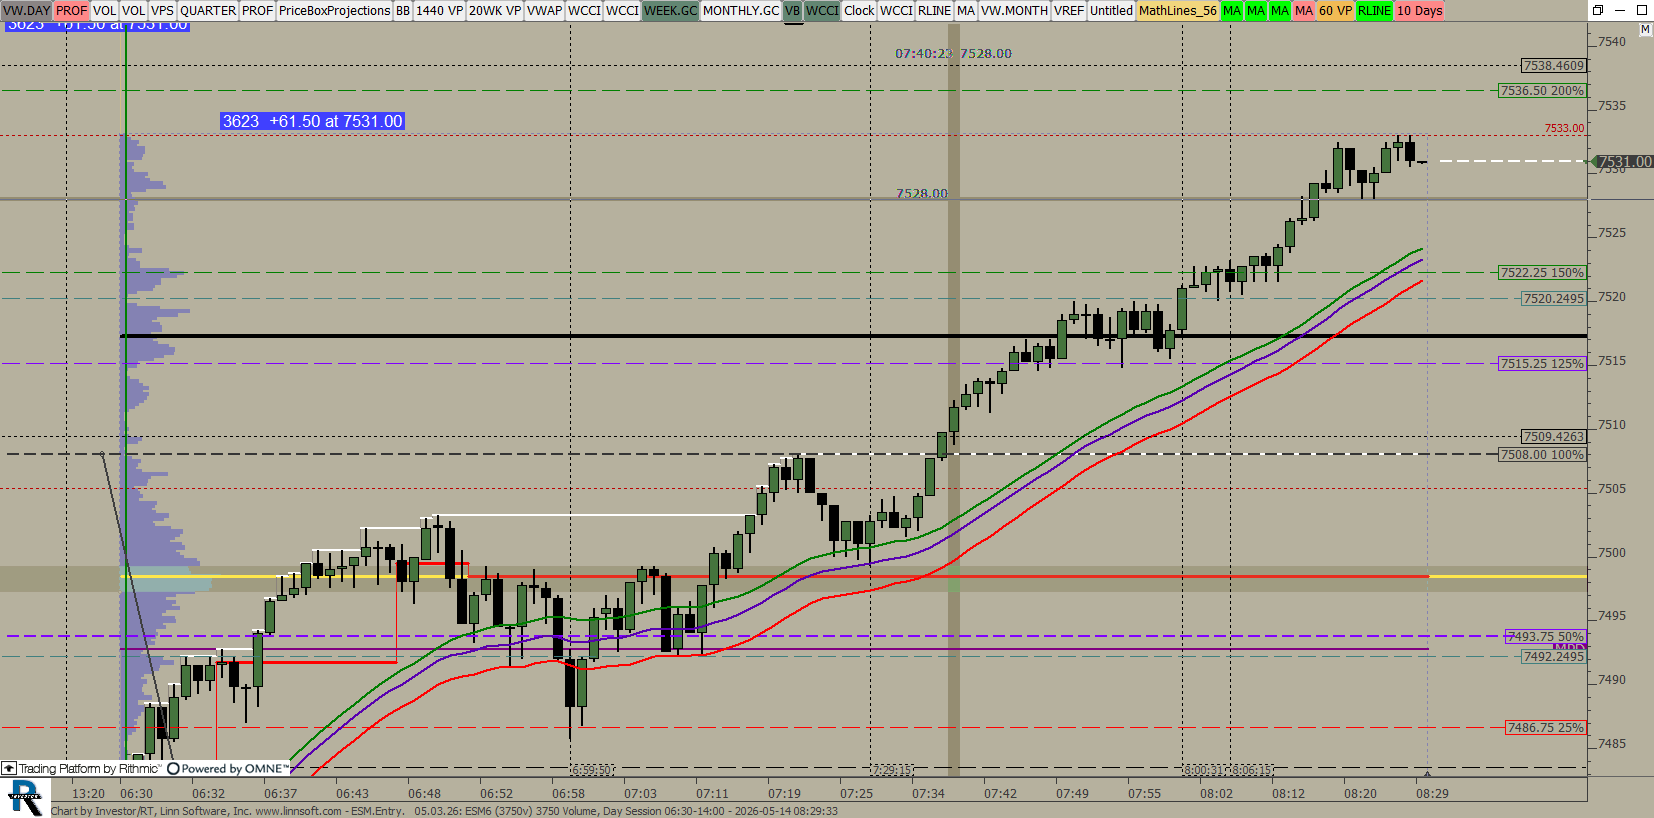 |
ESMEntry (ESM6) ES42 [totalcount]
1 month 2 weeks ago
This chart was uploaded by Investor/RT 16.1.1 showing symbol: ESM6. |
View |
 |
All Indexes Monthly VPs (NQM6) ES42 [totalcount]
1 month 3 weeks ago
This chart was uploaded by Investor/RT 15.1.25 showing symbol: NQM6. |
View |
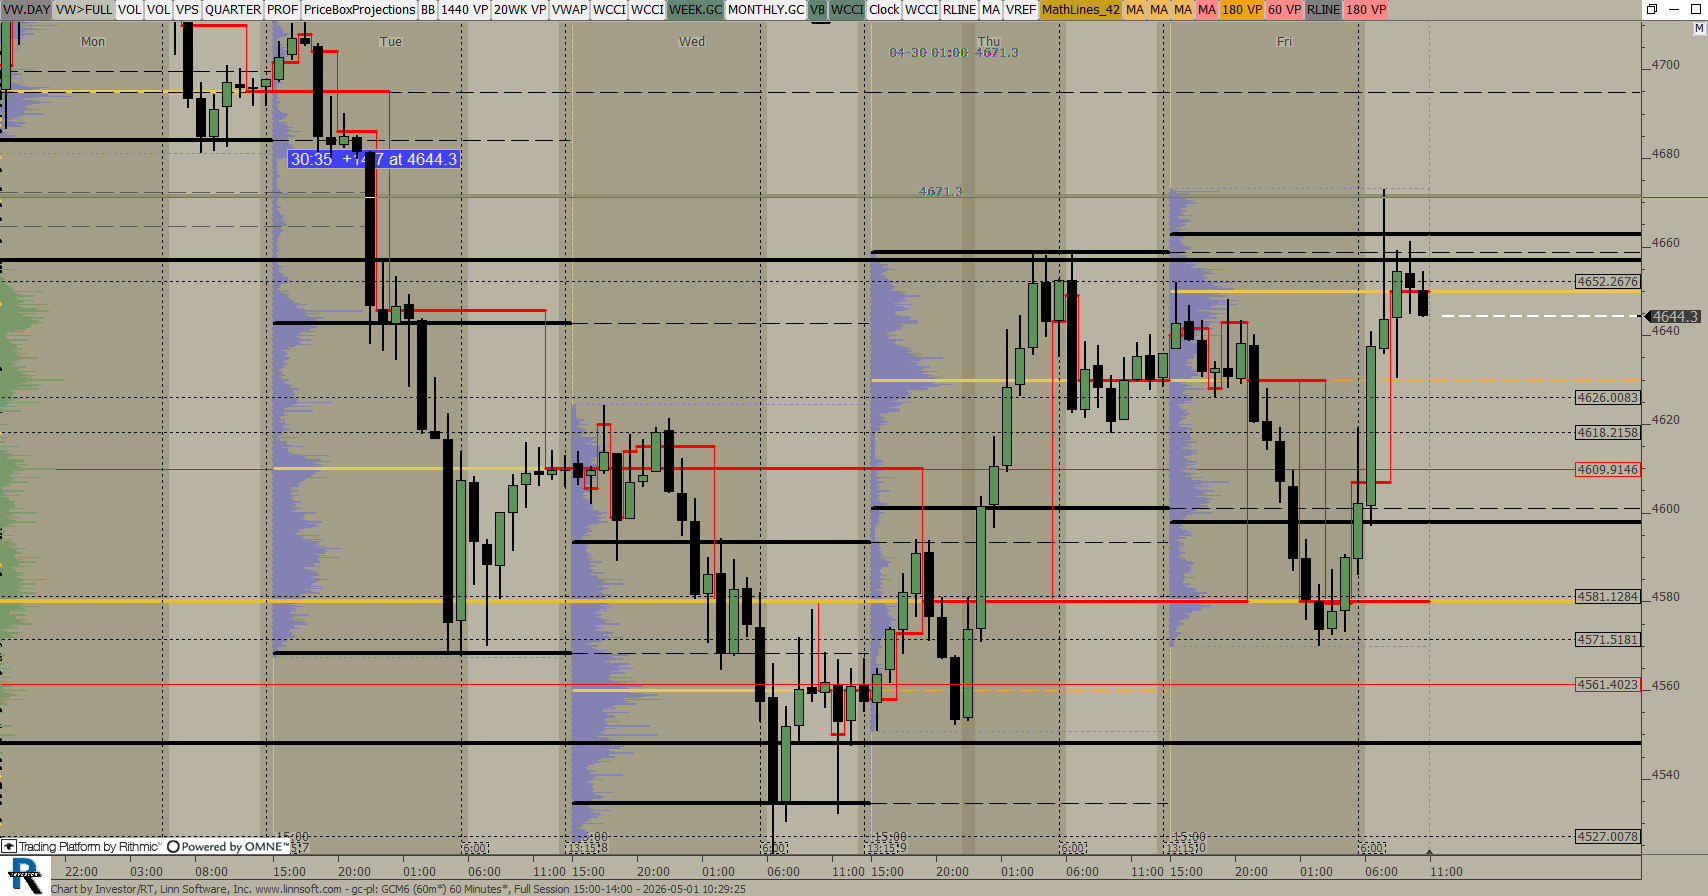 |
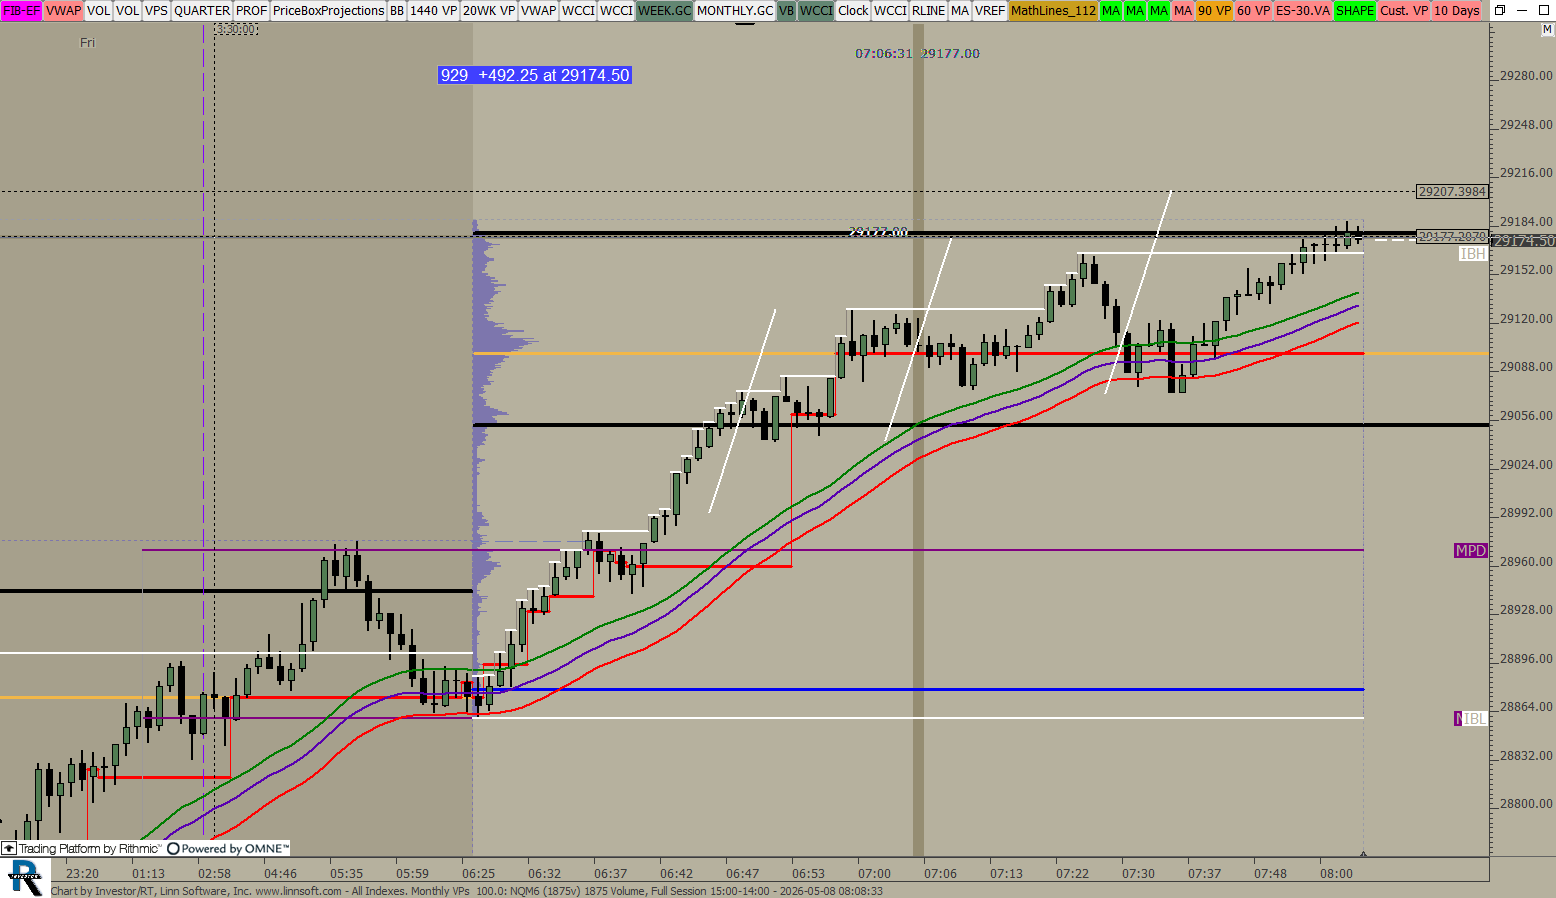
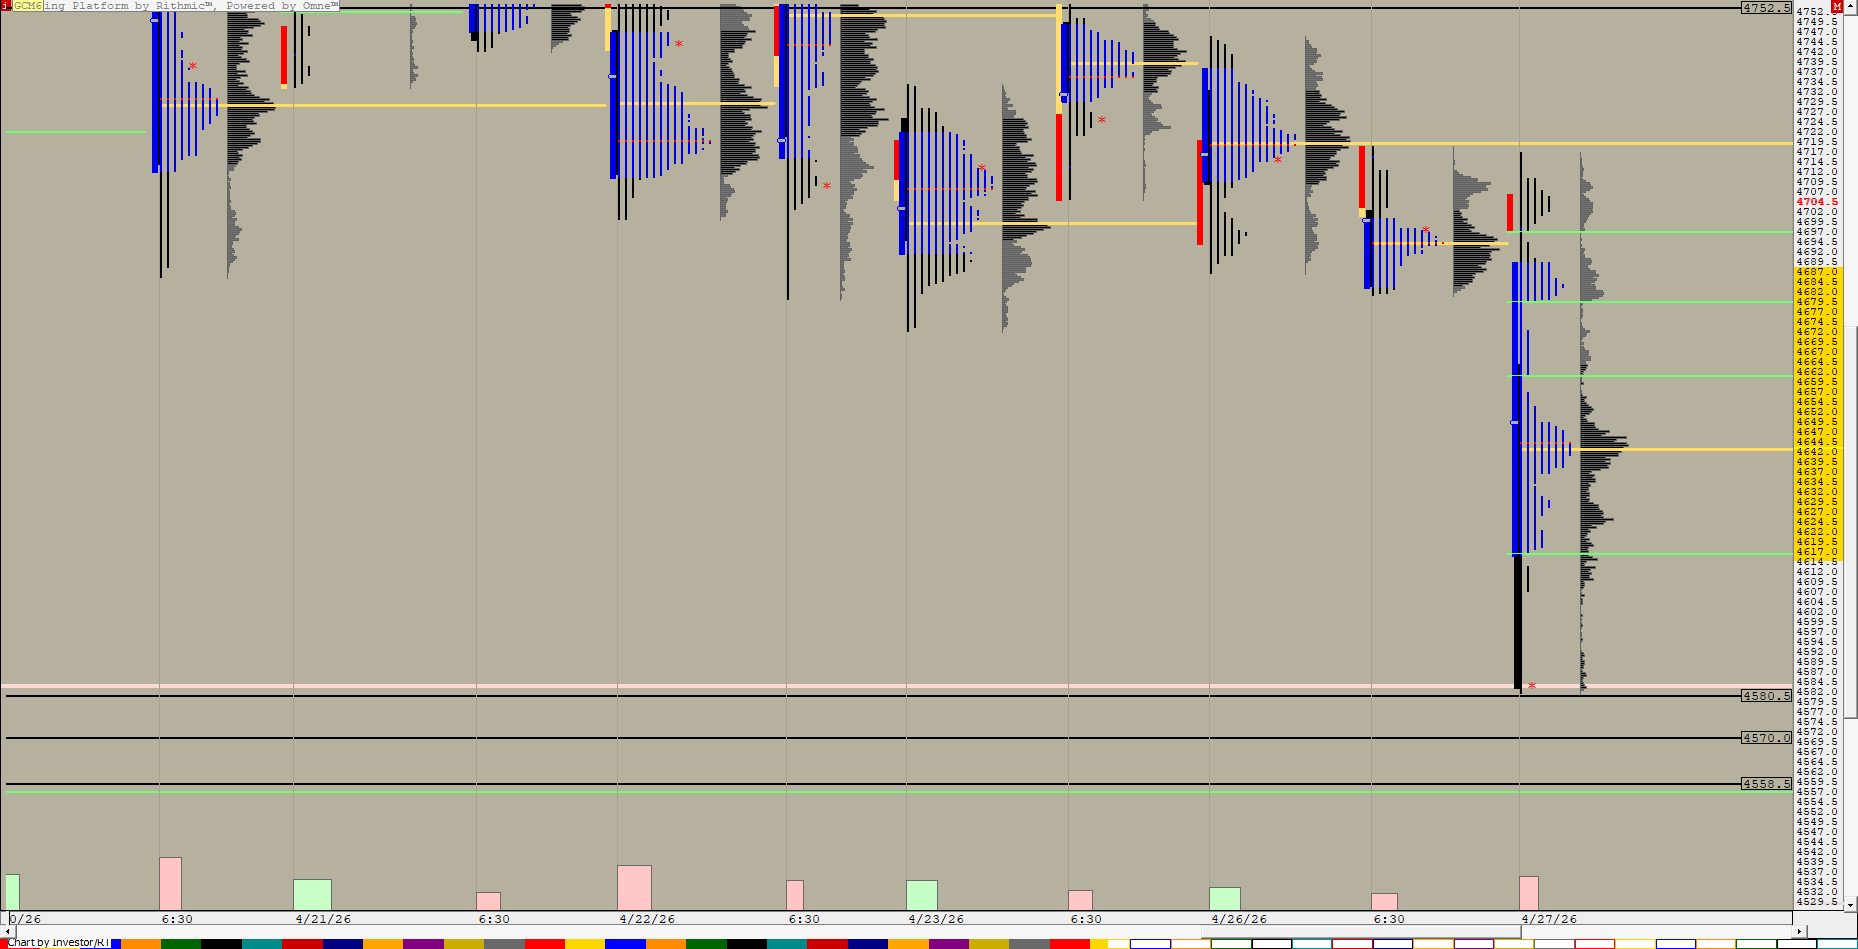
gc pl (GCM6) ES42 [totalcount]
1 month 4 weeks ago
This chart was uploaded by Investor/RT 16.1.1 showing symbol: GCM6. |
View |
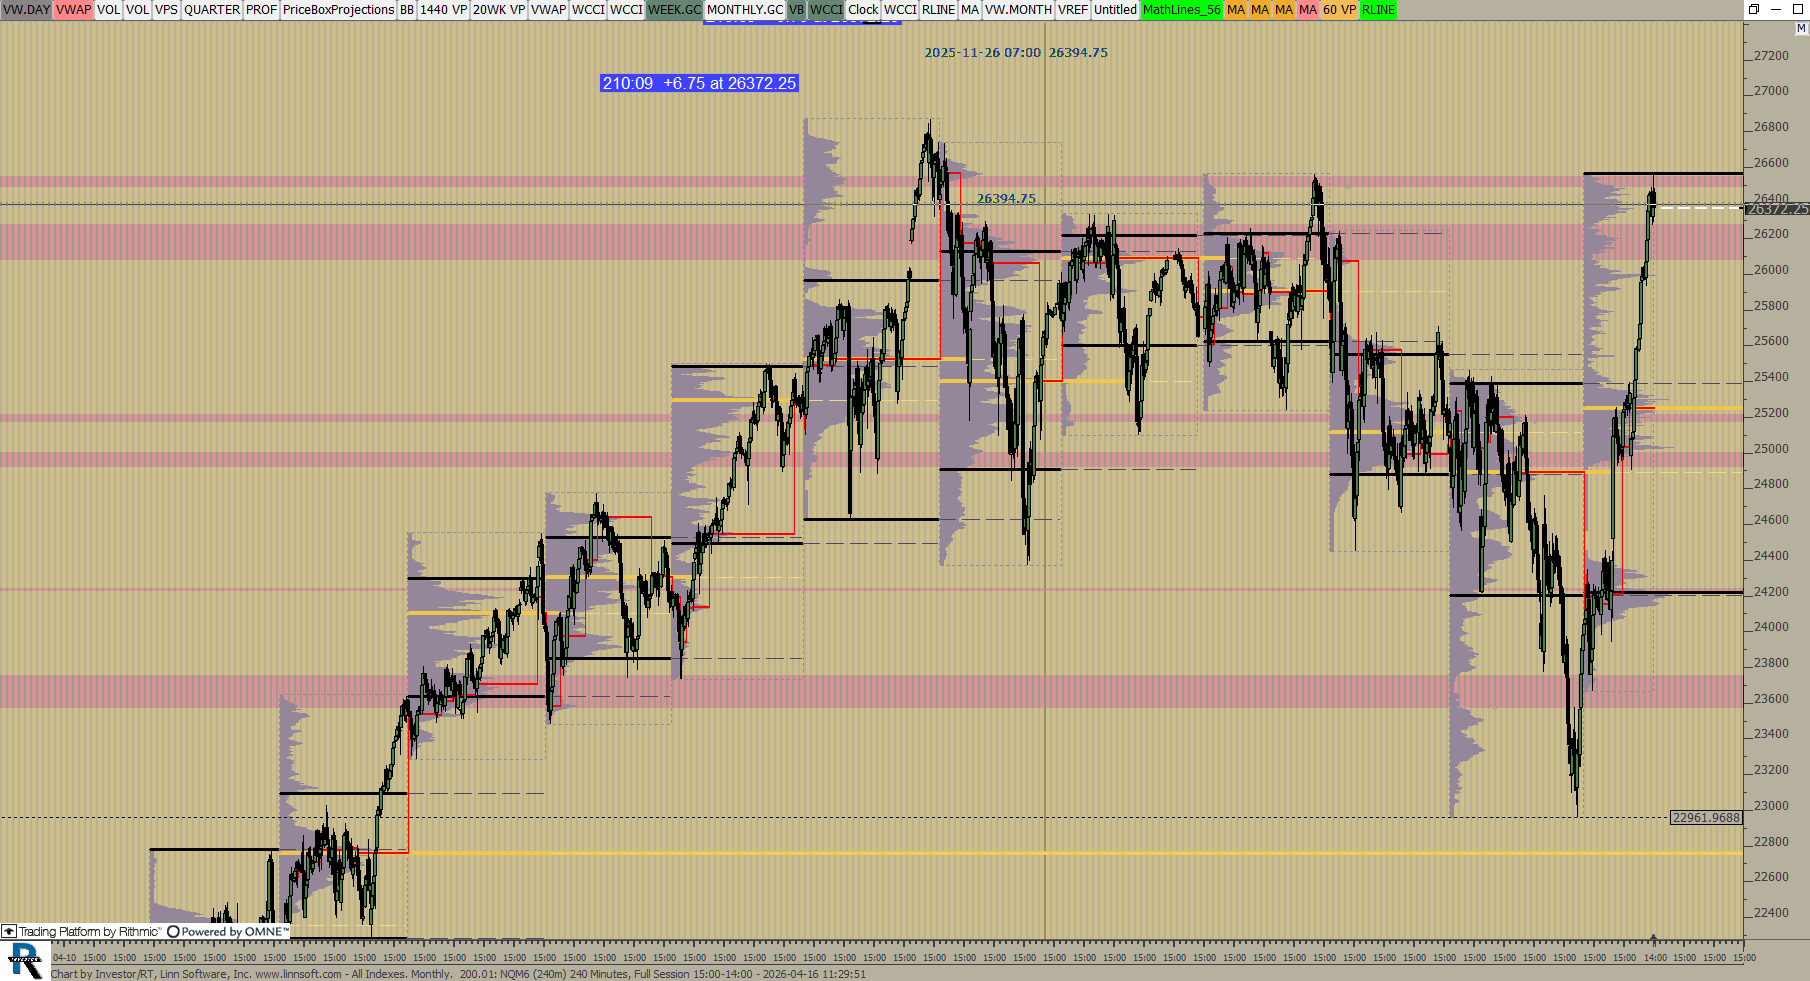 |
All Indexes Monthly (NQM6) ES42 [totalcount]
1 month 4 weeks ago
This chart was uploaded by Investor/RT 15.1.25 showing symbol: NQM6. |
View |
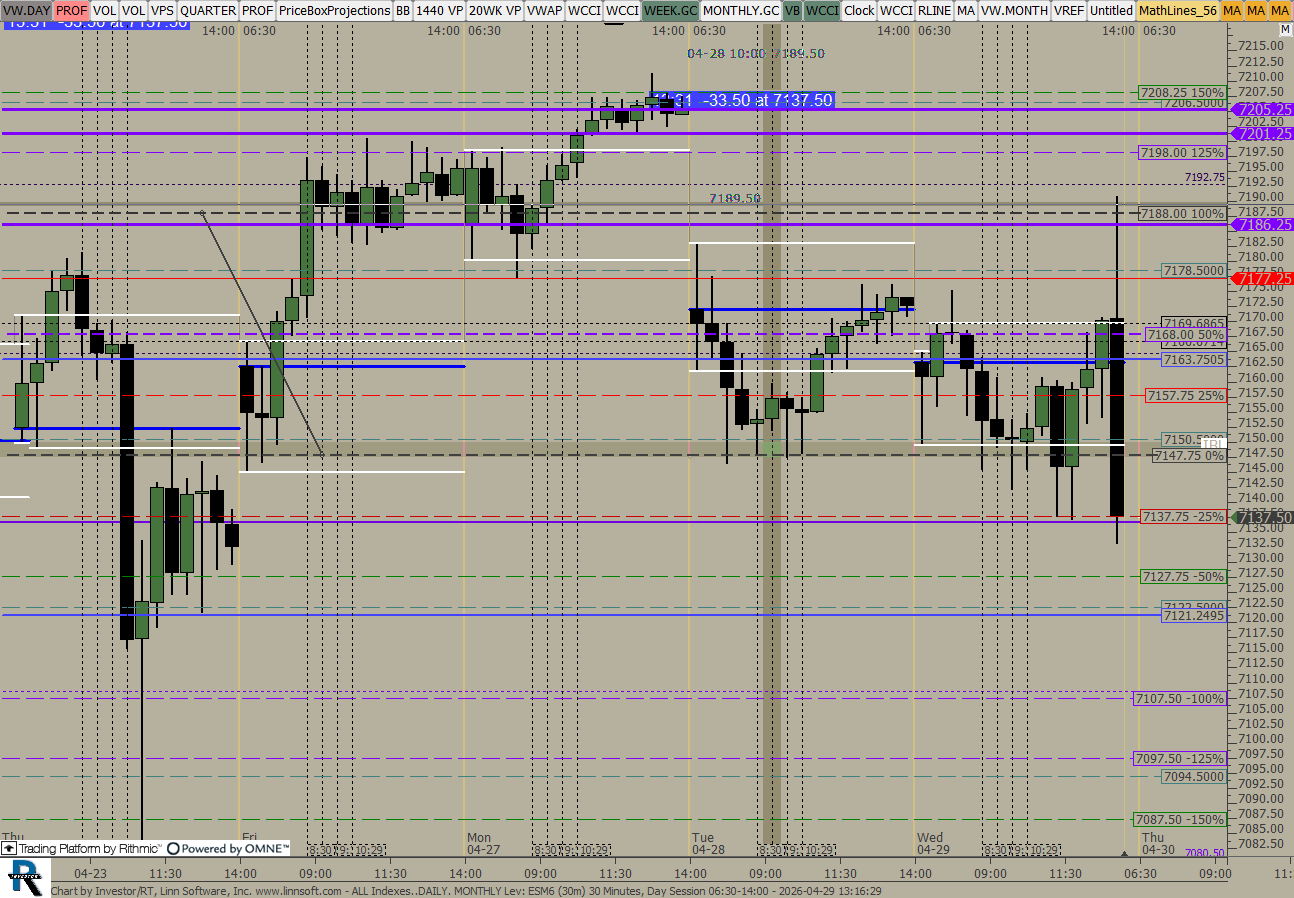 |
ALL IndexesDAILY MONTHLY Lev (ESM6) ES42 [totalcount]
2 months 1 day ago
This chart was uploaded by Investor/RT 16.1.1 showing symbol: ESM6. |
View |
 |
Untitled TPO (GCM6) ES42 [totalcount]
2 months 2 days ago
This chart was uploaded by Investor/RT 15.1.25 showing symbol: GCM6. |
View |
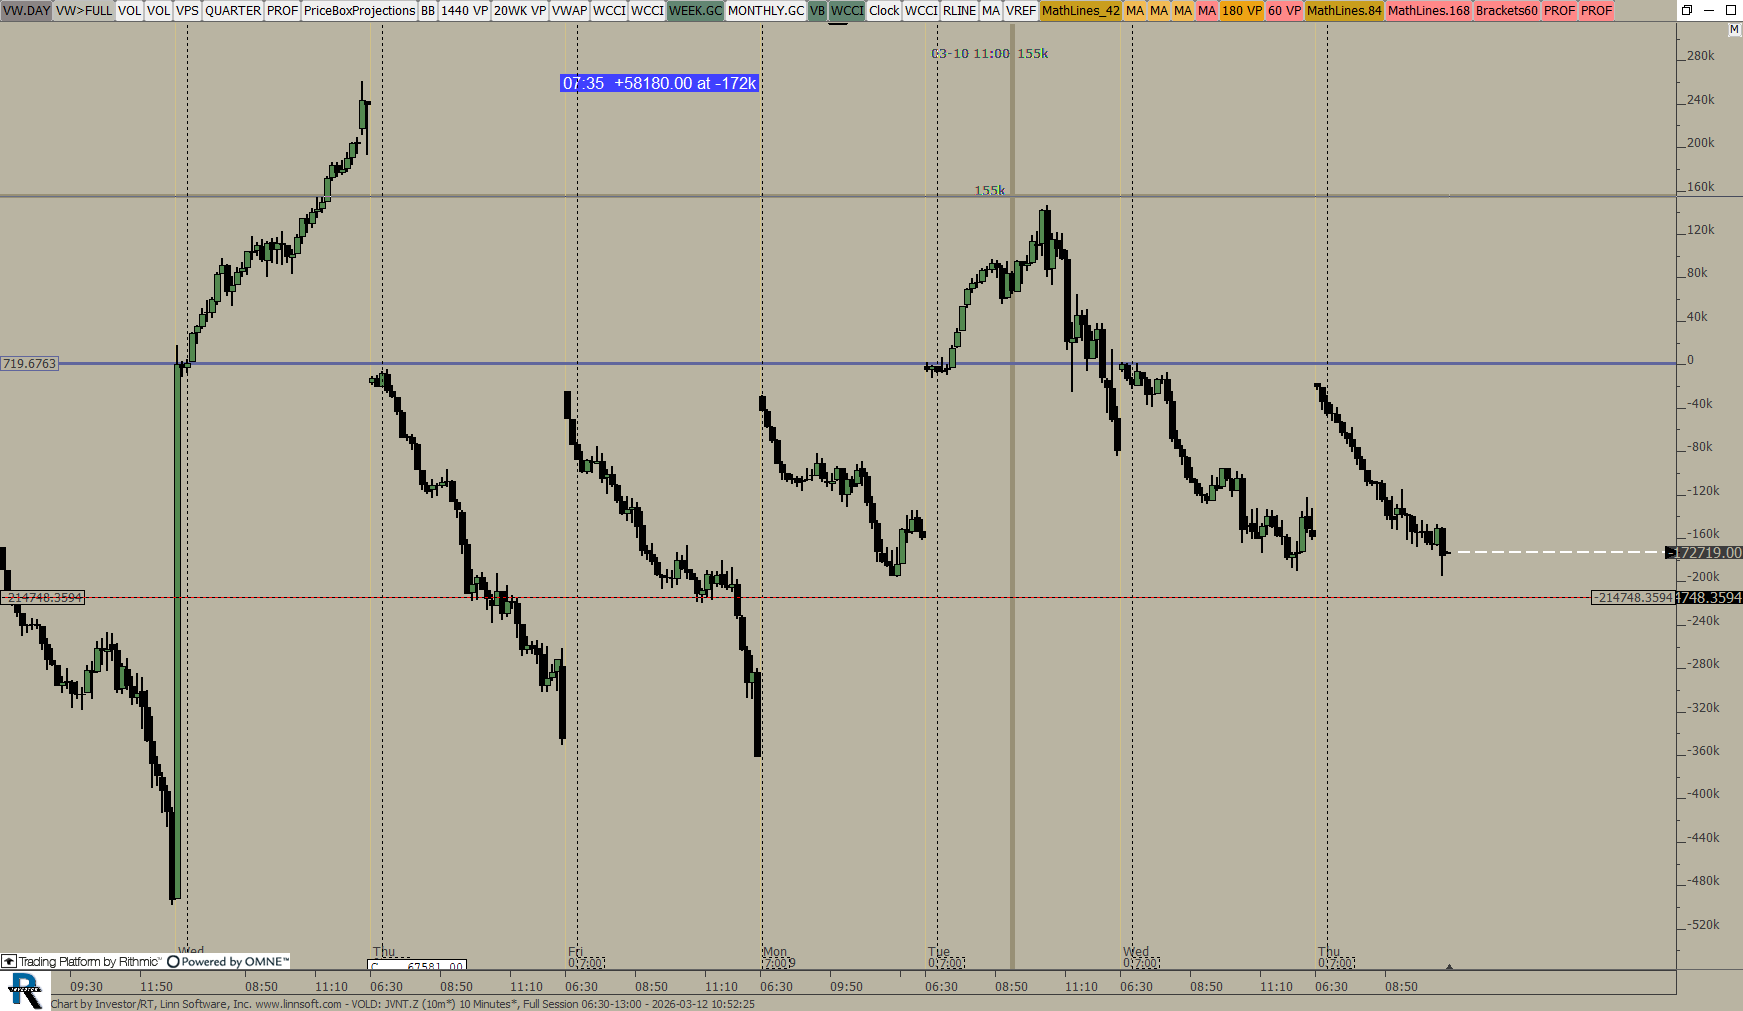 |
VOLD (JVNT.Z) ES42 [totalcount]
2 months 6 days ago
This chart was uploaded by Investor/RT 15.1.25 showing symbol: JVNT.Z. |
View |
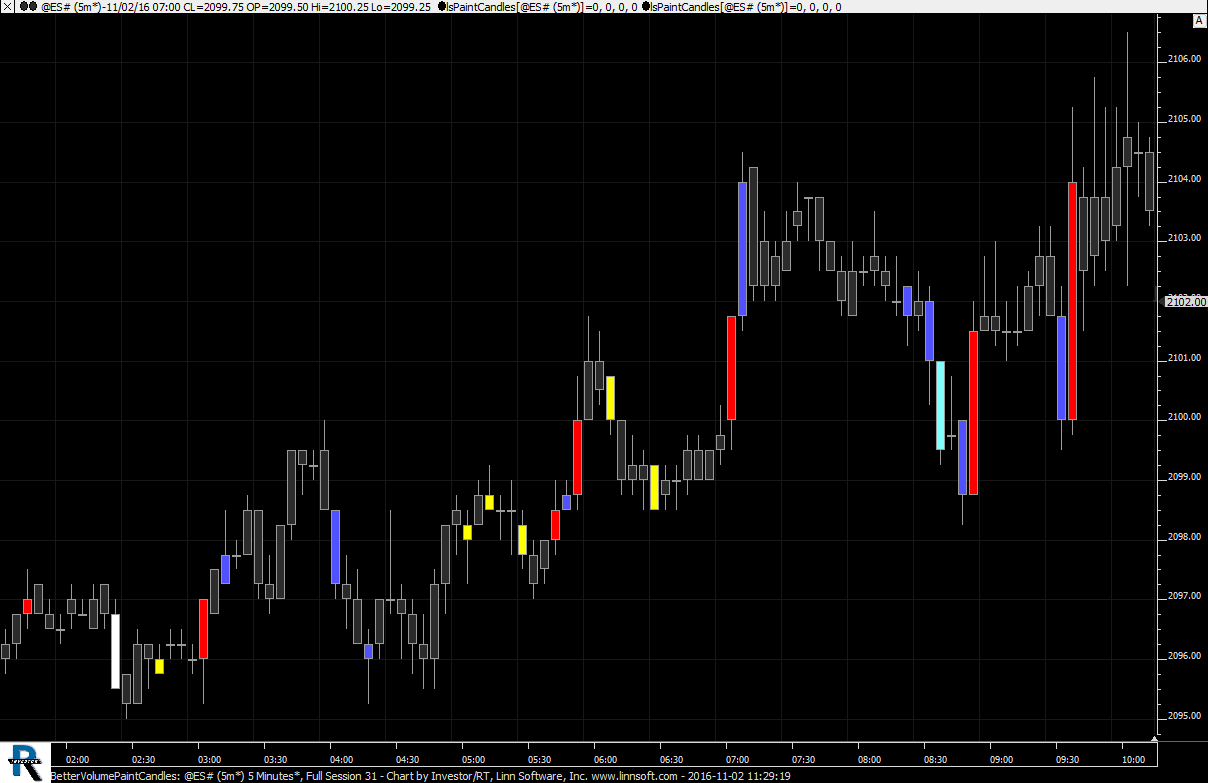 |
BetterVolumePaintCandles (@ES#) cpayne [totalcount]
9 years 8 months ago
Better Volume with Paint Candles. This chart was uploaded by Investor/RT 12.6.7 showing symbol: @ES#. |
View |
 |
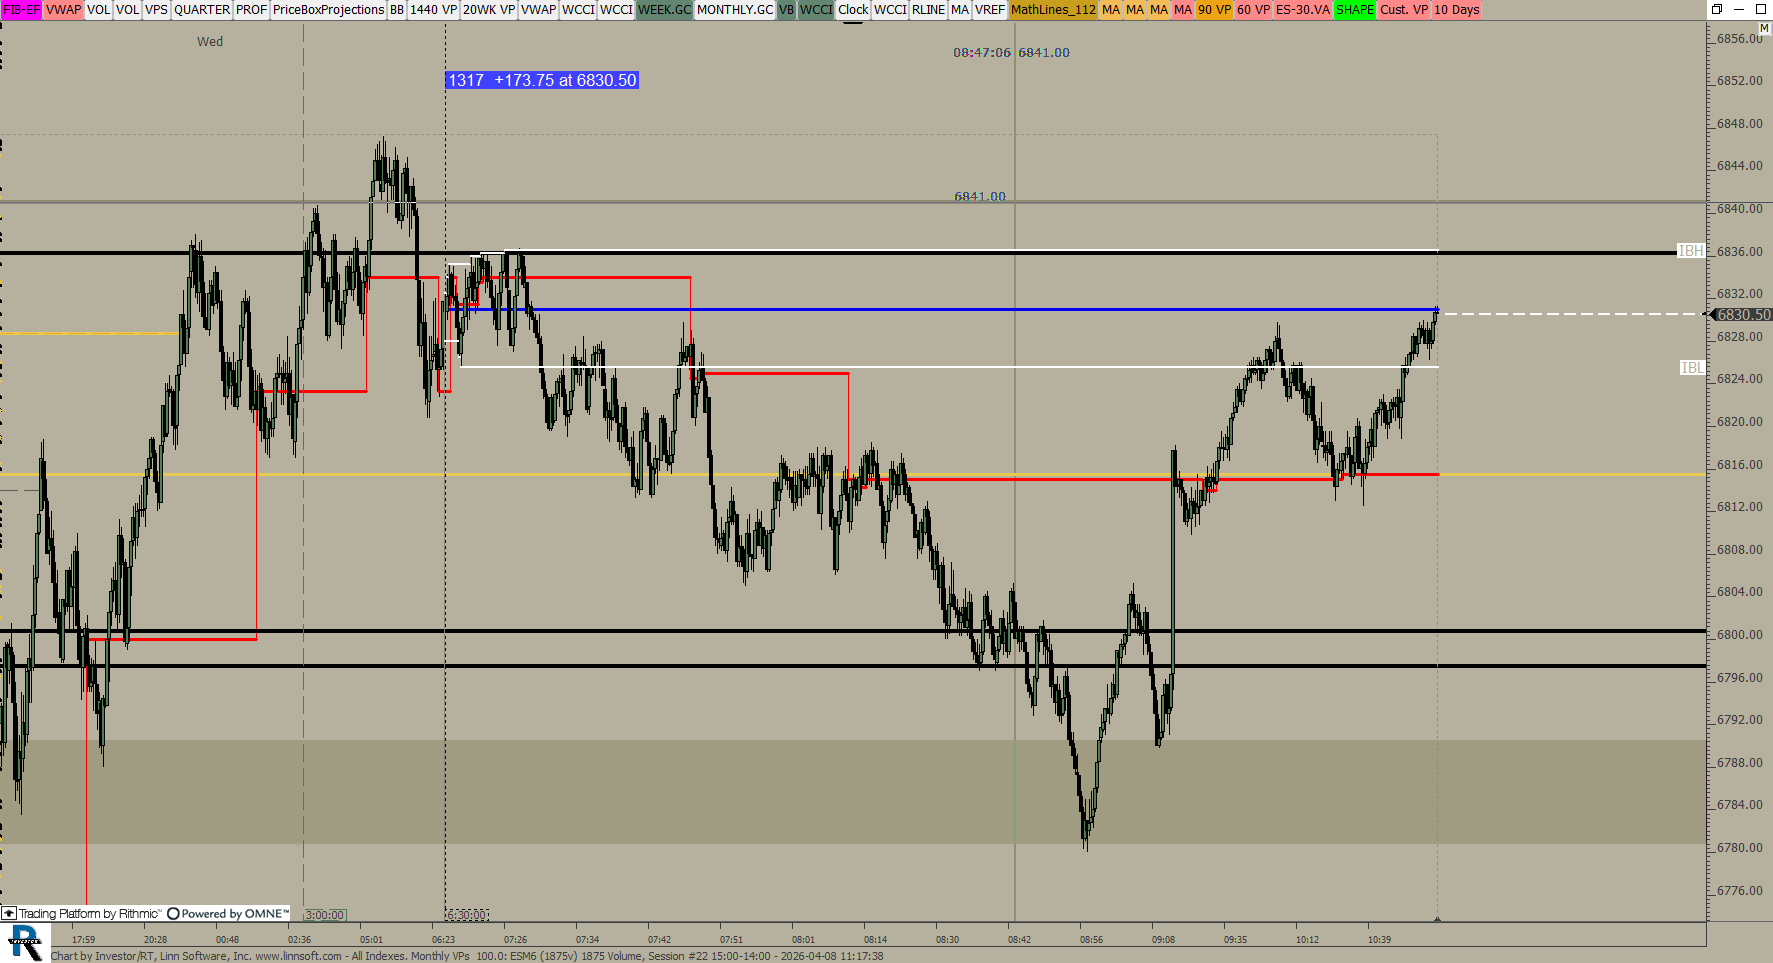
OFES (ESM6) ES42 [totalcount]
2 months 1 week ago
This chart was uploaded by Investor/RT 16.1.1 showing symbol: ESM6. |
View |
 |
ESM6 60 (NQM6) ES42 [totalcount]
2 months 1 week ago
This chart was uploaded by Investor/RT 16.1.1 showing symbol: NQM6. |
View |
 |
NQMWEEKLY (NQM6) ES42 [totalcount]
2 months 2 weeks ago
This chart was uploaded by Investor/RT 16.1.1 showing symbol: NQM6. |
View |
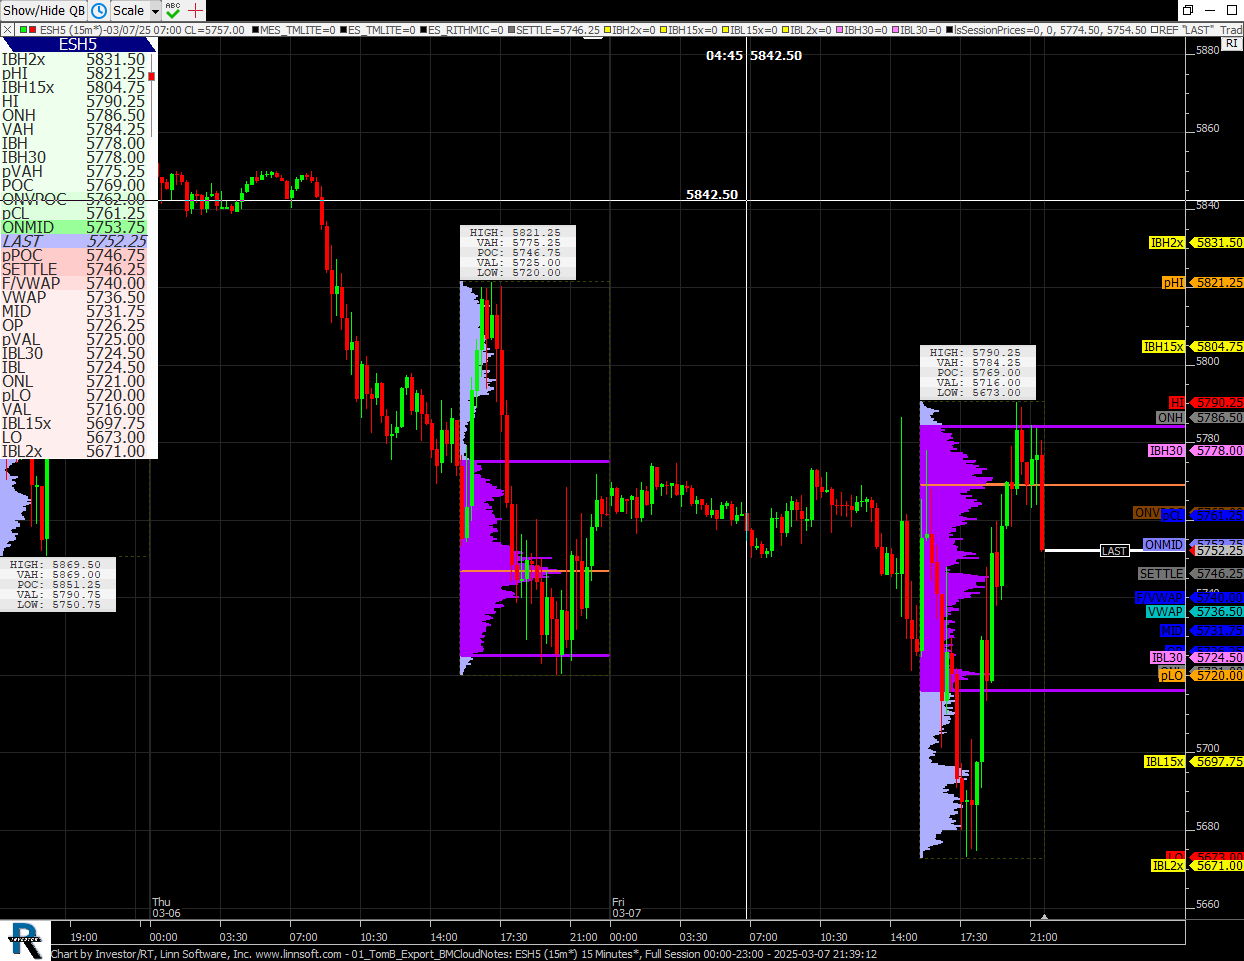 |
01 TomB Export BMCloudNotes (ESH5) Eddy [totalcount]
1 year 3 months ago
Tom B Traders Lab - Export to Bookmap Cloud Notes. This chart was uploaded by Investor/RT 16.1.1 showing symbol: ESH5. |
View |
 |
All Indexes Monthly VPs (ESM6) ES42 [totalcount]
2 months 3 weeks ago
This chart was uploaded by Investor/RT 15.1.25 showing symbol: ESM6. |
View |
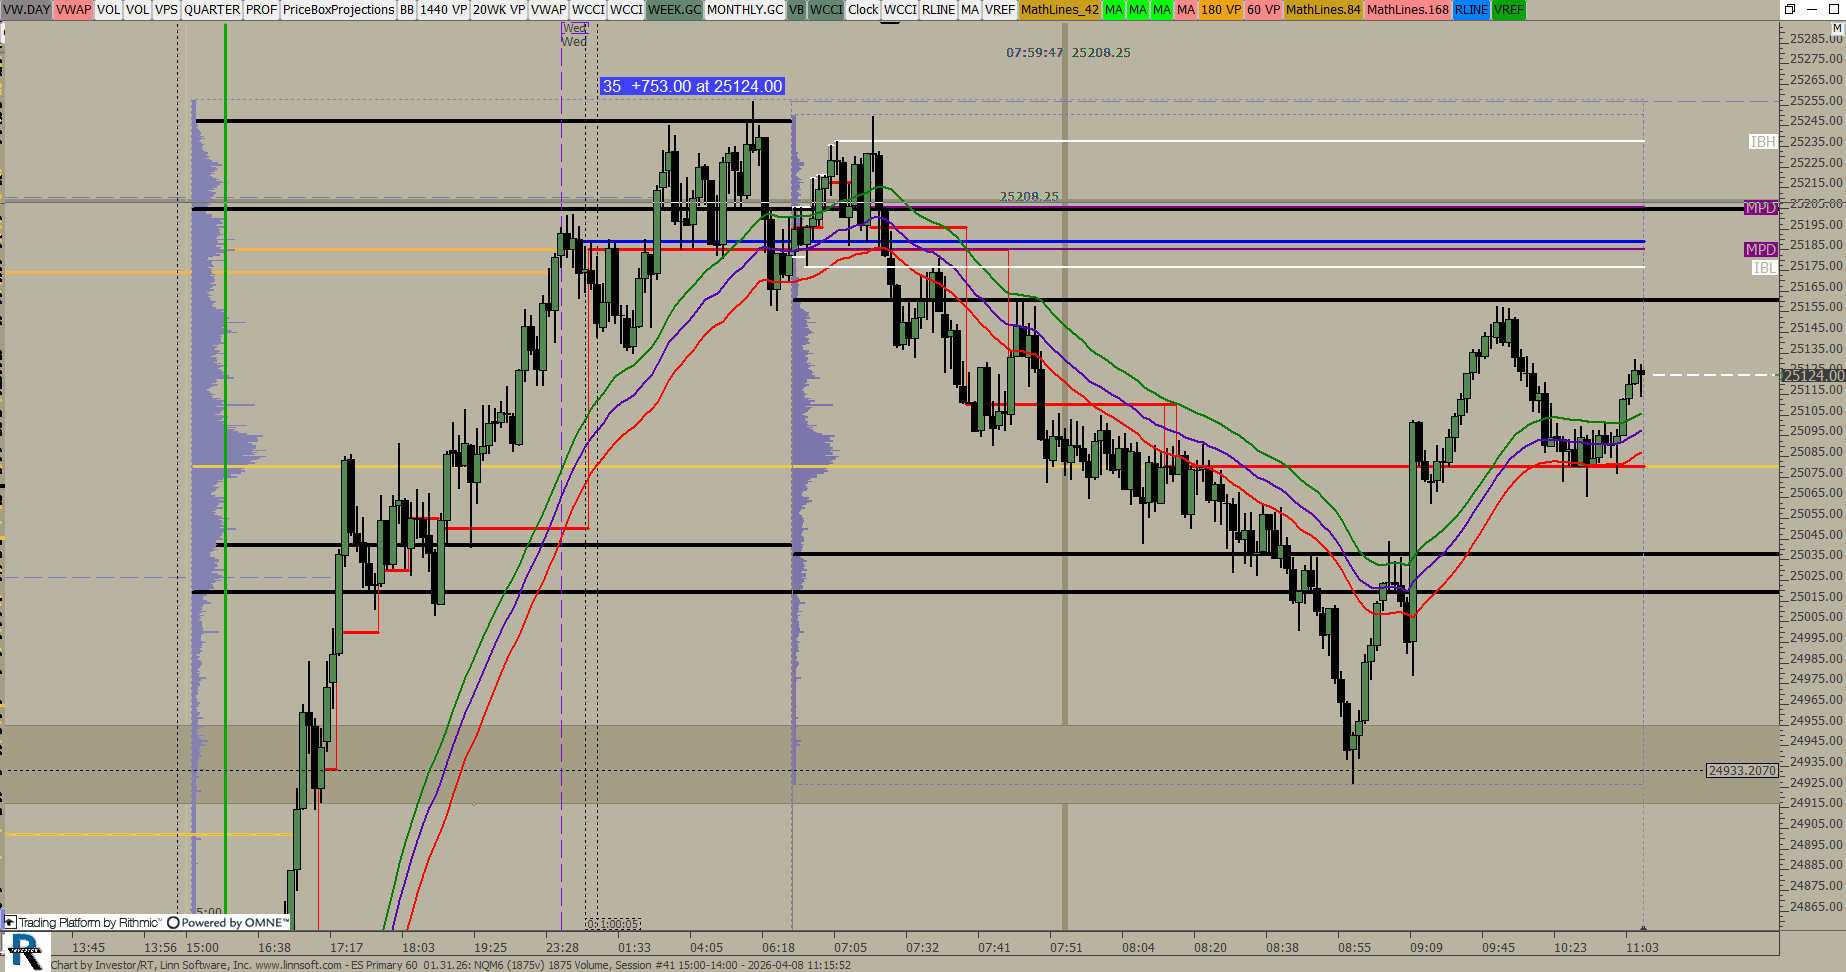 |
ES Primary 60 (NQM6) ES42 [totalcount]
2 months 3 weeks ago
This chart was uploaded by Investor/RT 15.1.25 showing symbol: NQM6. |
View |
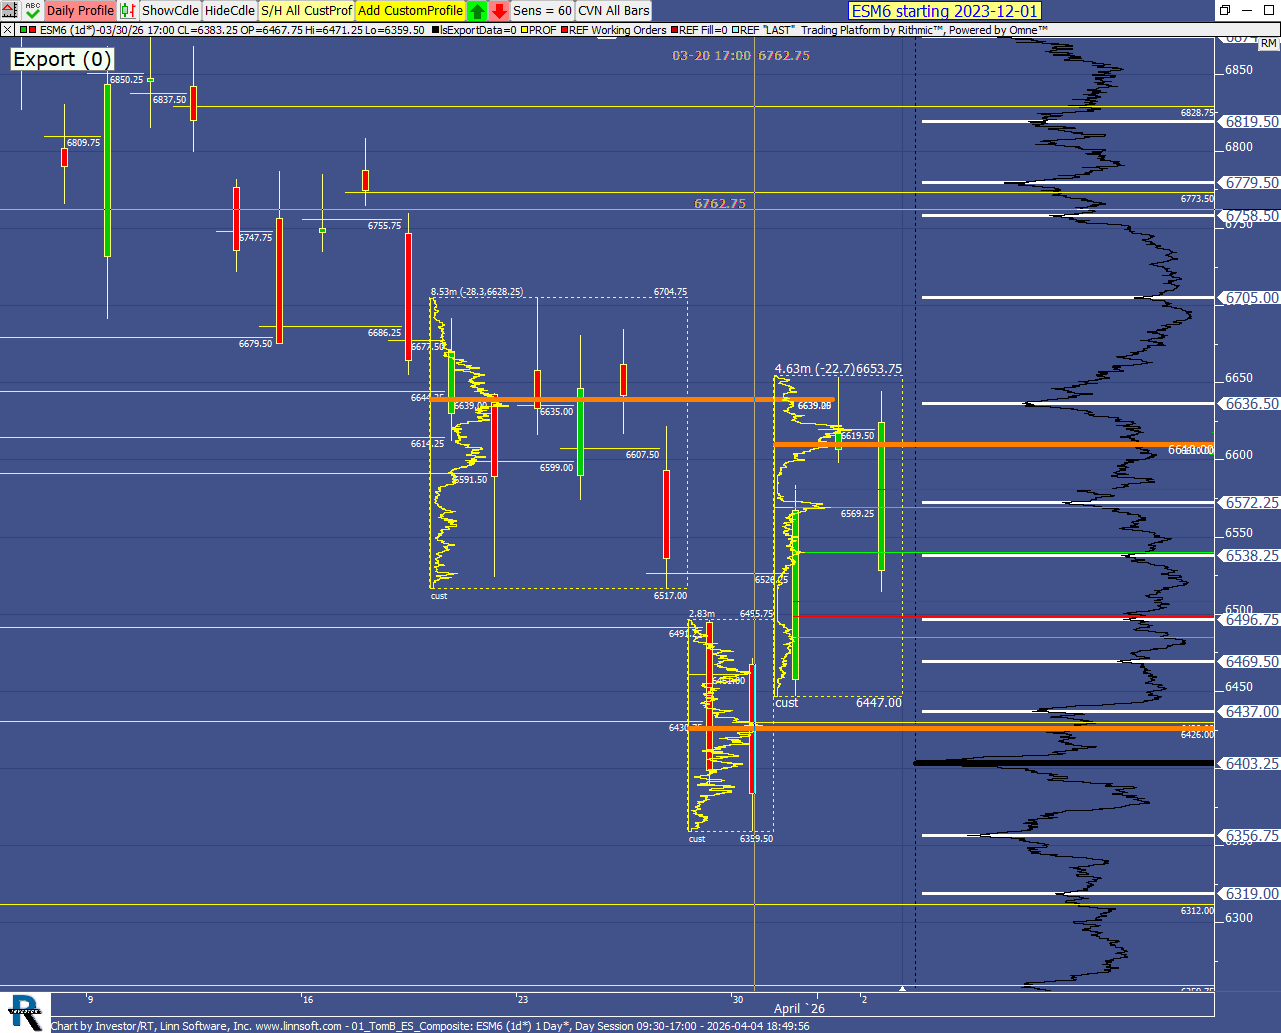 |
01 TomB ES Composite (ESM6) Tanner [totalcount]
2 months 3 weeks ago
JC EXPORT. This chart was uploaded by Investor/RT 16.1.1 showing symbol: ESM6. |
View |
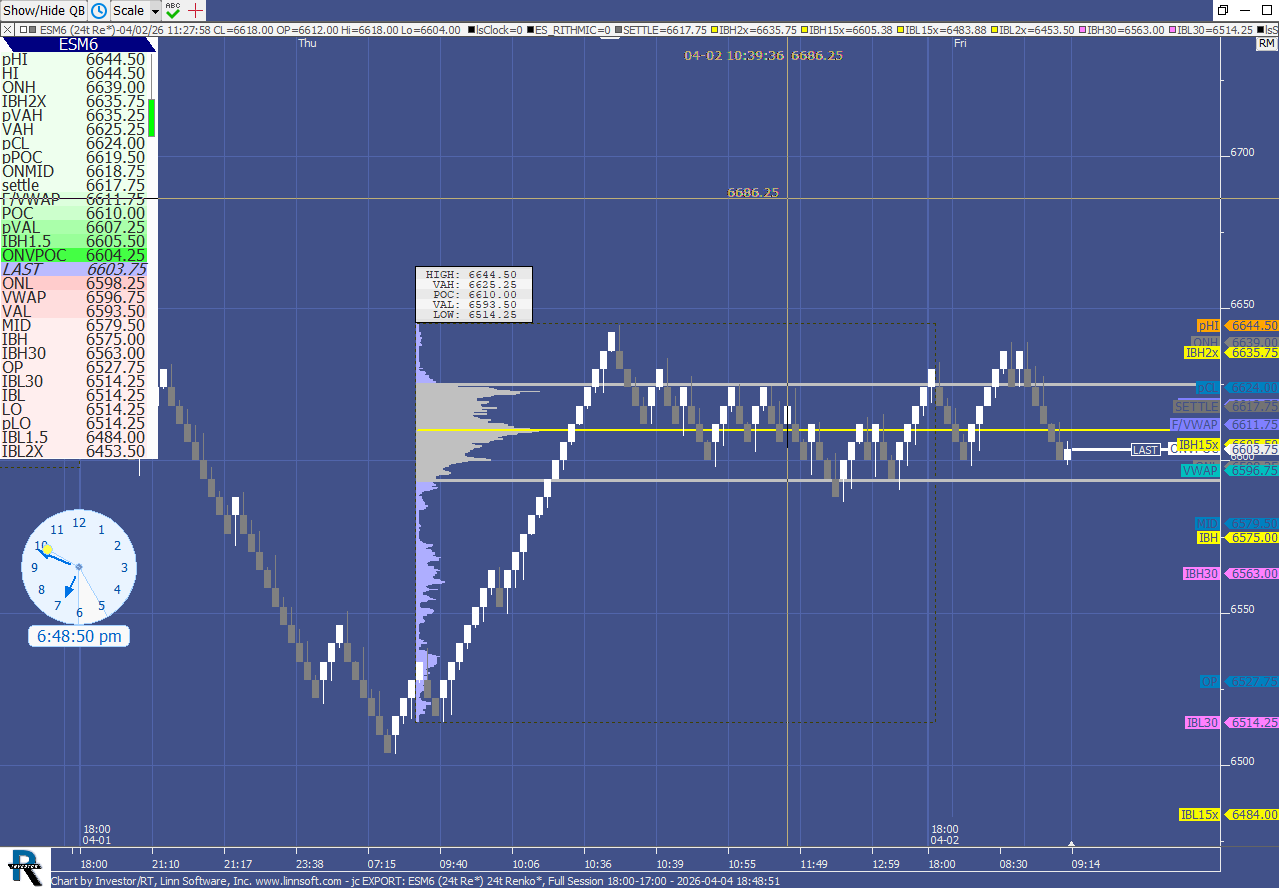 |
jc EXPORT (ESM6) Tanner [totalcount]
2 months 3 weeks ago
JC EXPORT. This chart was uploaded by Investor/RT 16.1.1 showing symbol: ESM6. |
View |
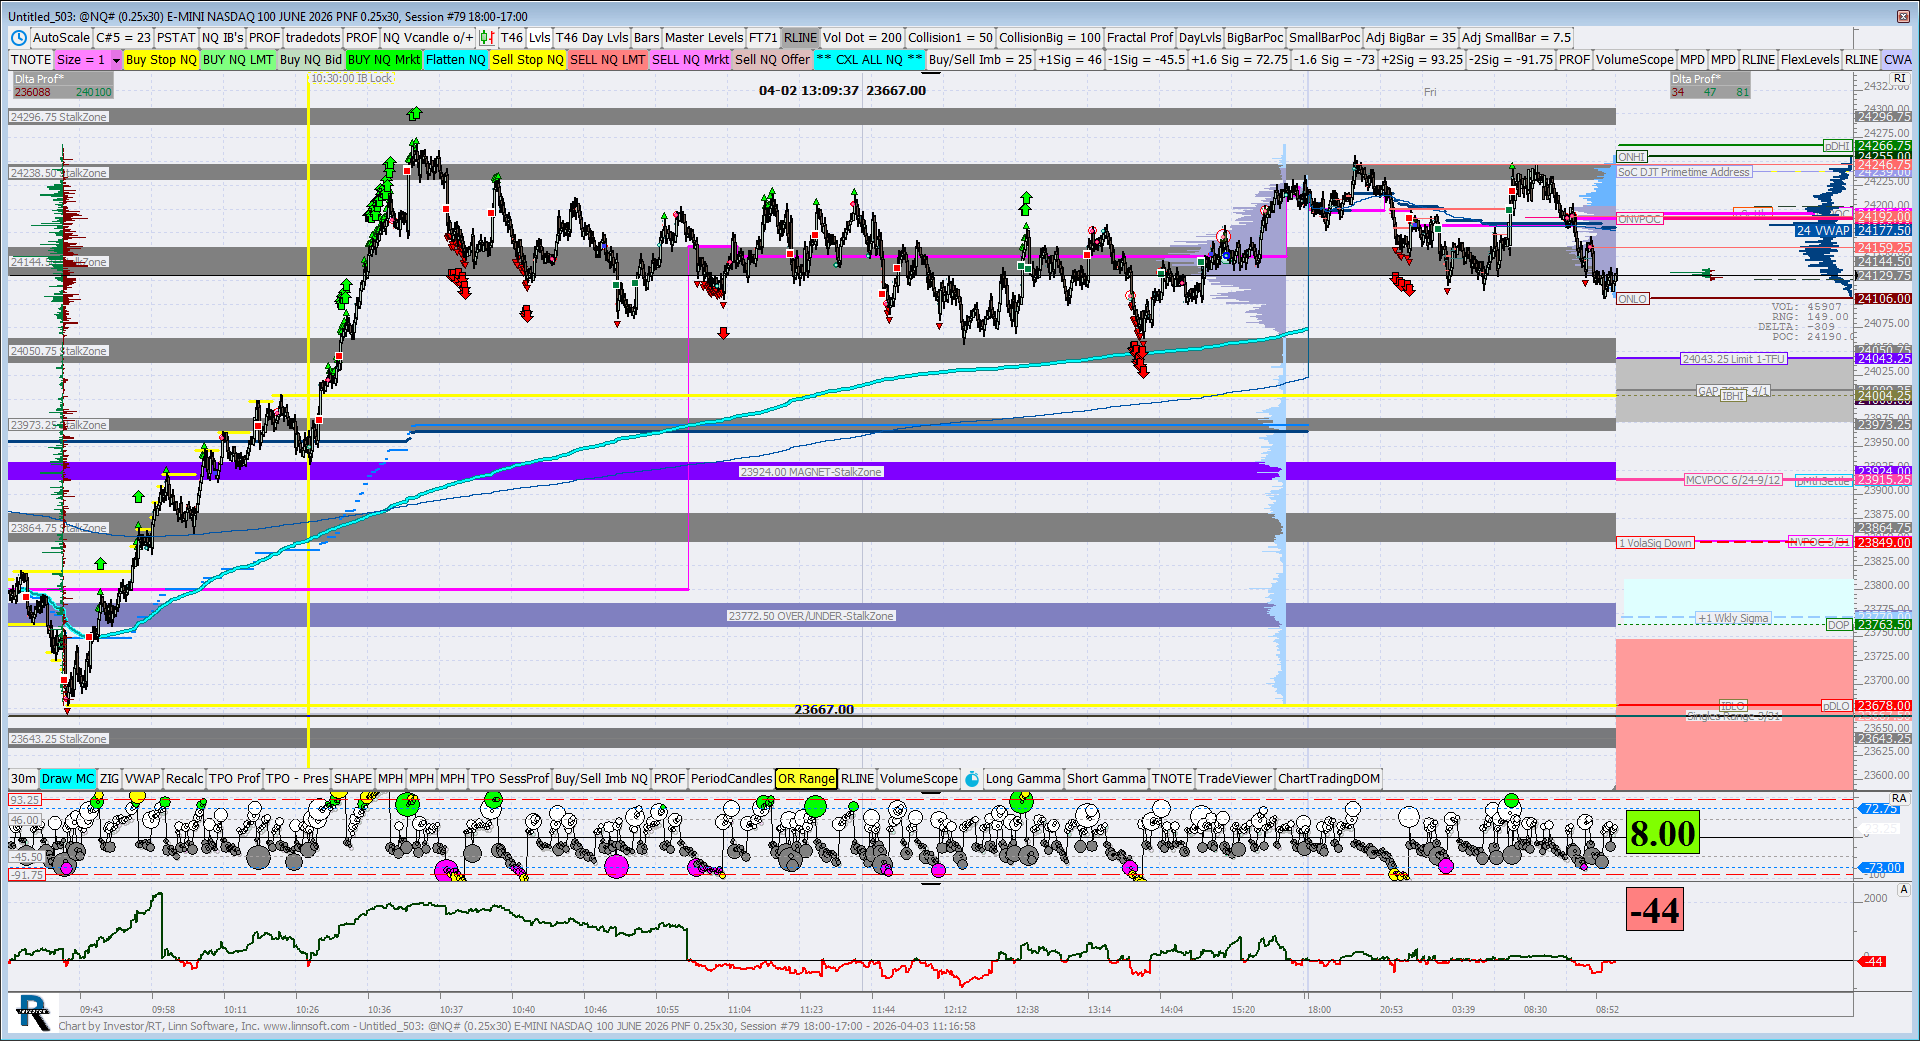 |
Untitled (@NQ#) jayski51369 [totalcount]
2 months 3 weeks ago
This chart was uploaded by Investor/RT 12.7.6 showing symbol: @NQ#. |
View |