 |
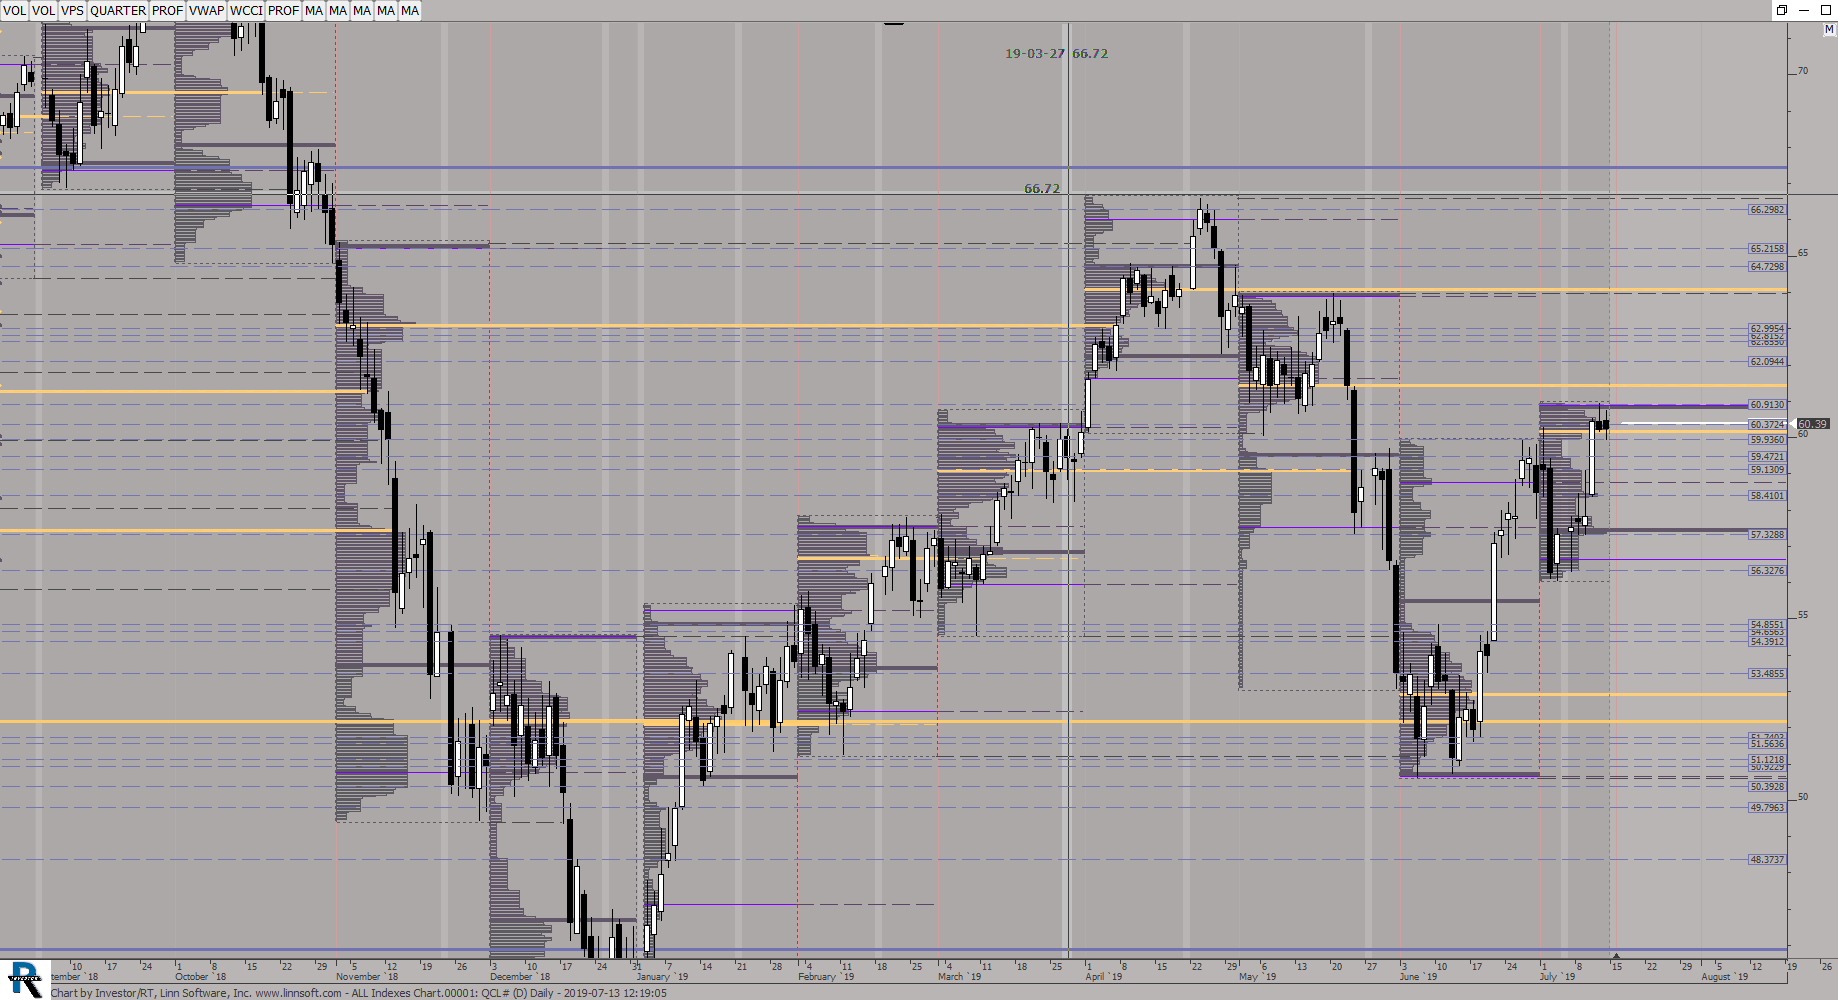
ALL Indexes Chart (QCL#) ES42 [totalcount]
7 years 2 weeks ago
This chart was uploaded by Investor/RT 13.5.24 showing symbol: QCL#. |
View |
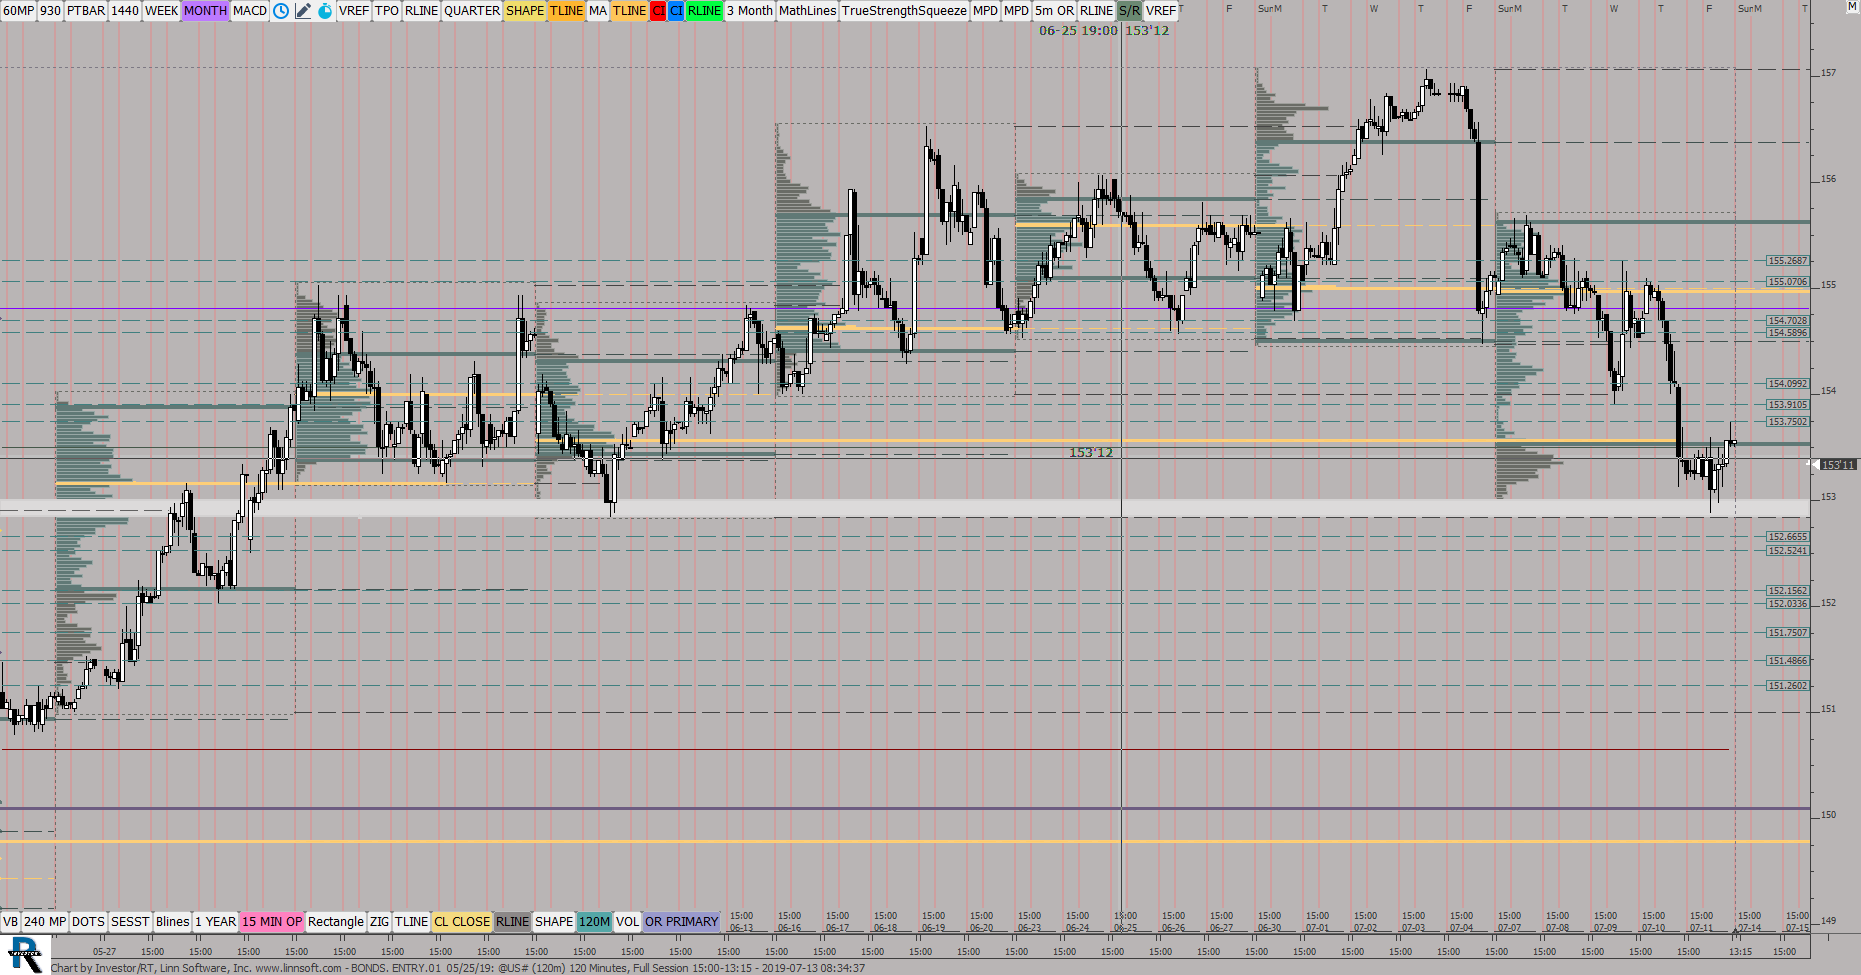 |
BONDS ENTRY01 05 25 (@US#) ES42 [totalcount]
7 years 2 weeks ago
Daily Profiles/ Vol Entry Candles. This chart was uploaded by Investor/RT 13.5.24 showing symbol: @US#. |
View |
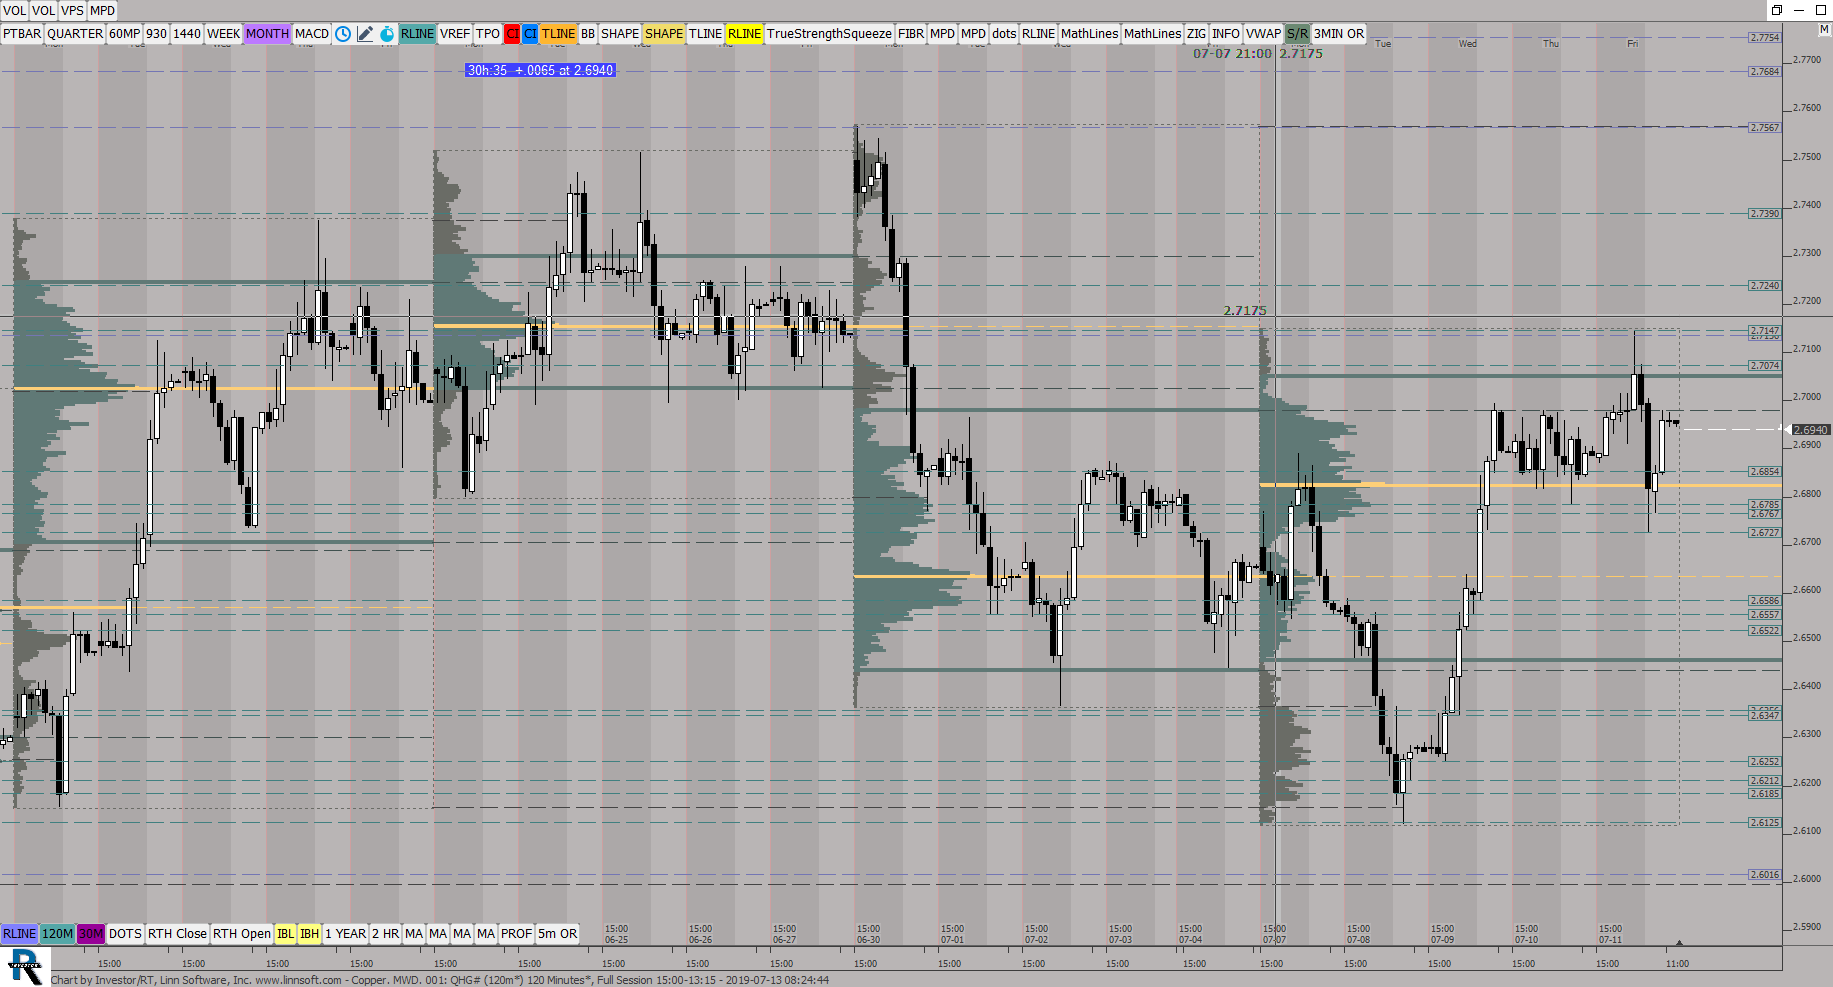 |
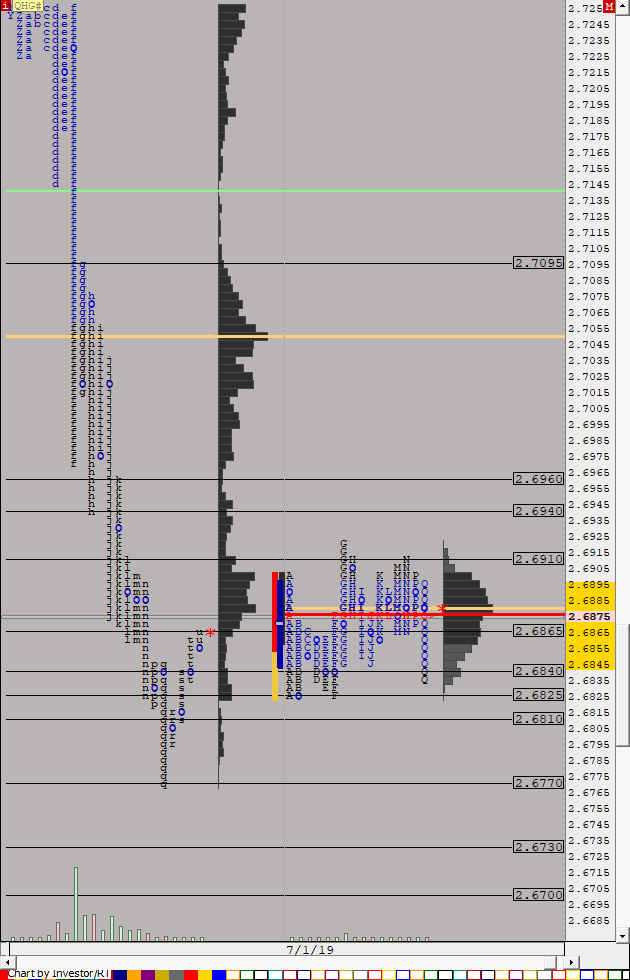
Copper MWD (QHG#) ES42 [totalcount]
7 years 2 weeks ago
This chart was uploaded by Investor/RT 13.5.24 showing symbol: QHG#. |
View |
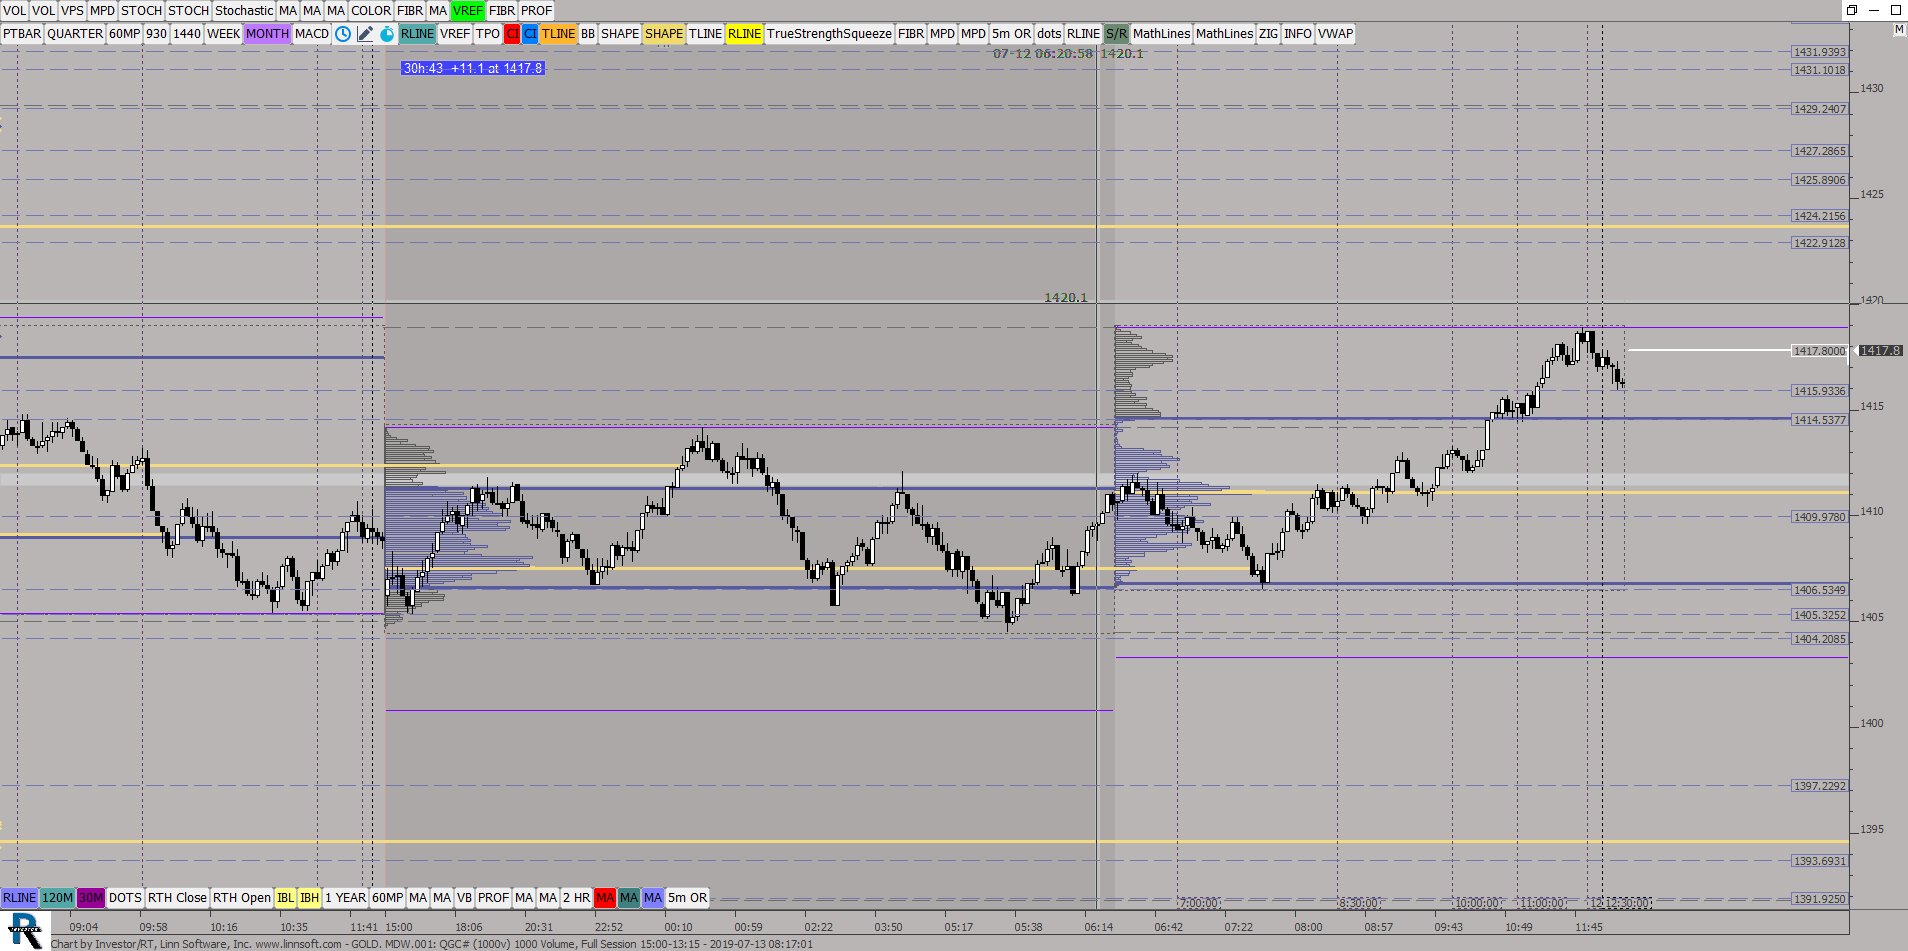 |
GOLD MDW (QGC#) ES42 [totalcount]
7 years 2 weeks ago
This chart was uploaded by Investor/RT 13.5.24 showing symbol: QGC#. |
View |
 |
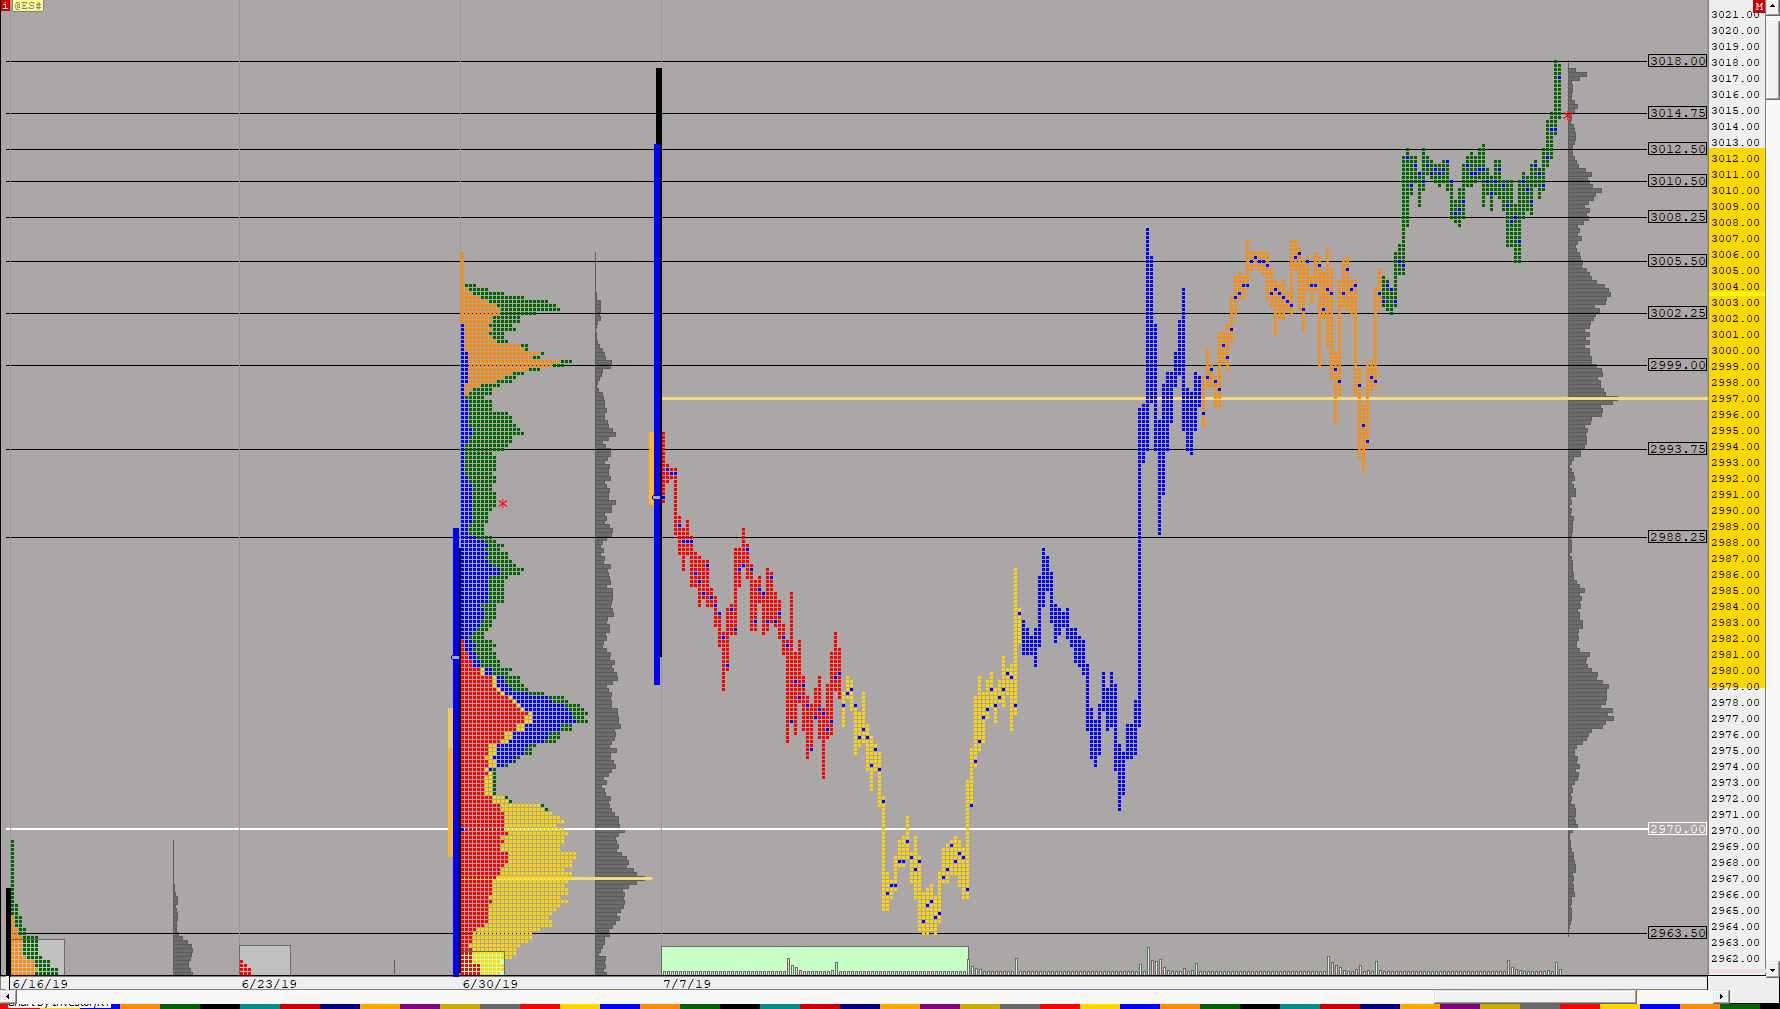
MPRTHVALUE (@ES#) ES42 [totalcount]
7 years 2 weeks ago
This chart was uploaded by Investor/RT 13.5.24 showing symbol: @ES#. |
View |
 |
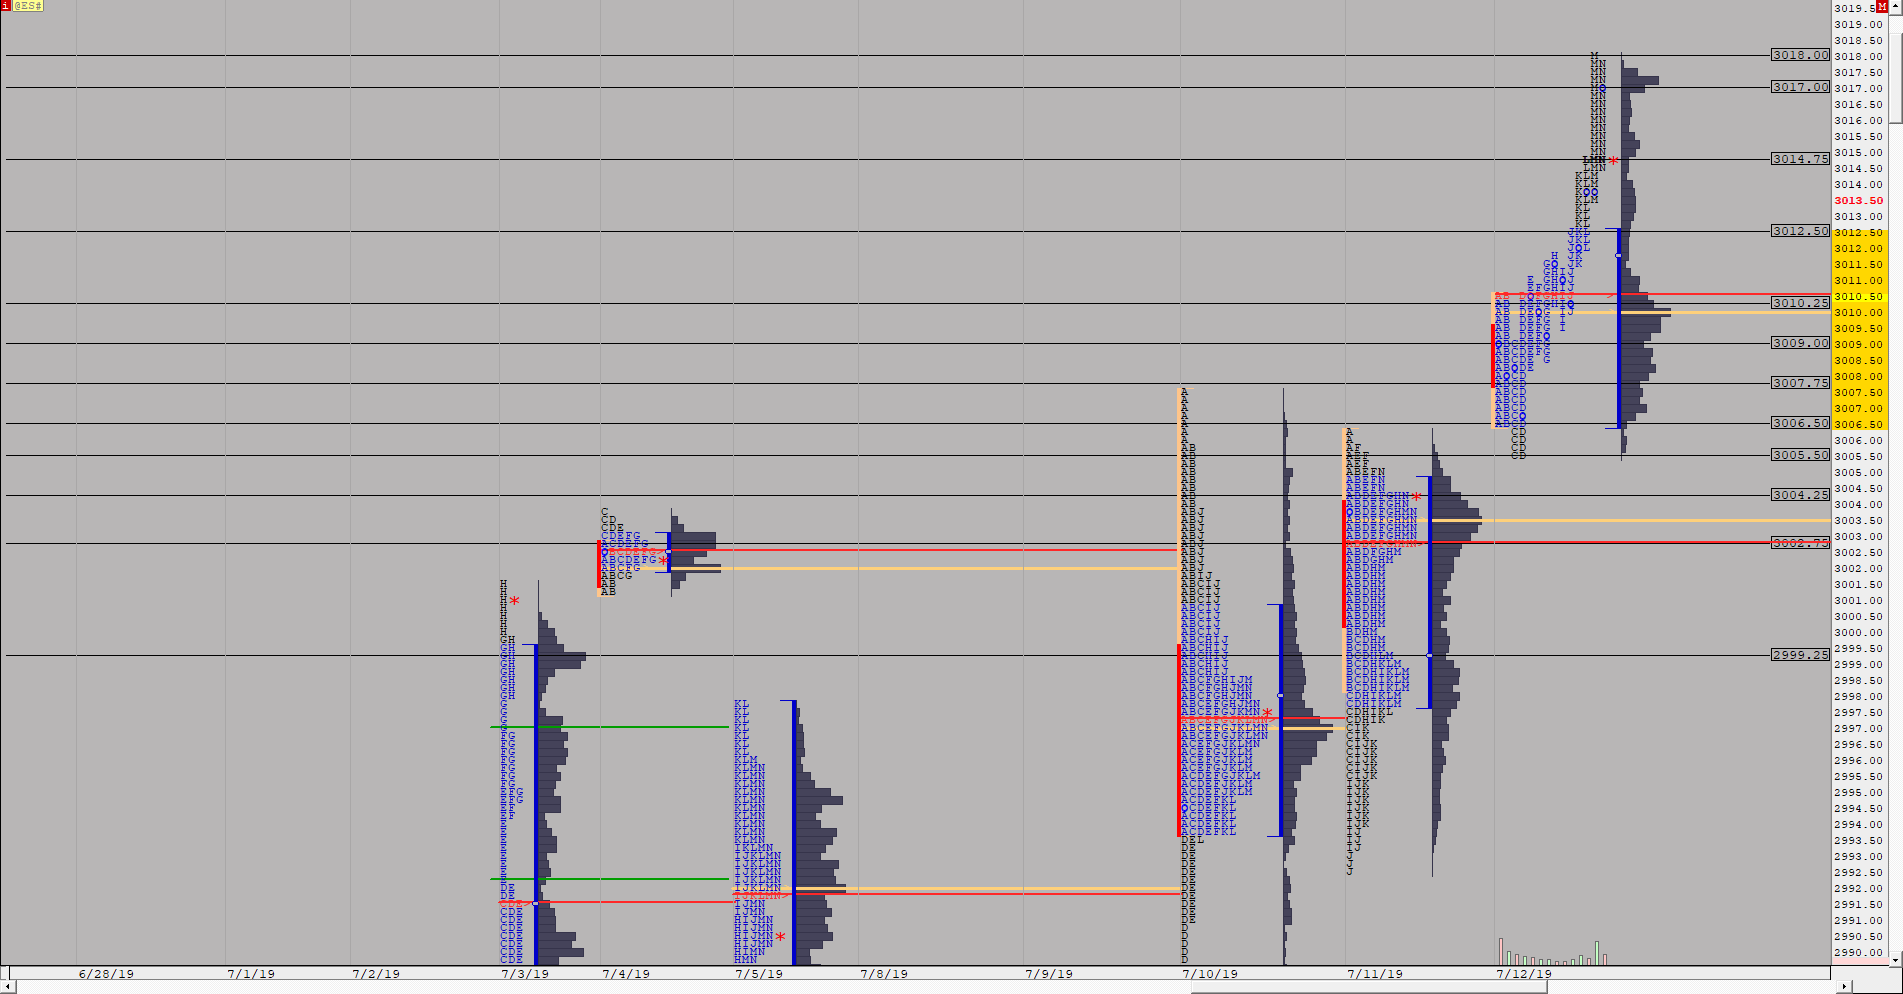
WEEKLY TPOALL INDEXES (@ES#) ES42 [totalcount]
7 years 2 weeks ago
This chart was uploaded by Investor/RT 13.5.12 showing symbol: @ES#. |
View |
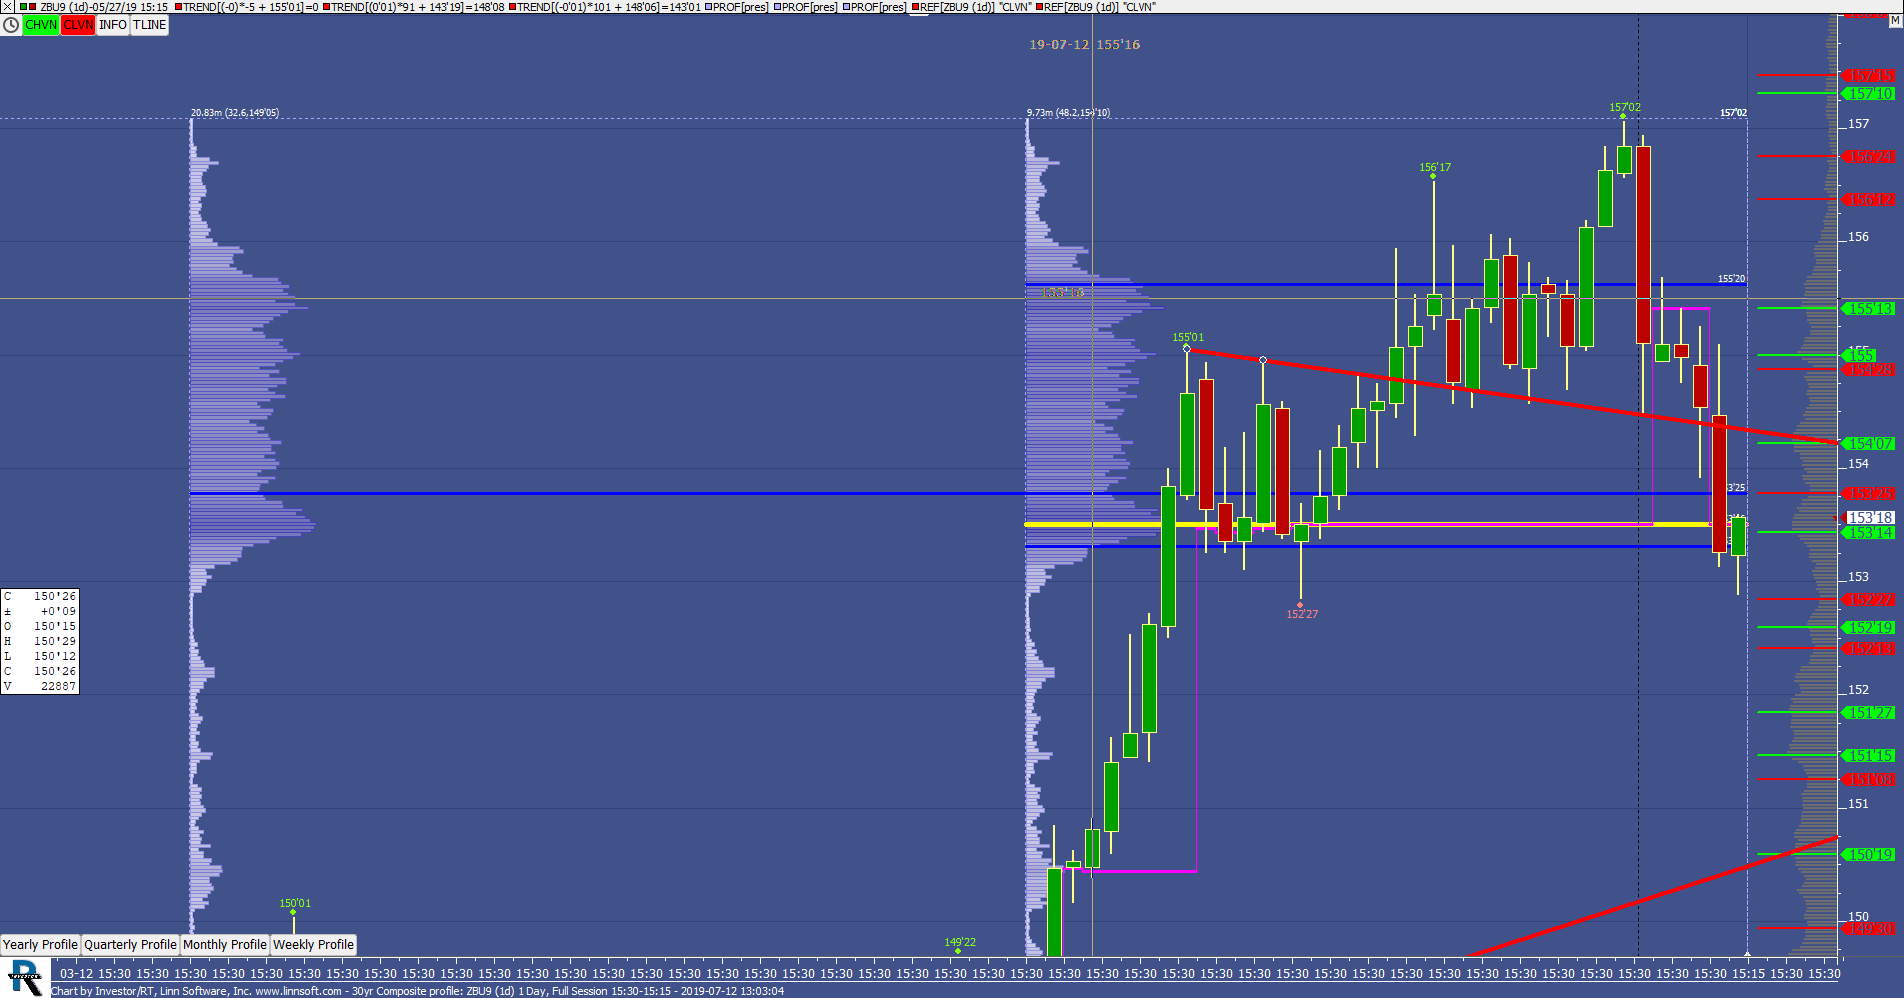 |
30yr Composite profile (ZBU9) scottz46 [totalcount]
7 years 2 weeks ago
This chart was uploaded by Investor/RT 13.5.24 showing symbol: ZBU9. |
View |
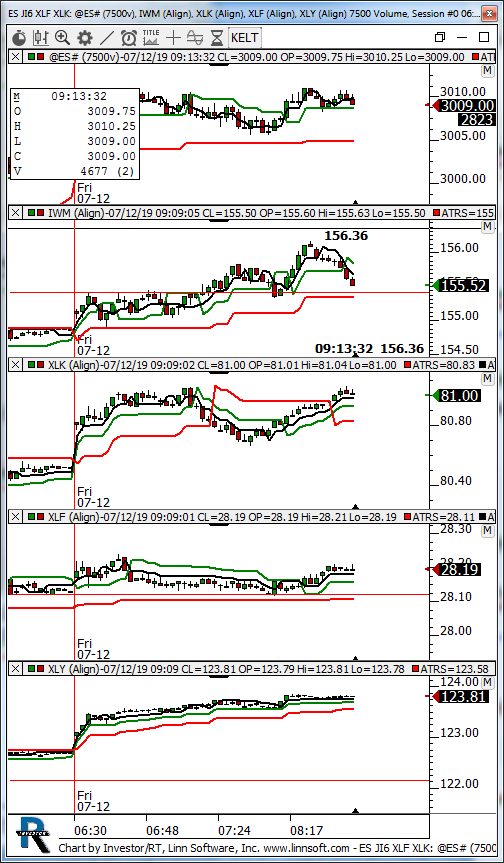 |
ES JI6 XLF XLK (@ES#) kencassorla [totalcount]
7 years 2 weeks ago
etf. This chart was uploaded by Investor/RT 13.5.24 showing symbol: @ES#. |
View |
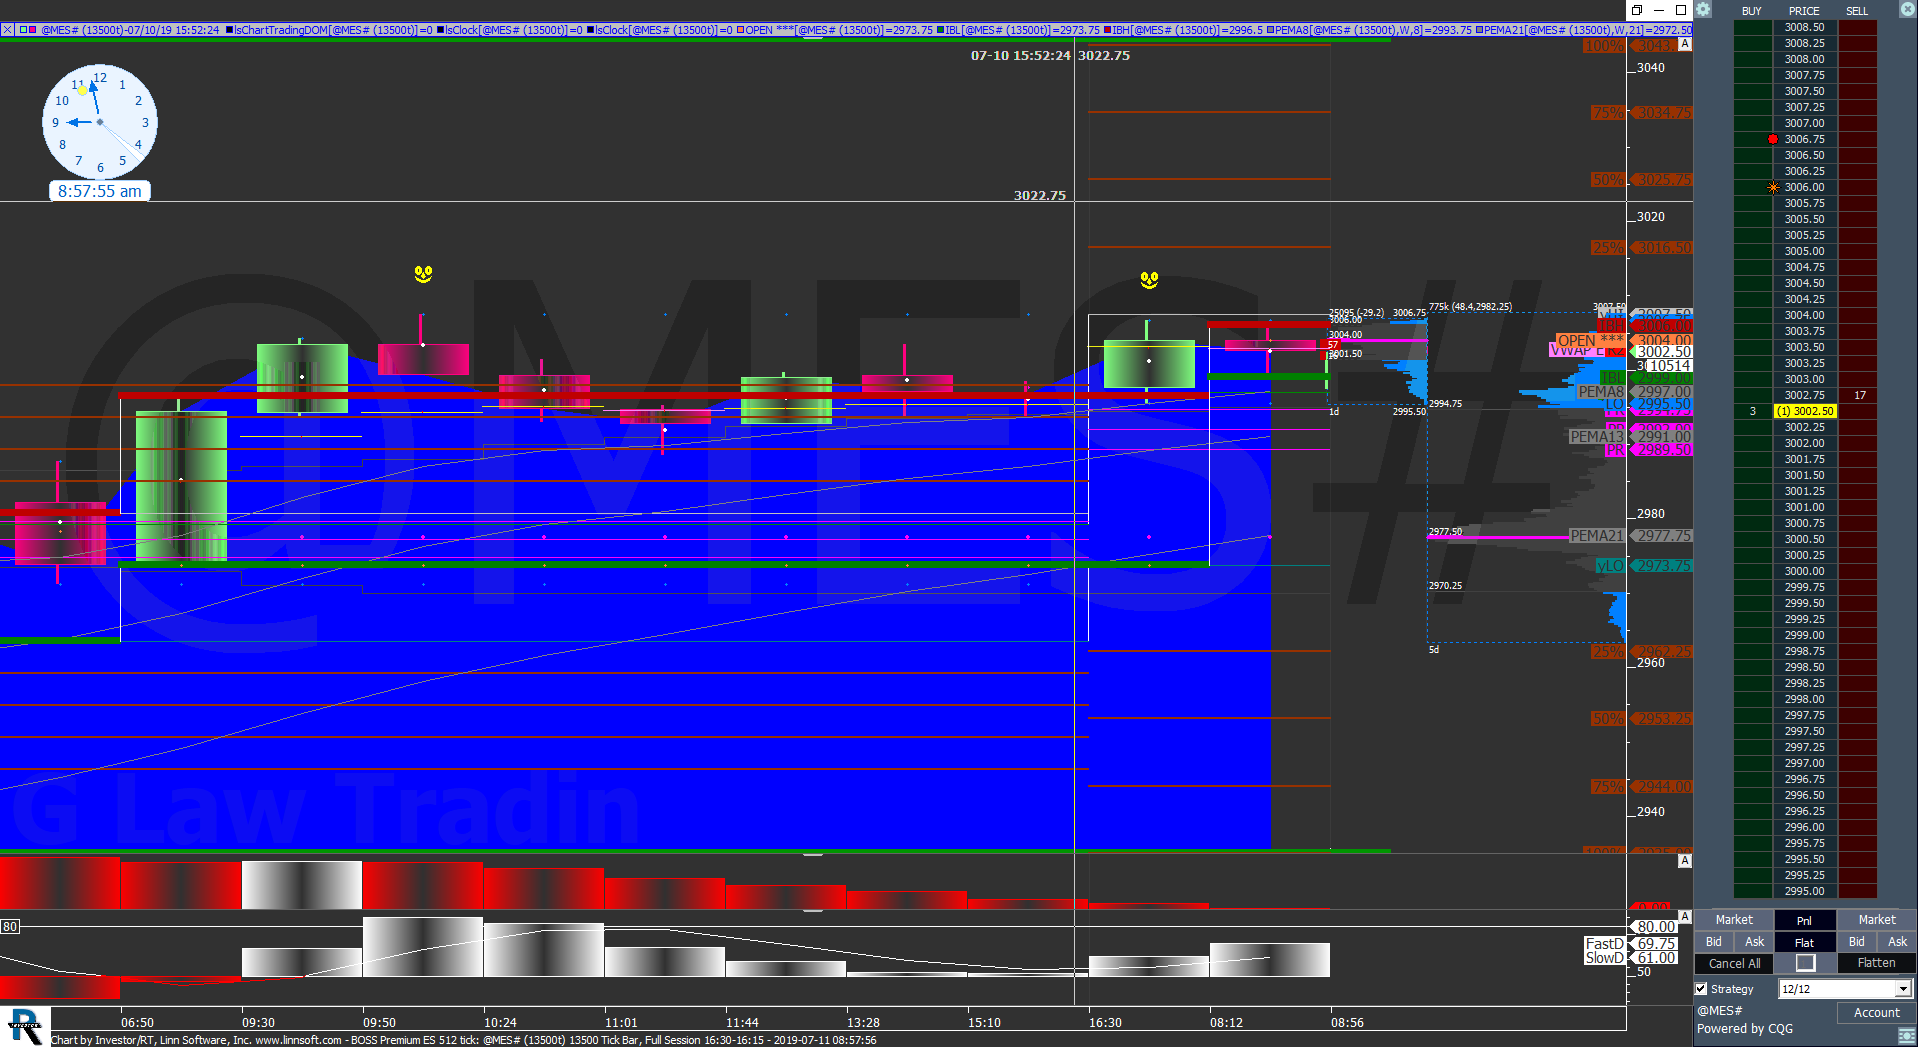 |
BOSS Premium ES 512 tick (@MES#) Geoff Lawrence [totalcount]
7 years 3 weeks ago
This chart was uploaded by Investor/RT 13.5.24 showing symbol: @MES#. |
View |
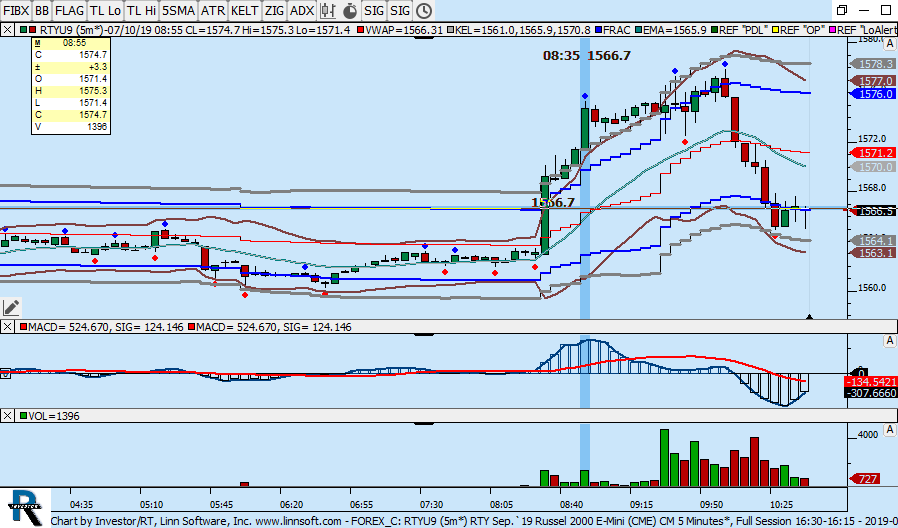 |
FOREX C (RTYU9) boris-libman [totalcount]
7 years 3 weeks ago
This chart was uploaded by Investor/RT 13.5.24 showing symbol: RTYU9. |
View |
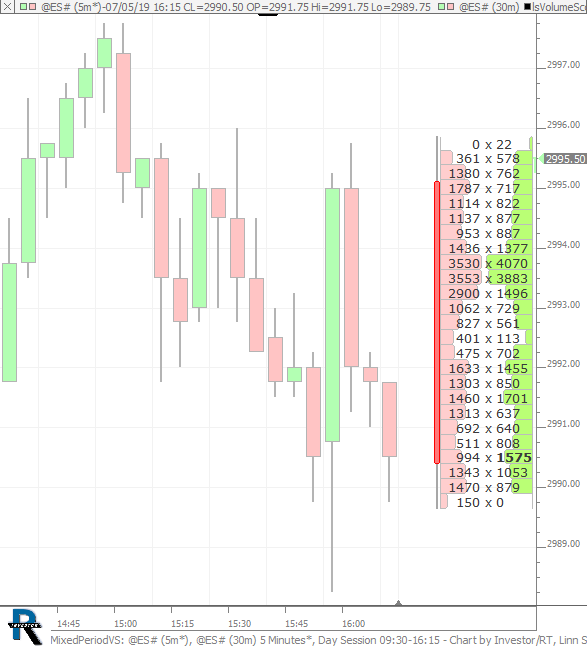 |
MixedPeriodVS (@ES#) cpayne [totalcount]
7 years 3 weeks ago
This chart was uploaded by Investor/RT 13.5.25 showing symbol: @ES#. |
View |
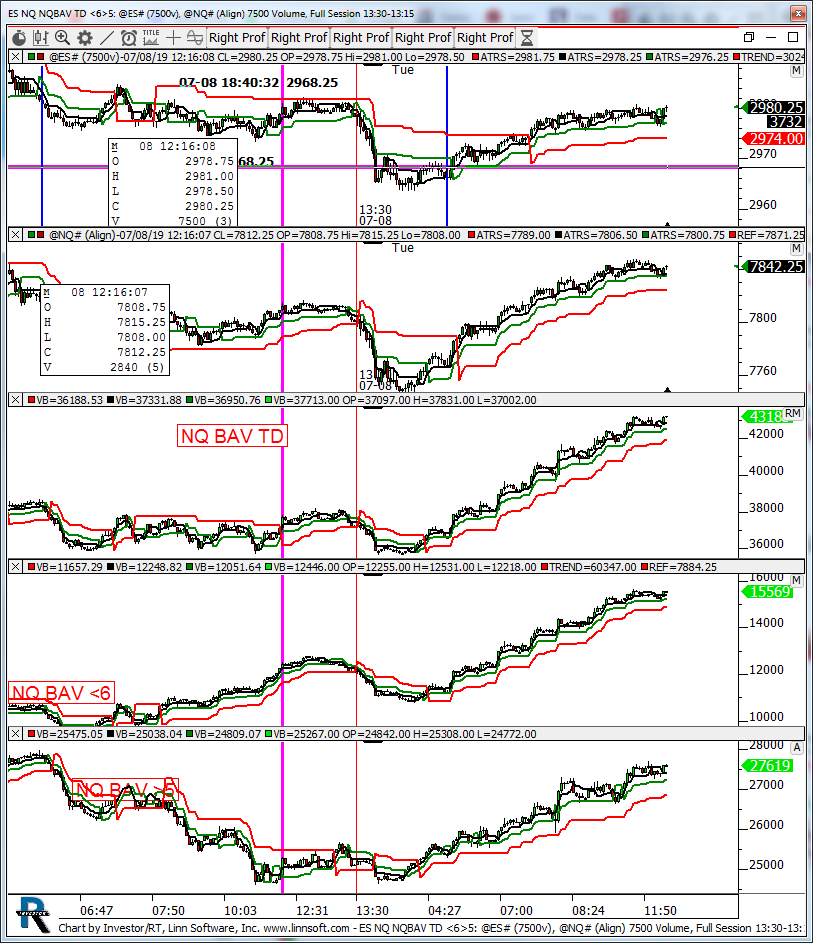 |
ES NQ NQBAV TD 65 (@ES#) kencassorla [totalcount]
7 years 3 weeks ago
NQ subs. This chart was uploaded by Investor/RT 13.5.24 showing symbol: @ES#. |
View |
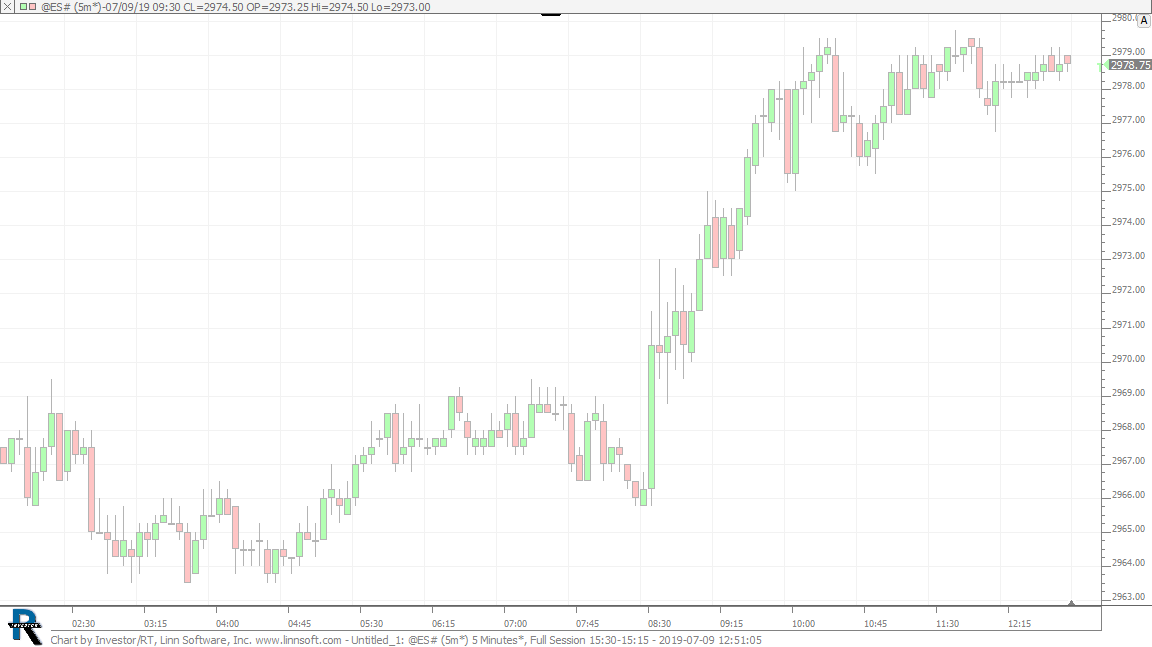 |
Untitled 1 (@ES#) 3 Bill Griffin [totalcount]
7 years 3 weeks ago
This chart was uploaded by Investor/RT 13.5.25 showing symbol: @ES#. |
View |
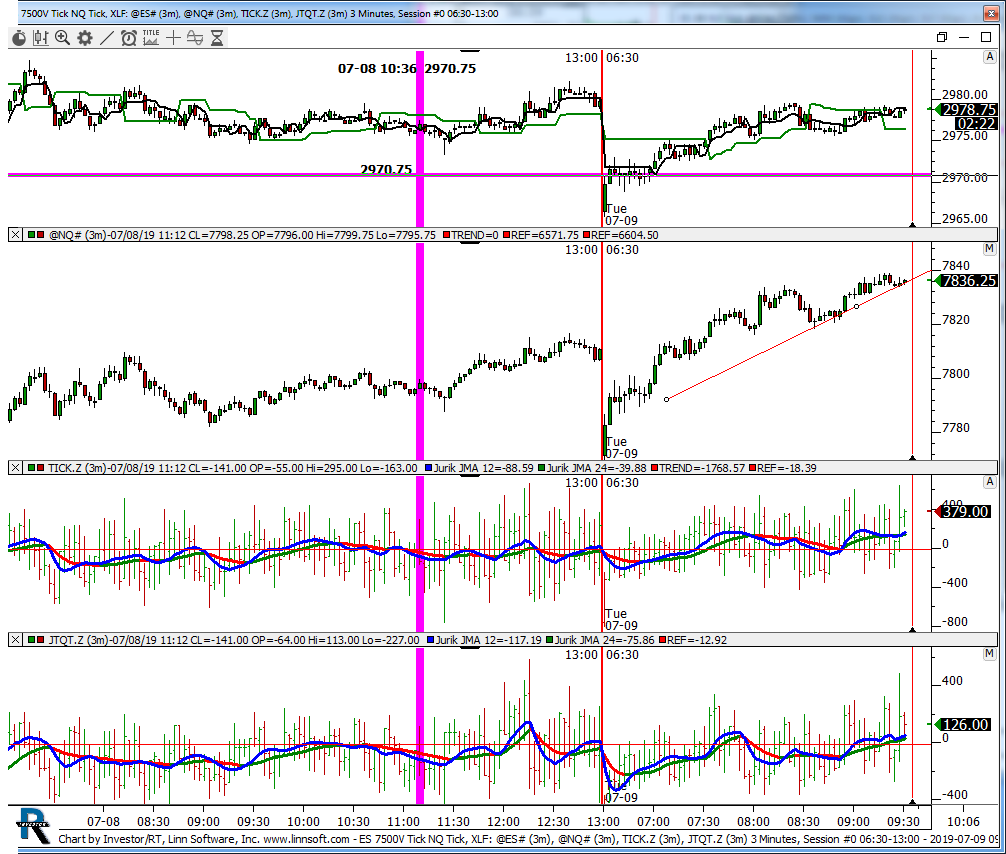 |
ES 7500V Tick NQ Tick XLF (@ES#) kencassorla [totalcount]
7 years 3 weeks ago
es xlf. This chart was uploaded by Investor/RT 13.5.12 showing symbol: @ES#. |
View |
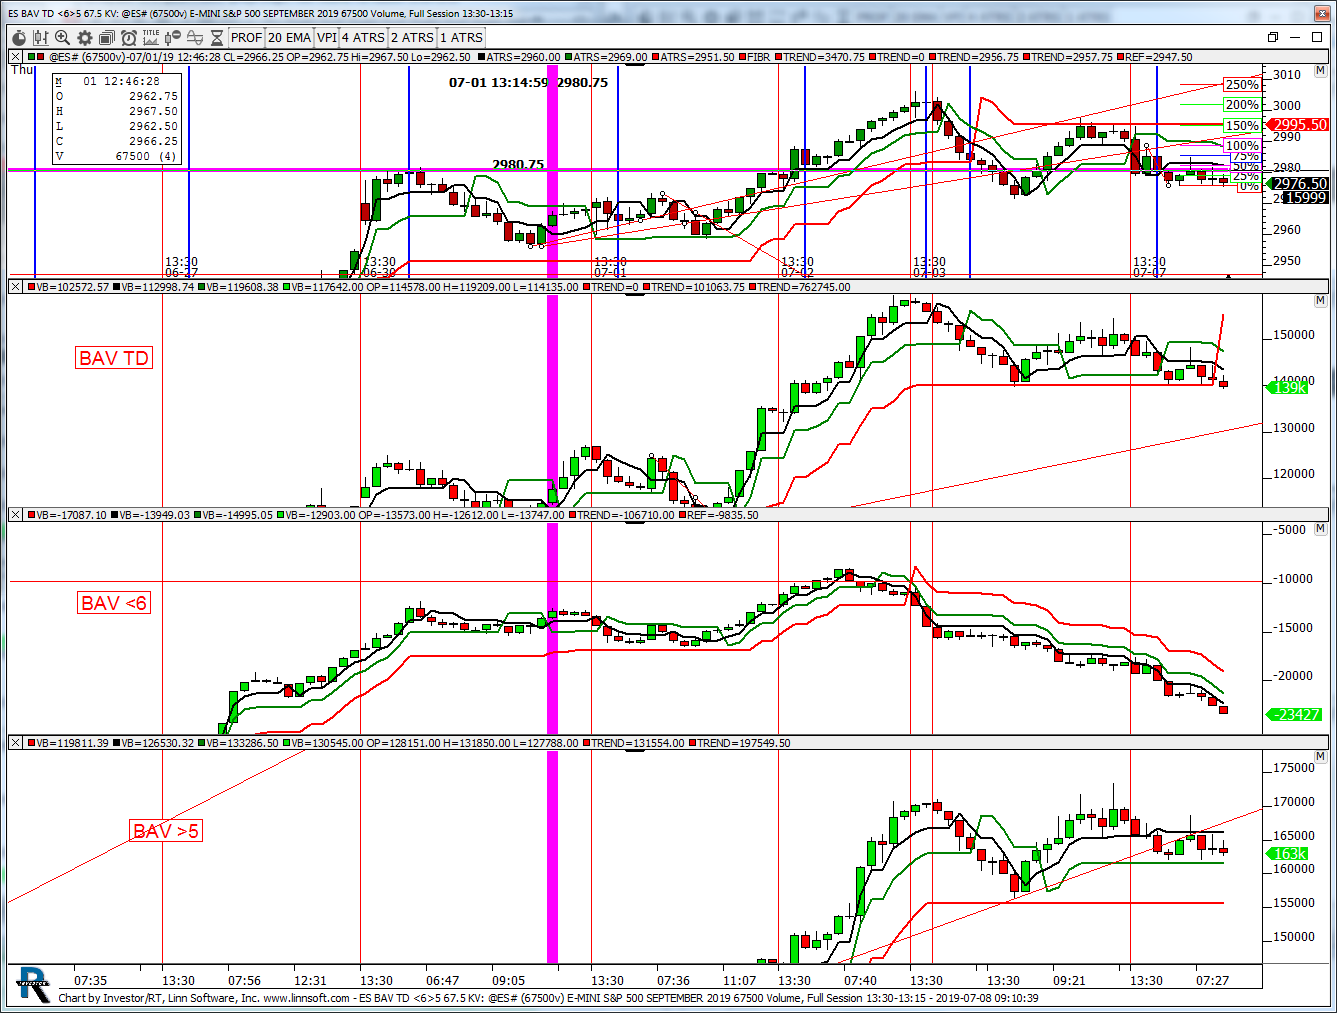 |
ES BAV TD 65 675 KV (@ES#) kencassorla [totalcount]
7 years 3 weeks ago
67.5 kv subs. This chart was uploaded by Investor/RT 13.5.24 showing symbol: @ES#. |
View |
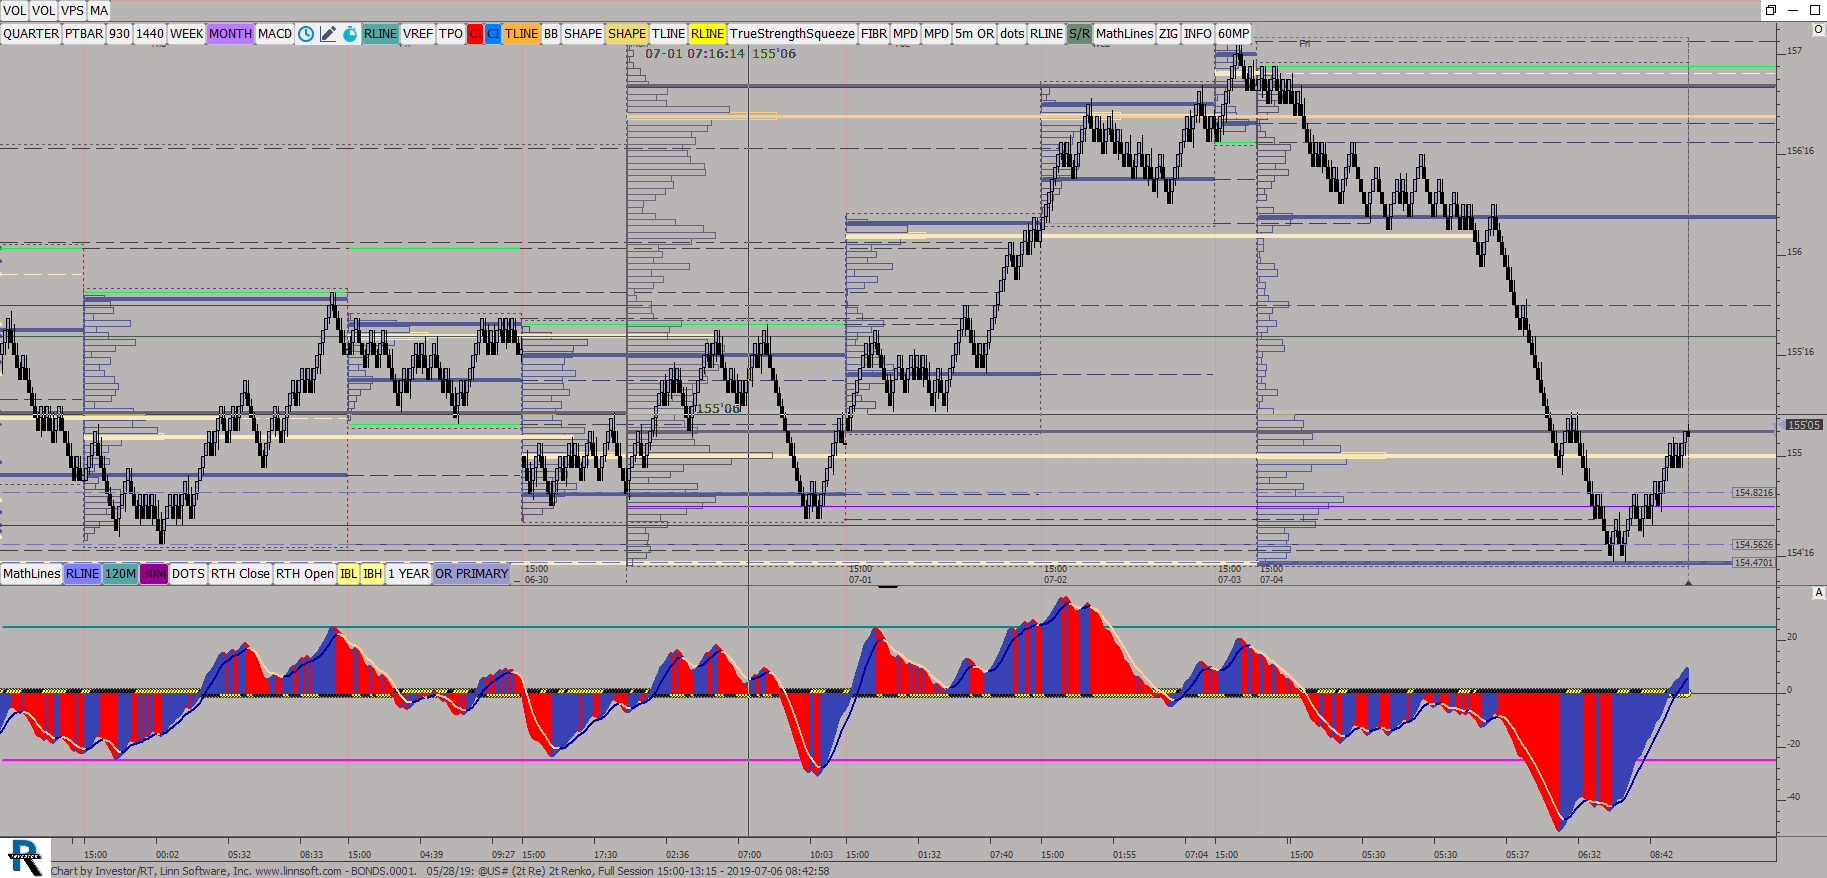 |
BONDS0001 05 28 (@US#) ES42 [totalcount]
7 years 3 weeks ago
This chart was uploaded by Investor/RT 13.5.24 showing symbol: @US#. |
View |
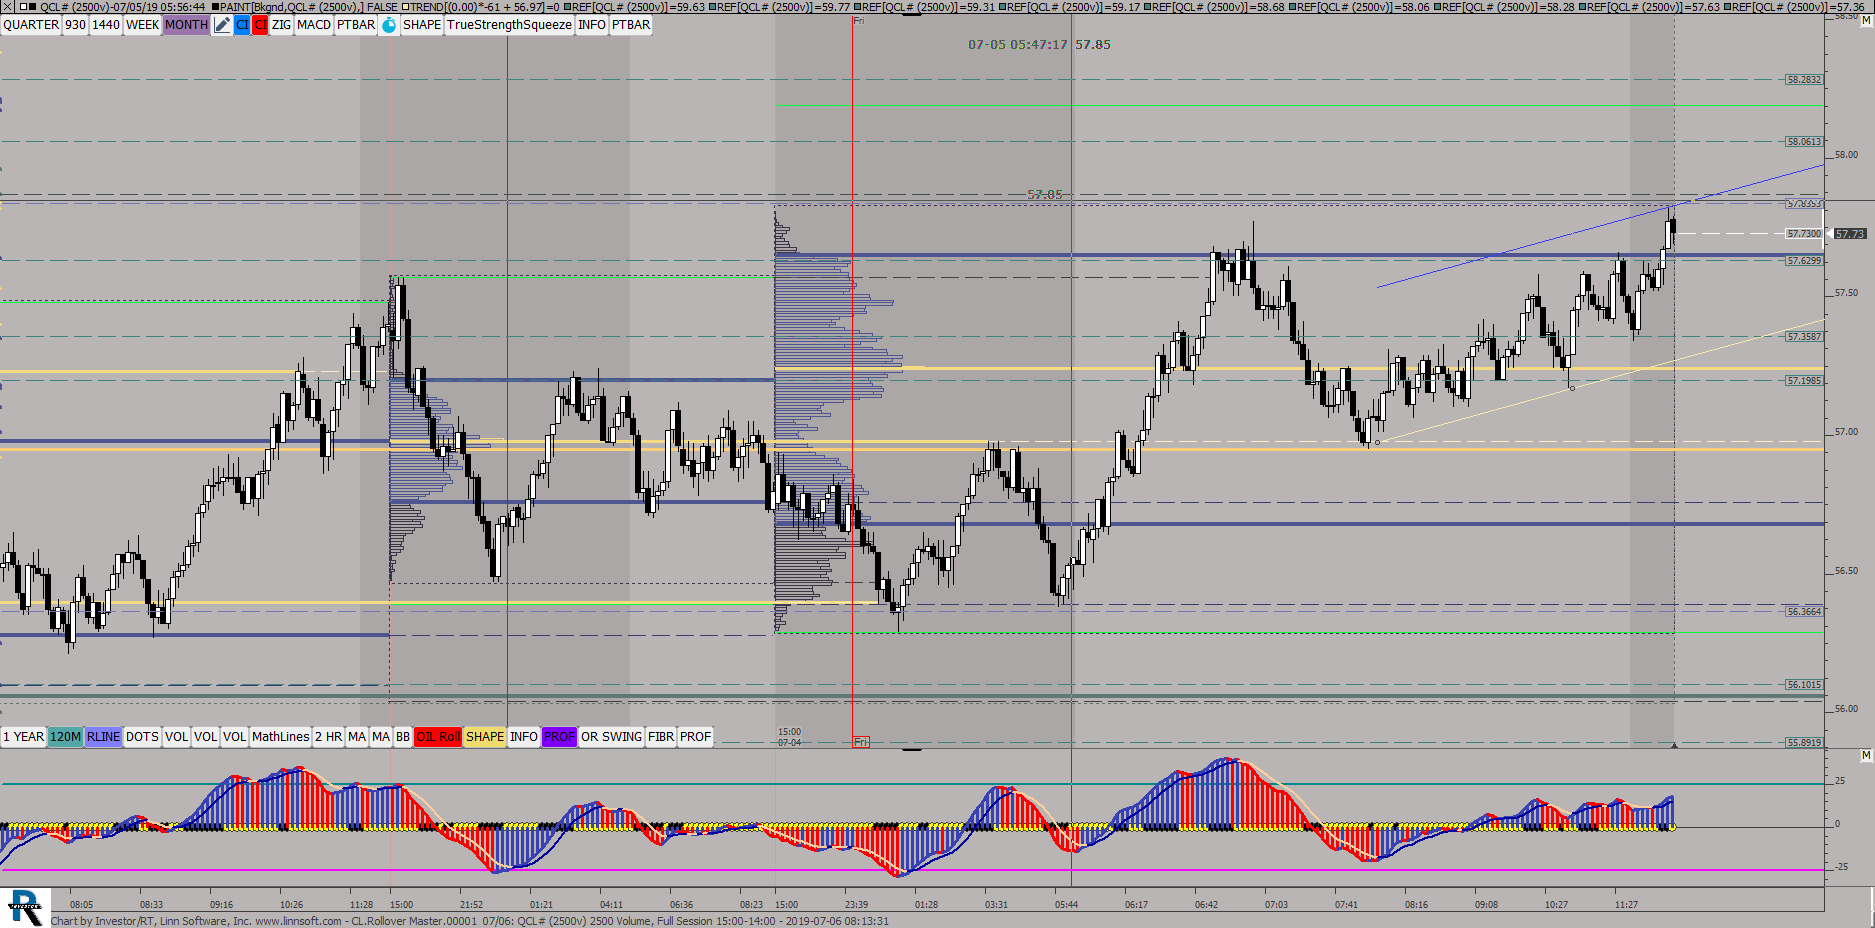 |
CLRollover Master00001 07 (QCL#) ES42 [totalcount]
7 years 3 weeks ago
This chart was uploaded by Investor/RT 13.5.24 showing symbol: QCL#. |
View |
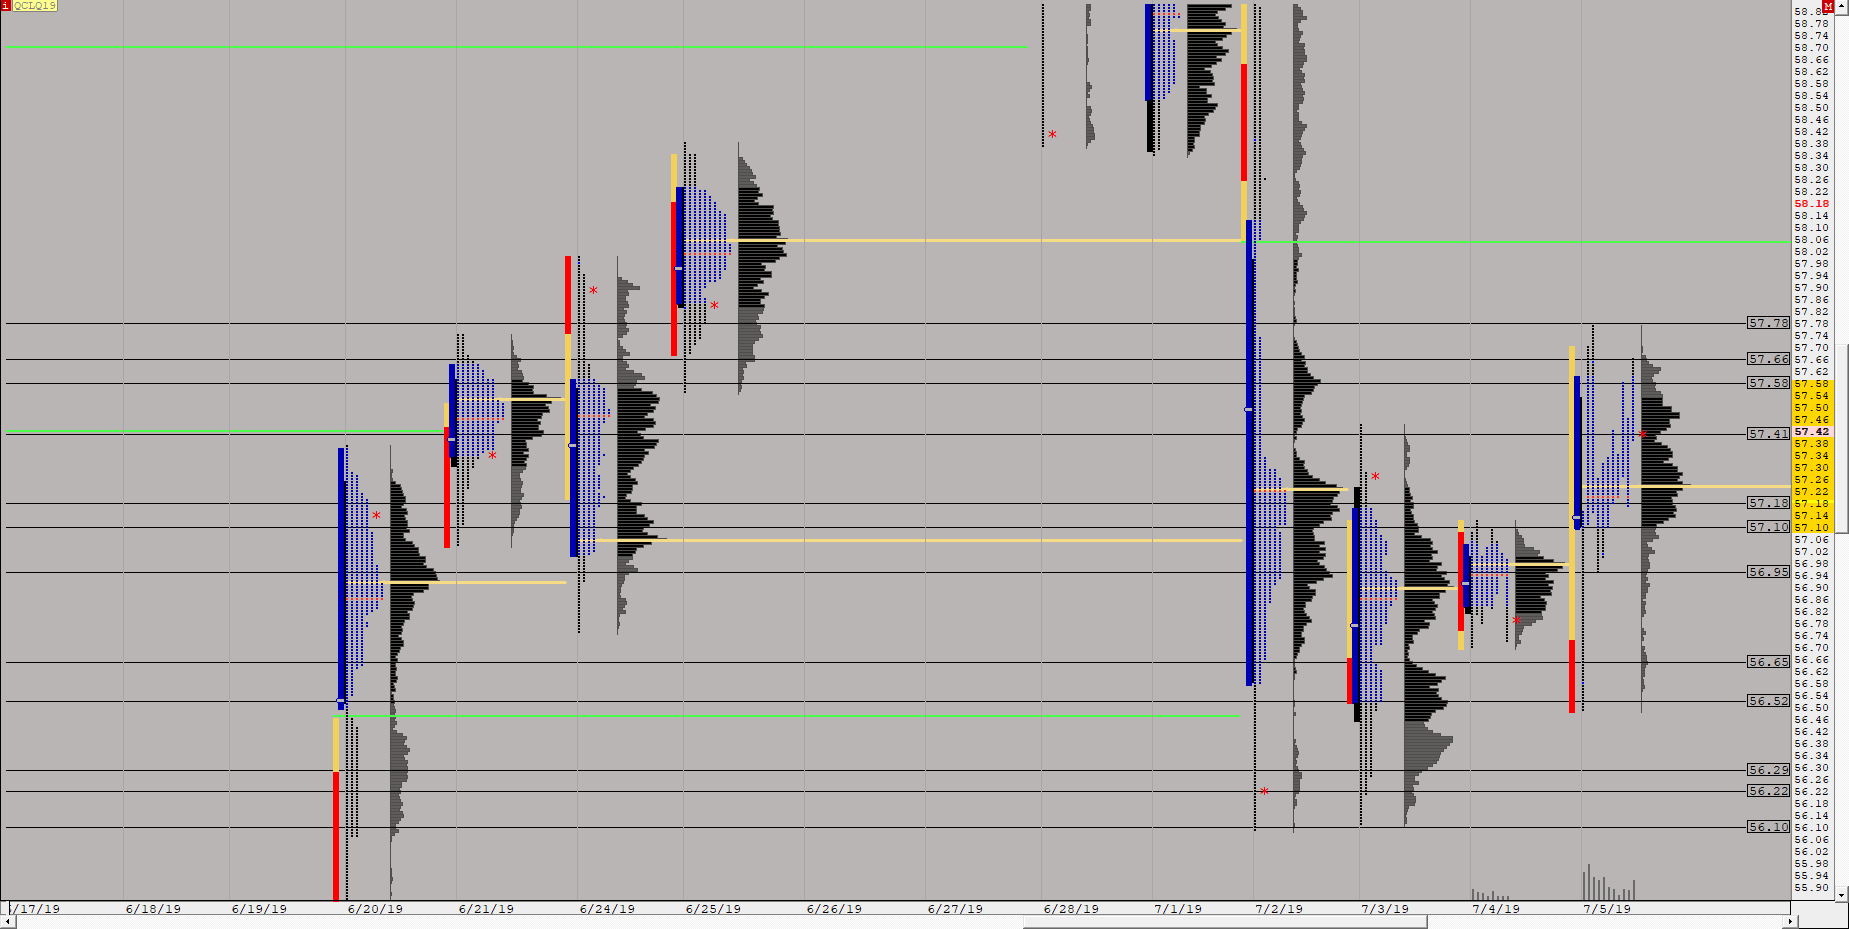 |
OILMP (QCLQ19) ES42 [totalcount]
7 years 3 weeks ago
This chart was uploaded by Investor/RT 13.5.24 showing symbol: QCLQ19. |
View |
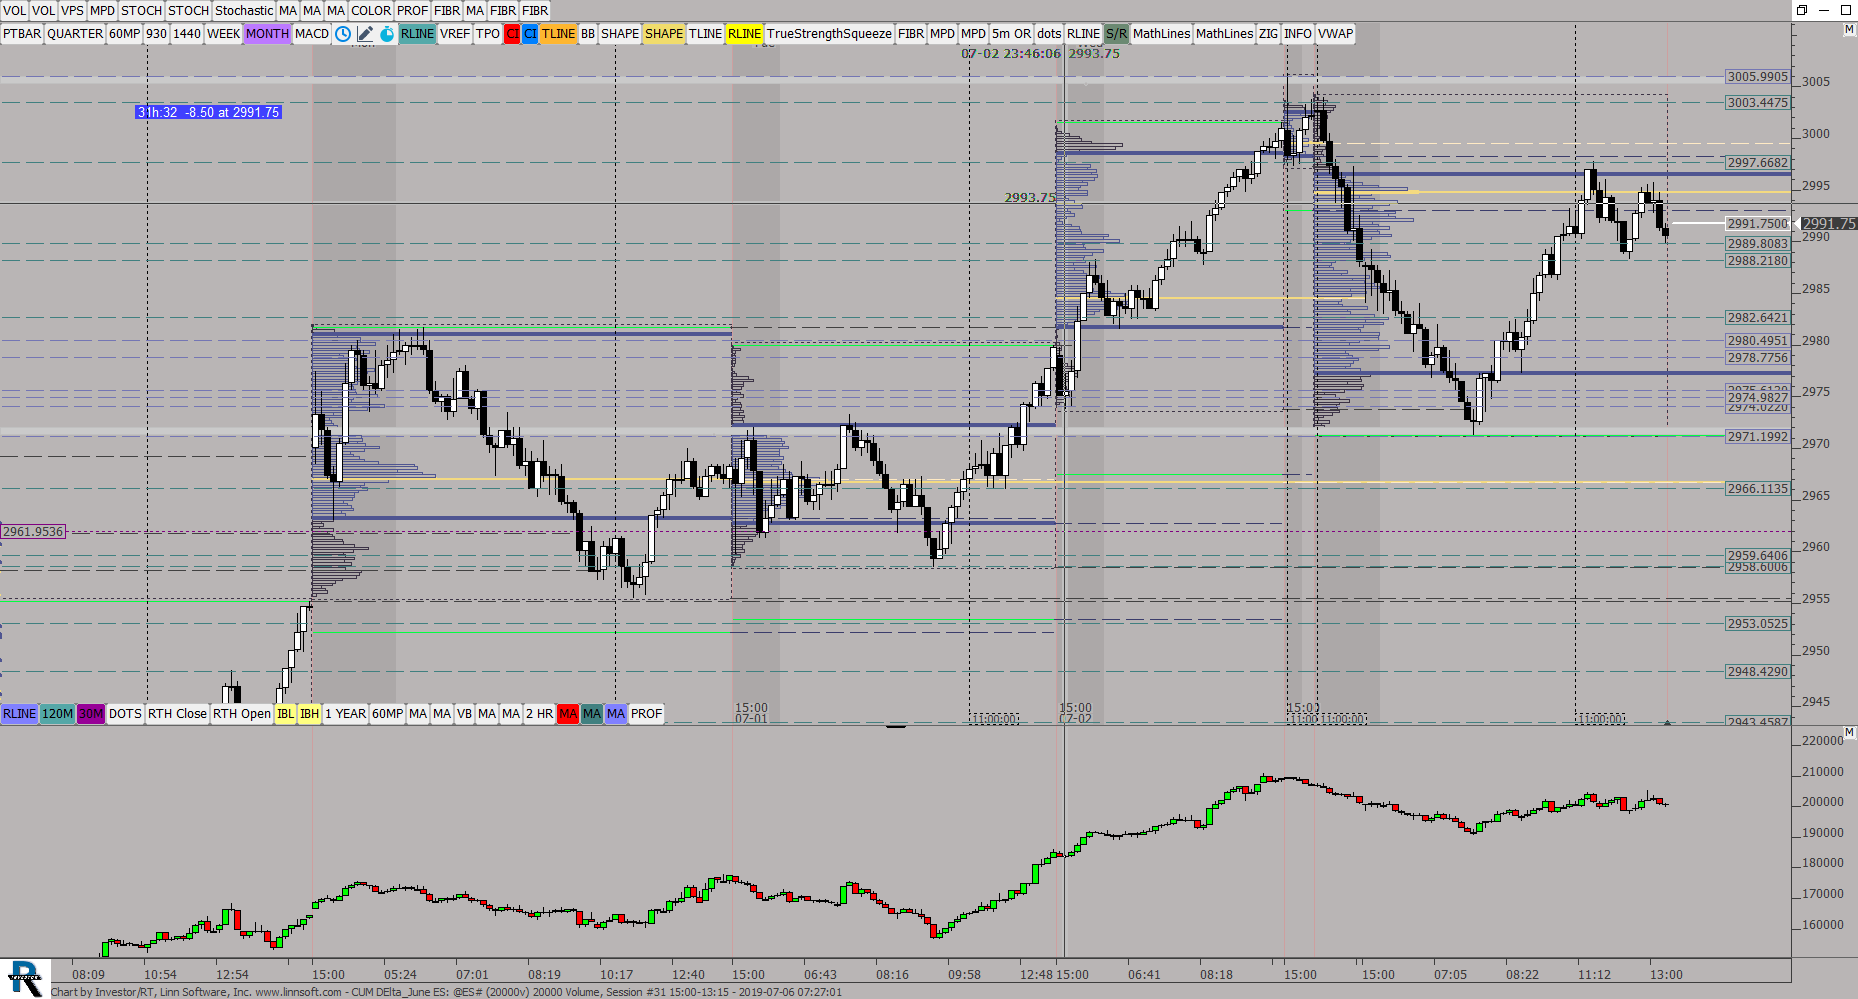 |
CUM DElta June ES (@ES#) ES42 [totalcount]
7 years 3 weeks ago
CUM DELTA SEPT. This chart was uploaded by Investor/RT 13.5.24 showing symbol: @ES#. |
View |
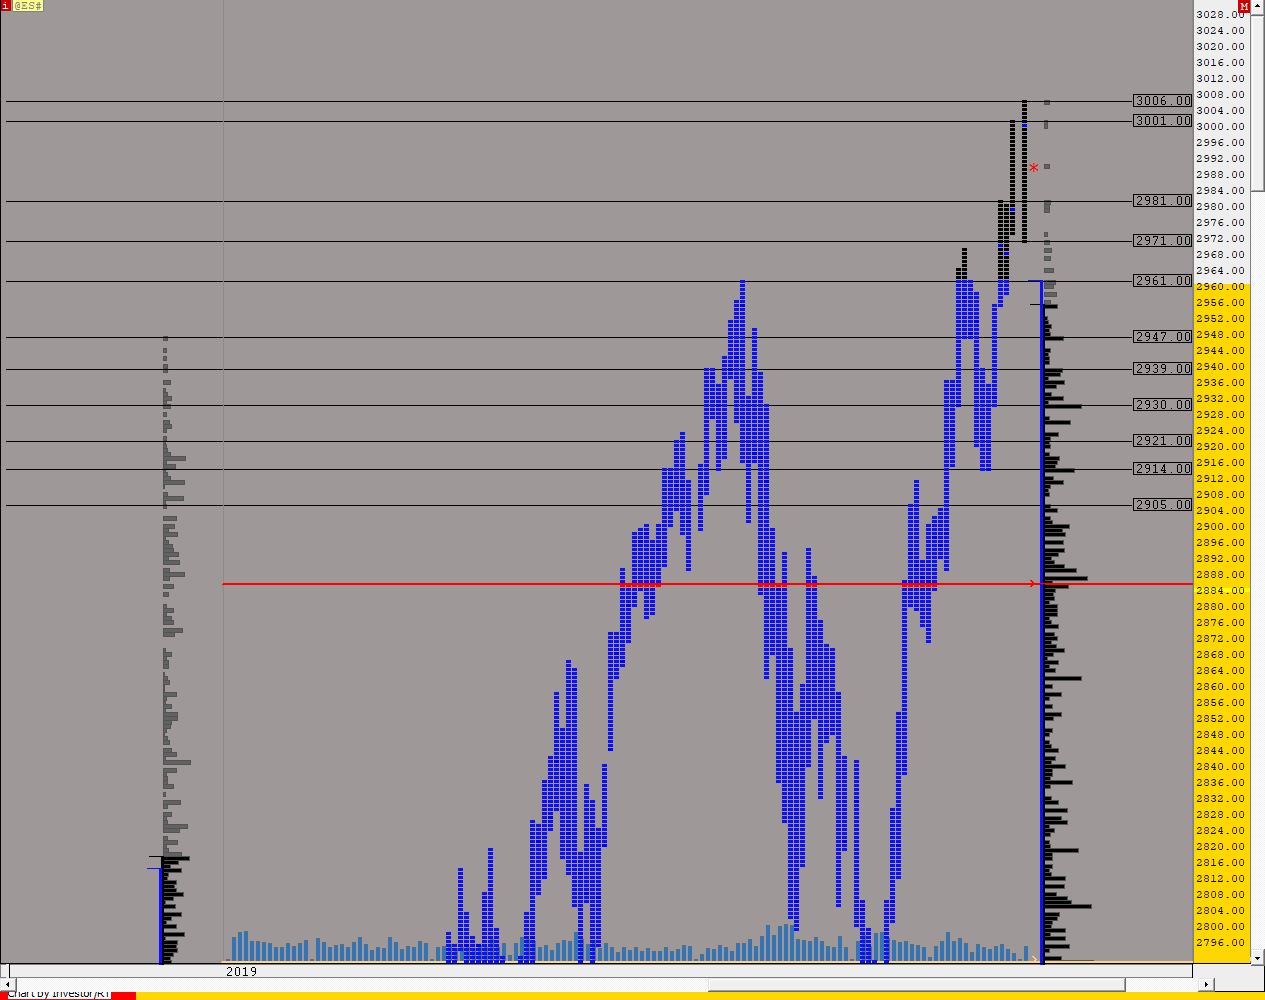 |
Yearly MP (@ES#) ES42 [totalcount]
7 years 3 weeks ago
This chart was uploaded by Investor/RT 13.5.12 showing symbol: @ES#. |
View |
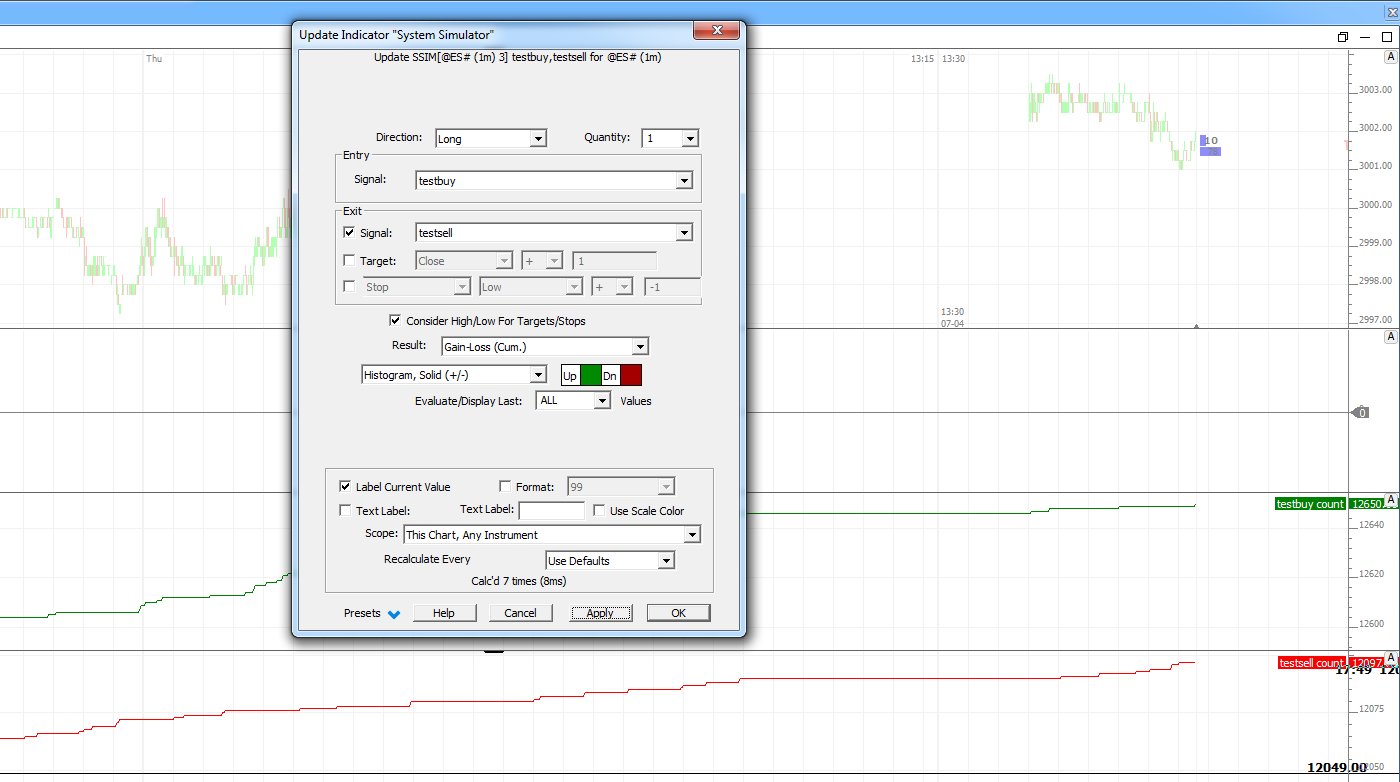 |
example whatstop [totalcount]
7 years 5 months ago
This chart was uploaded by Investor/RT 13.5.20 showing symbol: @ES#. |
View |
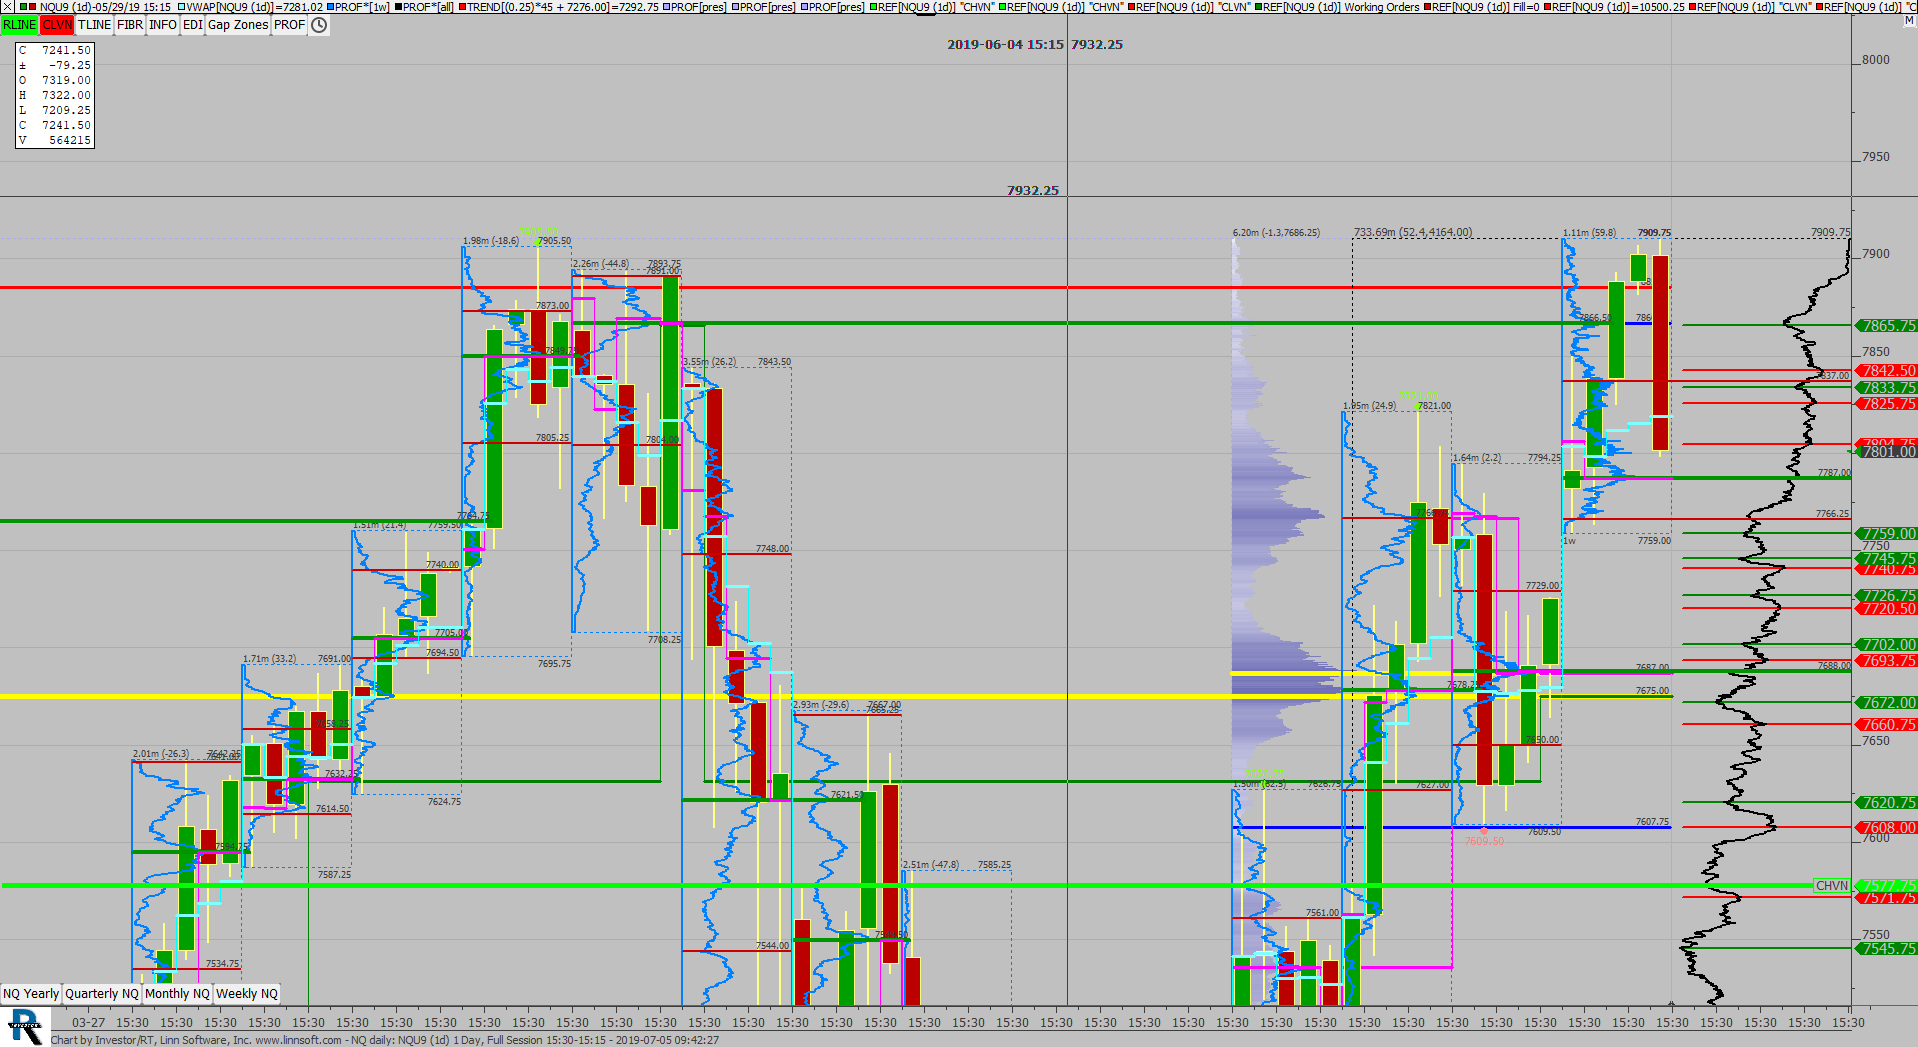 |
NQ daily (NQU9) scottz46 [totalcount]
7 years 3 weeks ago
This chart was uploaded by Investor/RT 13.5.24 showing symbol: NQU9. |
View |
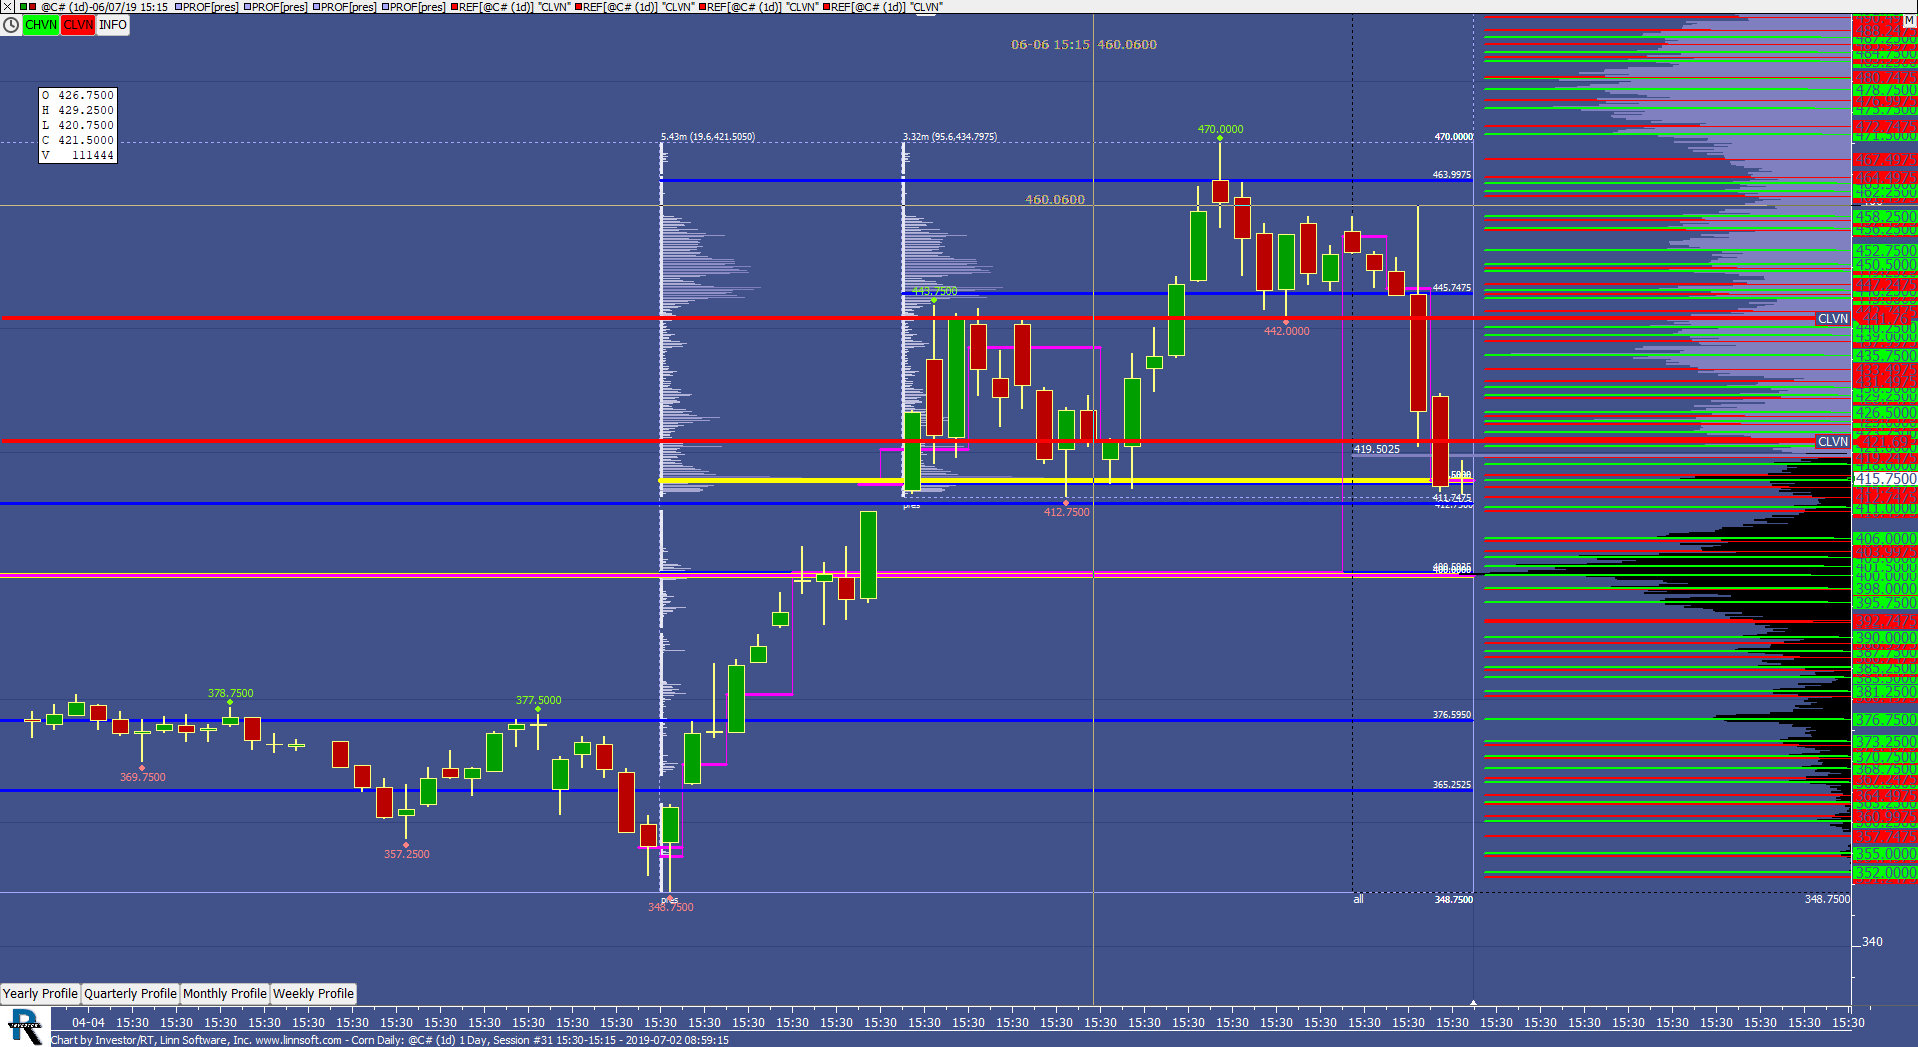 |
Corn Daily (@C#) scottz46 [totalcount]
7 years 1 month ago
This chart was uploaded by Investor/RT 13.5.24 showing symbol: @C#. |
View |
 |
CopperTPO Daily (QHG#) ES42 [totalcount]
7 years 1 month ago
This chart was uploaded by Investor/RT 13.5.24 showing symbol: QHG#. |
View |
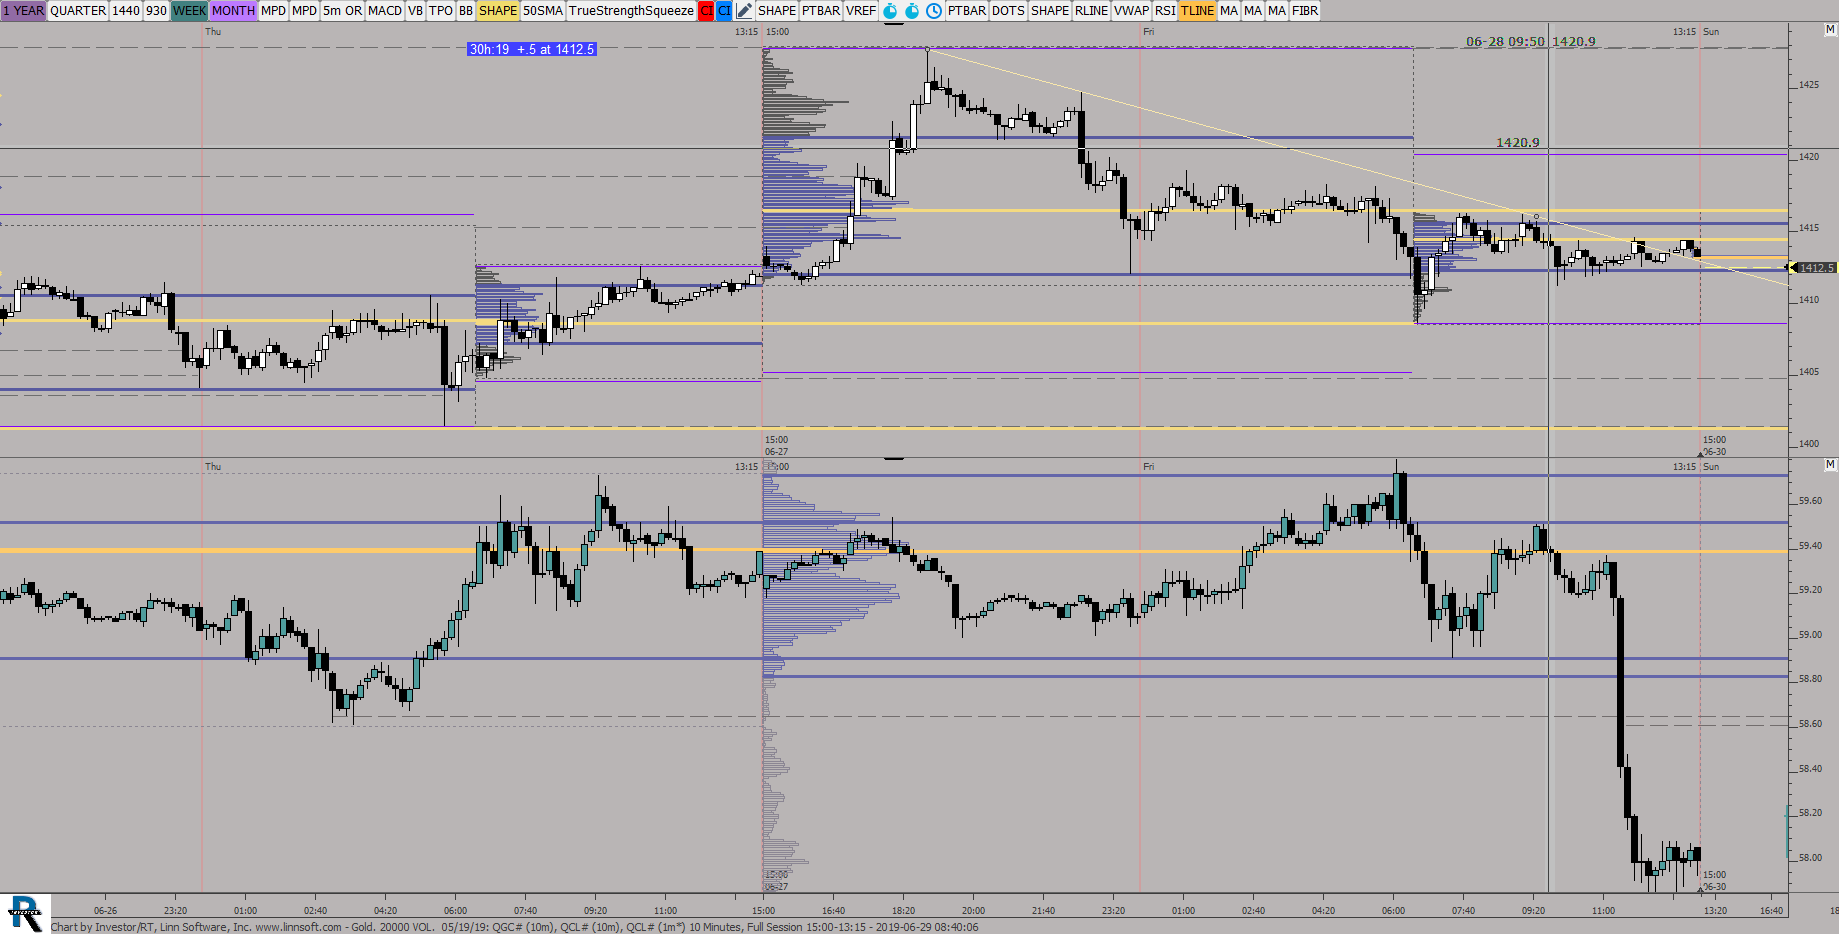 |
Gold 20000 VOL 05 19 (QGC#) ES42 [totalcount]
7 years 1 month ago
Weekly Candles_ Yearly VP. This chart was uploaded by Investor/RT 13.5.24 showing symbol: QGC#. |
View |