 |
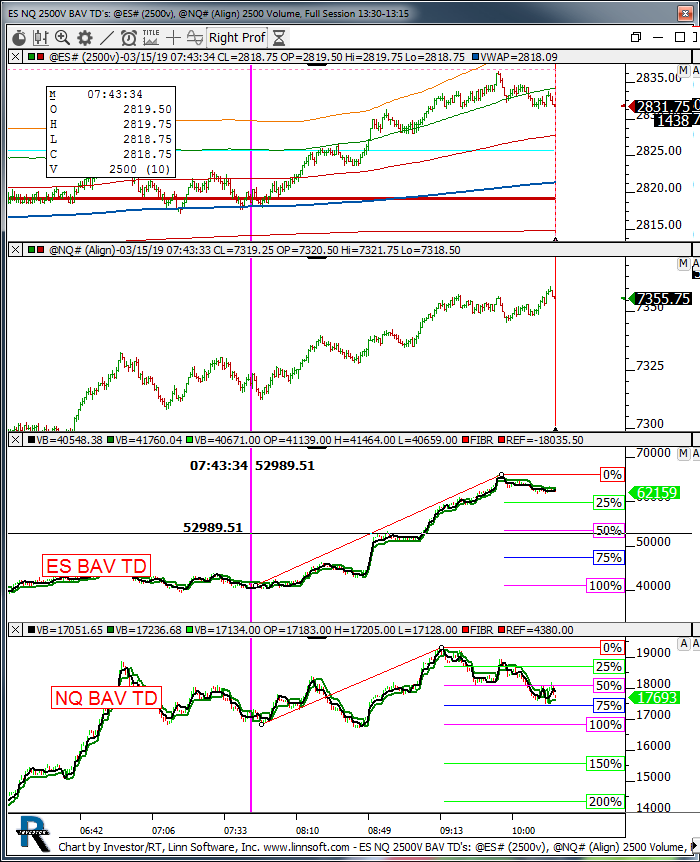
ES NQ 2500V BAV TDs (@ES#) kencassorla [totalcount]
7 years 4 months ago
es nq. This chart was uploaded by Investor/RT 13.5.21 showing symbol: @ES#. |
View |
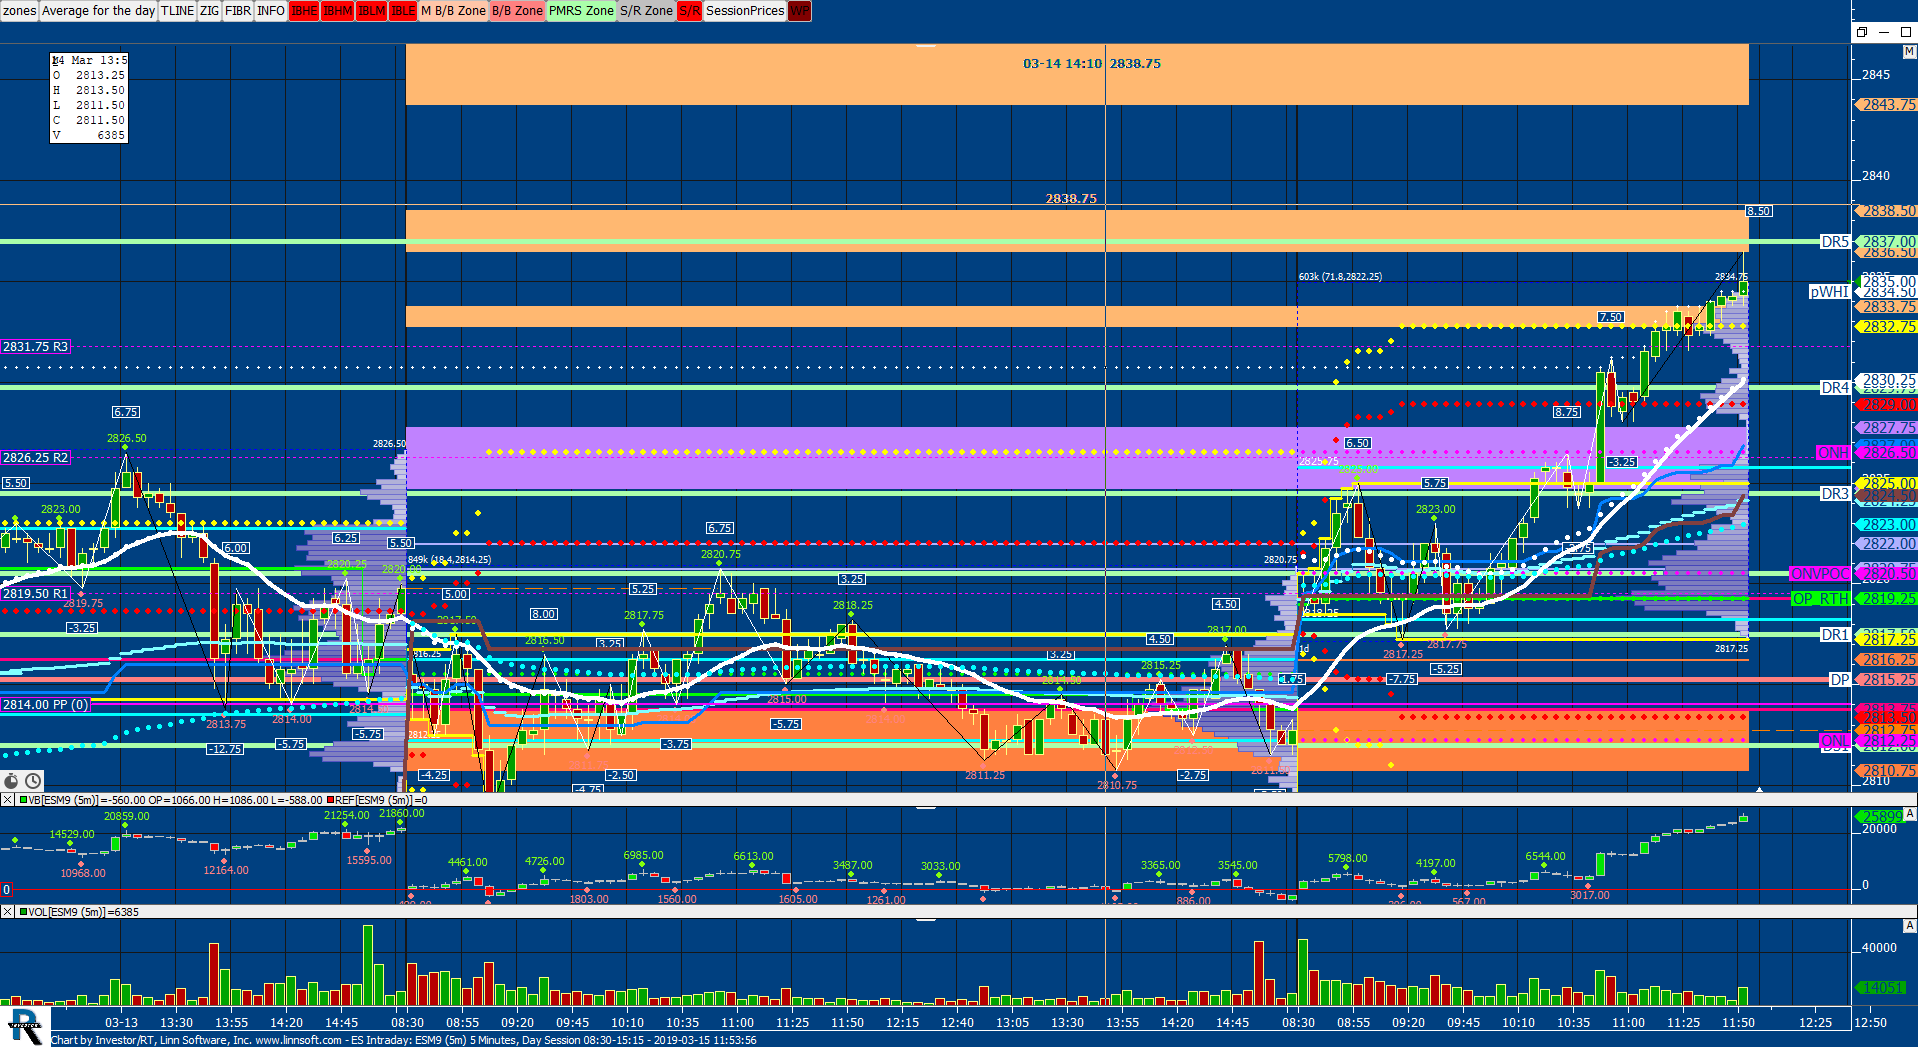 |
ES Intraday (ESM9) scottz46 [totalcount]
7 years 4 months ago
PWHI in the sessions statistic is not workign correctly. WHat is going on?. This chart was uploaded by Investor/RT 13.5.21 showing symbol: ESM9. |
View |
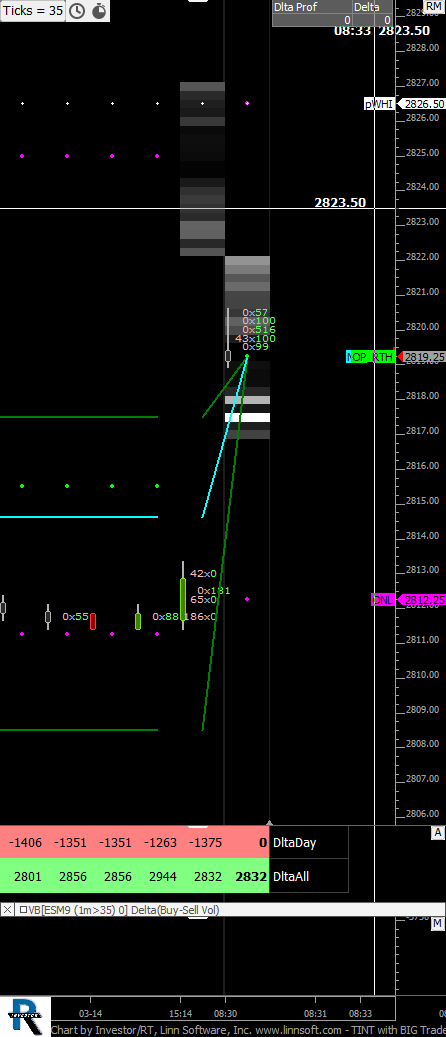 |
TINT with BIG Trades (ESM9) scottz46 [totalcount]
7 years 4 months ago
This chart was uploaded by Investor/RT 13.5.21 showing symbol: ESM9. |
View |
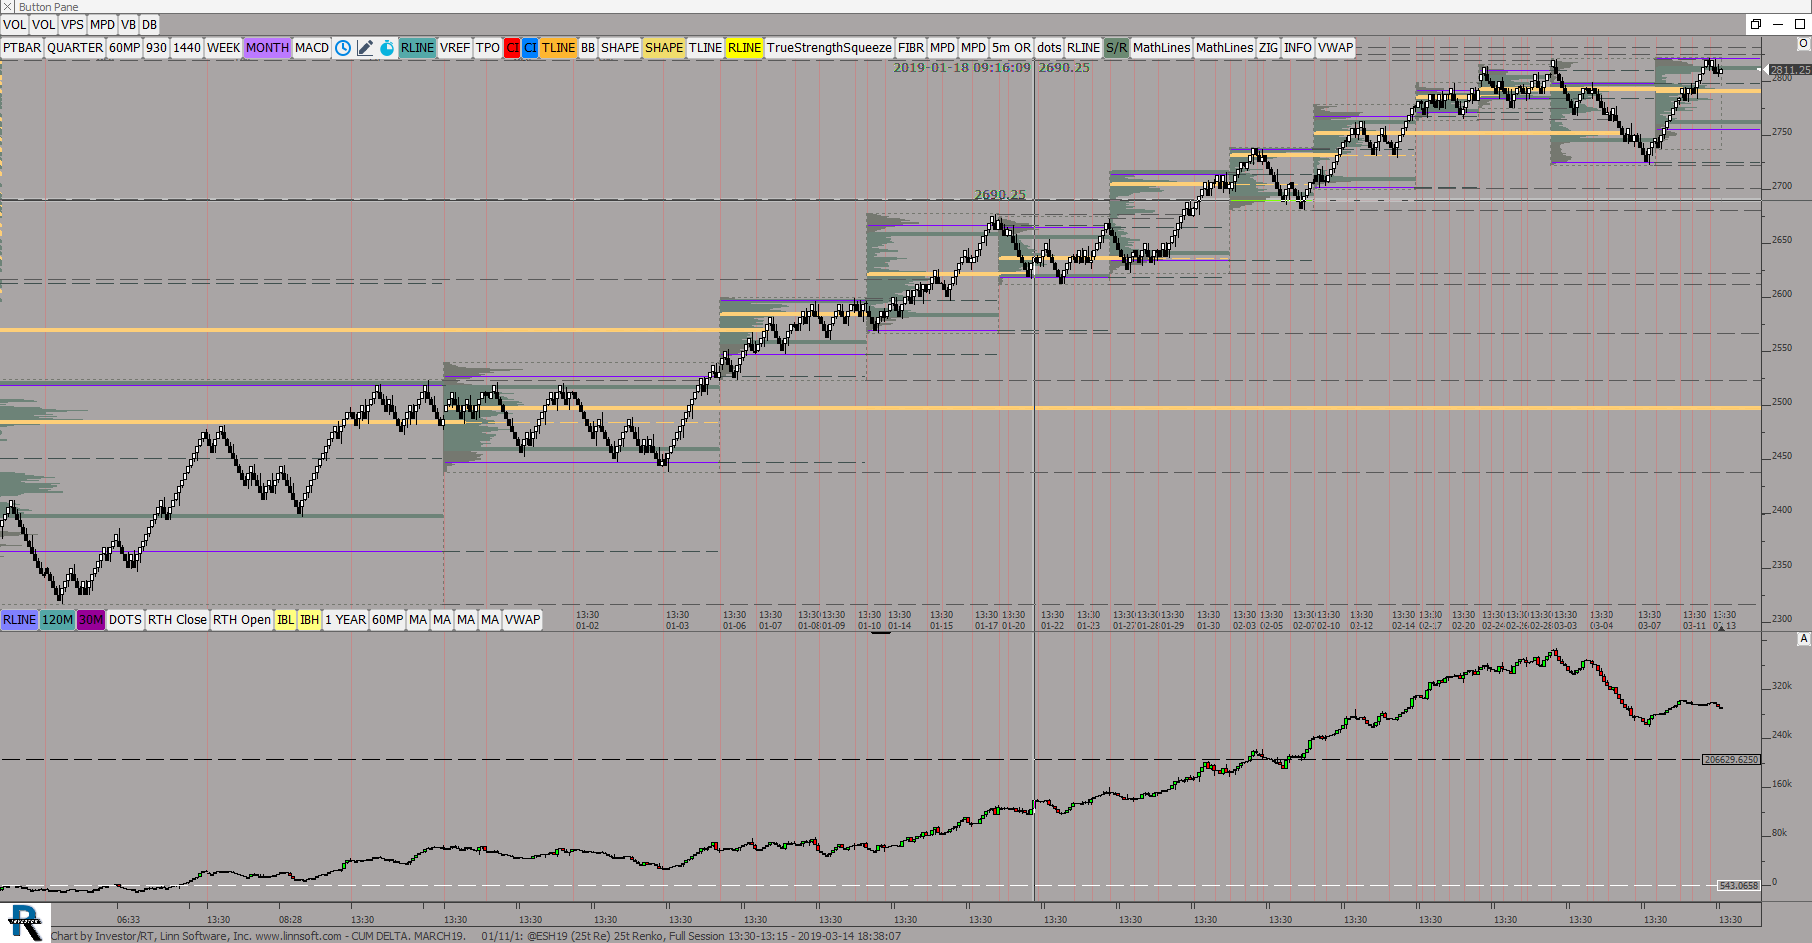 |
CUM DELTA MARCH19 01 11 (@ESH19) ES42 [totalcount]
7 years 4 months ago
This chart was uploaded by Investor/RT 13.5.23 showing symbol: @ESH19. |
View |
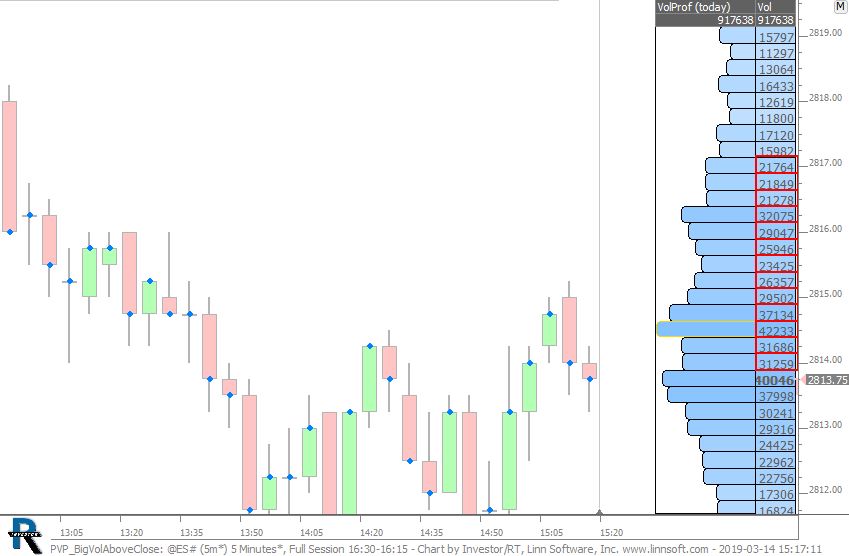 |
PVP BigVolAboveClose (@ES#) cpayne [totalcount]
7 years 4 months ago
This chart was uploaded by Investor/RT 13.5.23 showing symbol: @ES#. |
View |
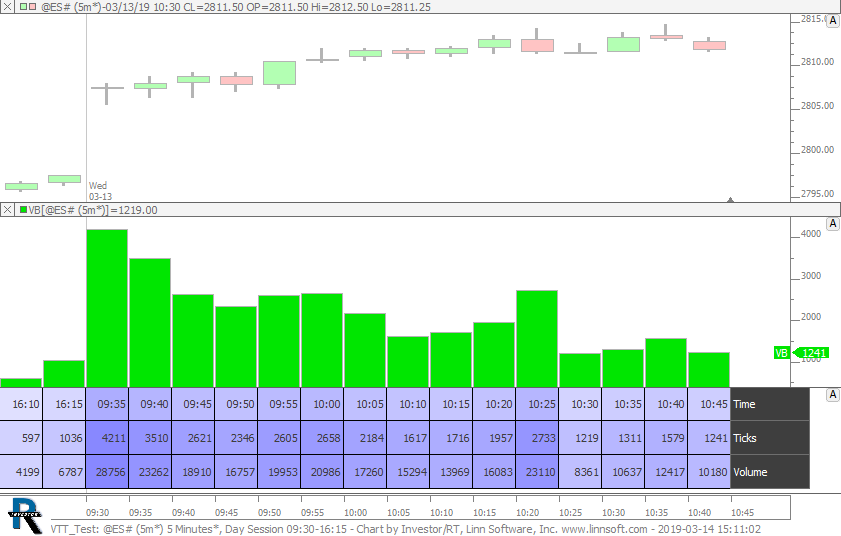 |
VTT Test (@ES#) cpayne [totalcount]
7 years 4 months ago
This chart was uploaded by Investor/RT 13.5.23 showing symbol: @ES#. |
View |
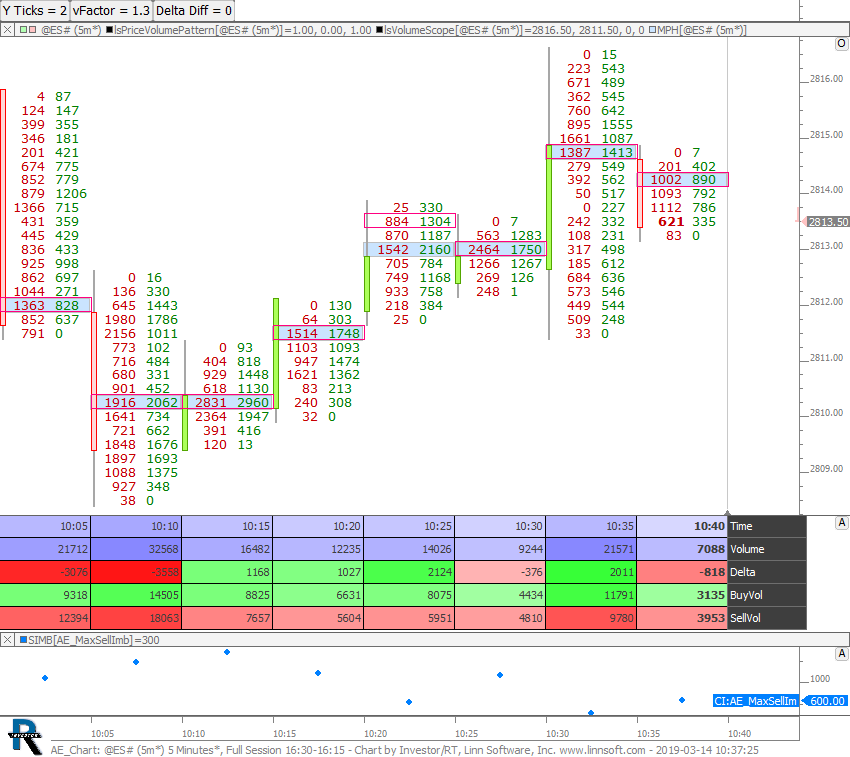 |
AE Chart (@ES#) cpayne [totalcount]
7 years 4 months ago
Identifies bars where the highest volume price is also the highest sell imbalance price and also in bottom Y Ticks of bar (controlled by button) and that bar closes above the high volume price and... |
View |
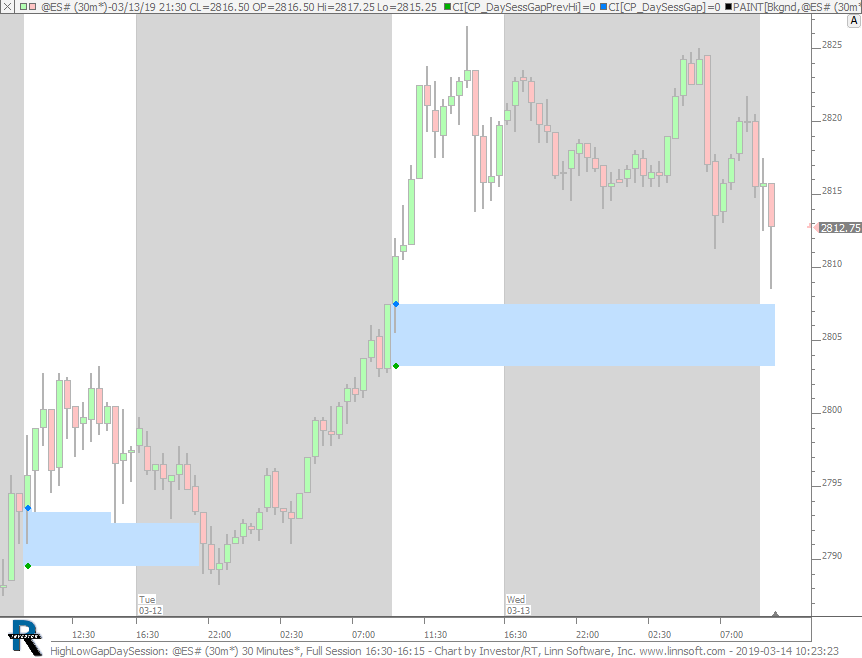 |
HighLowGapDaySession (@ES#) cpayne [totalcount]
7 years 4 months ago
Extended Gap Bands - Chart shows full session but gaps only consider day session data. This chart was uploaded by Investor/RT 13.5.23 showing symbol: @ES#. |
View |
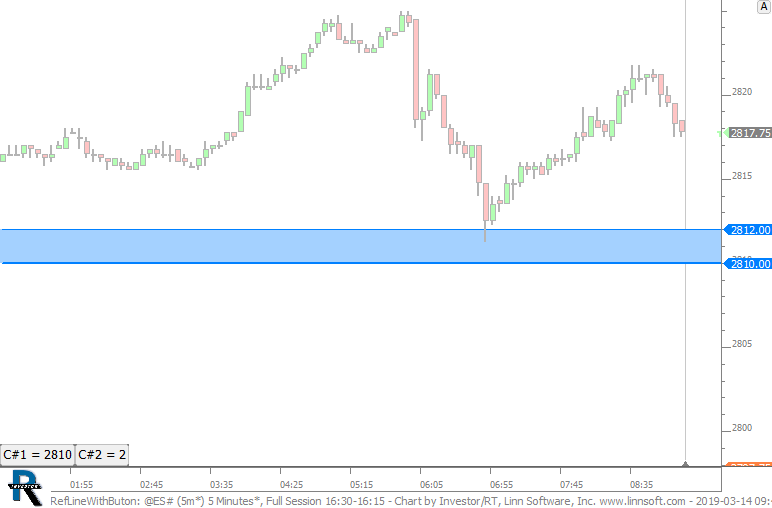 |
RefLineWithButon (@ES#) cpayne [totalcount]
7 years 4 months ago
This chart was uploaded by Investor/RT 13.5.23 showing symbol: @ES#. |
View |
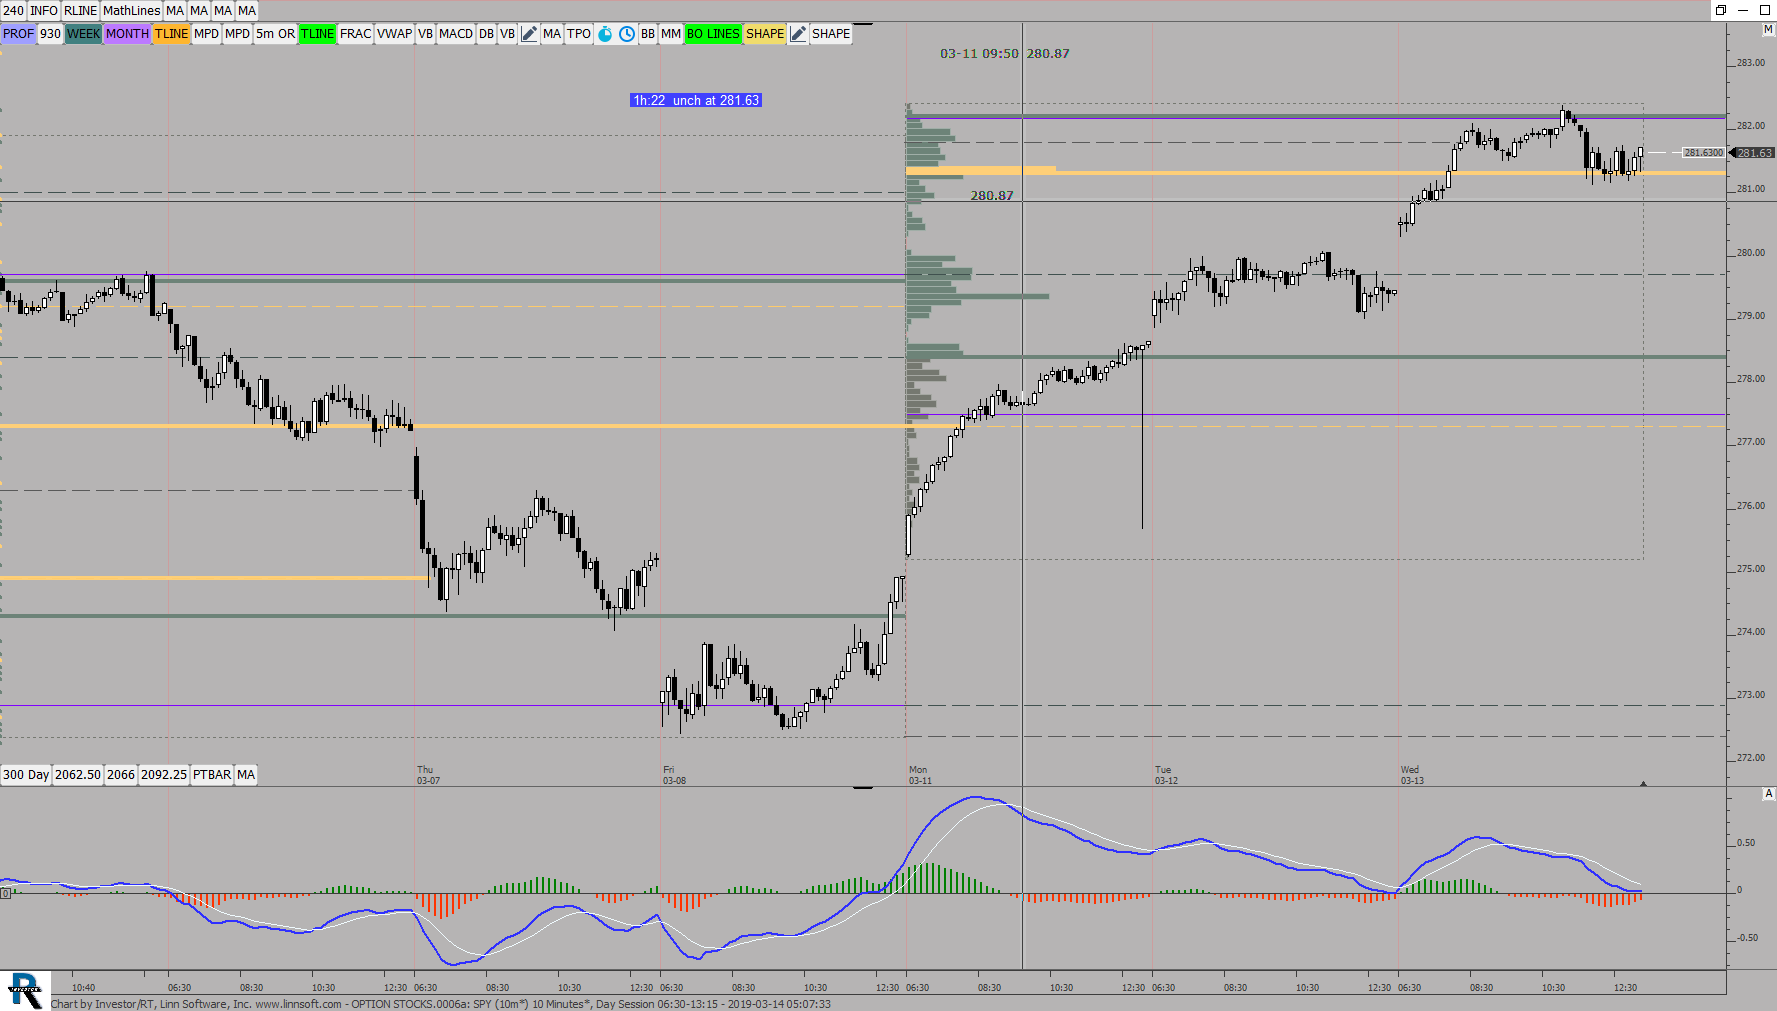 |
OPTION STOCKS0006a (SPY) ES42 [totalcount]
7 years 4 months ago
This chart was uploaded by Investor/RT 13.3.5 showing symbol: SPY. |
View |
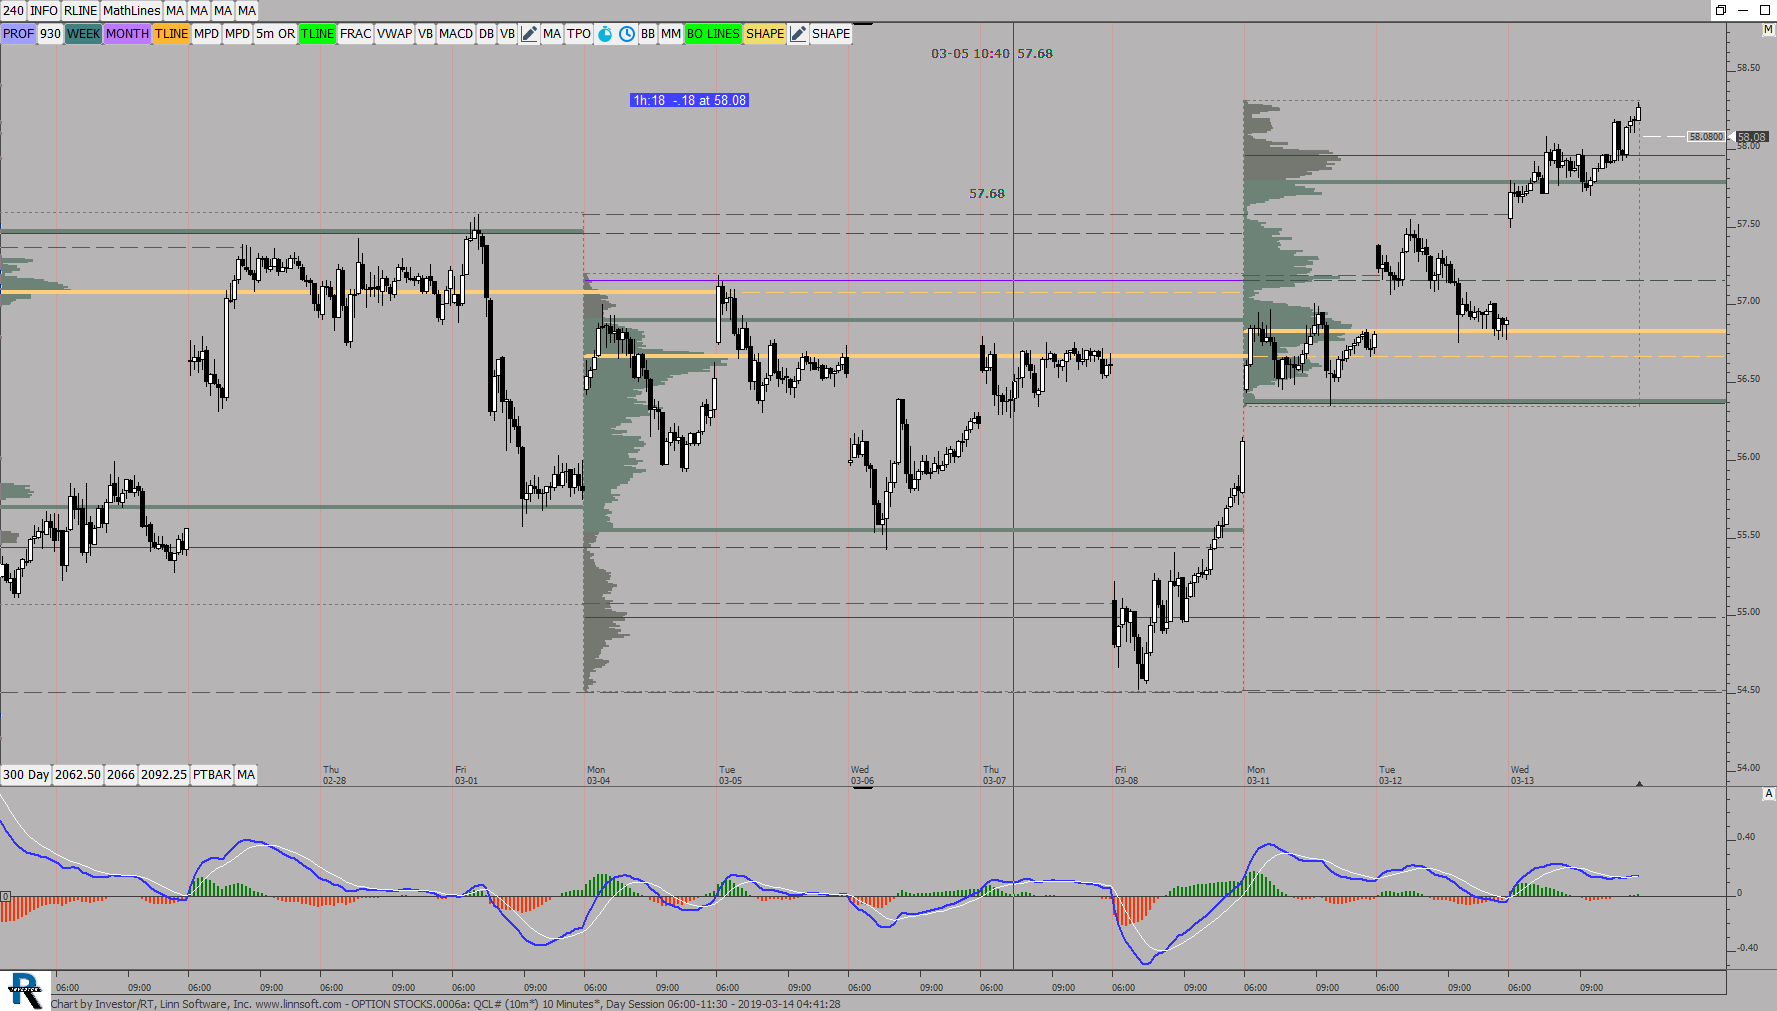 |
OPTION STOCKS0006a (QCL#) ES42 [totalcount]
7 years 4 months ago
This chart was uploaded by Investor/RT 13.5.23 showing symbol: QCL#. |
View |
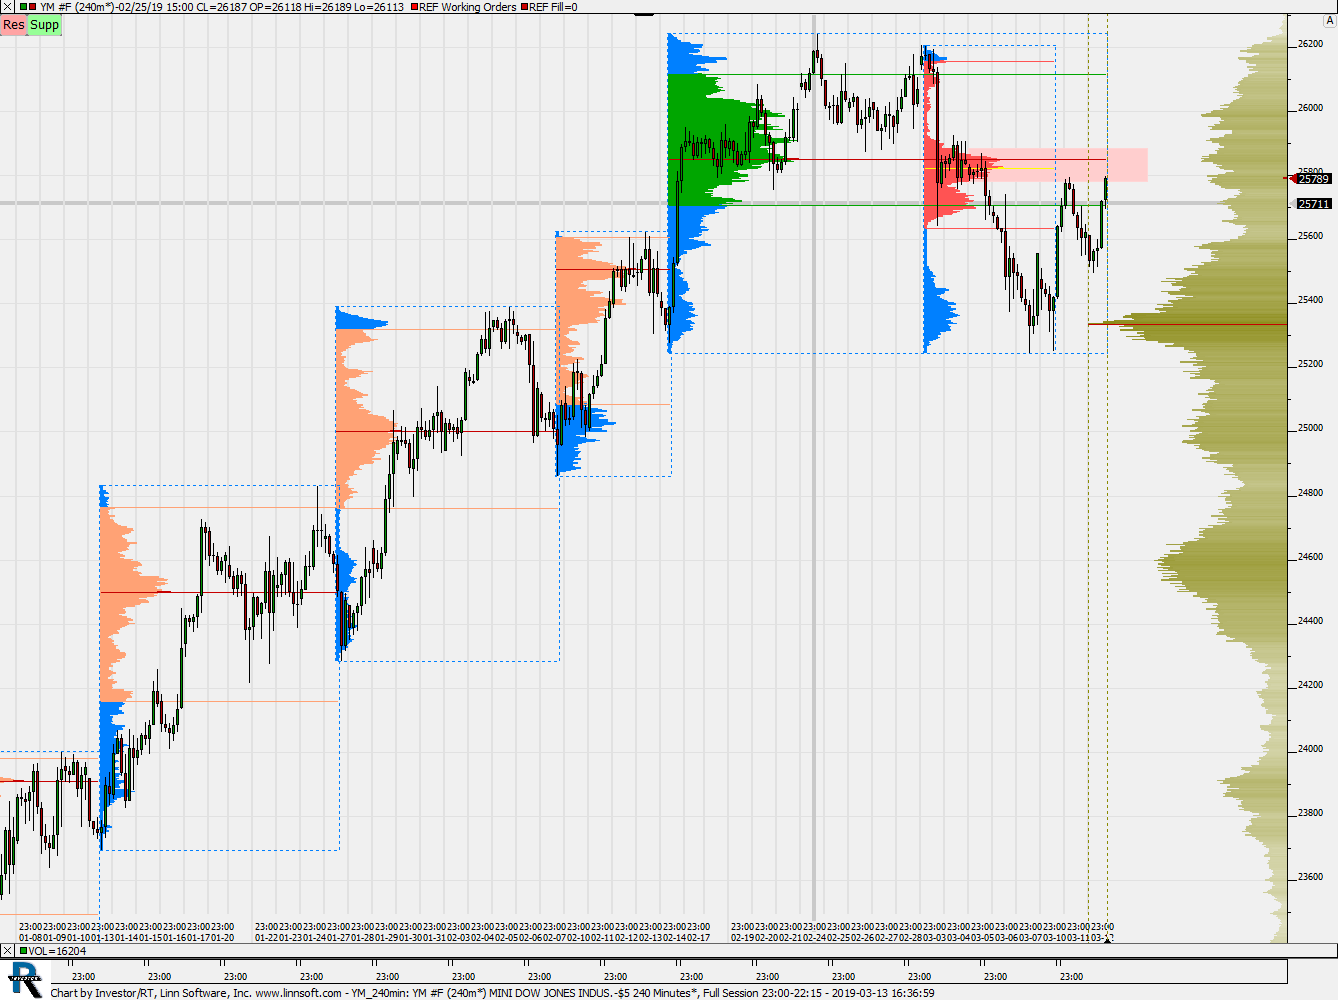 |
YM 240min (YM #F) habpet [totalcount]
7 years 4 months ago
YM custom Profile. This chart was uploaded by Investor/RT 13.5.21 showing symbol: YM #F. |
View |
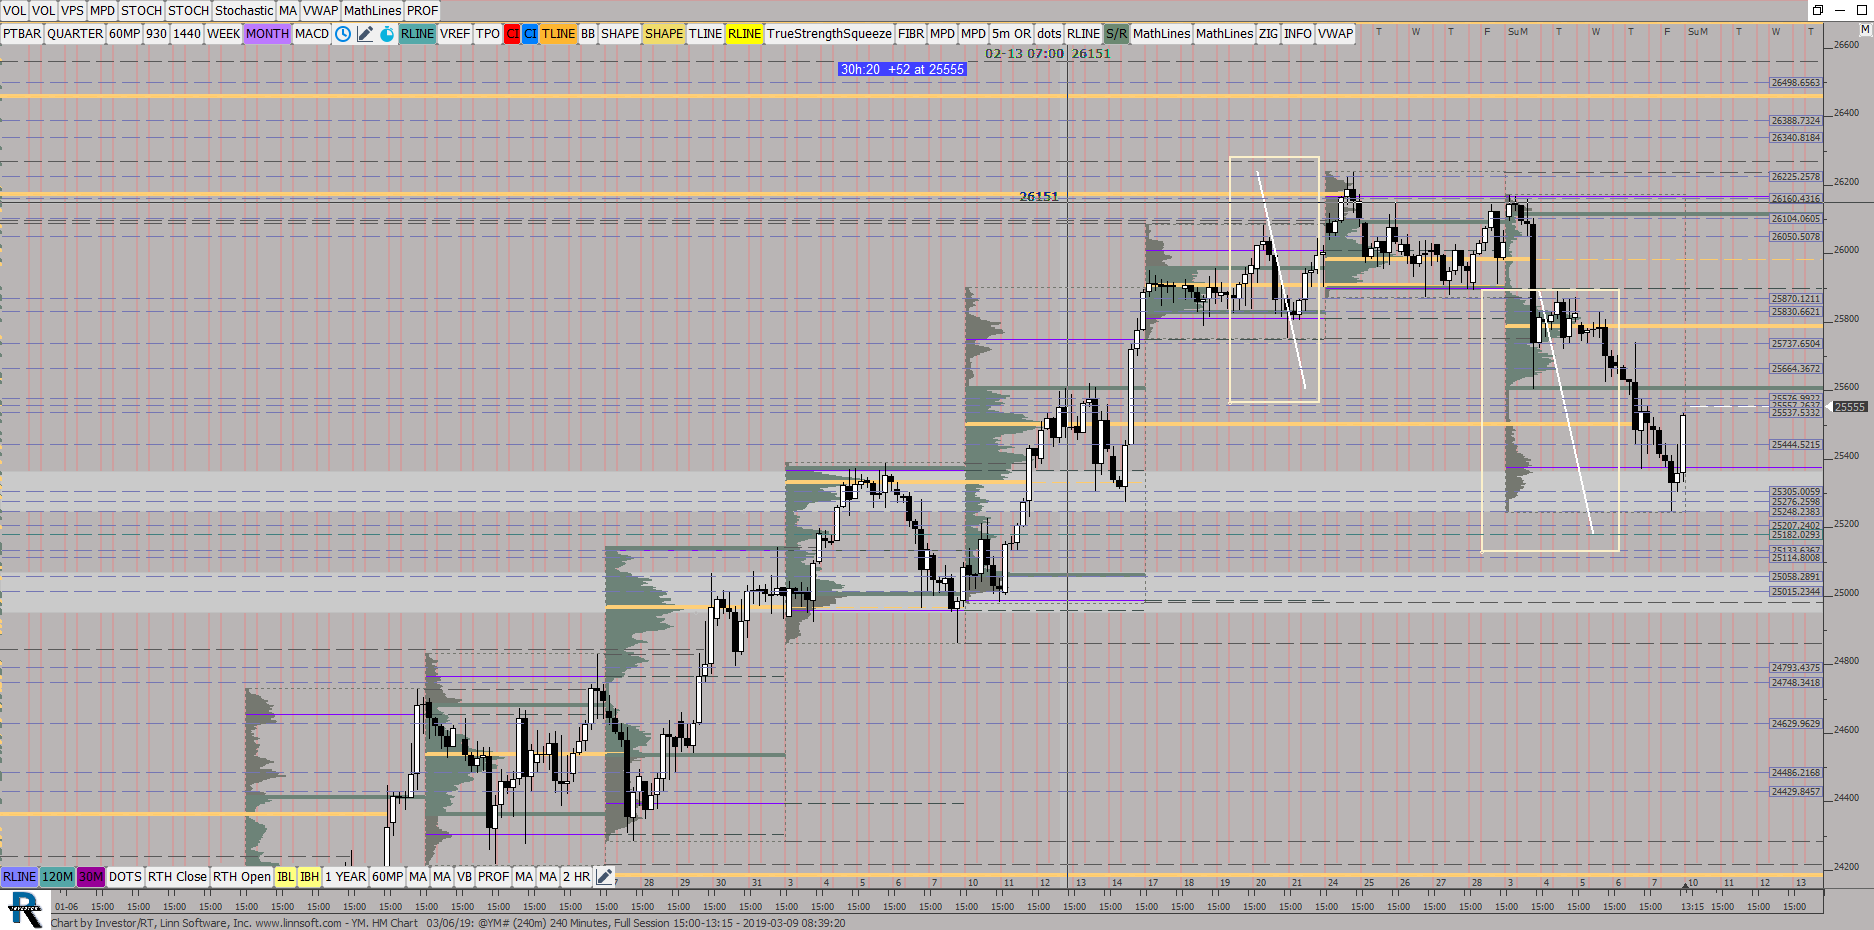 |
YM HM Chart 03 06 (@YM#) ES42 [totalcount]
7 years 4 months ago
This chart was uploaded by Investor/RT 13.5.21 showing symbol: @YM#. |
View |
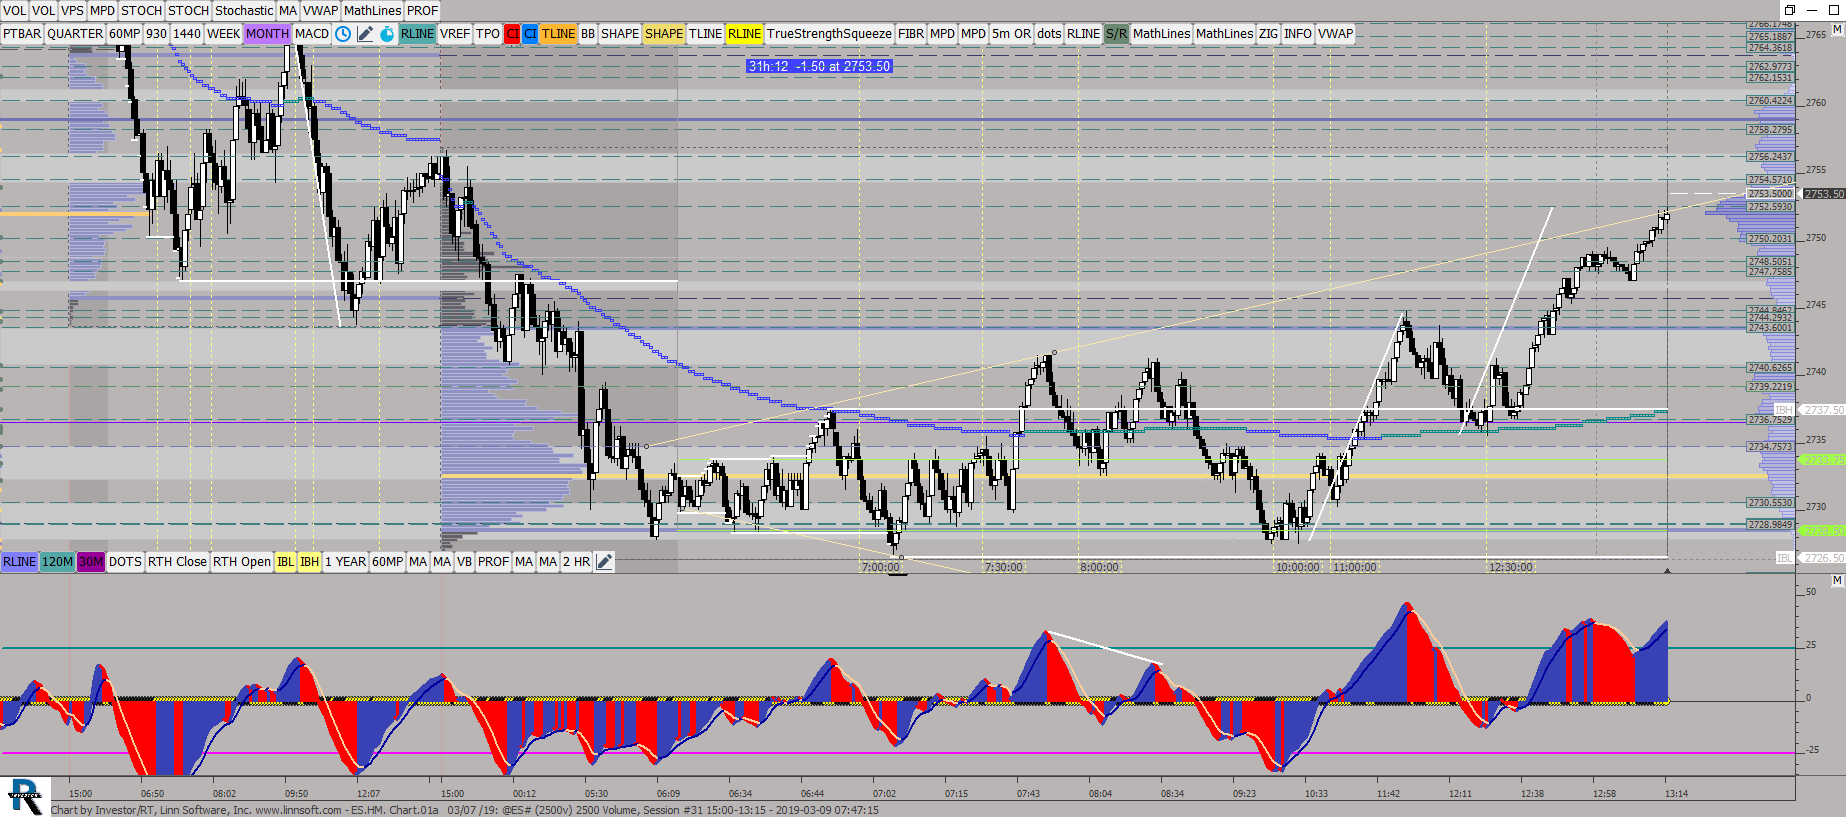 |
ESHM Chart01a 03 07 (@ES#) ES42 [totalcount]
7 years 4 months ago
This chart was uploaded by Investor/RT 13.5.21 showing symbol: @ES#. |
View |
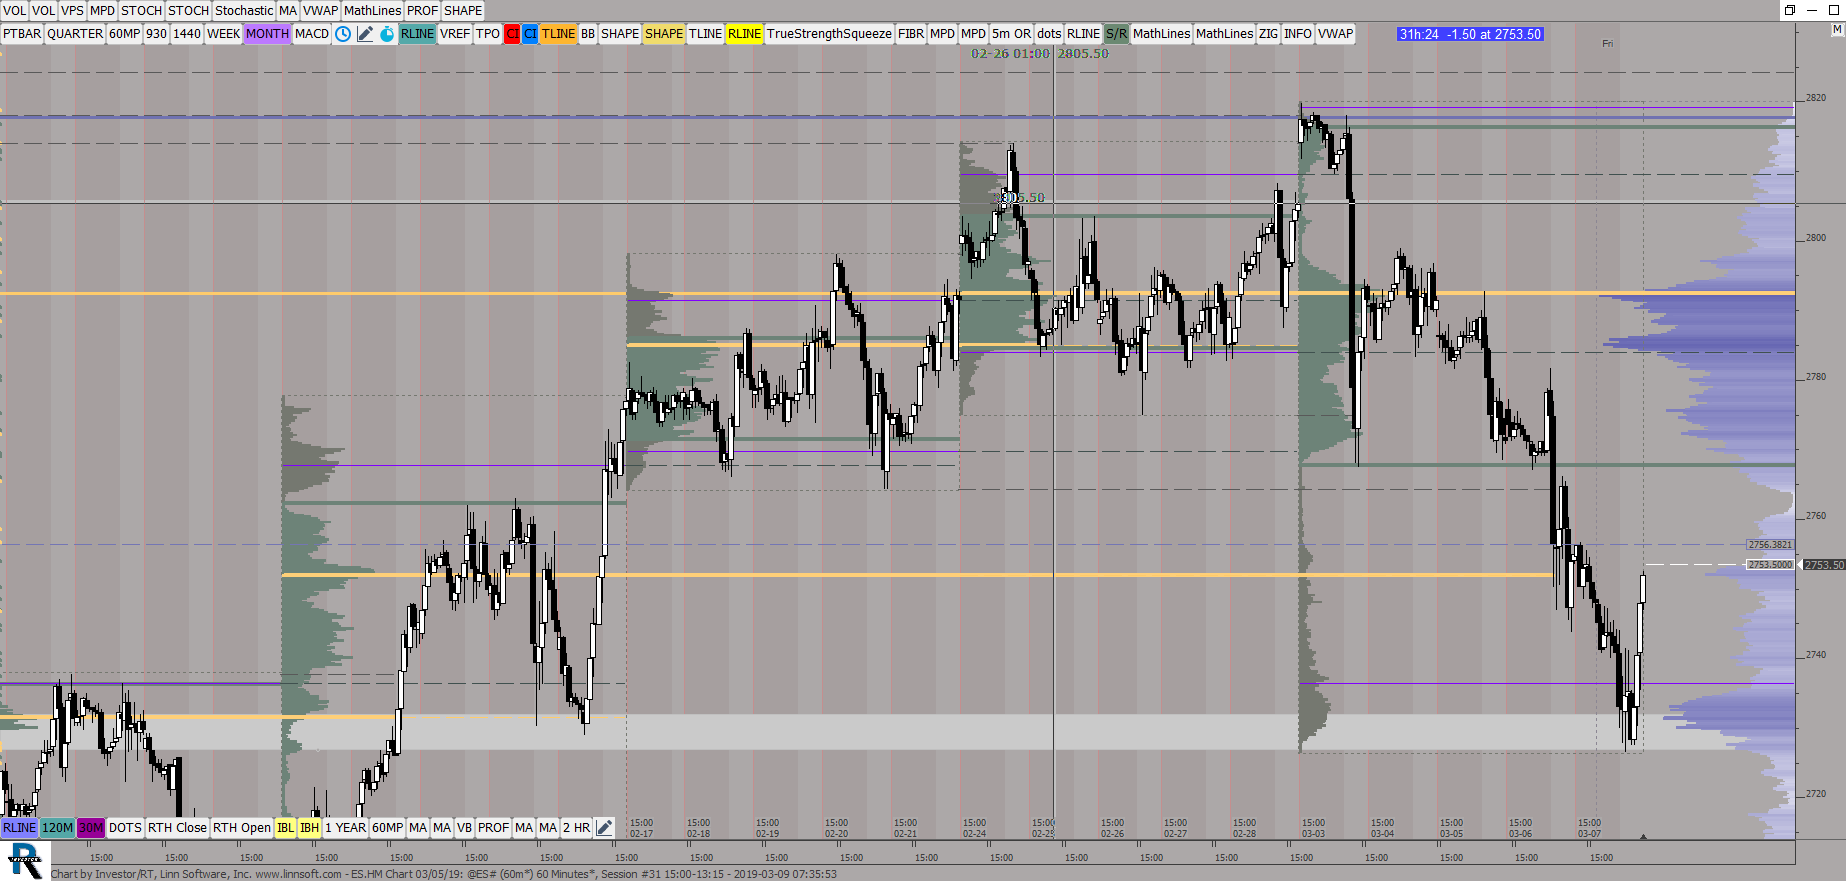 |
ESHM Chart 03 05 (@ES#) ES42 [totalcount]
7 years 4 months ago
This chart was uploaded by Investor/RT 13.5.21 showing symbol: @ES#. |
View |
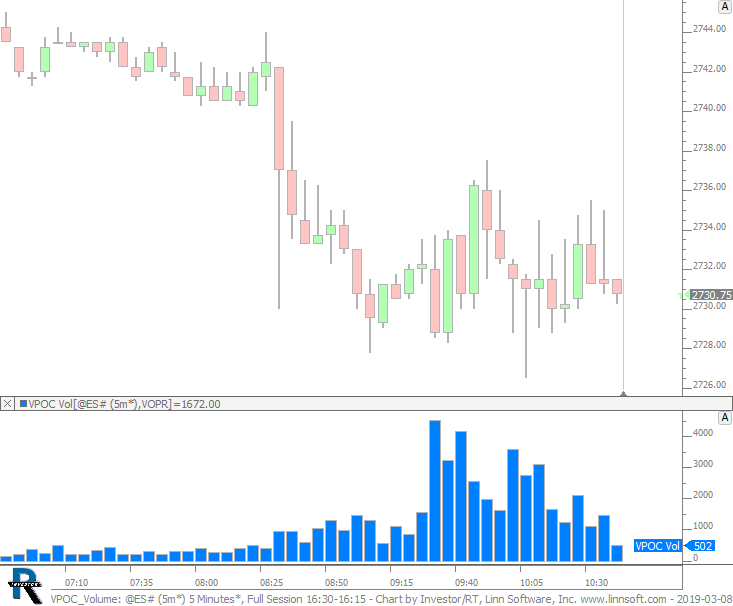 |
VPOC Volume (@ES#) cpayne [totalcount]
7 years 4 months ago
VPOC Volume. This chart was uploaded by Investor/RT 13.5.20 showing symbol: @ES#. |
View |
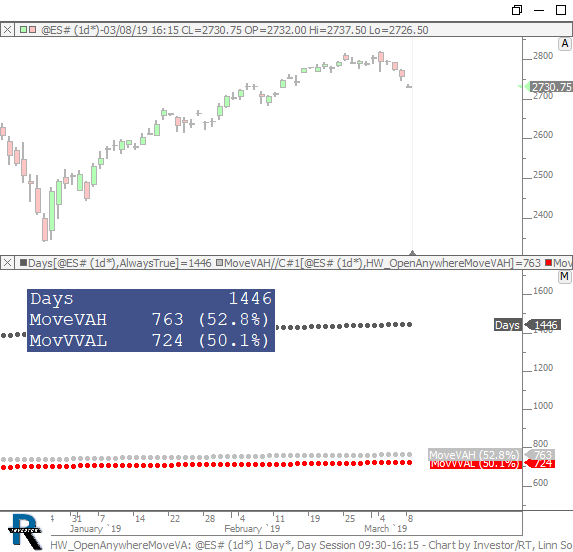 |
HW OpenAnywhereMoveVA (@ES#) cpayne [totalcount]
7 years 4 months ago
How often do we hit the previous day VAH or VAL. This chart was uploaded by Investor/RT 13.5.20 showing symbol: @ES#. |
View |
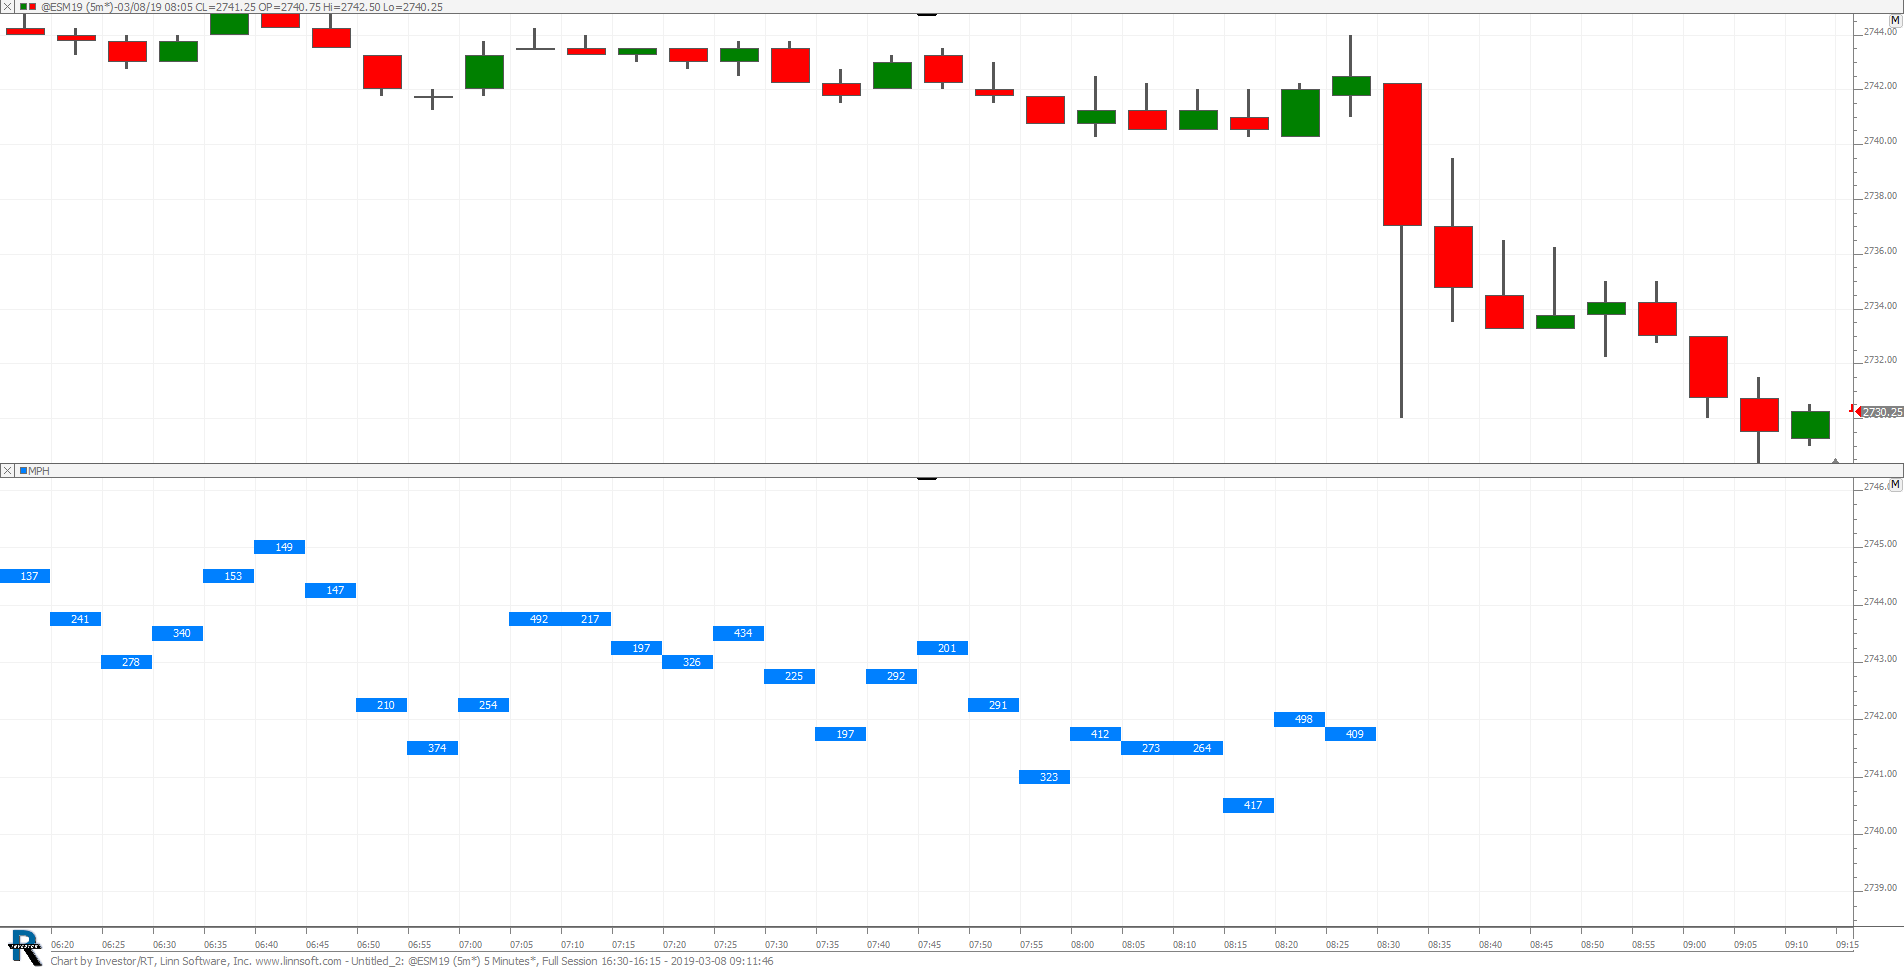 |
Untitled 2 (@ESM19) scooke [totalcount]
7 years 4 months ago
This chart was uploaded by Investor/RT 13.5.23 showing symbol: @ESM19. |
View |
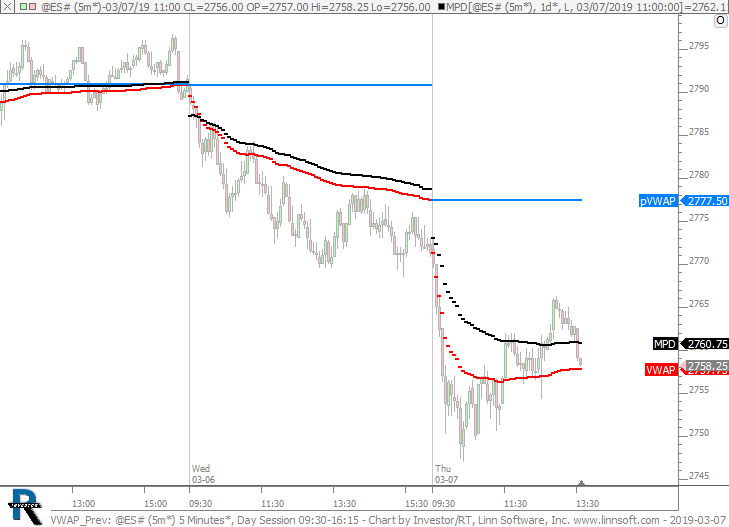 |
VWAP Prev (@ES#) cpayne [totalcount]
7 years 4 months ago
VWAP of Previous Day (Blue Line). This chart was uploaded by Investor/RT 13.5.19 showing symbol: @ES#. |
View |
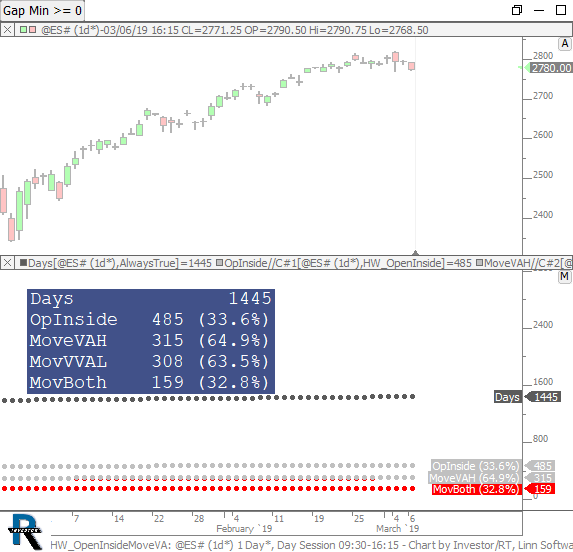 |
HW OpenInsideMoveVA (@ES#) cpayne [totalcount]
7 years 4 months ago
Chart counts how many days we opened inside prev VA. And of those days, how often we moved to VAH, how often to VAL, and how often we moved to both. |
View |
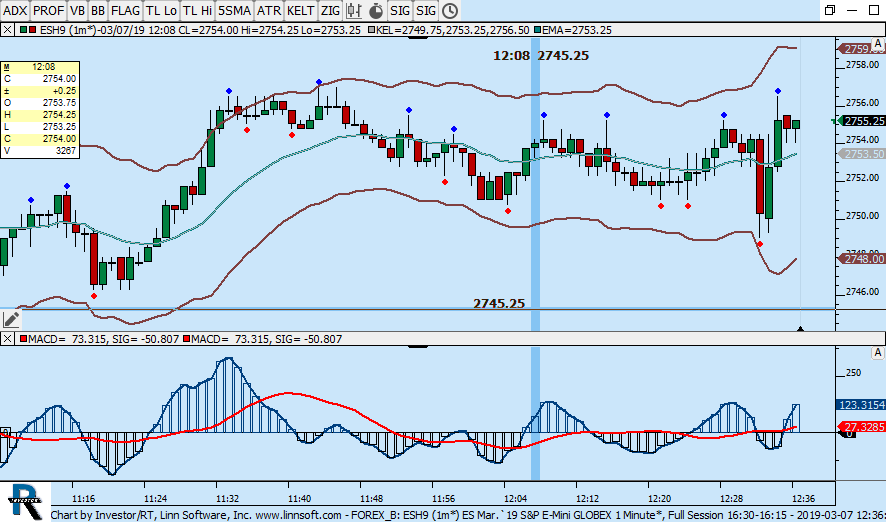 |
FOREX B (ESH9) boris-libman [totalcount]
7 years 4 months ago
This chart was uploaded by Investor/RT 13.5.21 showing symbol: ESH9. |
View |
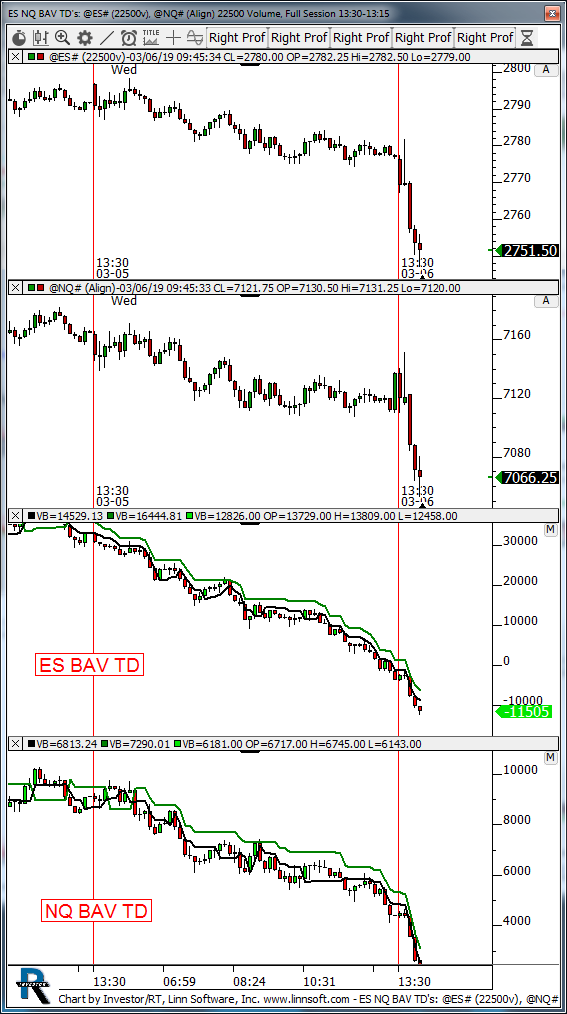 |
ES NQ BAV TDs (@ES#) kencassorla [totalcount]
7 years 4 months ago
es nq. This chart was uploaded by Investor/RT 13.5.21 showing symbol: @ES#. |
View |
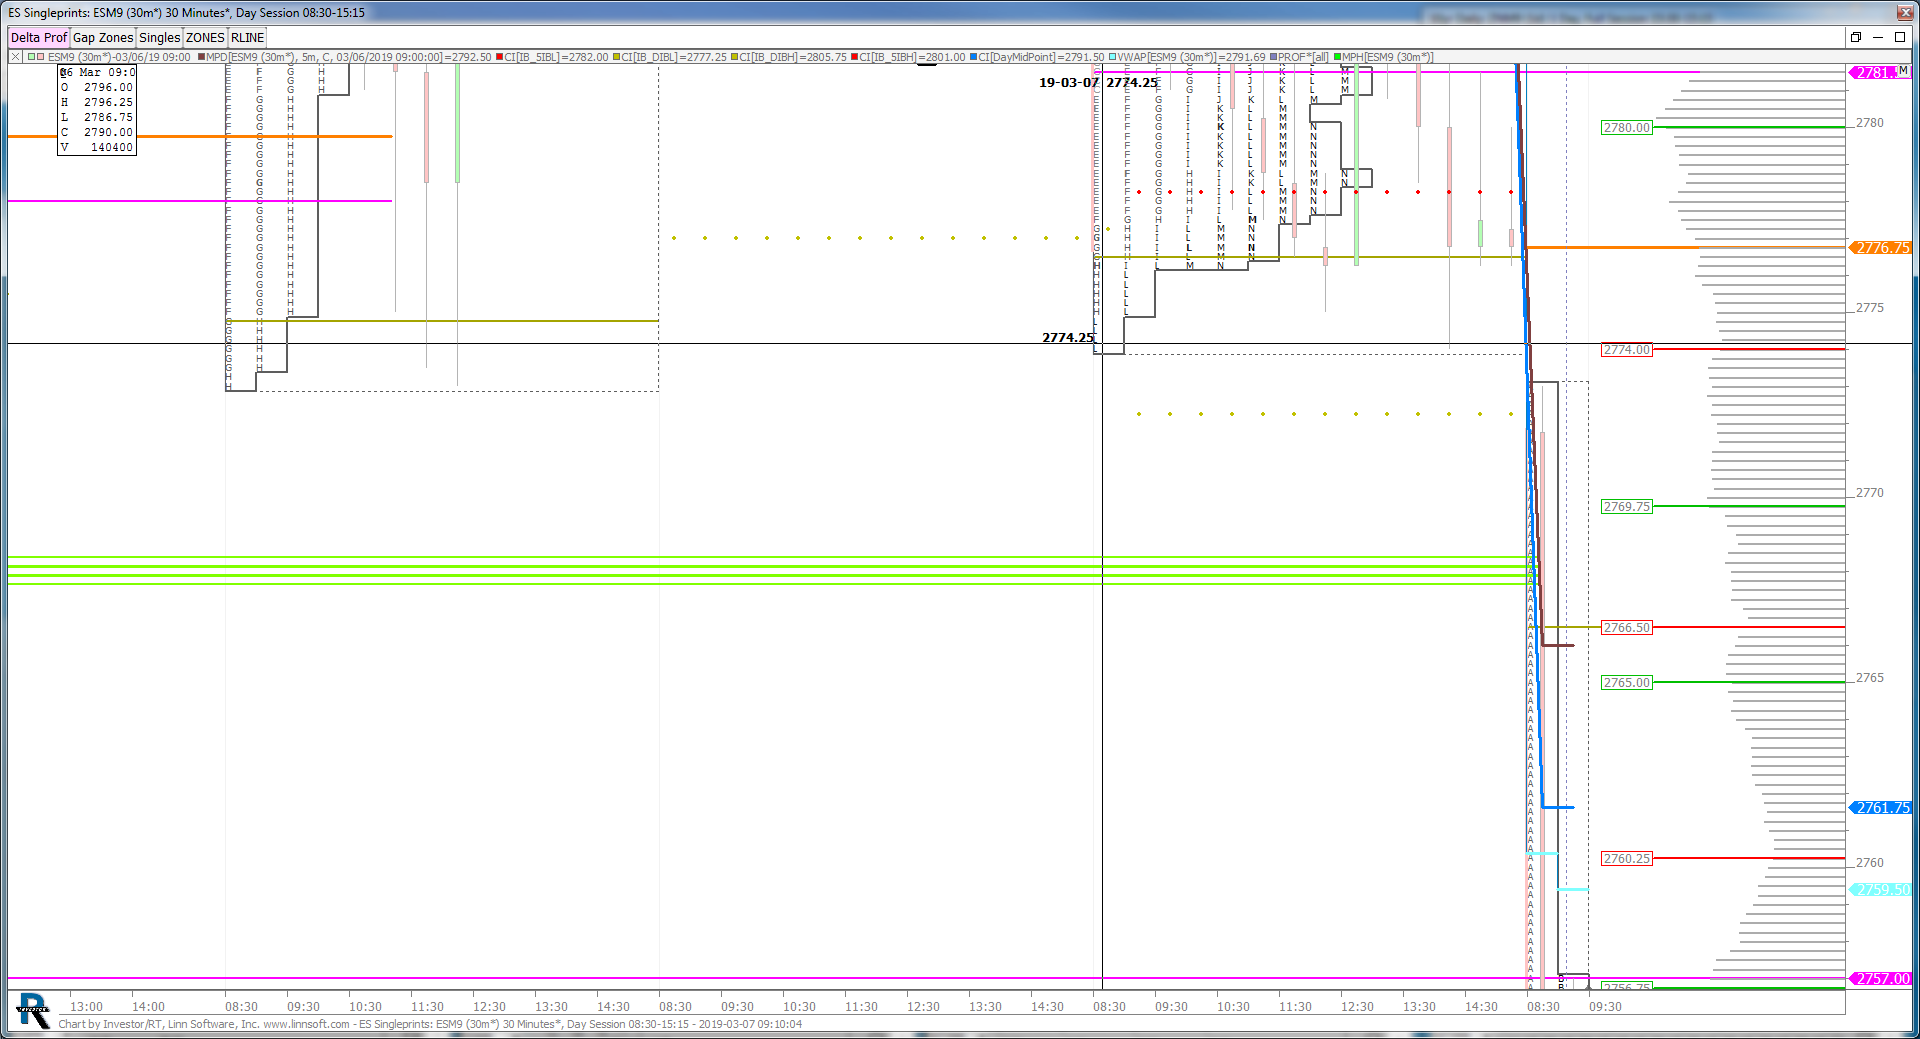 |
ES Singleprints (ESM9) scottz46 [totalcount]
7 years 4 months ago
This chart was uploaded by Investor/RT 13.5.21 showing symbol: ESM9. |
View |
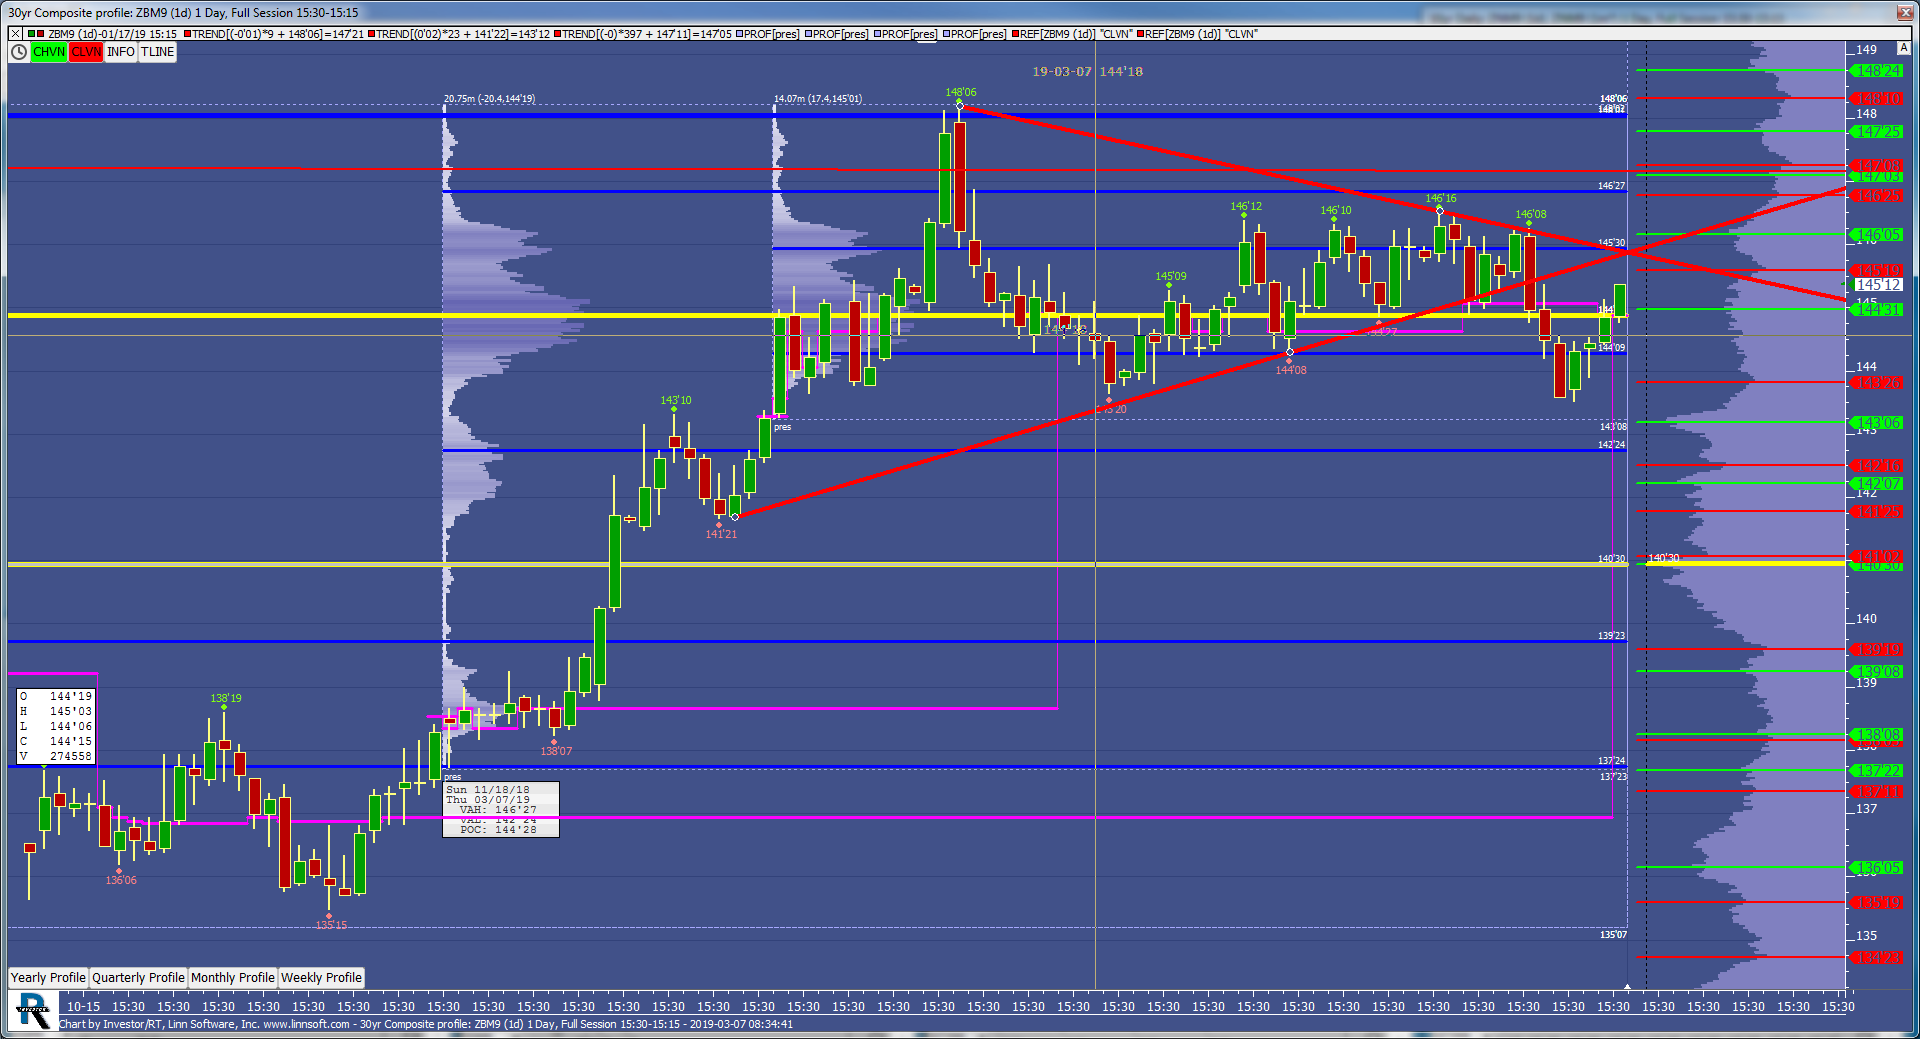 |
30yr Composite profile (ZBM9) scottz46 [totalcount]
7 years 4 months ago
This chart was uploaded by Investor/RT 13.5.21 showing symbol: ZBM9. |
View |
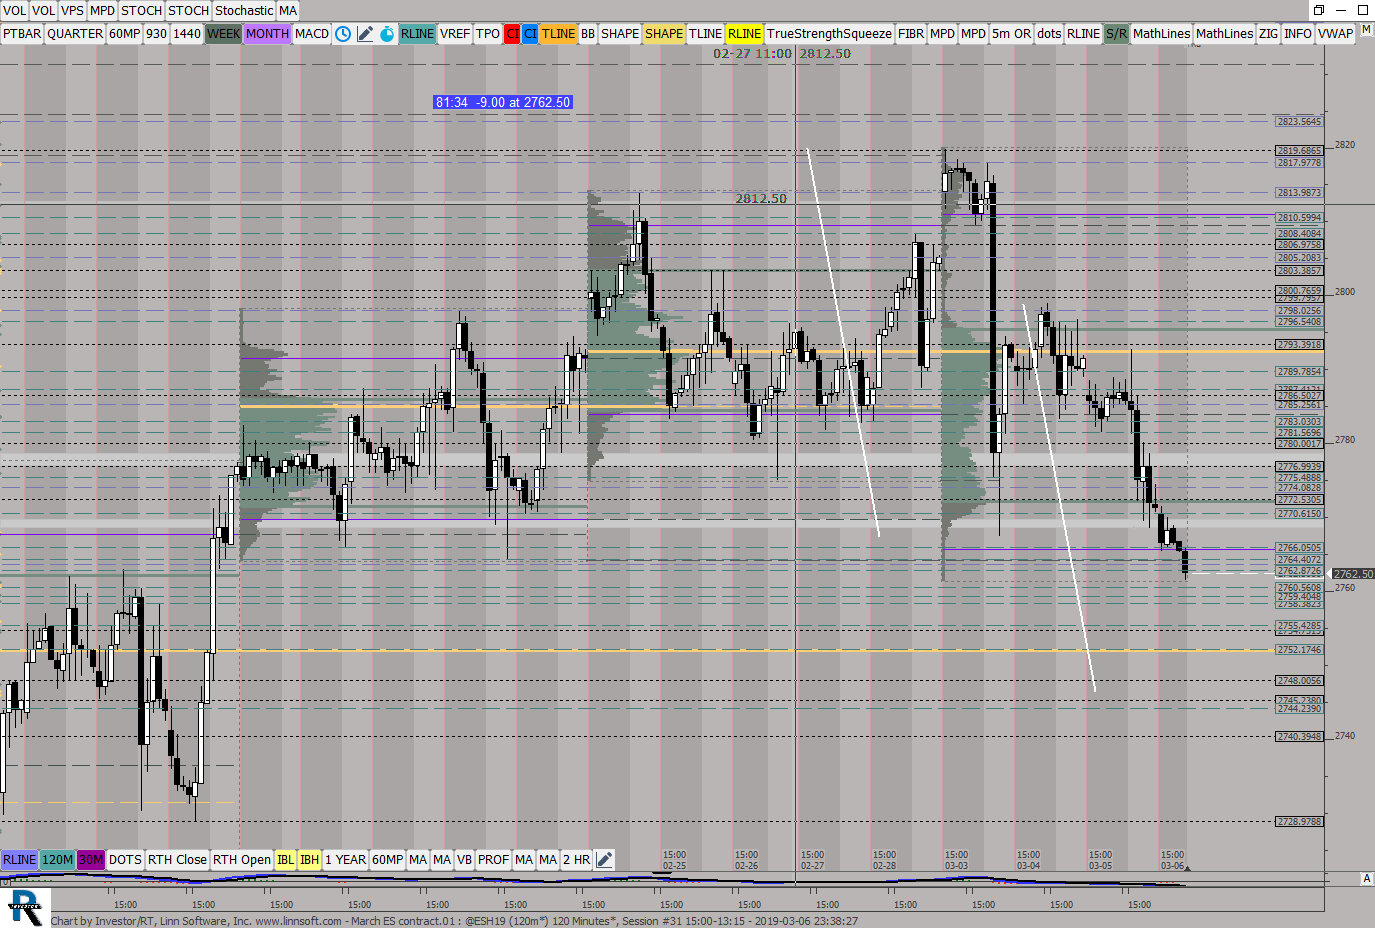 |
March ES contract (@ESH19) ES42 [totalcount]
7 years 4 months ago
This chart was uploaded by Investor/RT 13.5.21 showing symbol: @ESH19. |
View |