 |
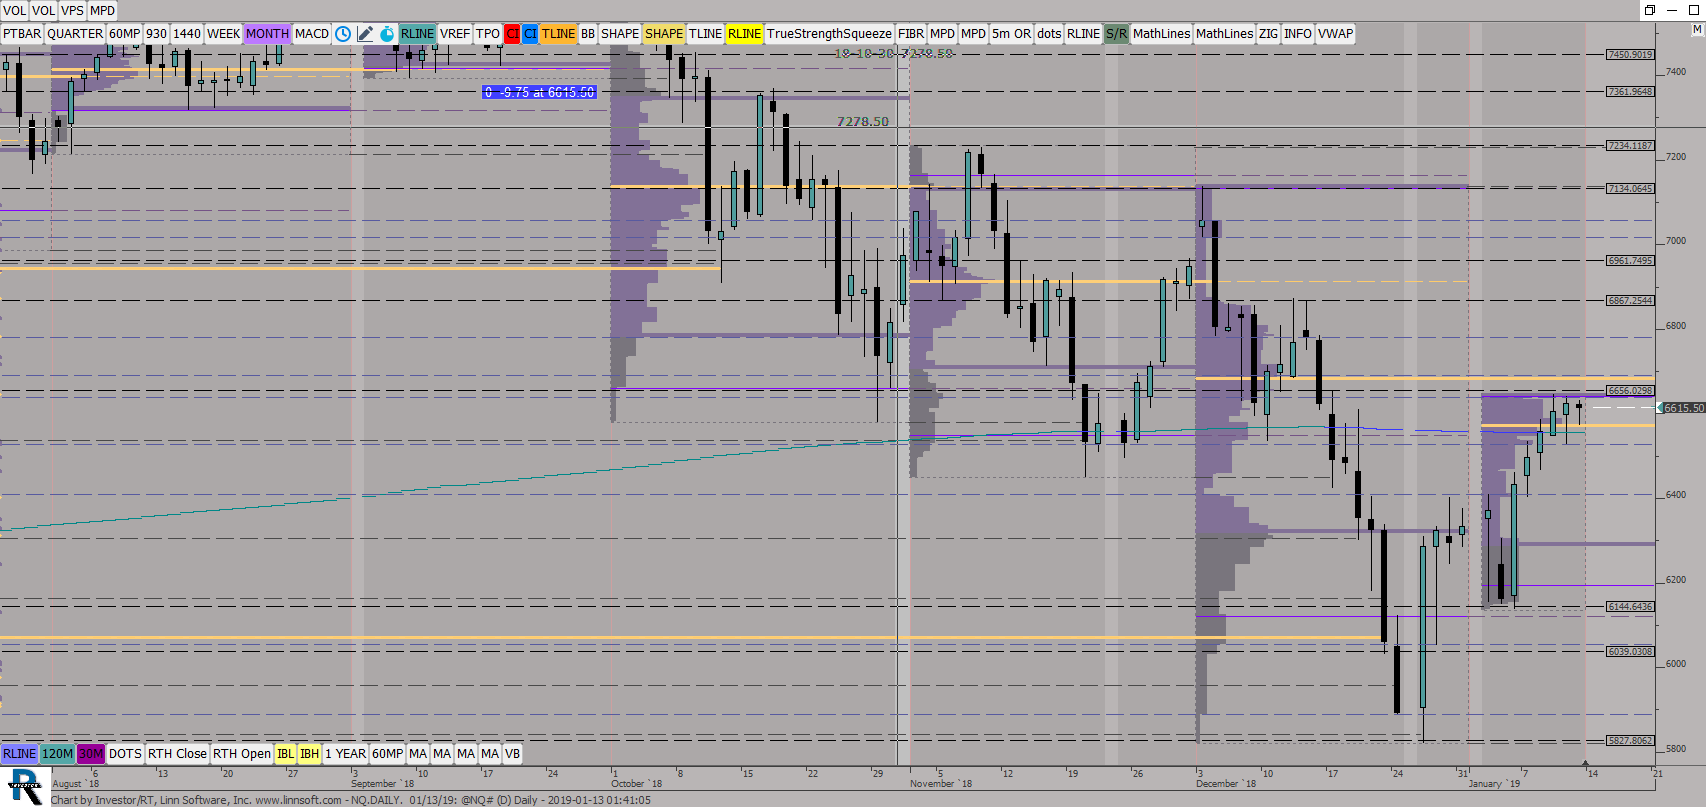
NQDAILY 01 13 (@NQ#) ES42 [totalcount]
7 years 6 months ago
This chart was uploaded by Investor/RT 13.5.14 showing symbol: @NQ#. |
View |
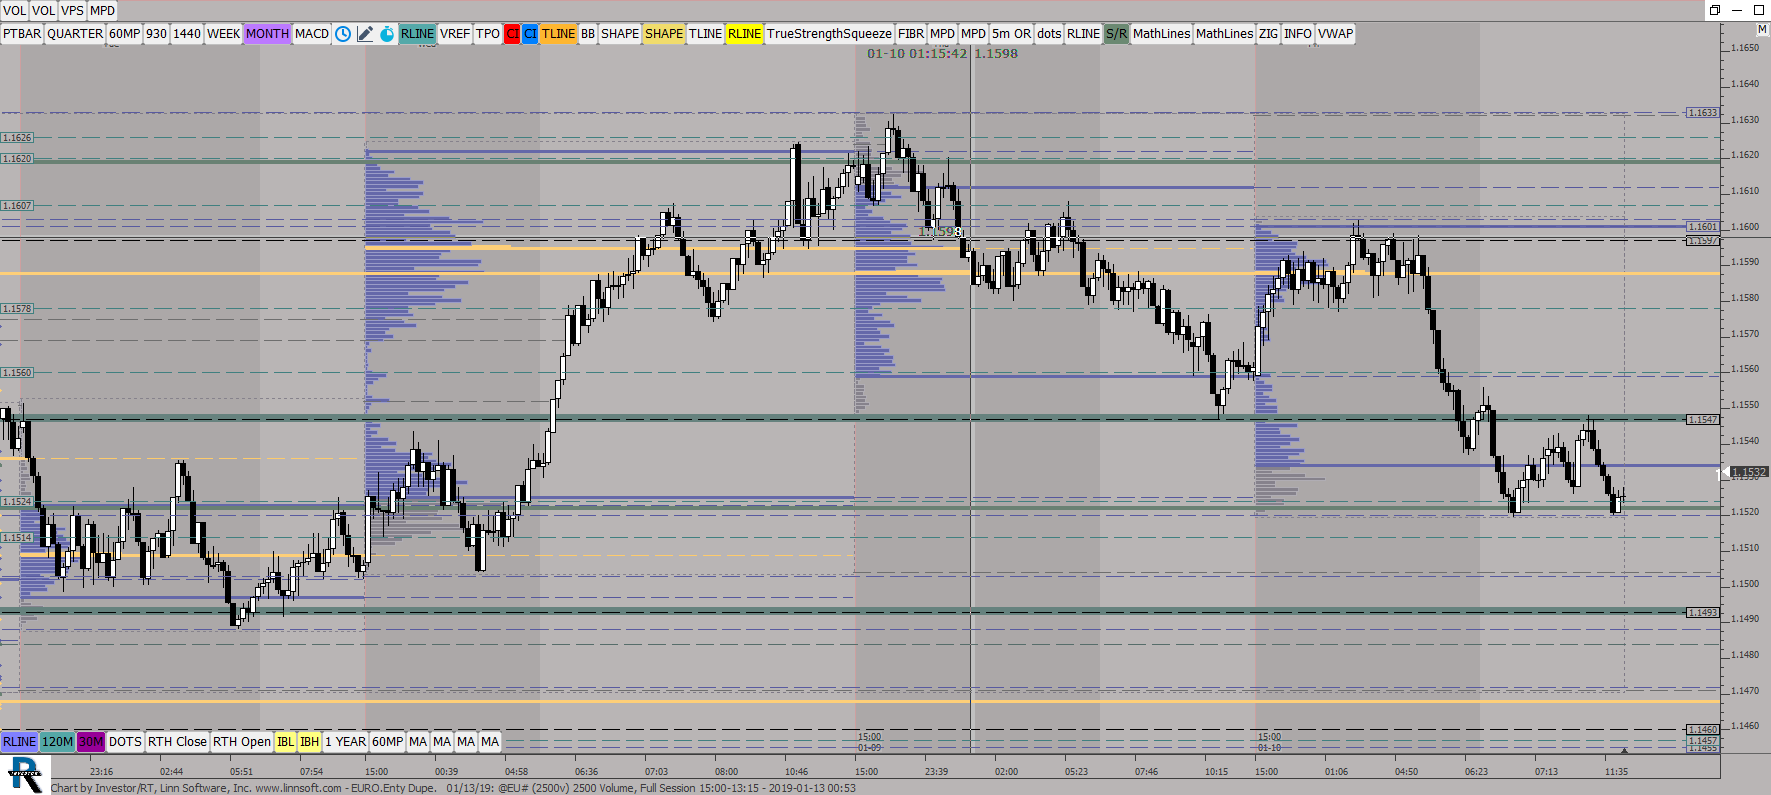 |
EUROEnty Dupe 01 13 (@EU#) ES42 [totalcount]
7 years 6 months ago
This chart was uploaded by Investor/RT 13.5.14 showing symbol: @EU#. |
View |
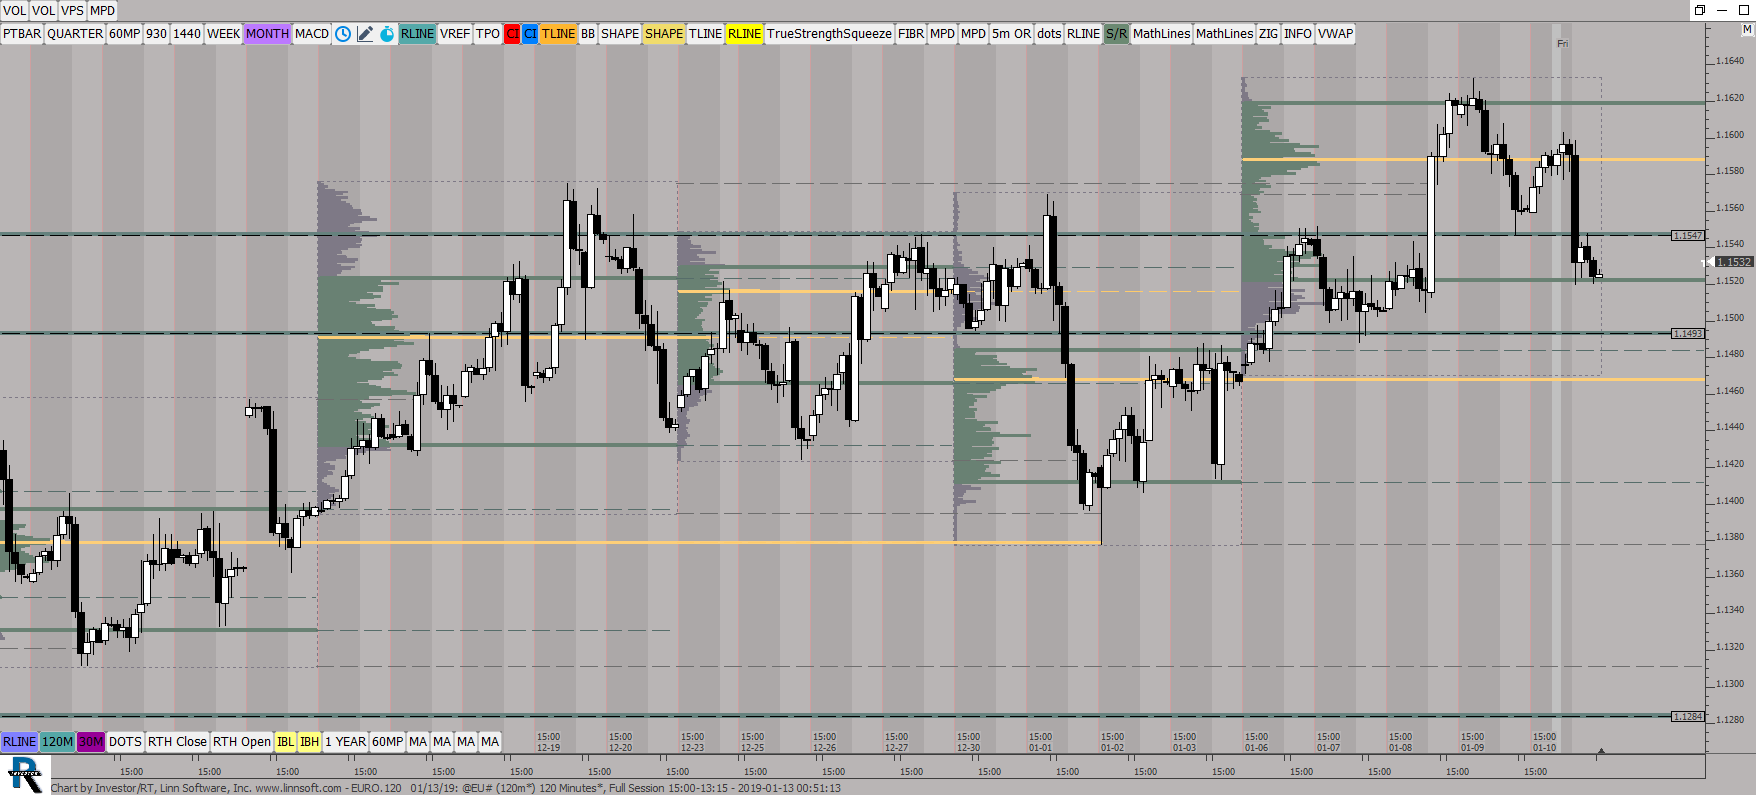 |
EURO120 01 13 (@EU#) ES42 [totalcount]
7 years 6 months ago
This chart was uploaded by Investor/RT 13.5.14 showing symbol: @EU#. |
View |
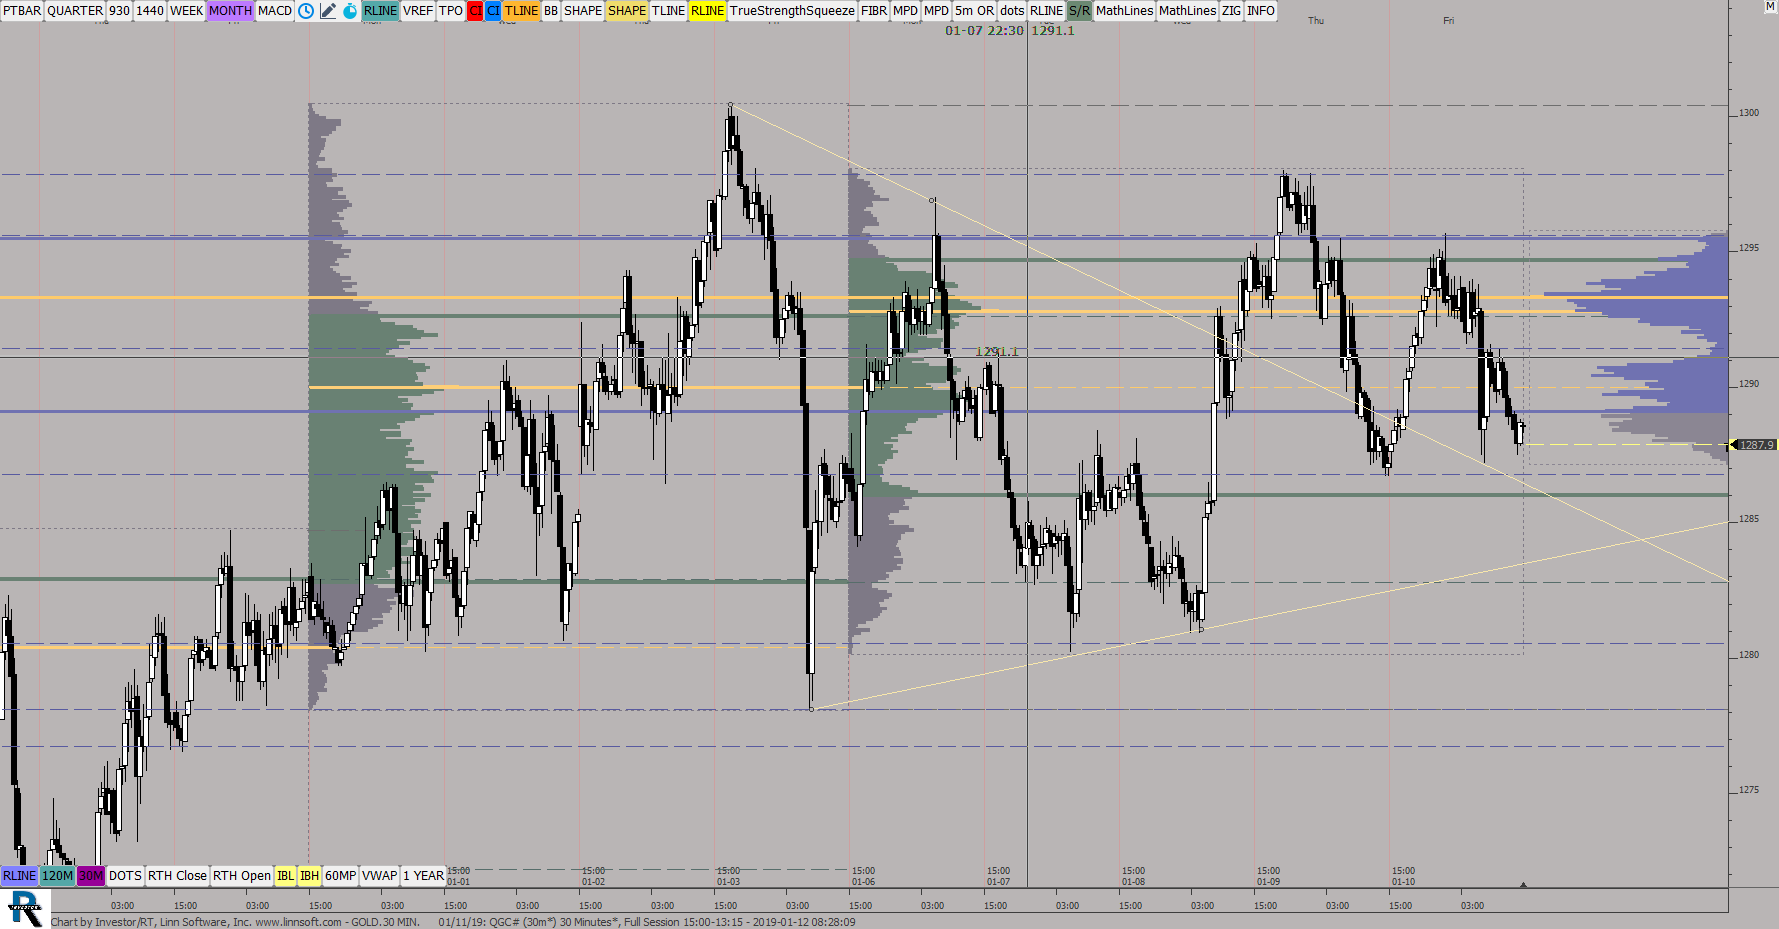 |
GOLD30 MIN 01 11 (QGC#) ES42 [totalcount]
7 years 6 months ago
This chart was uploaded by Investor/RT 13.5.14 showing symbol: QGC#. |
View |
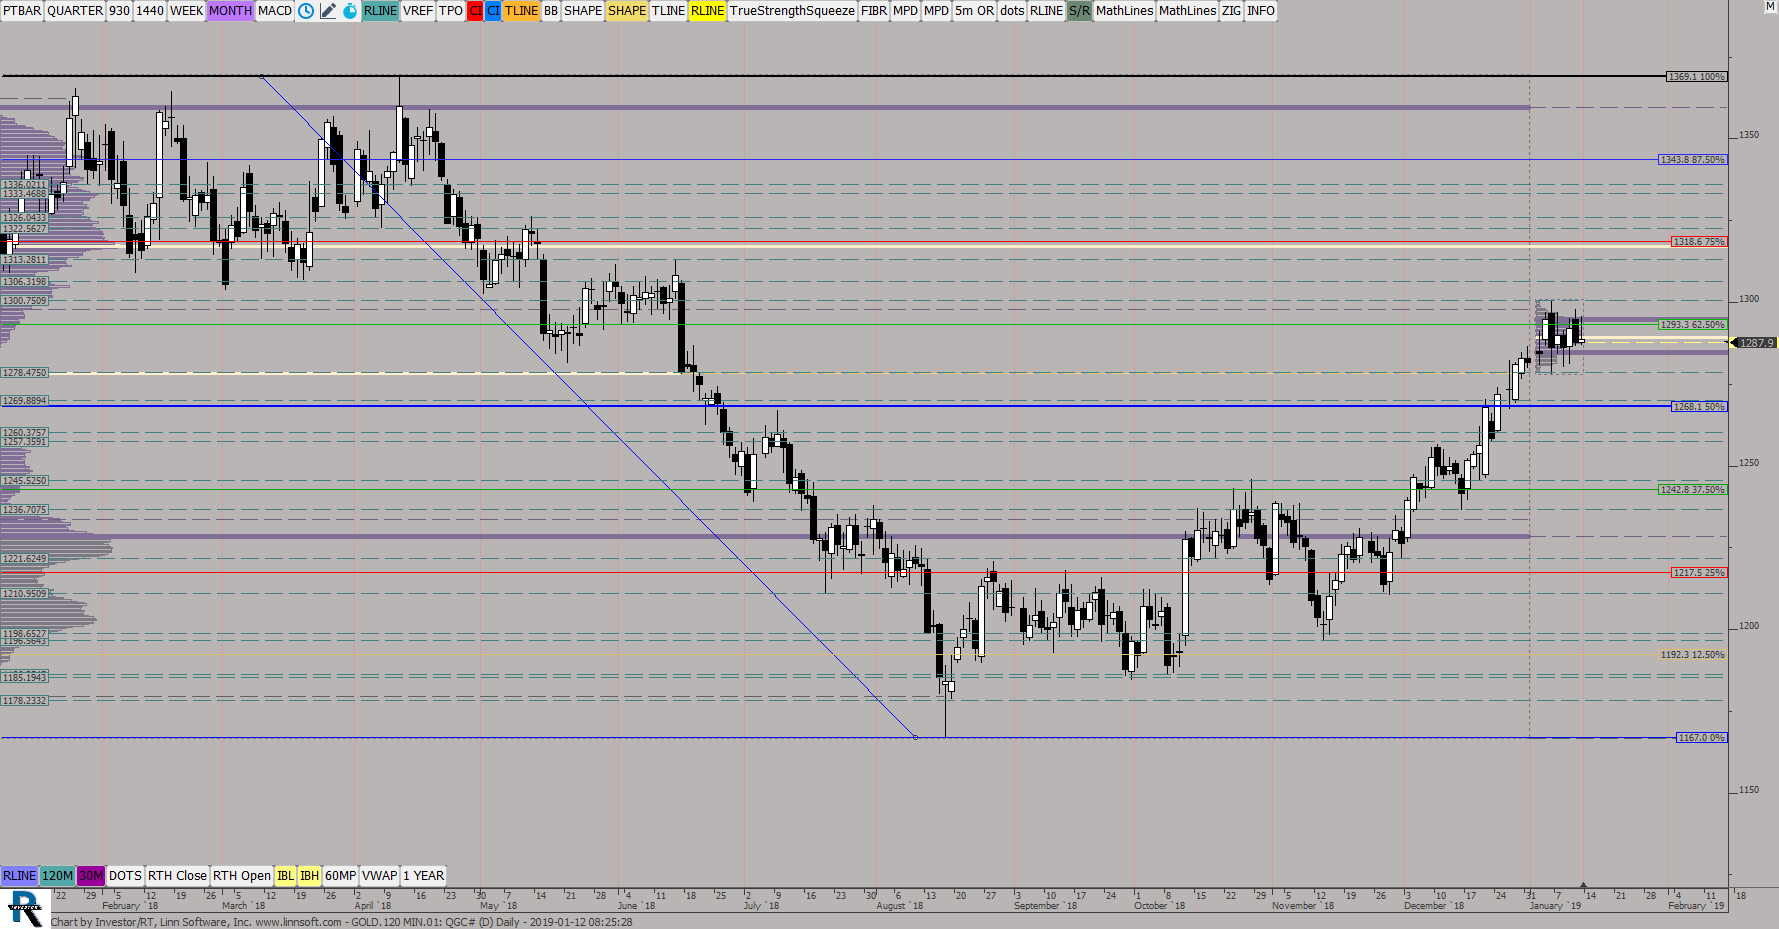 |
GOLD120 MIN (QGC#) ES42 [totalcount]
7 years 6 months ago
This chart was uploaded by Investor/RT 13.5.14 showing symbol: QGC#. |
View |
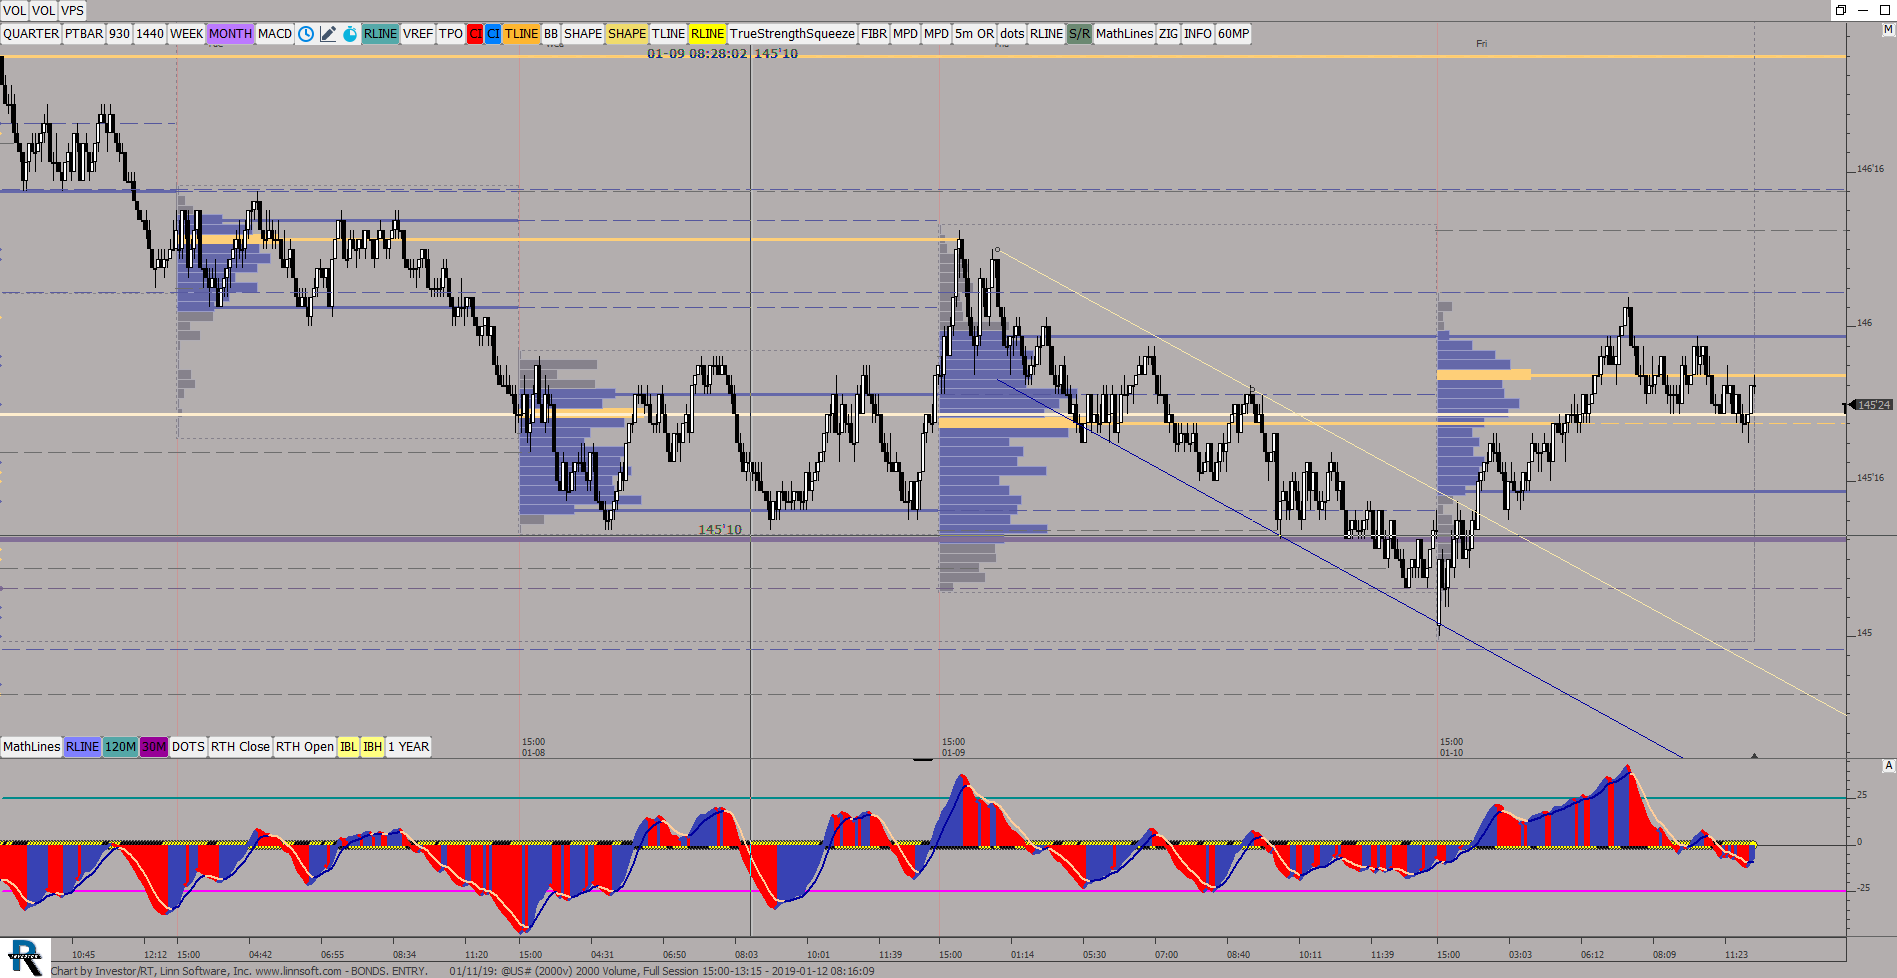 |
BONDS ENTRY 01 11 (@US#) ES42 [totalcount]
7 years 6 months ago
This chart was uploaded by Investor/RT 13.5.14 showing symbol: @US#. |
View |
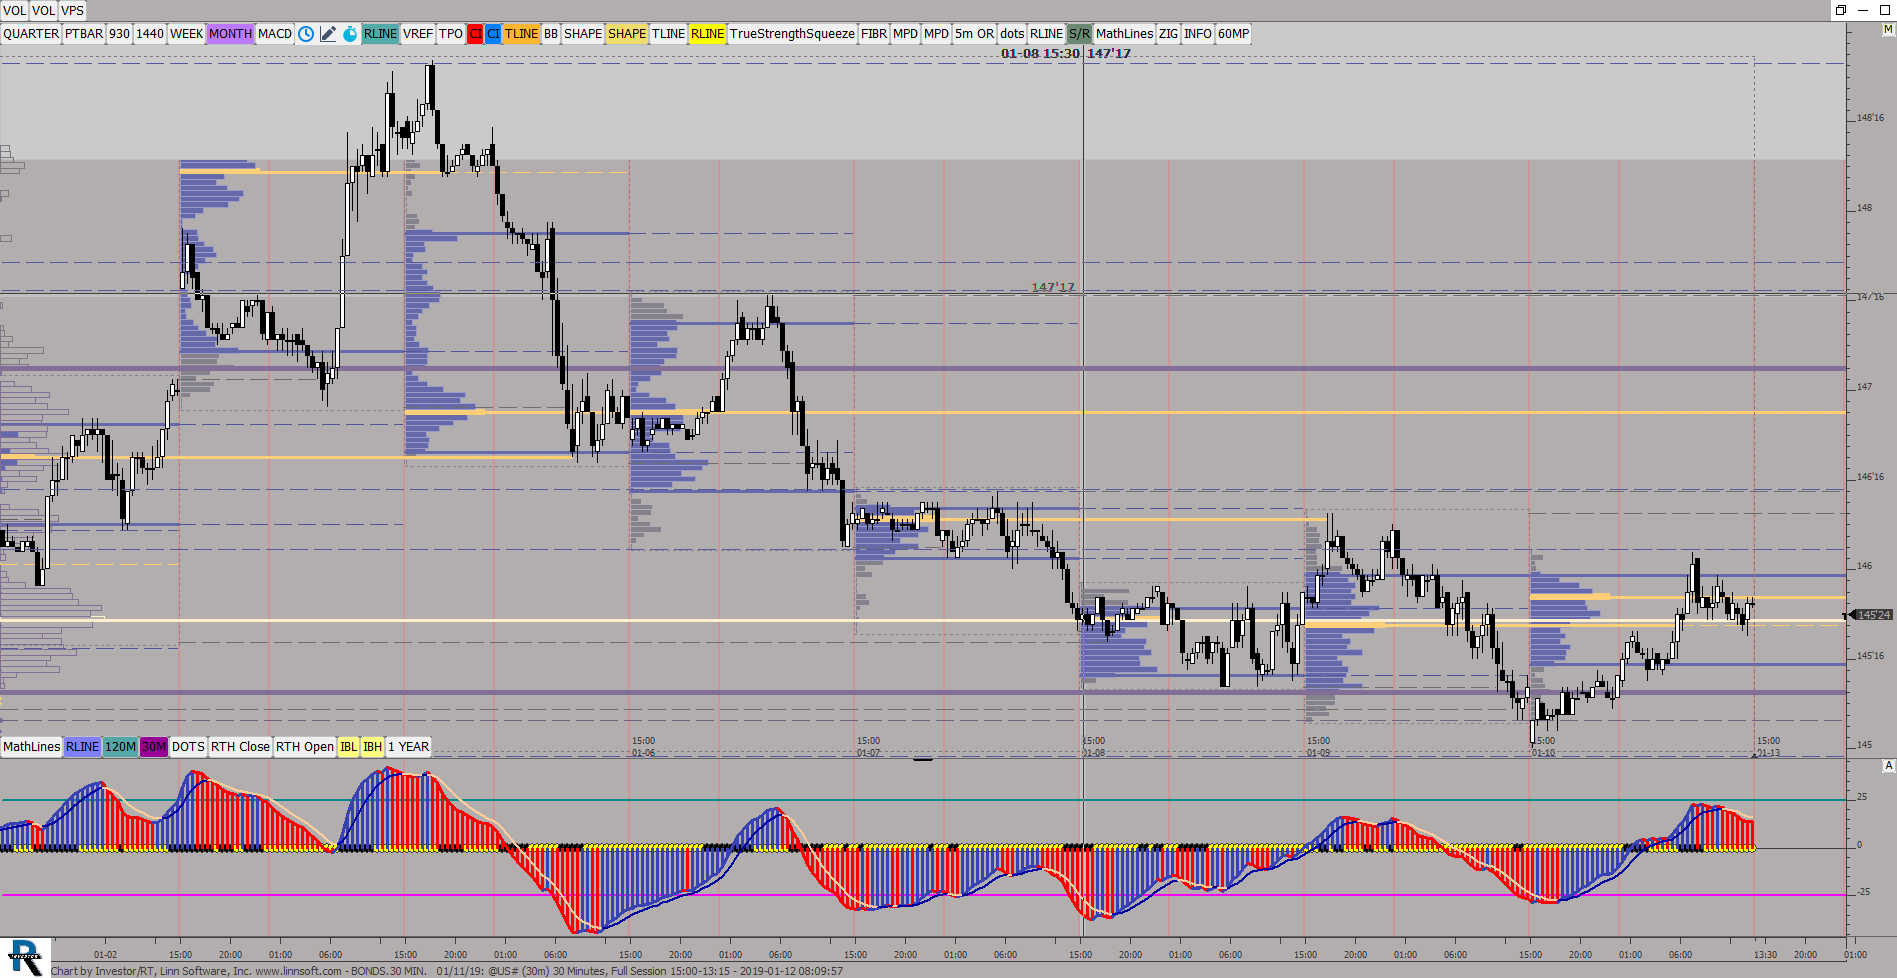 |
BONDS30 MIN 01 11 (@US#) ES42 [totalcount]
7 years 6 months ago
This chart was uploaded by Investor/RT 13.5.14 showing symbol: @US#. |
View |
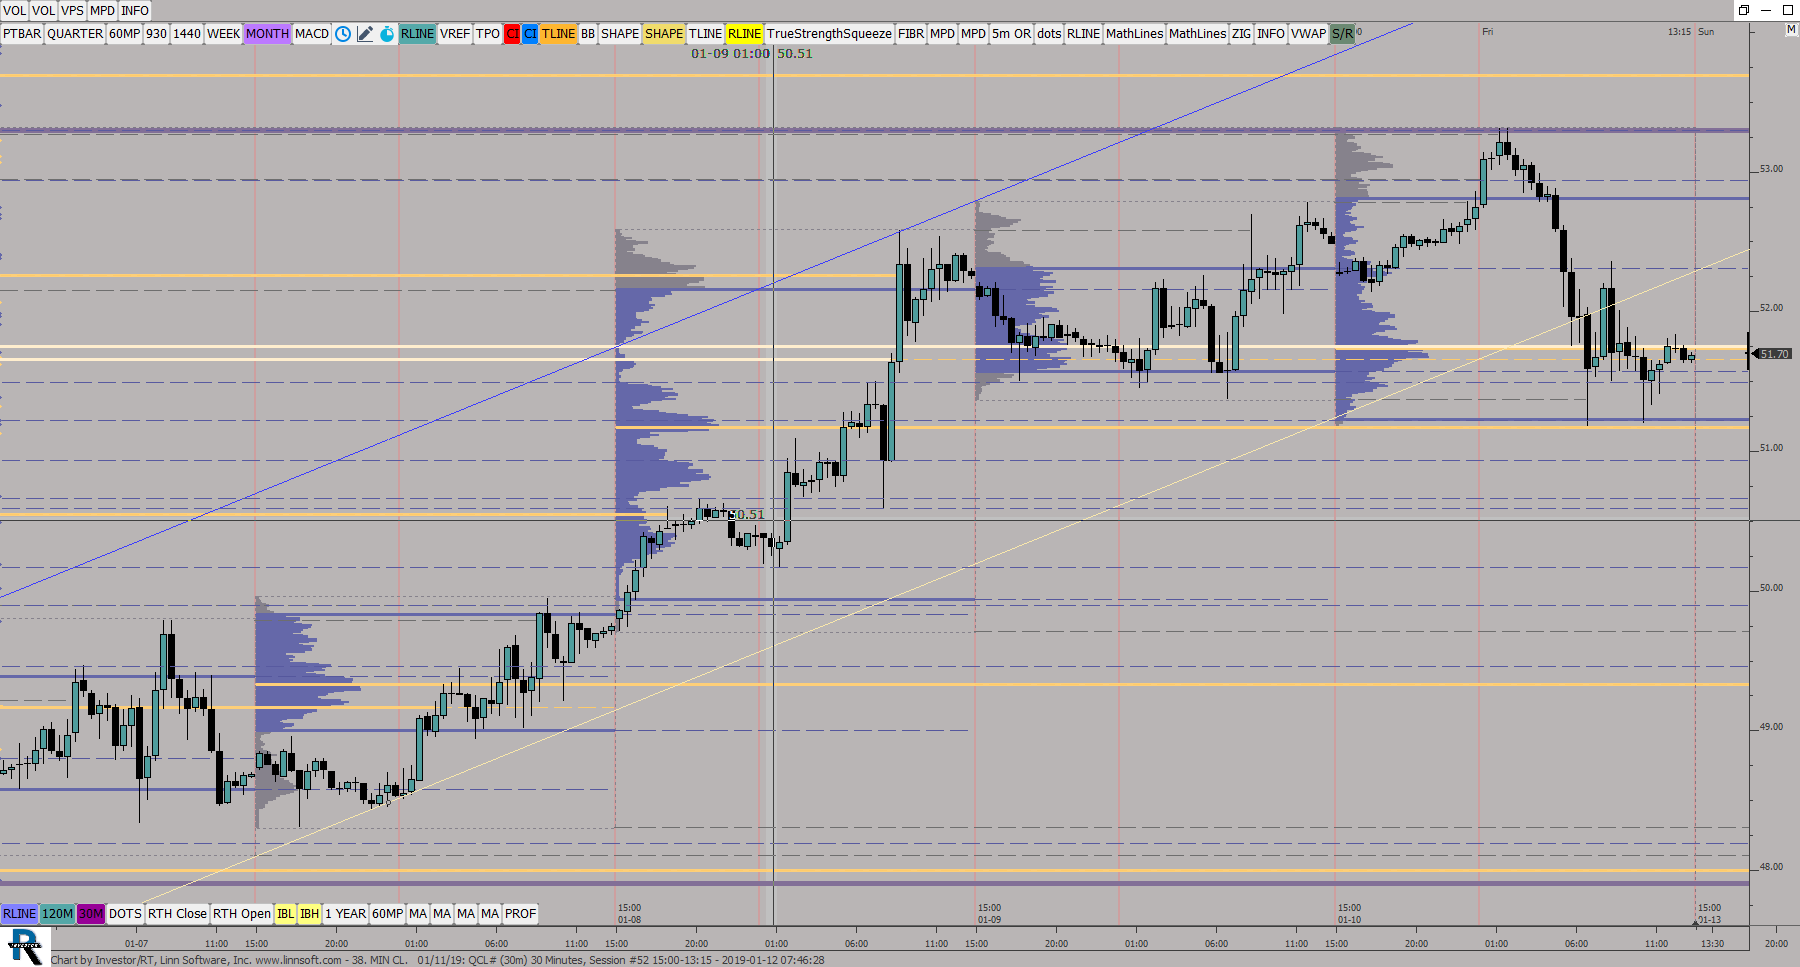 |
38 MIN CL 01 11 (QCL#) ES42 [totalcount]
7 years 6 months ago
This chart was uploaded by Investor/RT 13.5.14 showing symbol: QCL#. |
View |
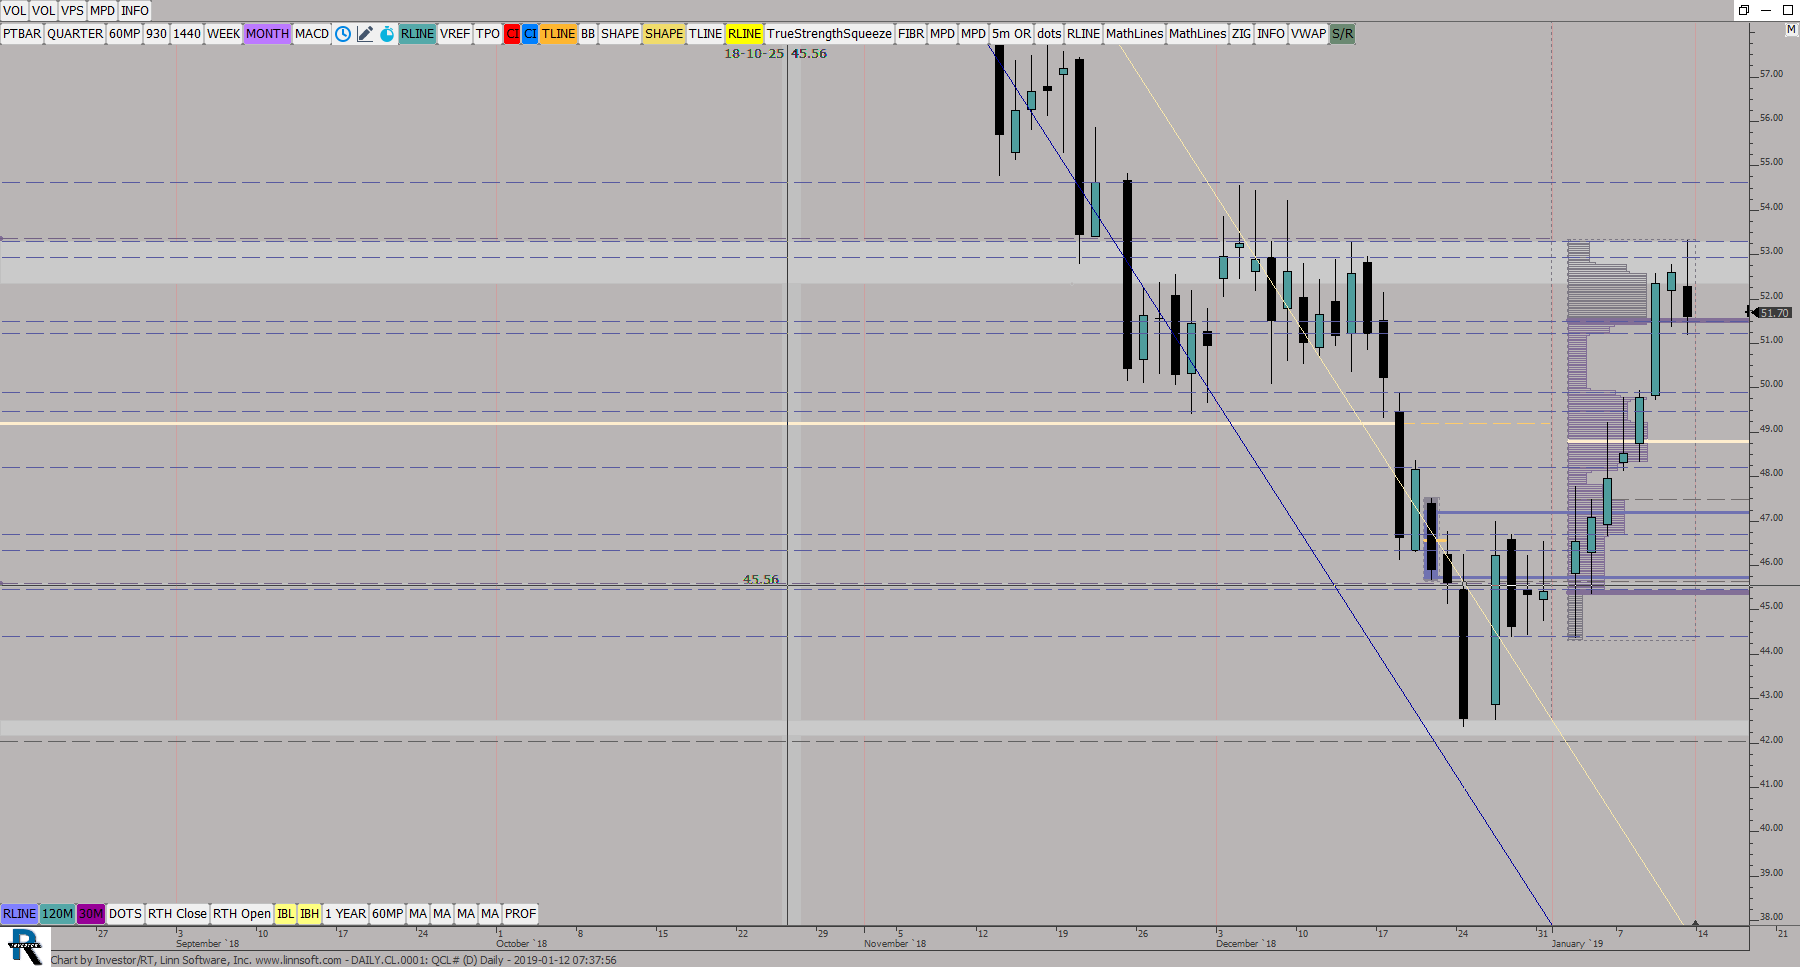 |
DAILYCL (QCL#) ES42 [totalcount]
7 years 6 months ago
This chart was uploaded by Investor/RT 13.5.14 showing symbol: QCL#. |
View |
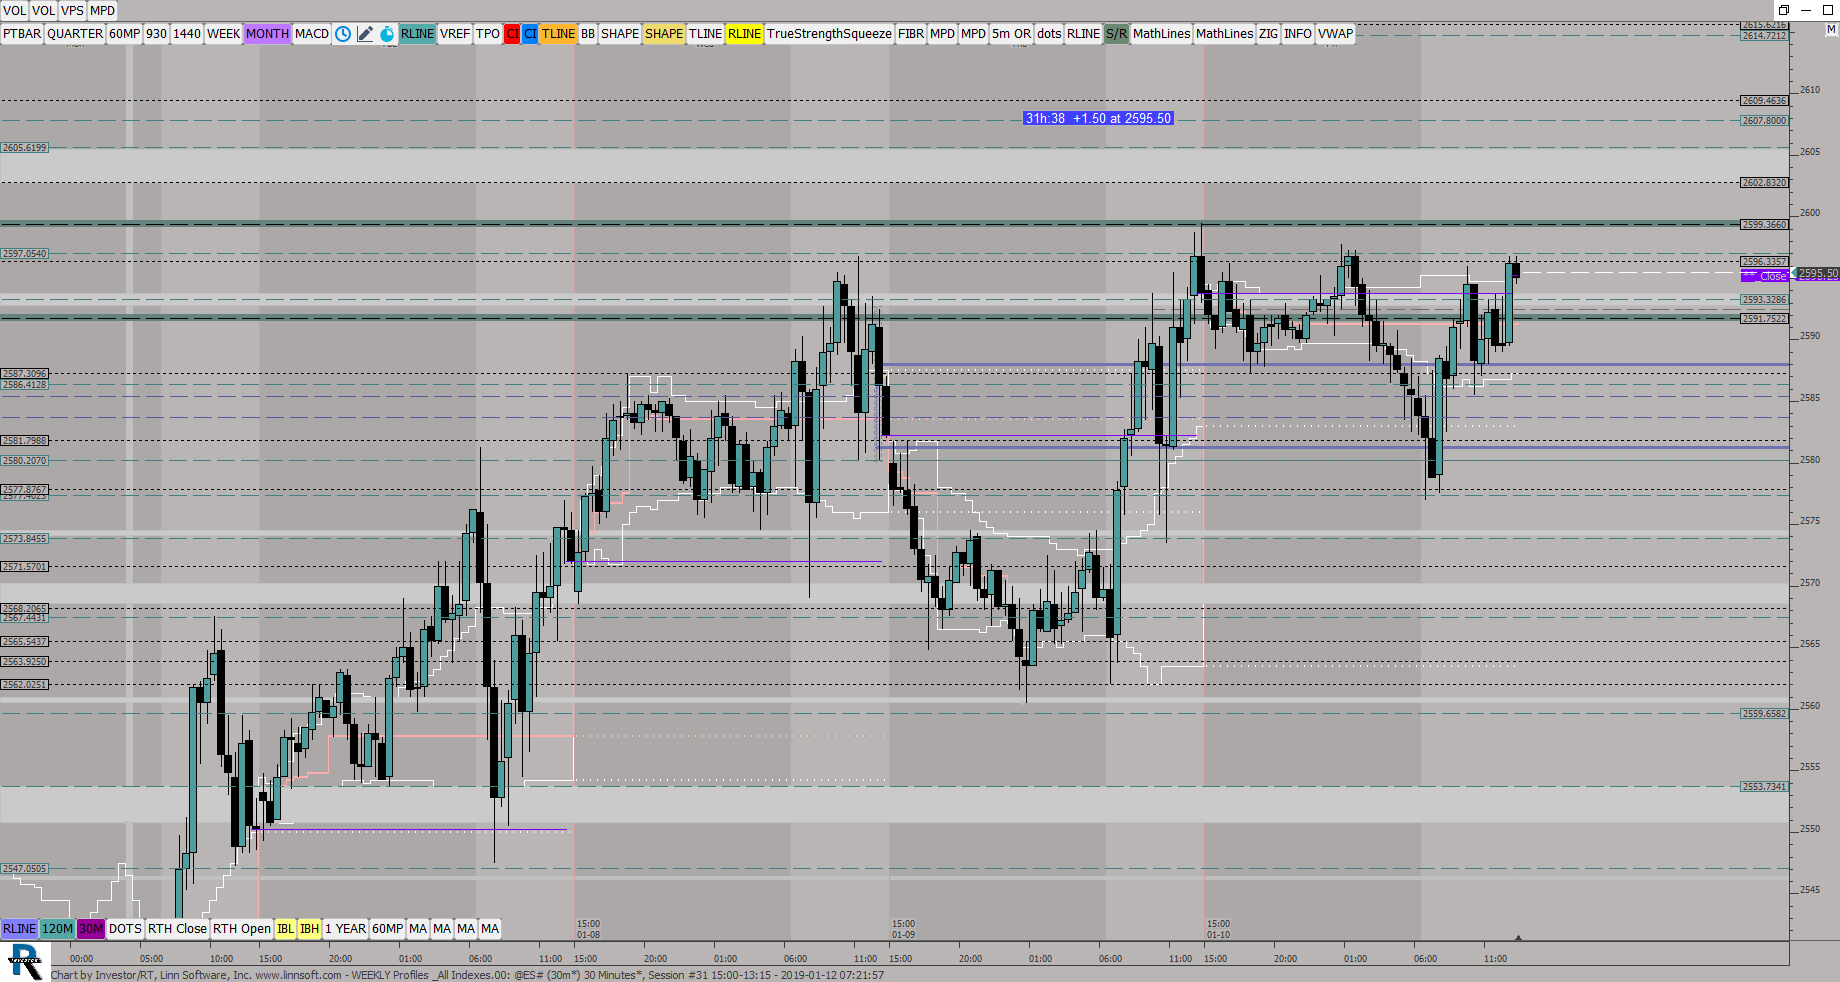 |
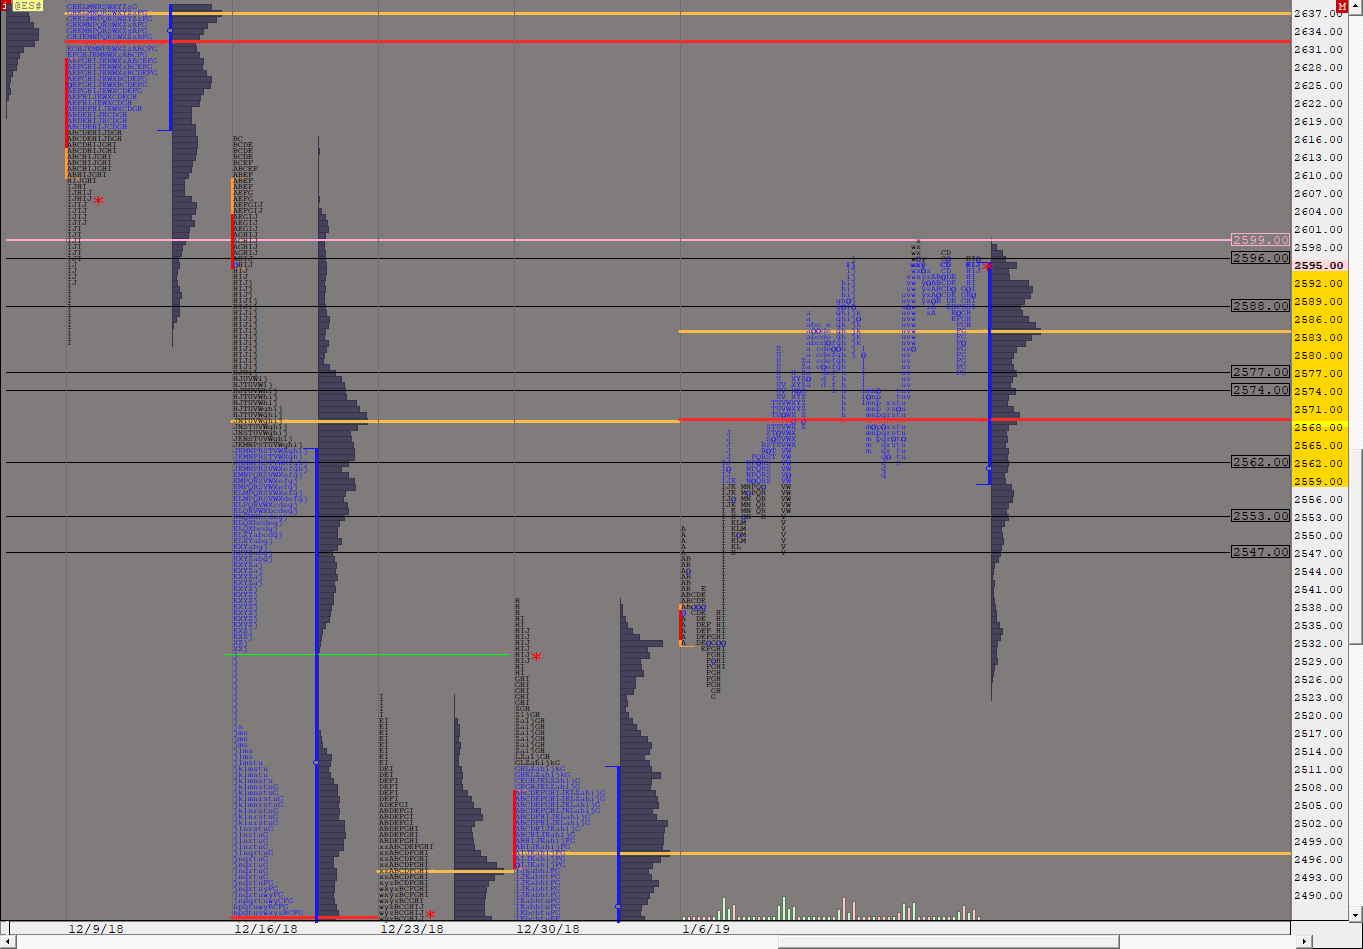
WEEKLY Profiles All Indexes (@ES#) ES42 [totalcount]
7 years 6 months ago
This chart was uploaded by Investor/RT 13.5.14 showing symbol: @ES#. |
View |
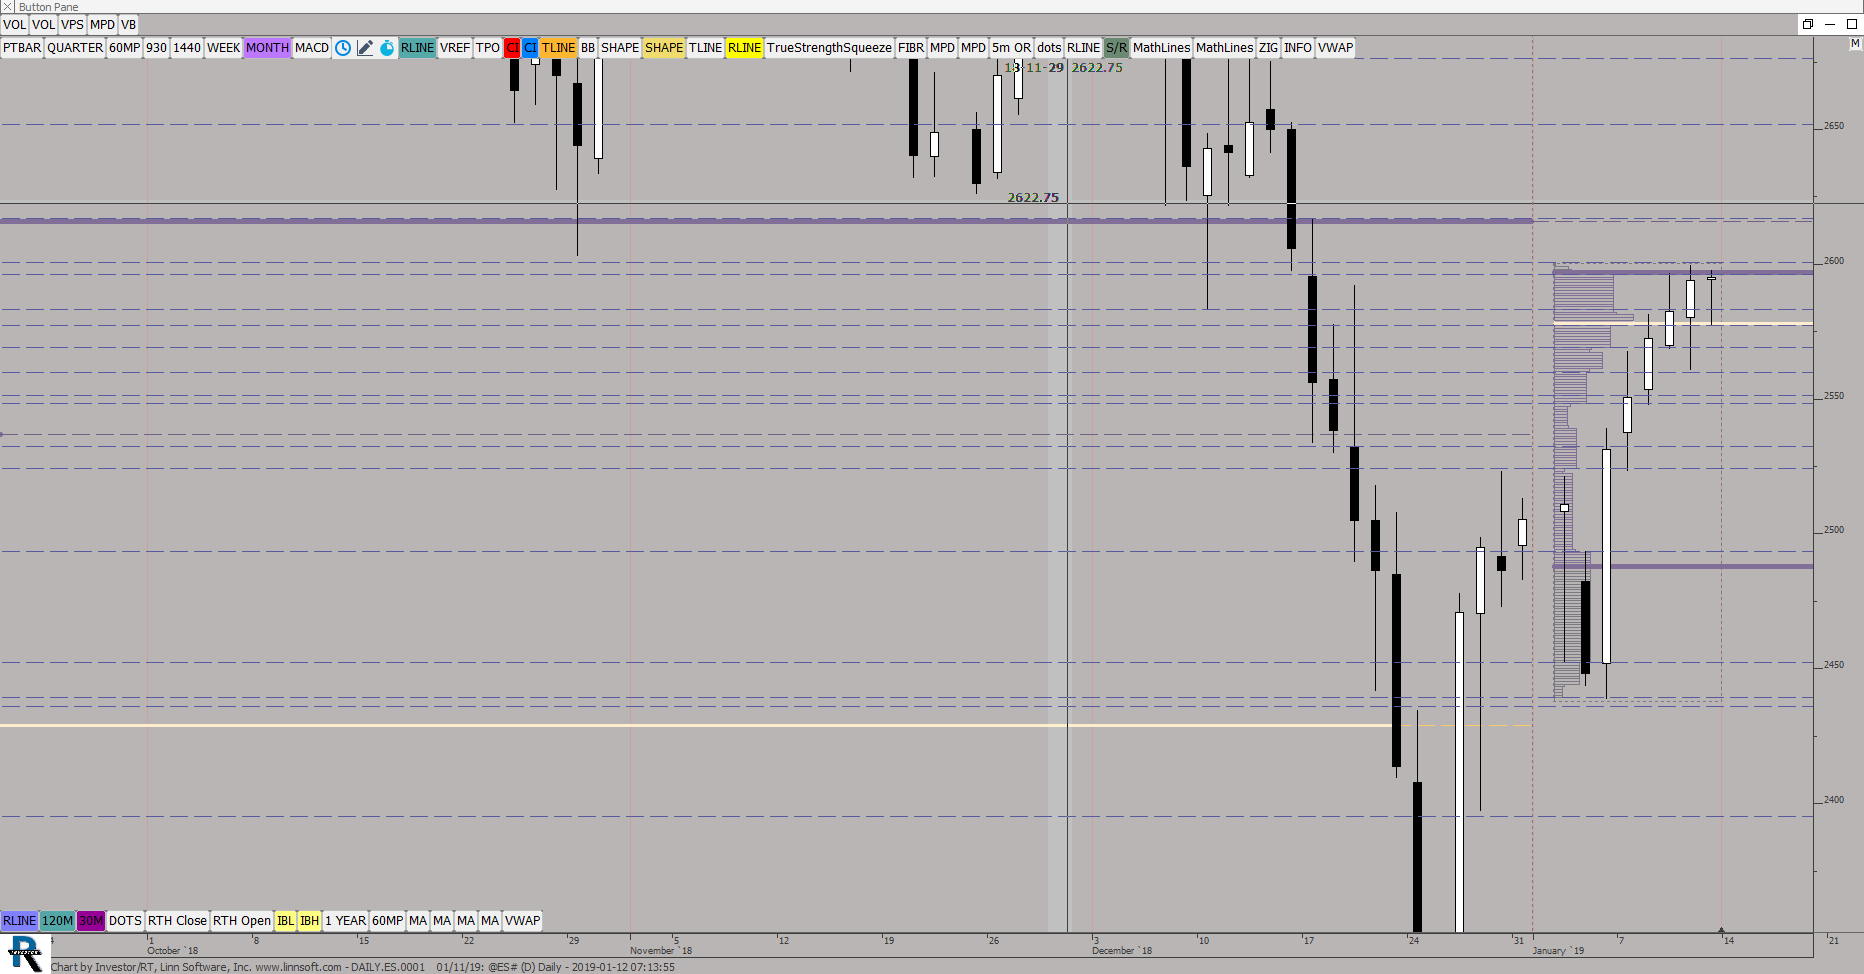 |
DAILYES0001 01 11 (@ES#) ES42 [totalcount]
7 years 6 months ago
This chart was uploaded by Investor/RT 13.5.14 showing symbol: @ES#. |
View |
 |
EOMP WEEKLY Rainbow Chart (@ES#) ES42 [totalcount]
7 years 6 months ago
This chart was uploaded by Investor/RT 13.3.5 showing symbol: @ES#. |
View |
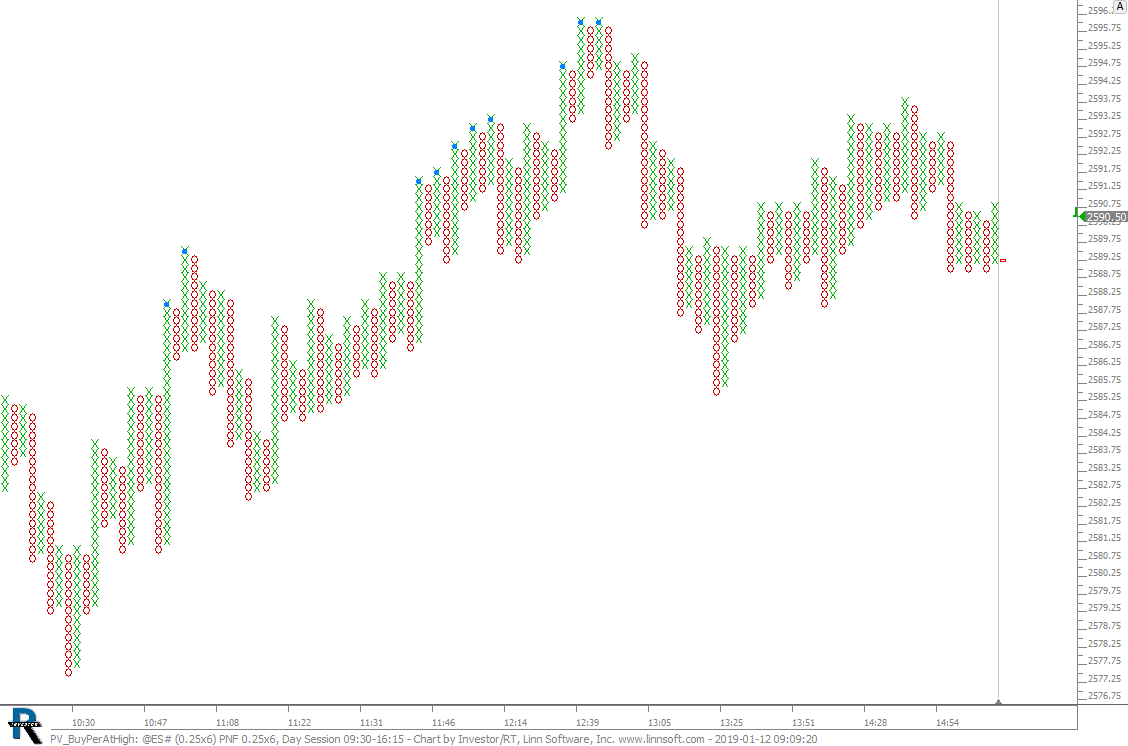 |
PV BuyPerAtHigh (@ES#) cpayne [totalcount]
7 years 6 months ago
This chart was uploaded by Investor/RT 13.5.14 showing symbol: @ES#. |
View |
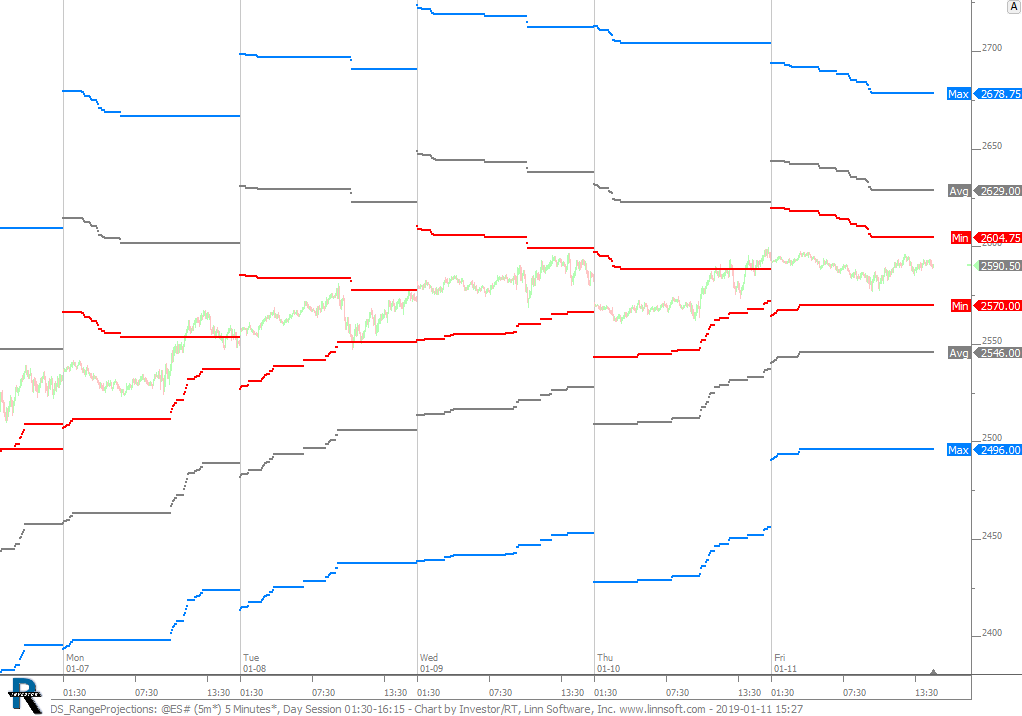 |
DS RangeProjections (@ES#) cpayne [totalcount]
7 years 6 months ago
DS Range Projections. This chart was uploaded by Investor/RT 13.5.14 showing symbol: @ES#. |
View |
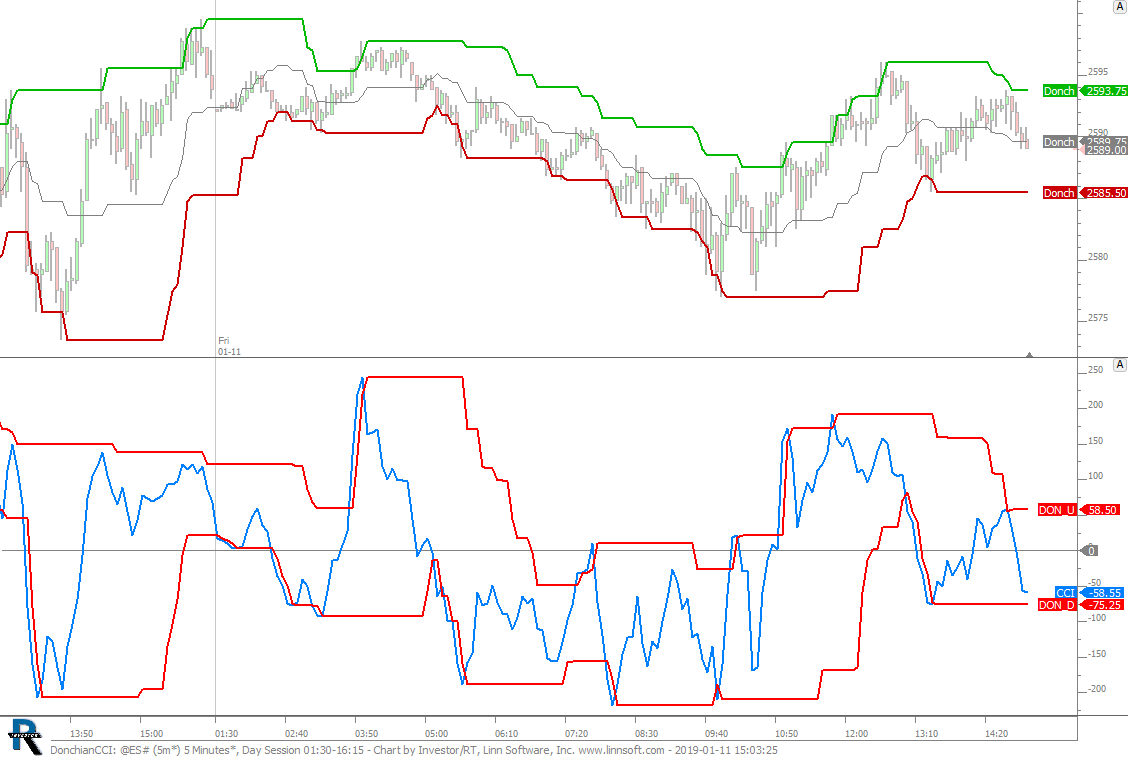 |
DonchianCCI (@ES#) cpayne [totalcount]
7 years 6 months ago
Donchian of CCI. This chart was uploaded by Investor/RT 13.5.14 showing symbol: @ES#. |
View |
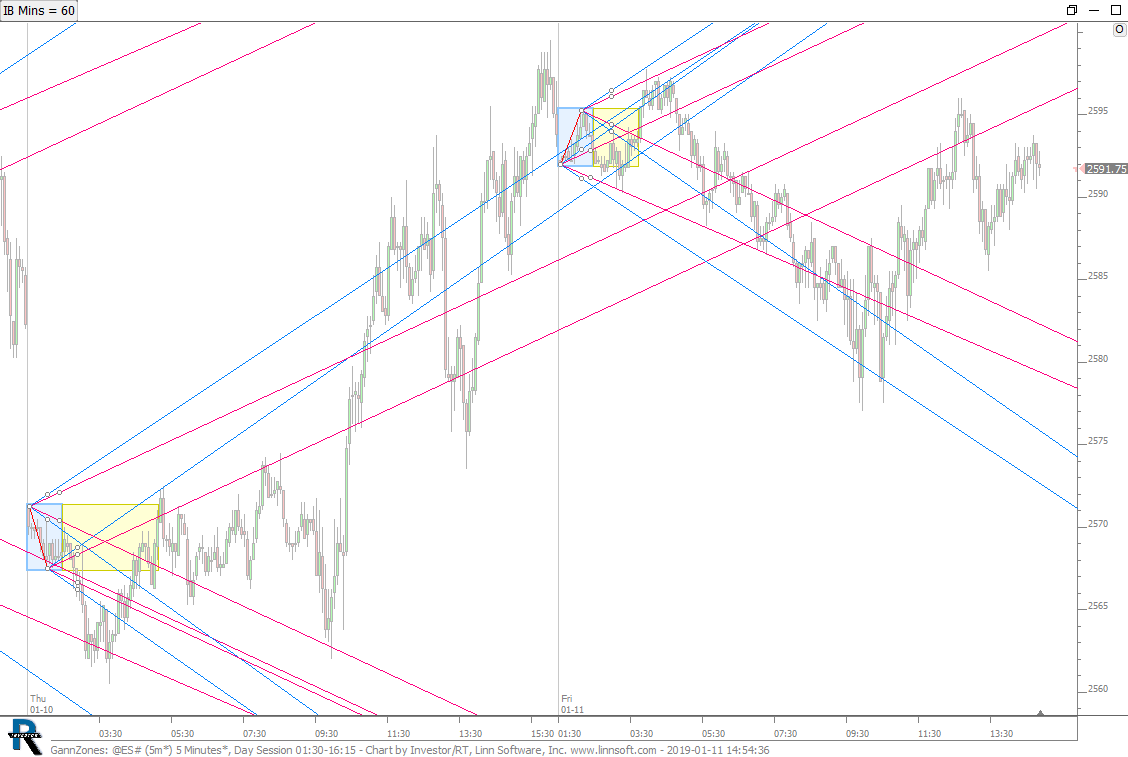 |
GannZones (@ES#) cpayne [totalcount]
7 years 6 months ago
Gann Zones. This chart was uploaded by Investor/RT 13.5.14 showing symbol: @ES#. |
View |
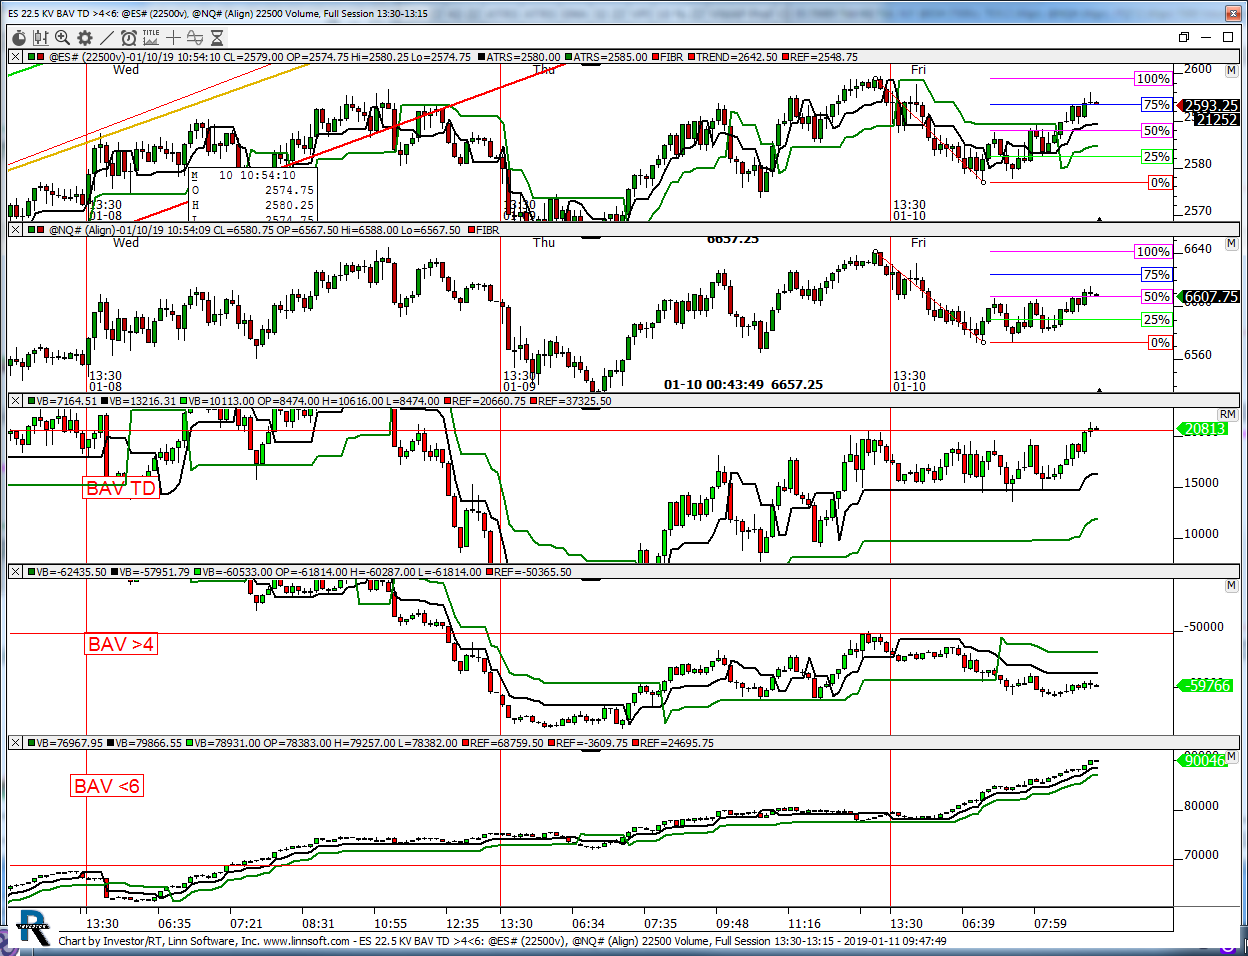 |
ES 225 KV BAV TD 46 (@ES#) kencassorla [totalcount]
7 years 6 months ago
22.5 KV. This chart was uploaded by Investor/RT 13.5.12 showing symbol: @ES#. |
View |
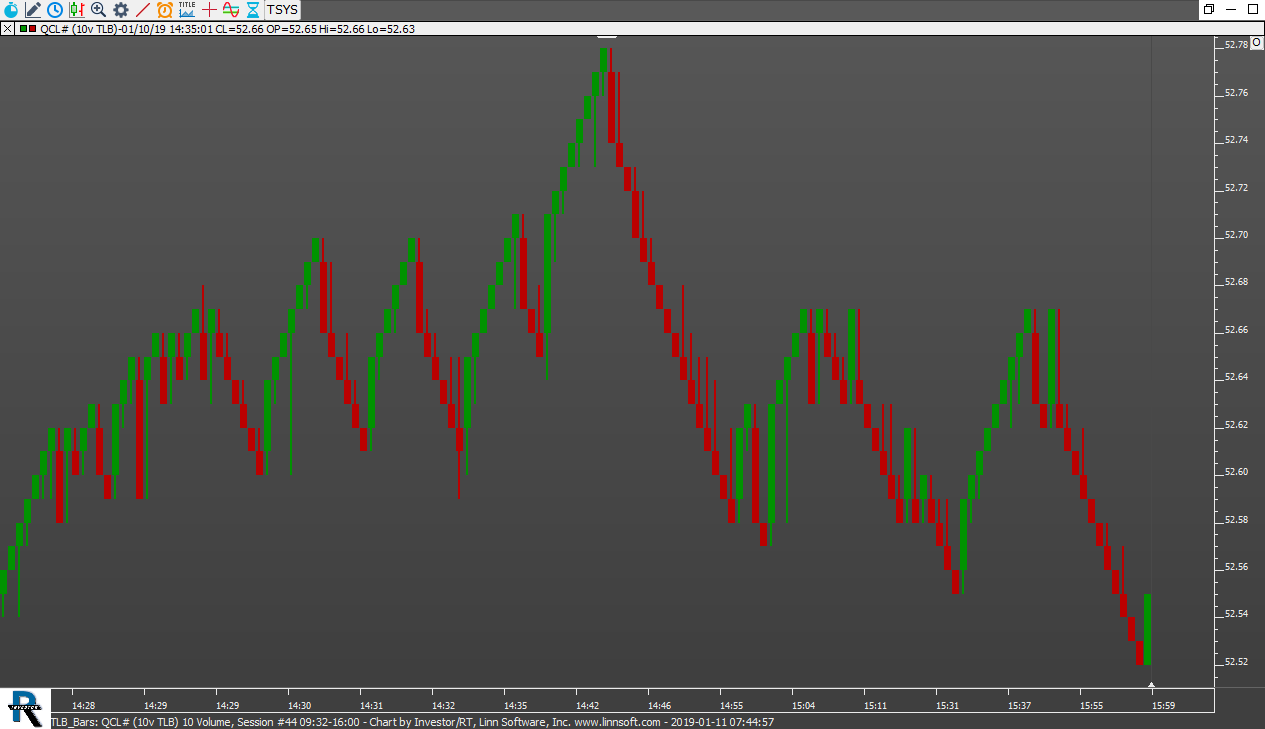 |
TLB Bars (QCL#) cpayne [totalcount]
7 years 6 months ago
TLB Bars. This chart was uploaded by Investor/RT 13.5.14 showing symbol: QCL#. |
View |
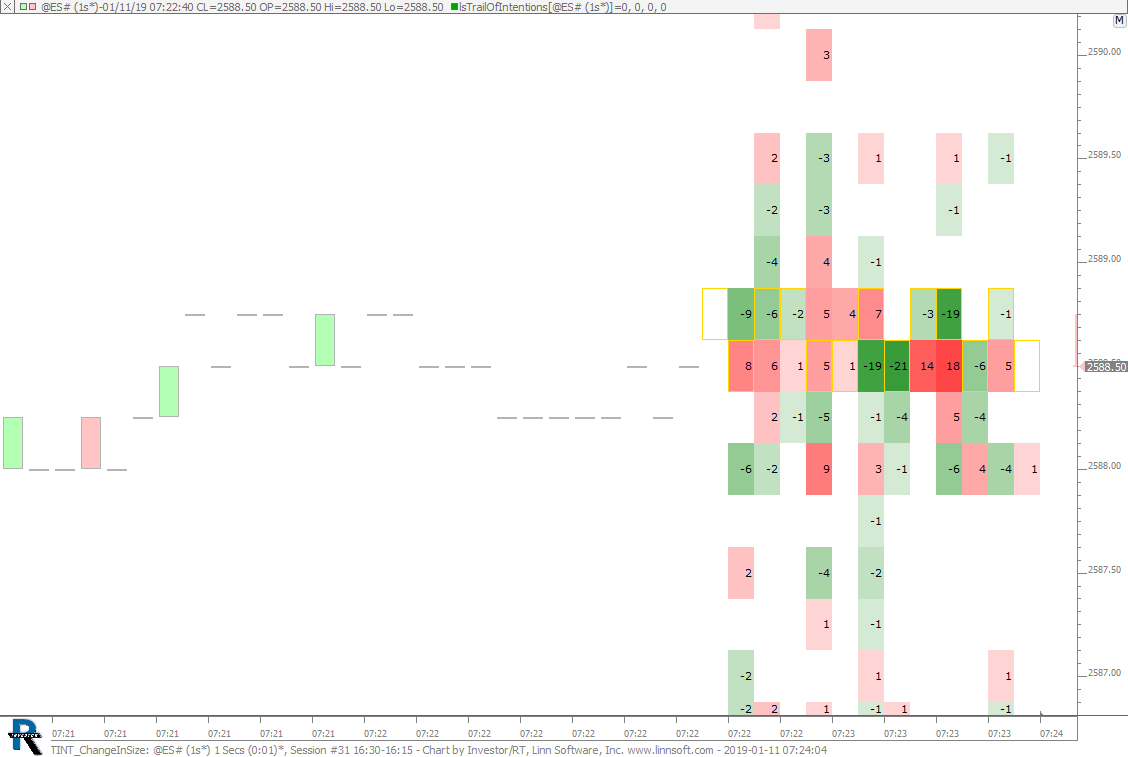 |
TINT ChangeInSize (@ES#) cpayne [totalcount]
7 years 6 months ago
Trail of Intentions - Change in Size. This chart was uploaded by Investor/RT 13.5.1 showing symbol: @ES#. |
View |
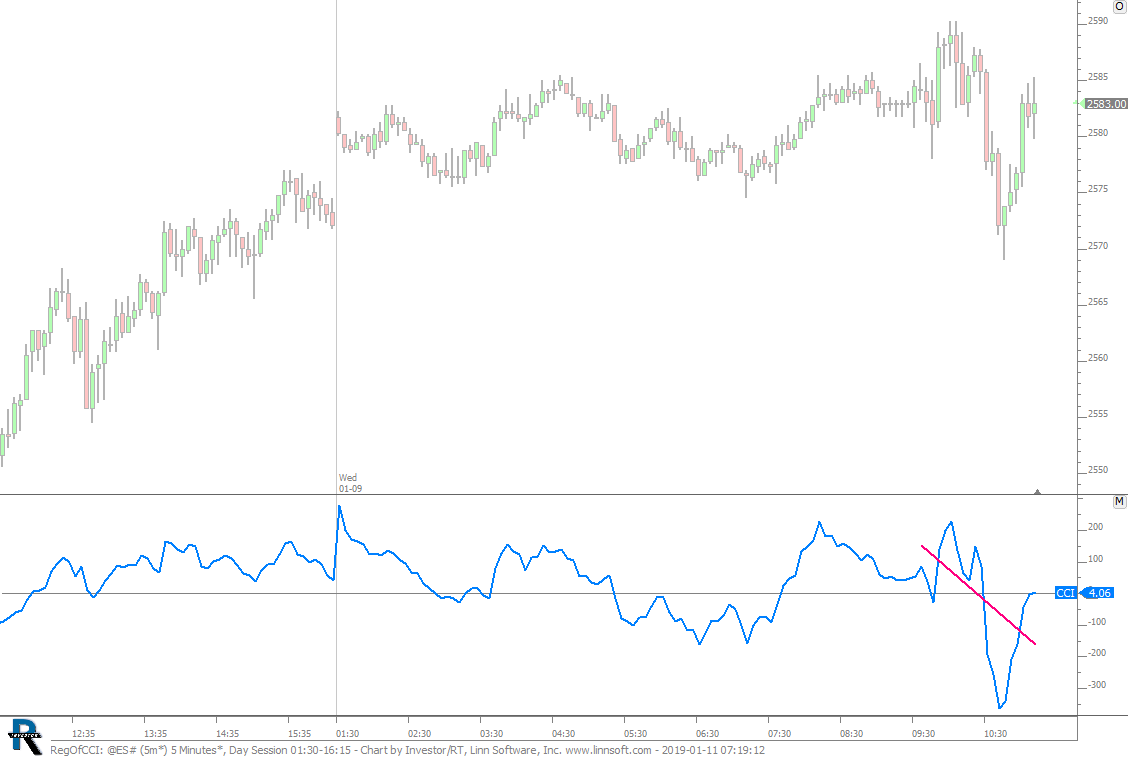 |
RegOfCCI (@ES#) cpayne [totalcount]
7 years 6 months ago
This chart was uploaded by Investor/RT 13.5.14 showing symbol: @ES#. |
View |
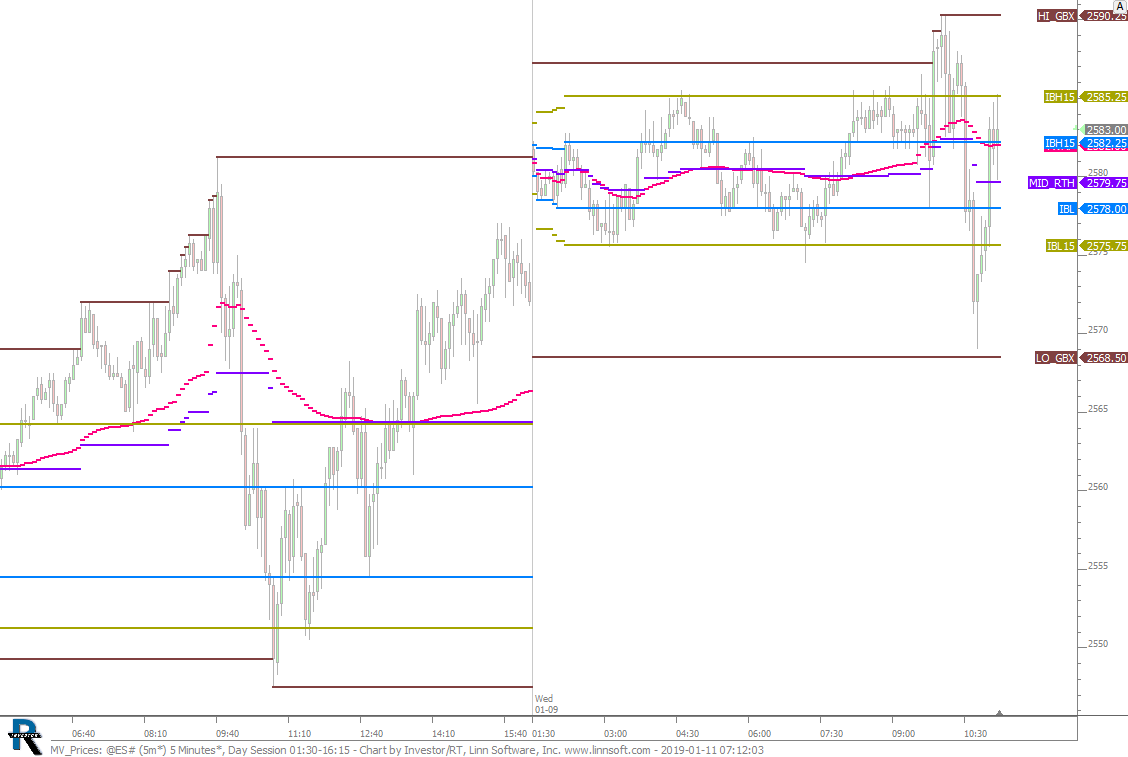 |
MV Prices (@ES#) cpayne [totalcount]
7 years 6 months ago
This chart was uploaded by Investor/RT 13.5.14 showing symbol: @ES#. |
View |
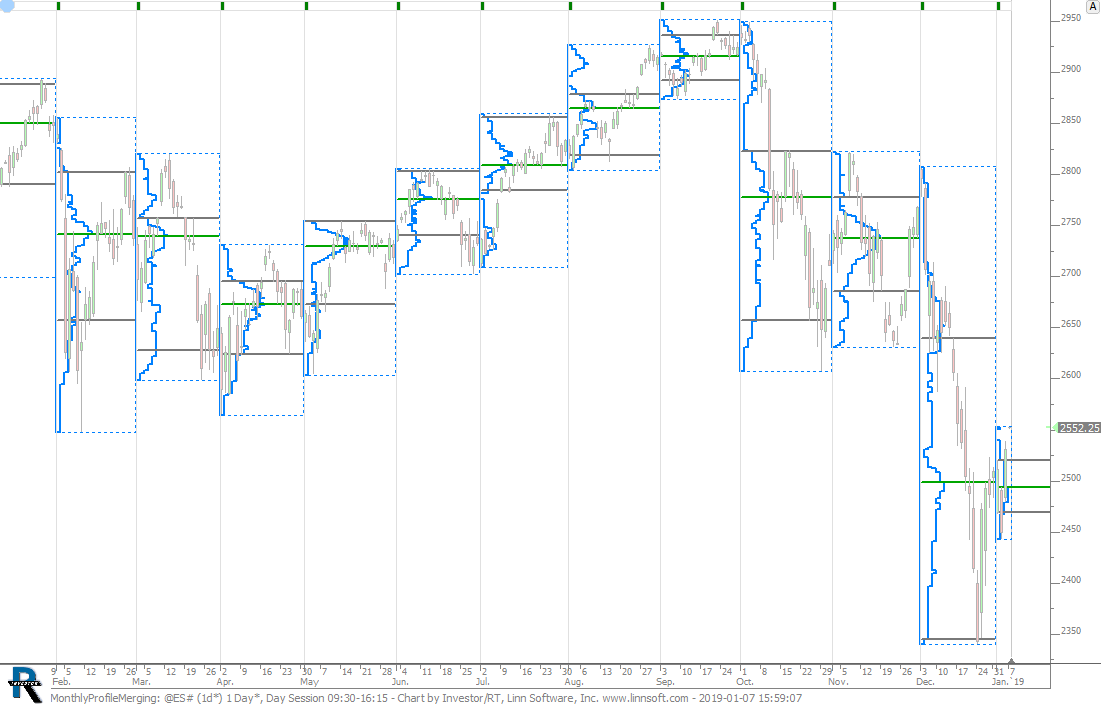 |
MonthlyProfileMerging (@ES#) cpayne [totalcount]
7 years 6 months ago
Monthly Profiles - Merged. This chart was uploaded by Investor/RT 13.5.13 showing symbol: @ES#. |
View |
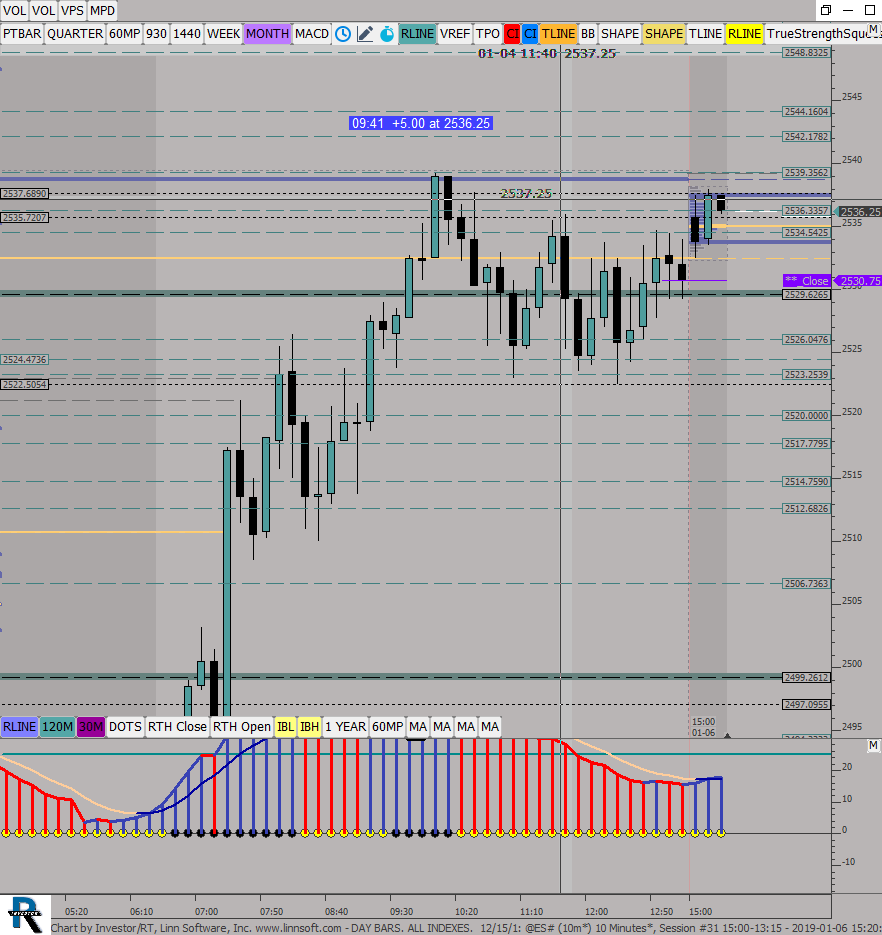 |
DAY BARS ALL INDEXES 12 15 (@ES#) ES42 [totalcount]
7 years 6 months ago
ES Big time frame levels. This chart was uploaded by Investor/RT 13.5.12 showing symbol: @ES#. |
View |
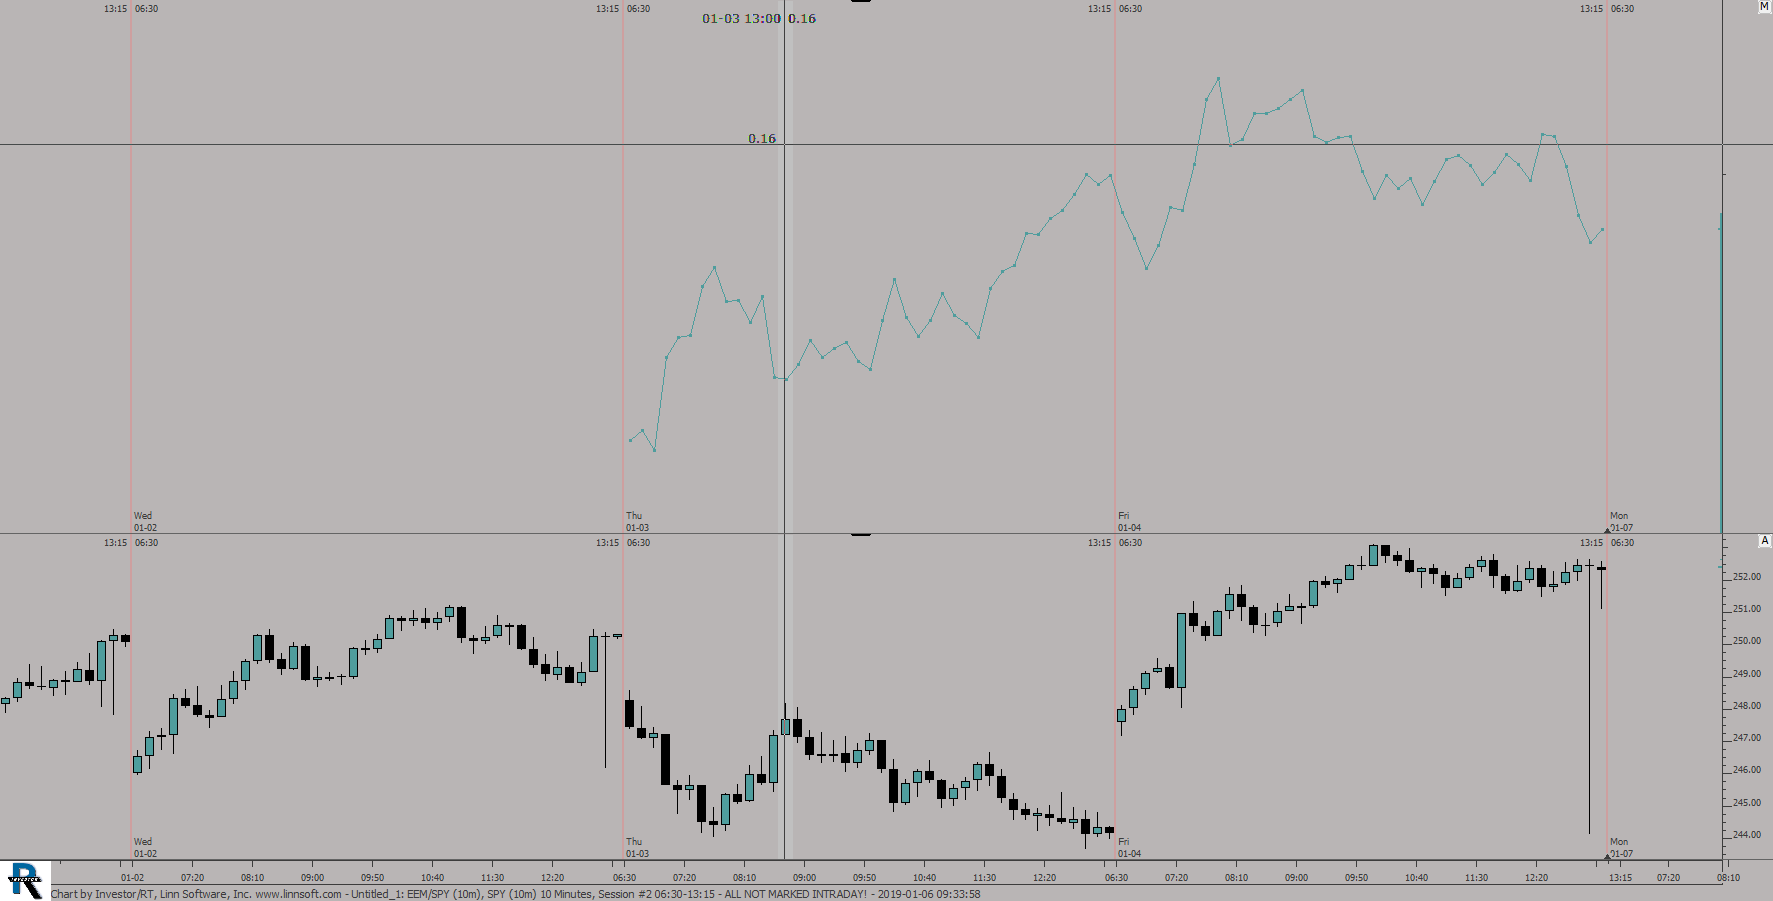 |
Untitled (EEM/SPY) ES42 [totalcount]
7 years 6 months ago
OVERLAY LINE. This chart was uploaded by Investor/RT 13.5.13 showing symbol: EEM/SPY. |
View |
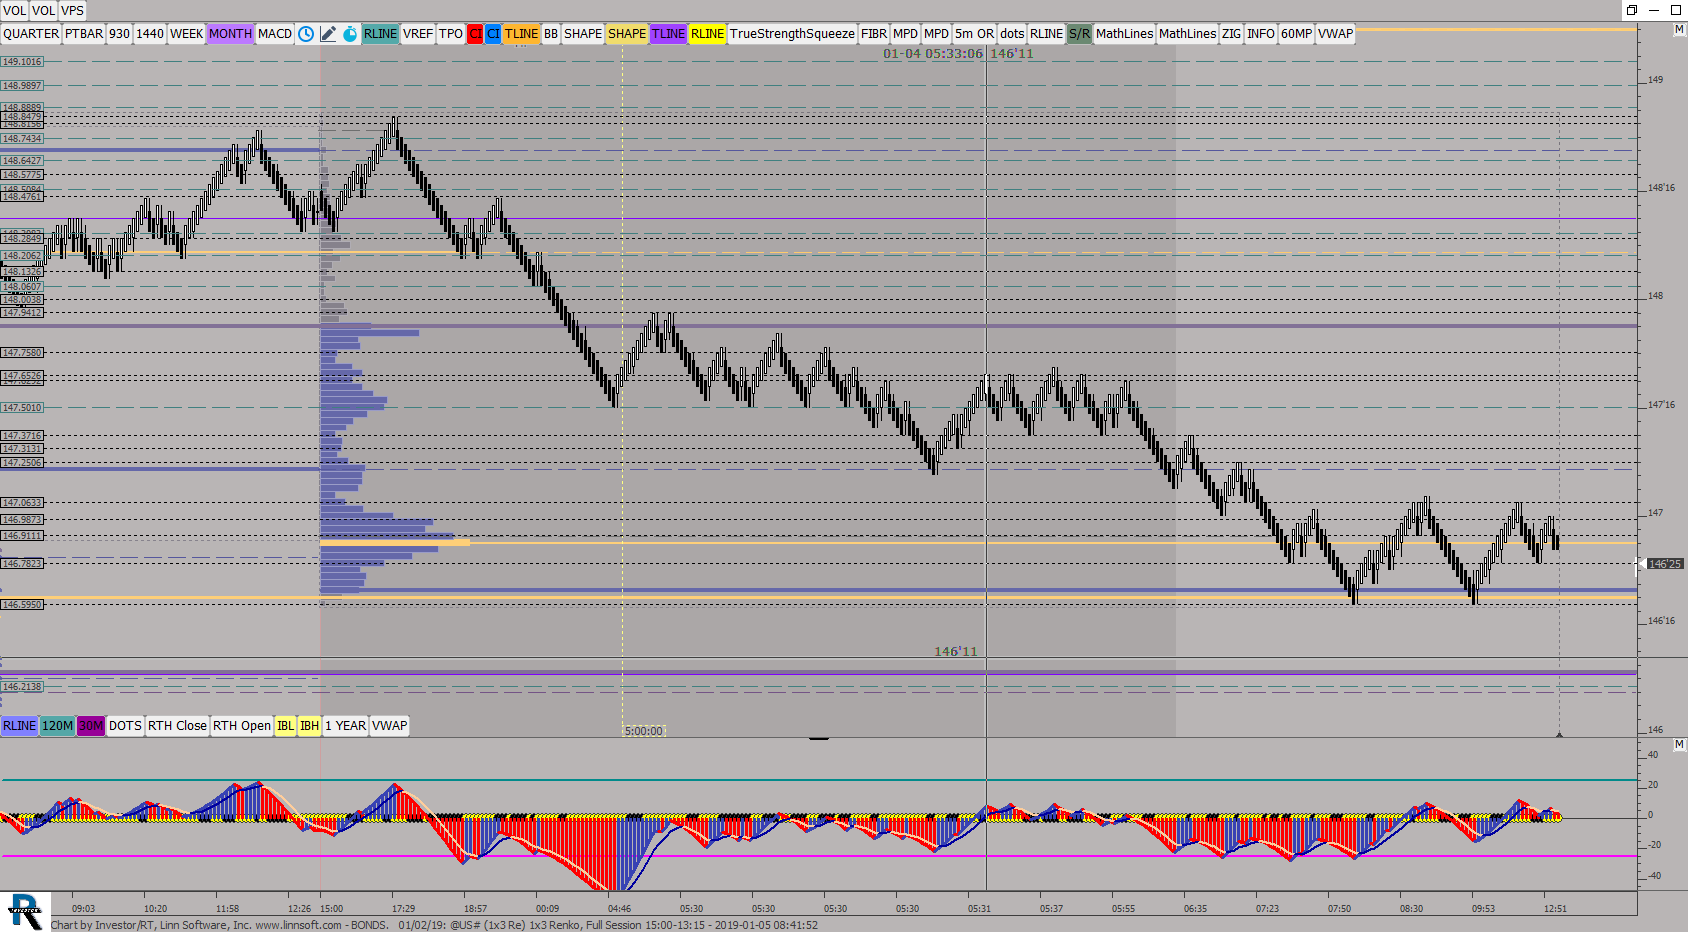 |
BONDS 01 02 (@US#) ES42 [totalcount]
7 years 6 months ago
3 Month CL Profiles Daily candles. This chart was uploaded by Investor/RT 13.5.13 showing symbol: @US#. |
View |