 |
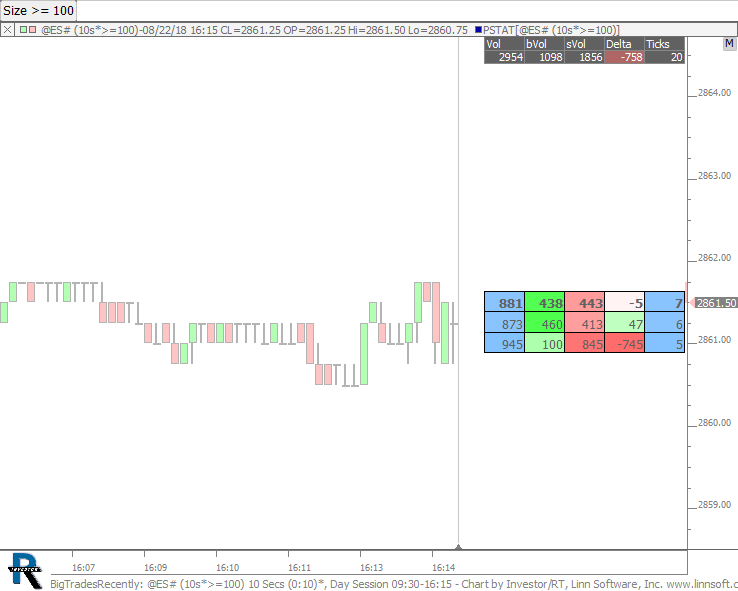
BigTradesRecently (@ES#) cpayne [totalcount]
7 years 4 months ago
Data is filtered (size >= 100) and the Price Stats on the right represents last 12 bars (2 minutes) and hides prices with volume < 500. |
View |
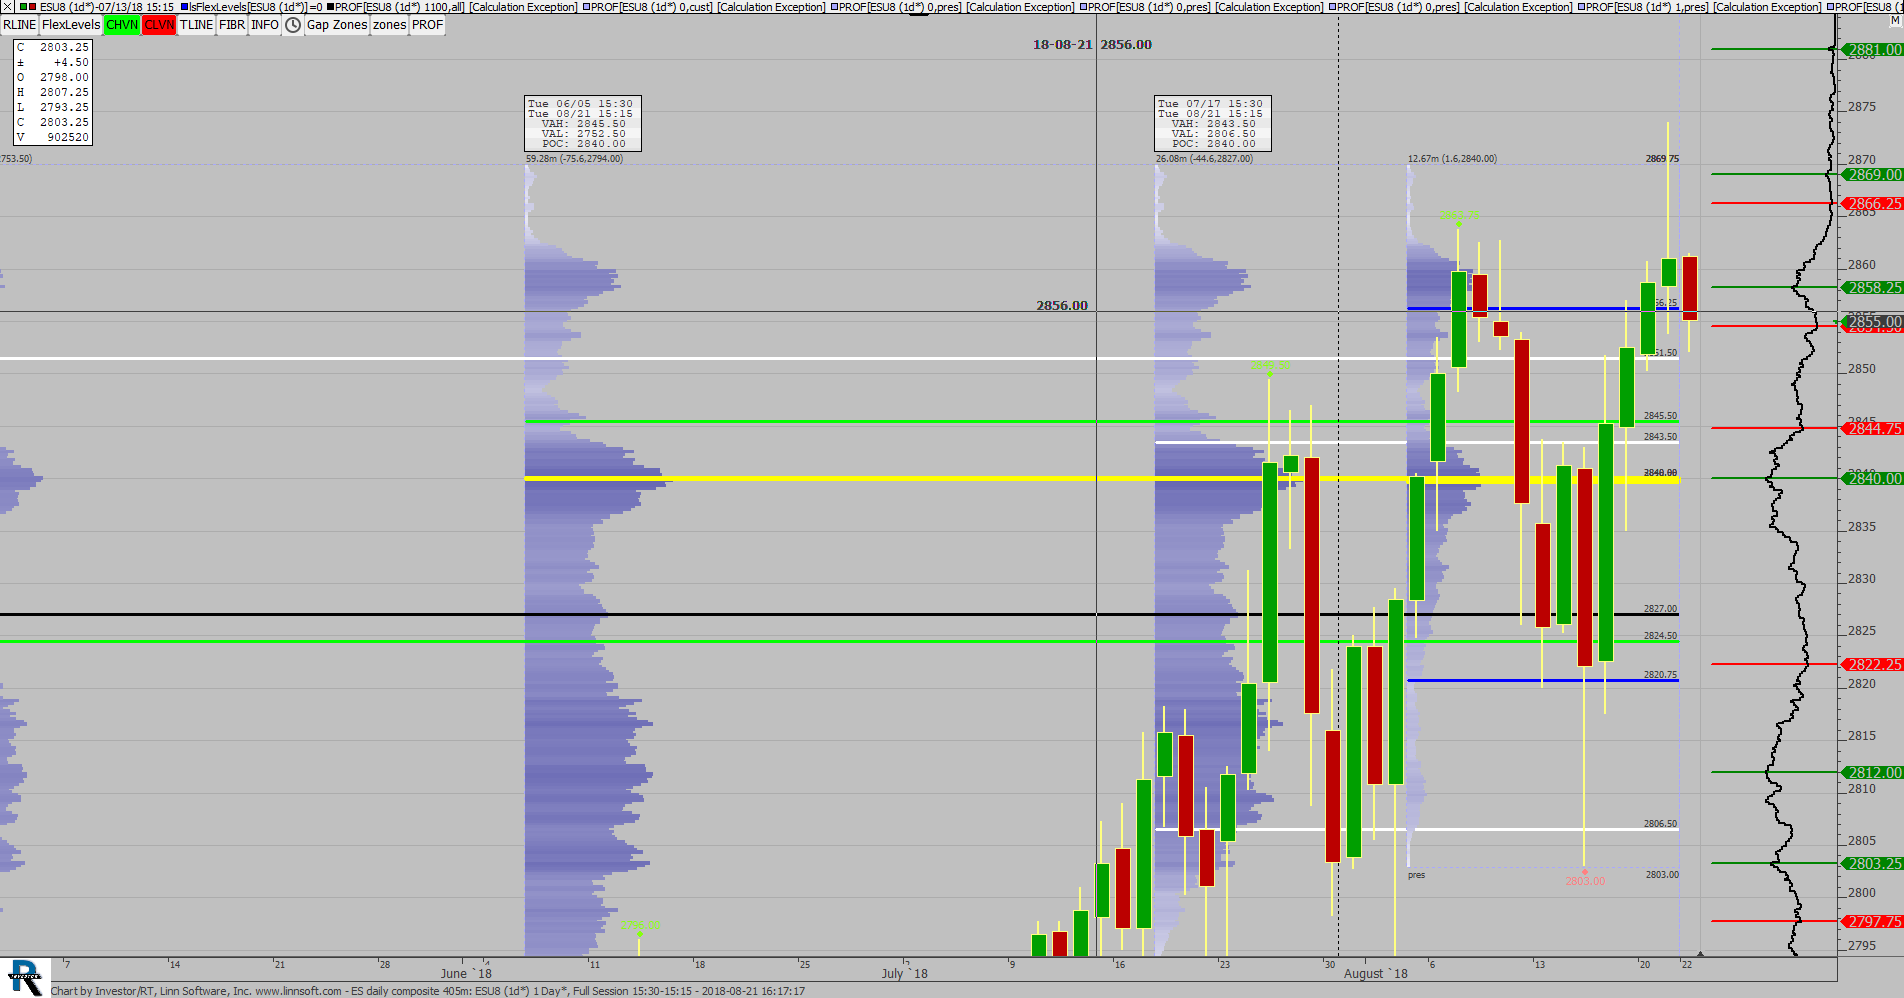 |
ES daily composite 405m (ESU8) scottz46 [totalcount]
7 years 4 months ago
This chart was uploaded by Investor/RT 13.3.5 showing symbol: ESU8. |
View |
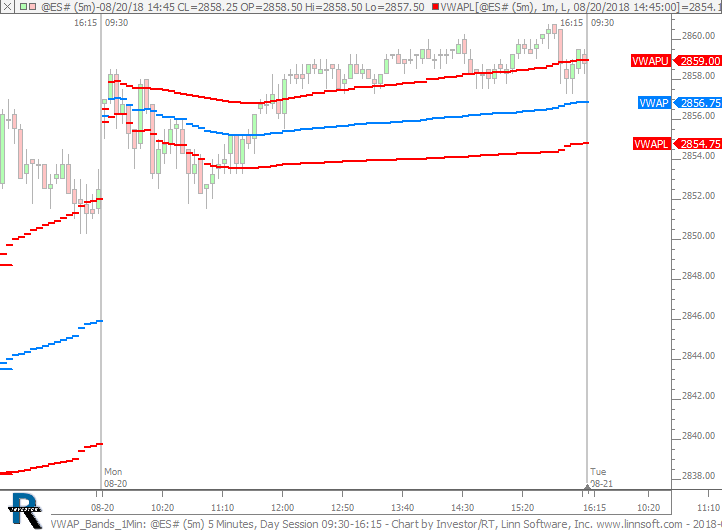 |
VWAP Bands 1Min (@ES#) cpayne [totalcount]
7 years 4 months ago
VWAP Bands based off 1-min data. This chart was uploaded by Investor/RT 13.5.4 showing symbol: @ES#. |
View |
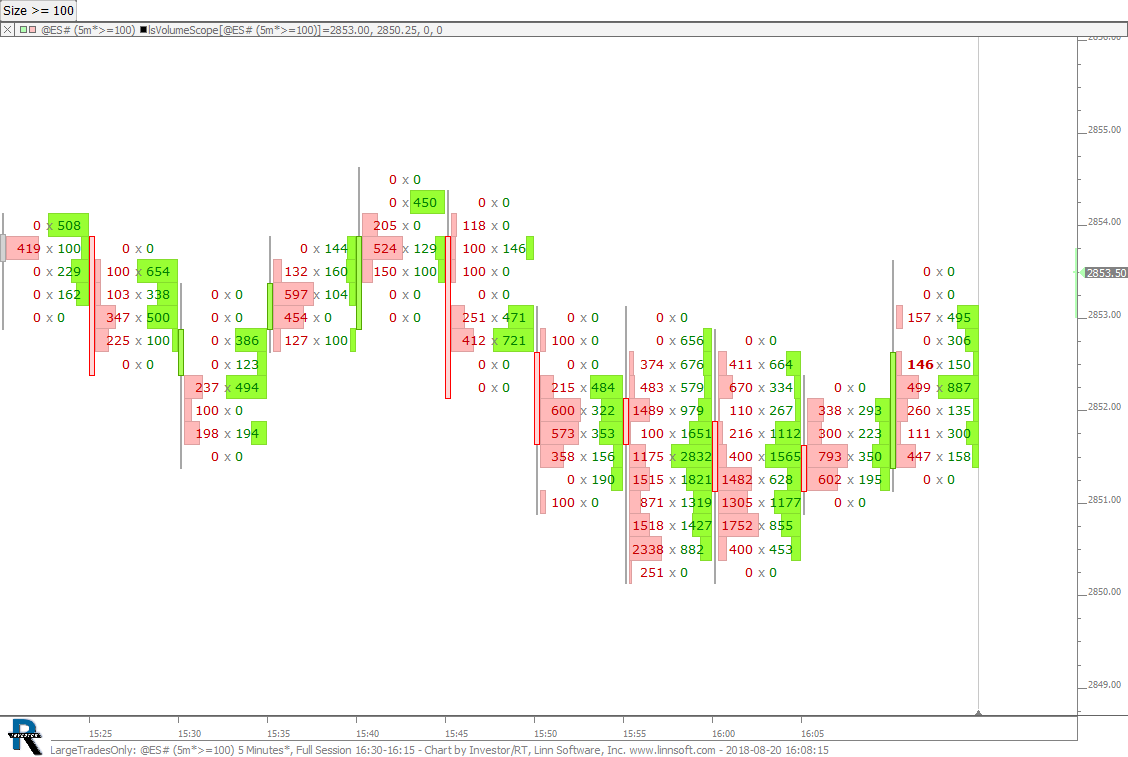 |
LargeTradesOnly (@ES#) cpayne [totalcount]
7 years 4 months ago
Large Trades Only (>= 100 - controlled by button). This chart was uploaded by Investor/RT 13.5.4 showing symbol: @ES#. |
View |
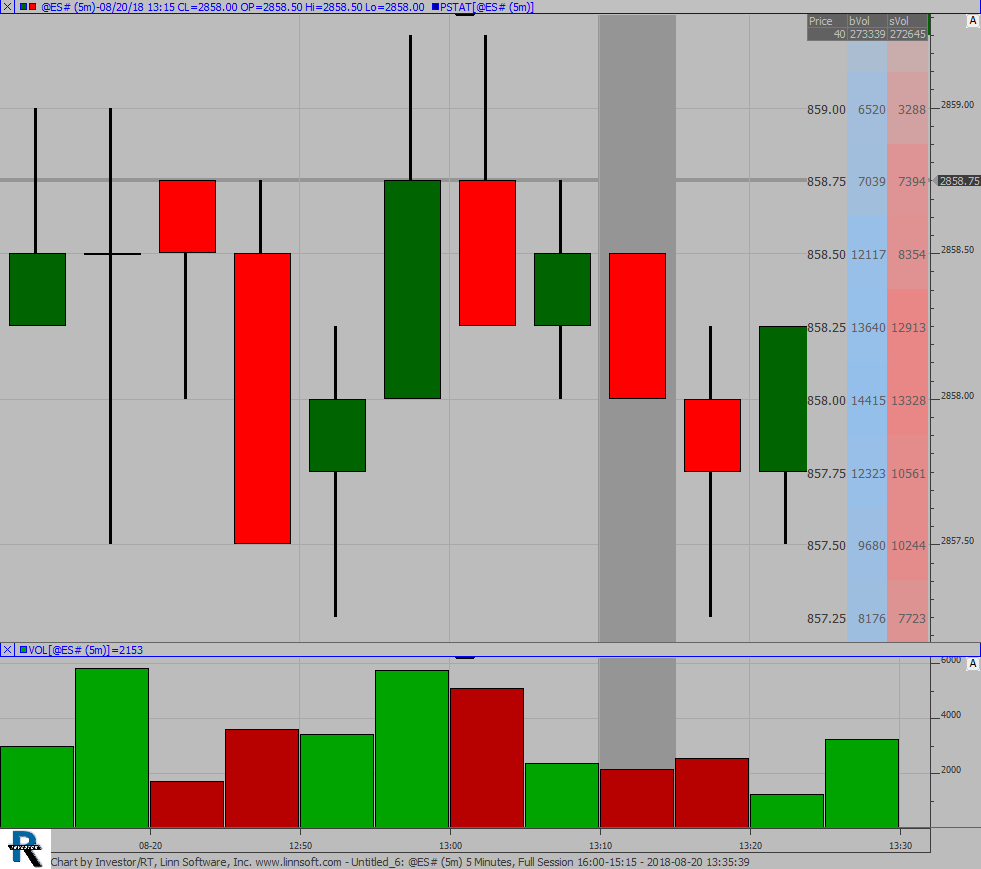 |
Untitled 6 (@ES#) scooke [totalcount]
7 years 4 months ago
This chart was uploaded by Investor/RT 13.5.5 showing symbol: @ES#. |
View |
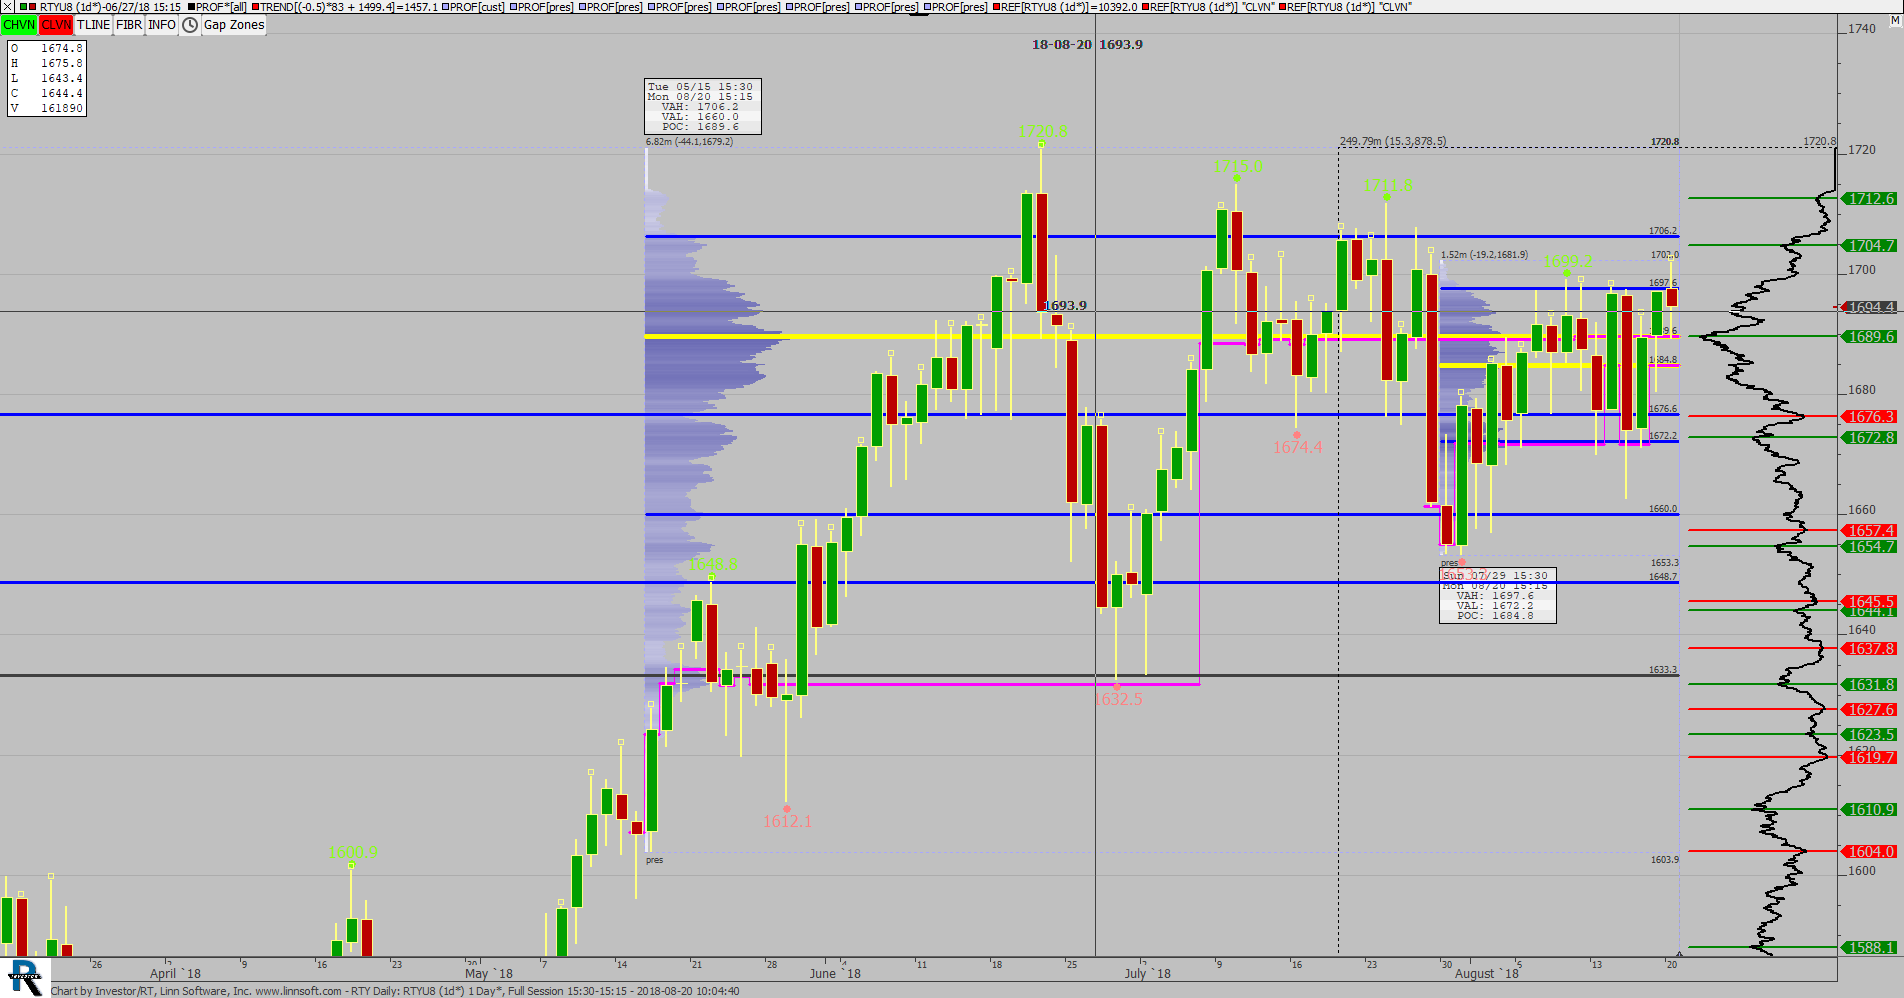 |
RTY Daily (RTYU8) scottz46 [totalcount]
7 years 4 months ago
This chart was uploaded by Investor/RT 13.3.3 showing symbol: RTYU8. |
View |
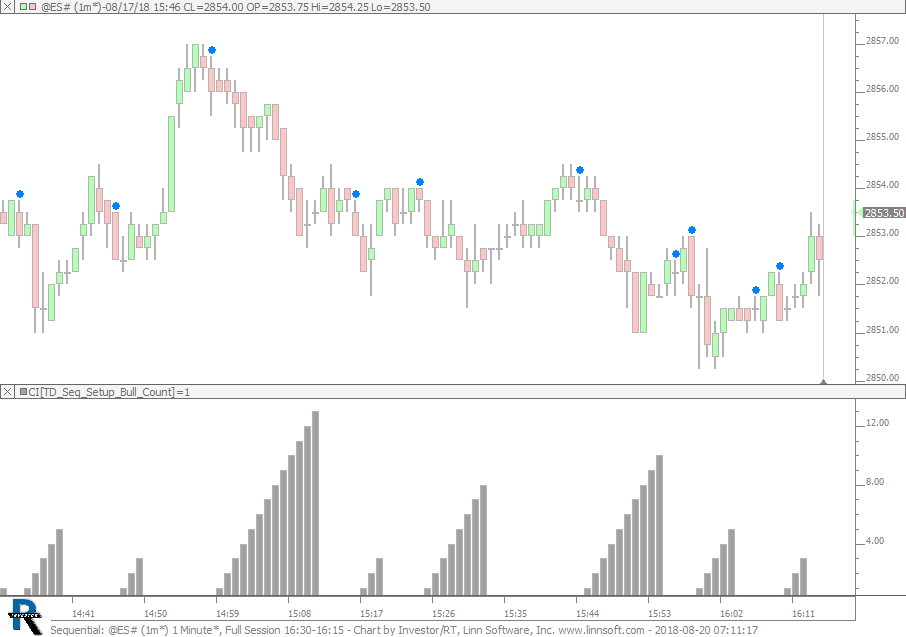 |
Sequential (@ES#) cpayne [totalcount]
7 years 4 months ago
Sequential. This chart was uploaded by Investor/RT 13.5.4 showing symbol: @ES#. |
View |
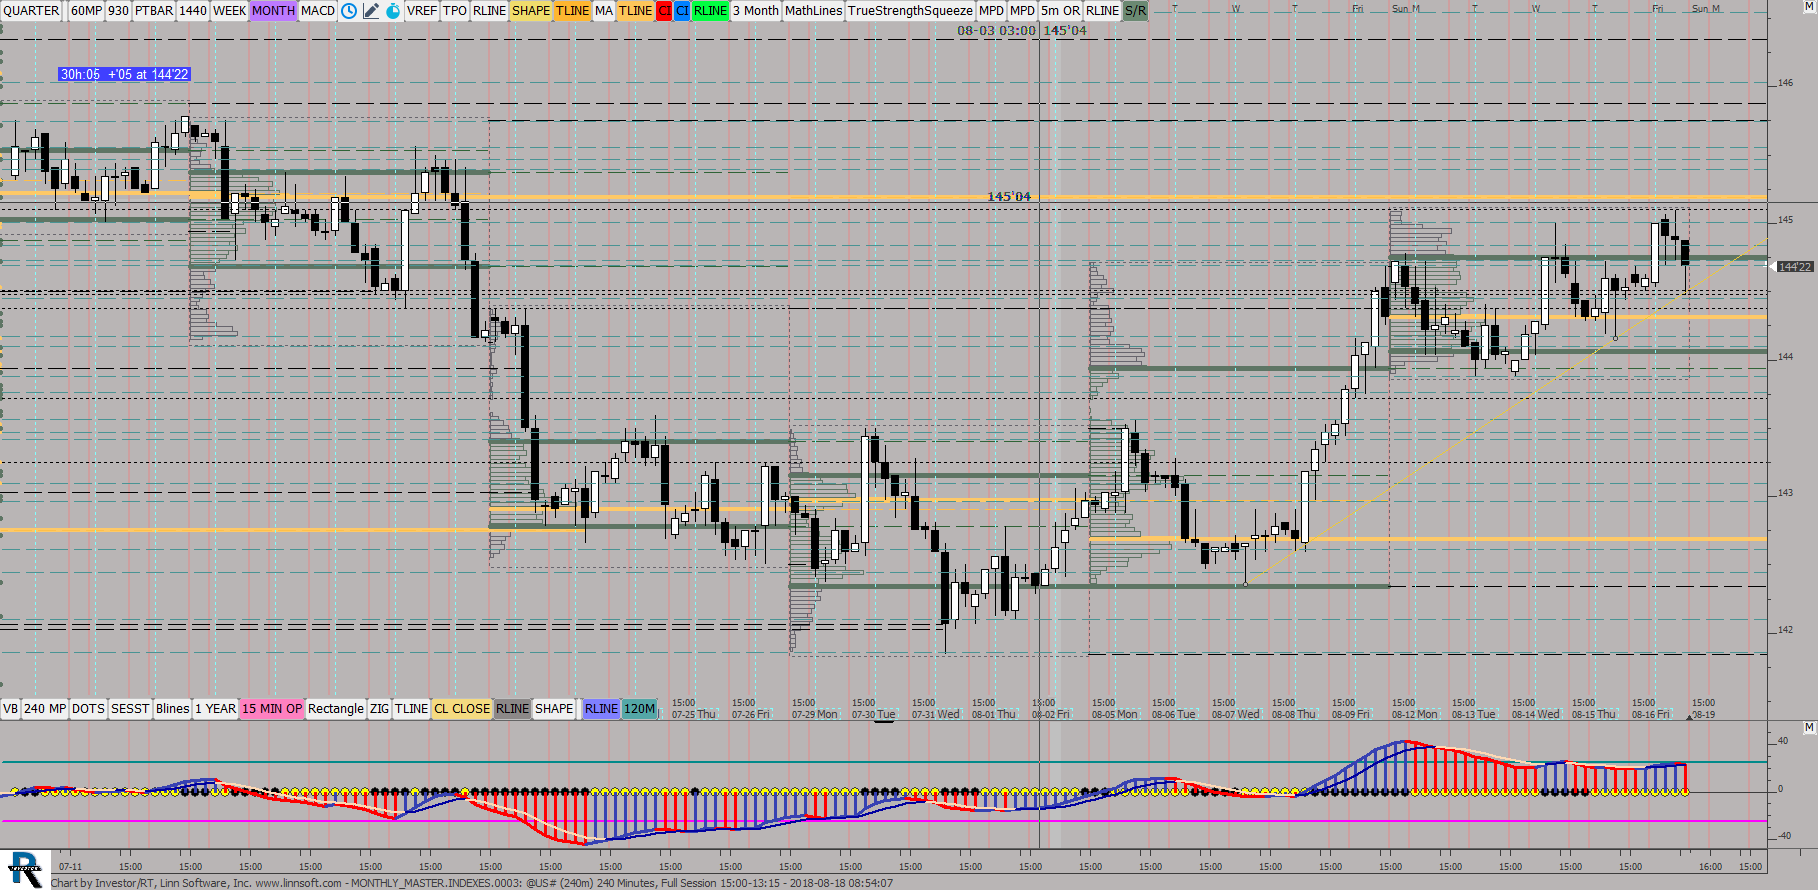 |
MONTHLY MASTERINDEXES (@US#) ES42 [totalcount]
7 years 4 months ago
This chart was uploaded by Investor/RT 13.3.5 showing symbol: @US#. |
View |
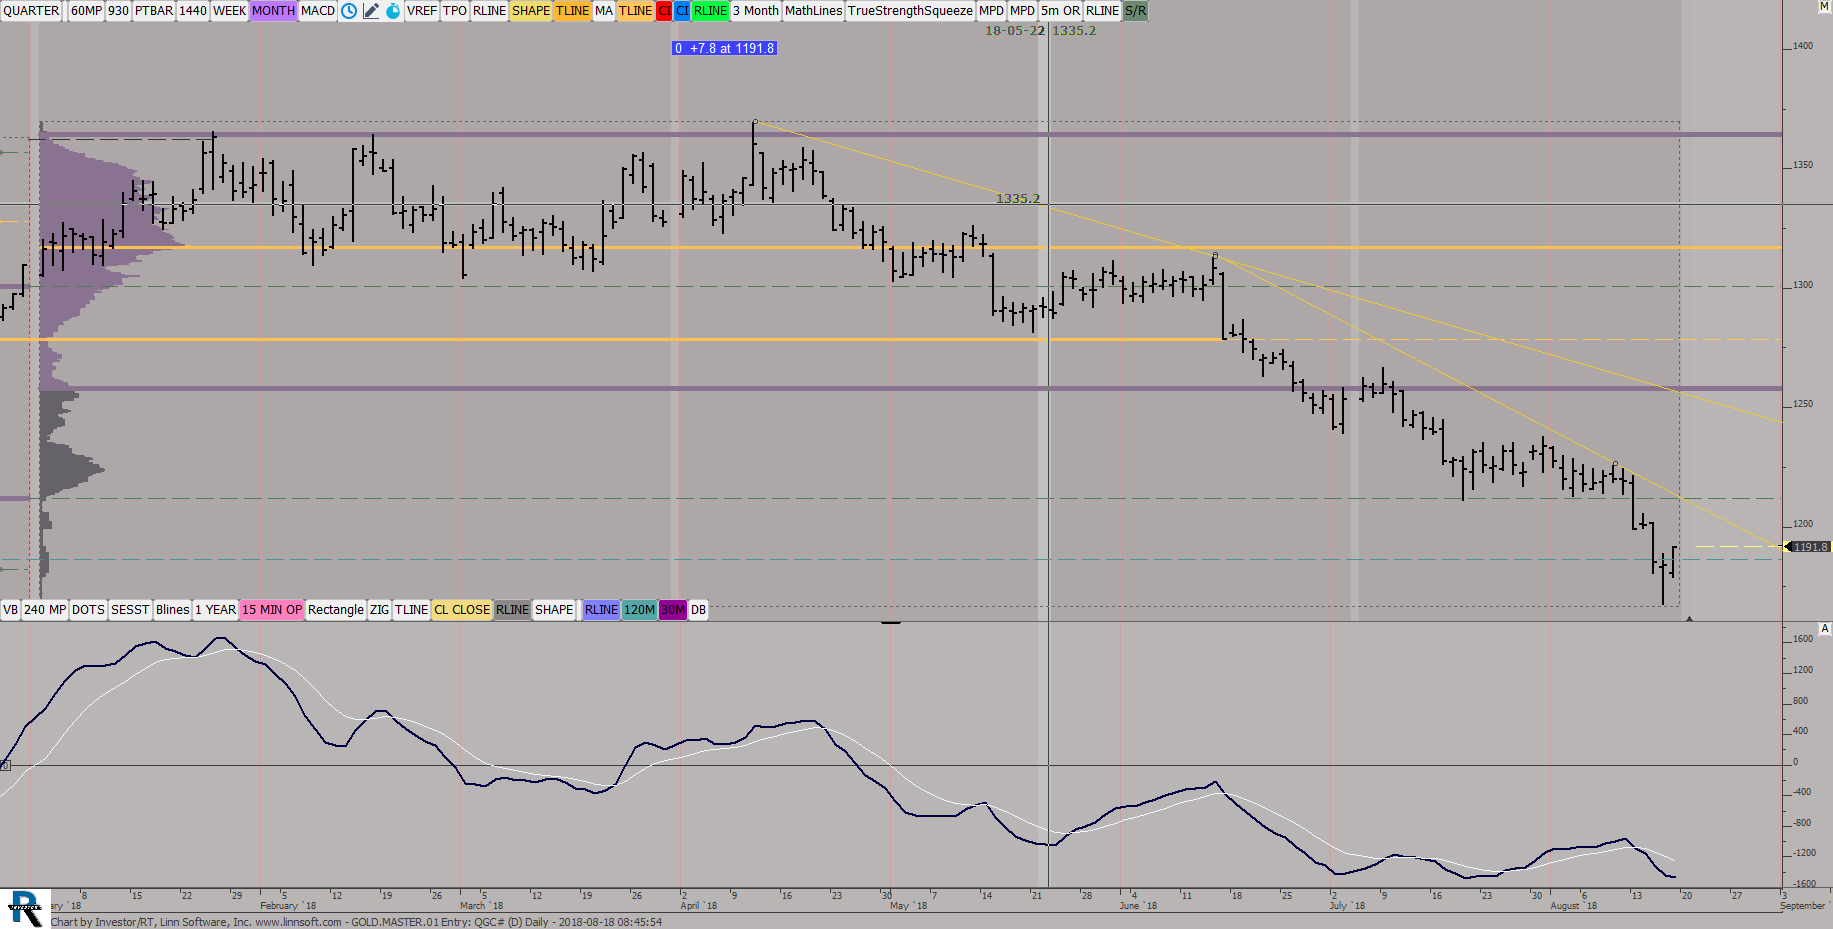 |
GOLDMASTER01 Entry (QGC#) ES42 [totalcount]
7 years 4 months ago
This chart was uploaded by Investor/RT 13.3.5 showing symbol: QGC#. |
View |
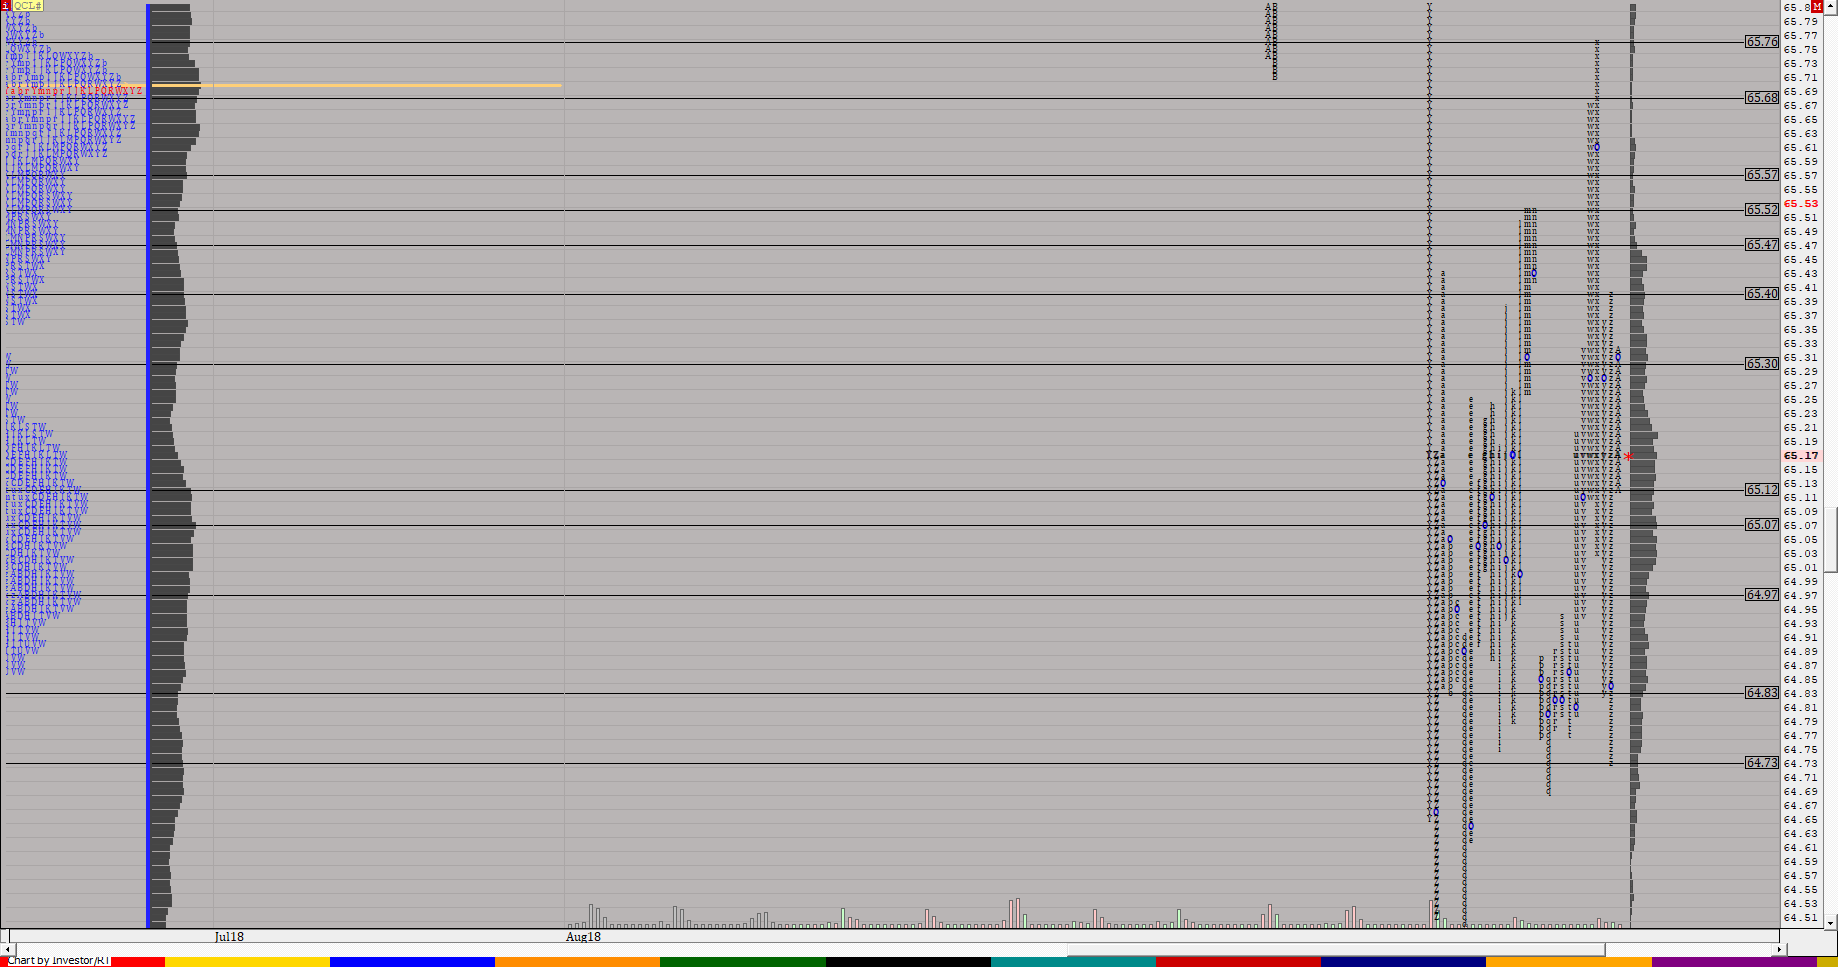 |
OIL MP (QCL#) ES42 [totalcount]
7 years 4 months ago
This chart was uploaded by Investor/RT 13.3.5 showing symbol: QCL#. |
View |
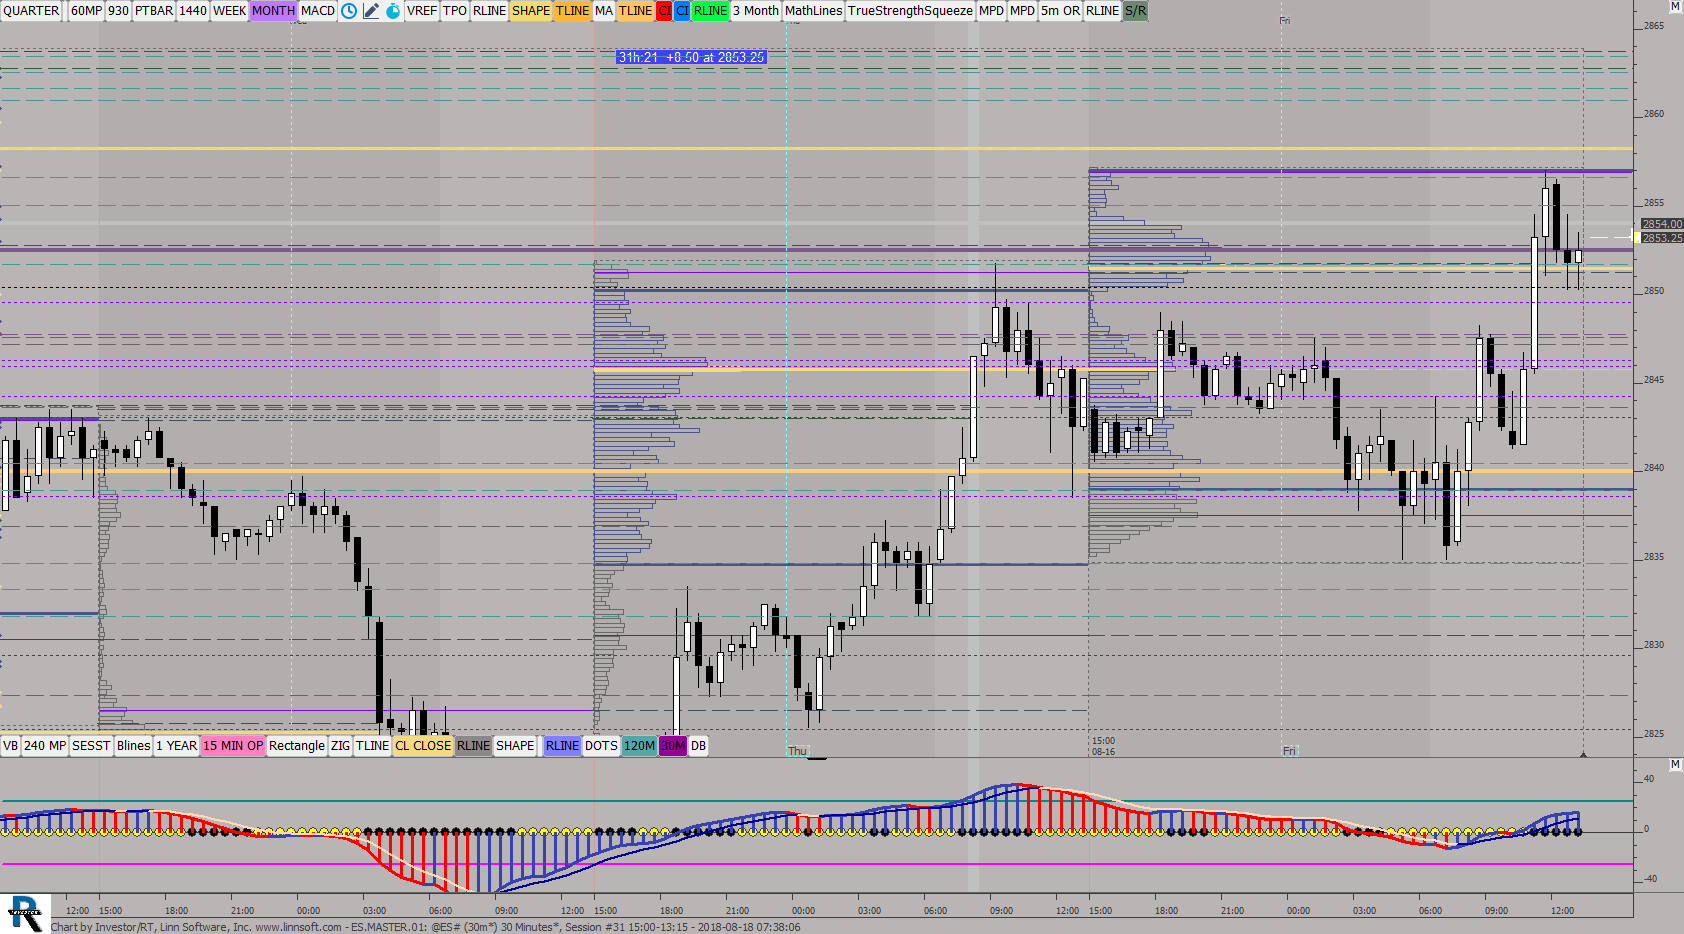 |
ESMASTER (@ES#) ES42 [totalcount]
7 years 4 months ago
This chart was uploaded by Investor/RT 13.3.5 showing symbol: @ES#. |
View |
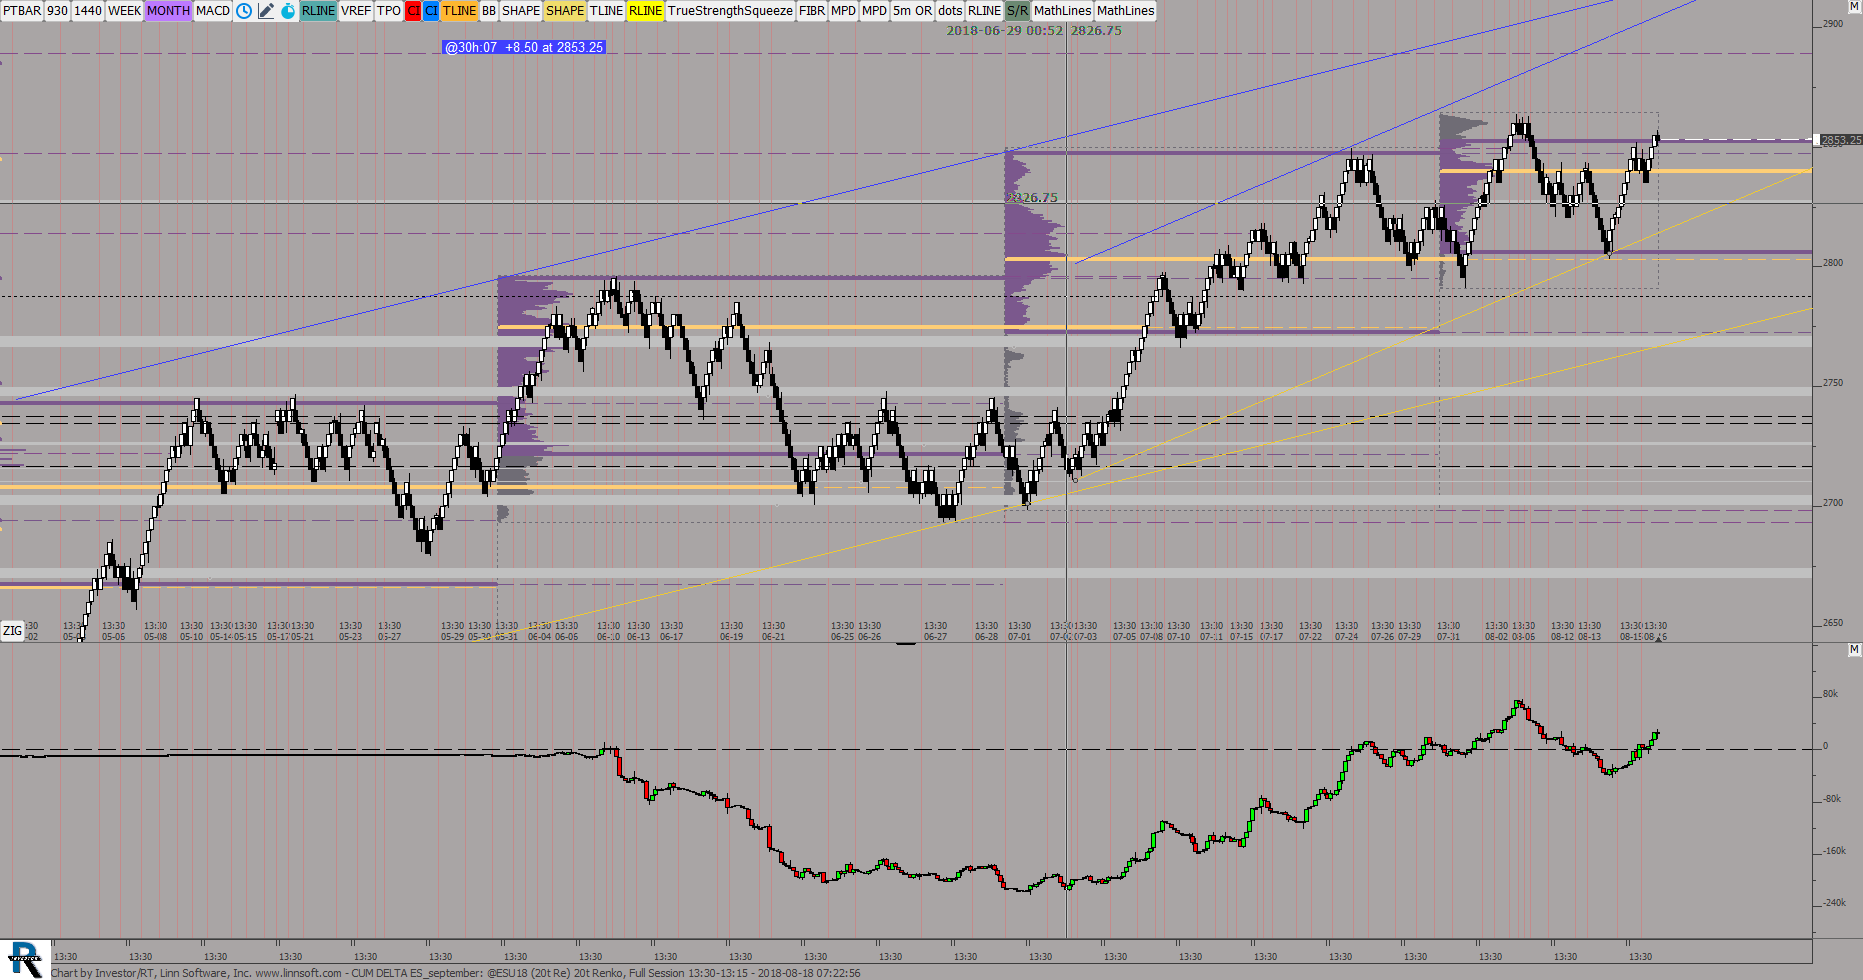 |
CUM DELTA ES september (@ESU18) ES42 [totalcount]
7 years 4 months ago
This chart was uploaded by Investor/RT 13.3.5 showing symbol: @ESU18. |
View |
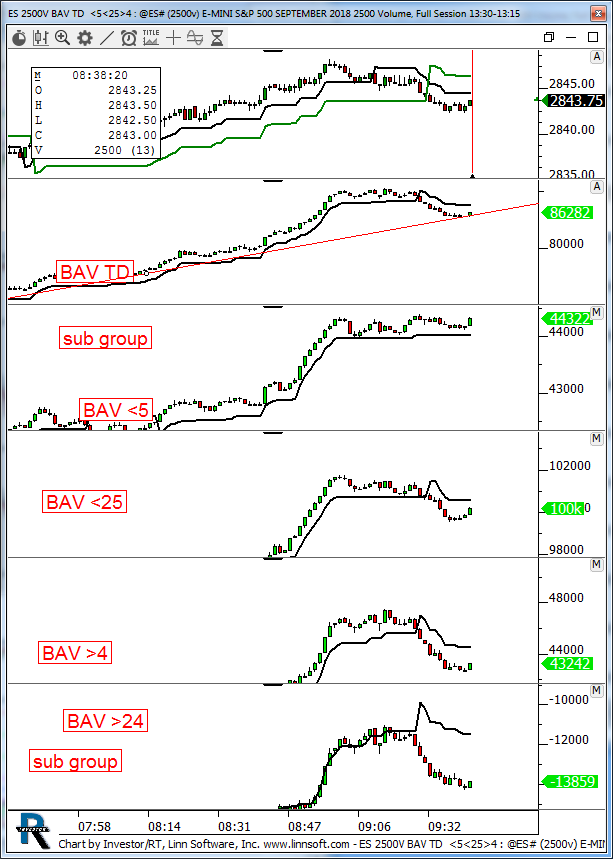 |
ES 2500V BAV TD (@ES#) kencassorla [totalcount]
7 years 4 months ago
subs. This chart was uploaded by Investor/RT 13.3.5 showing symbol: @ES#. |
View |
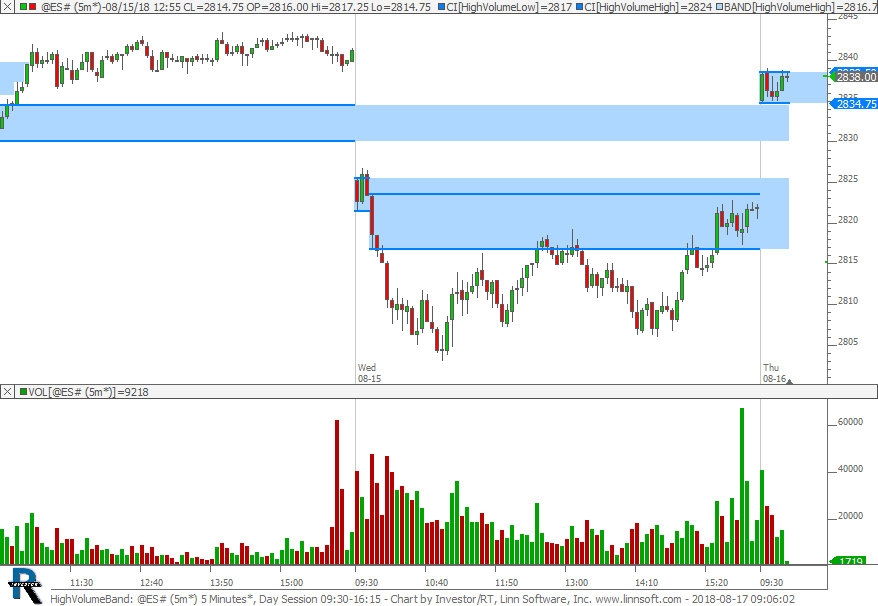 |
HighVolumeBand (@ES#) cpayne [totalcount]
7 years 4 months ago
Price Bands for 5-minute bar with highest volume. This chart was uploaded by Investor/RT 13.5.4 showing symbol: @ES#. |
View |
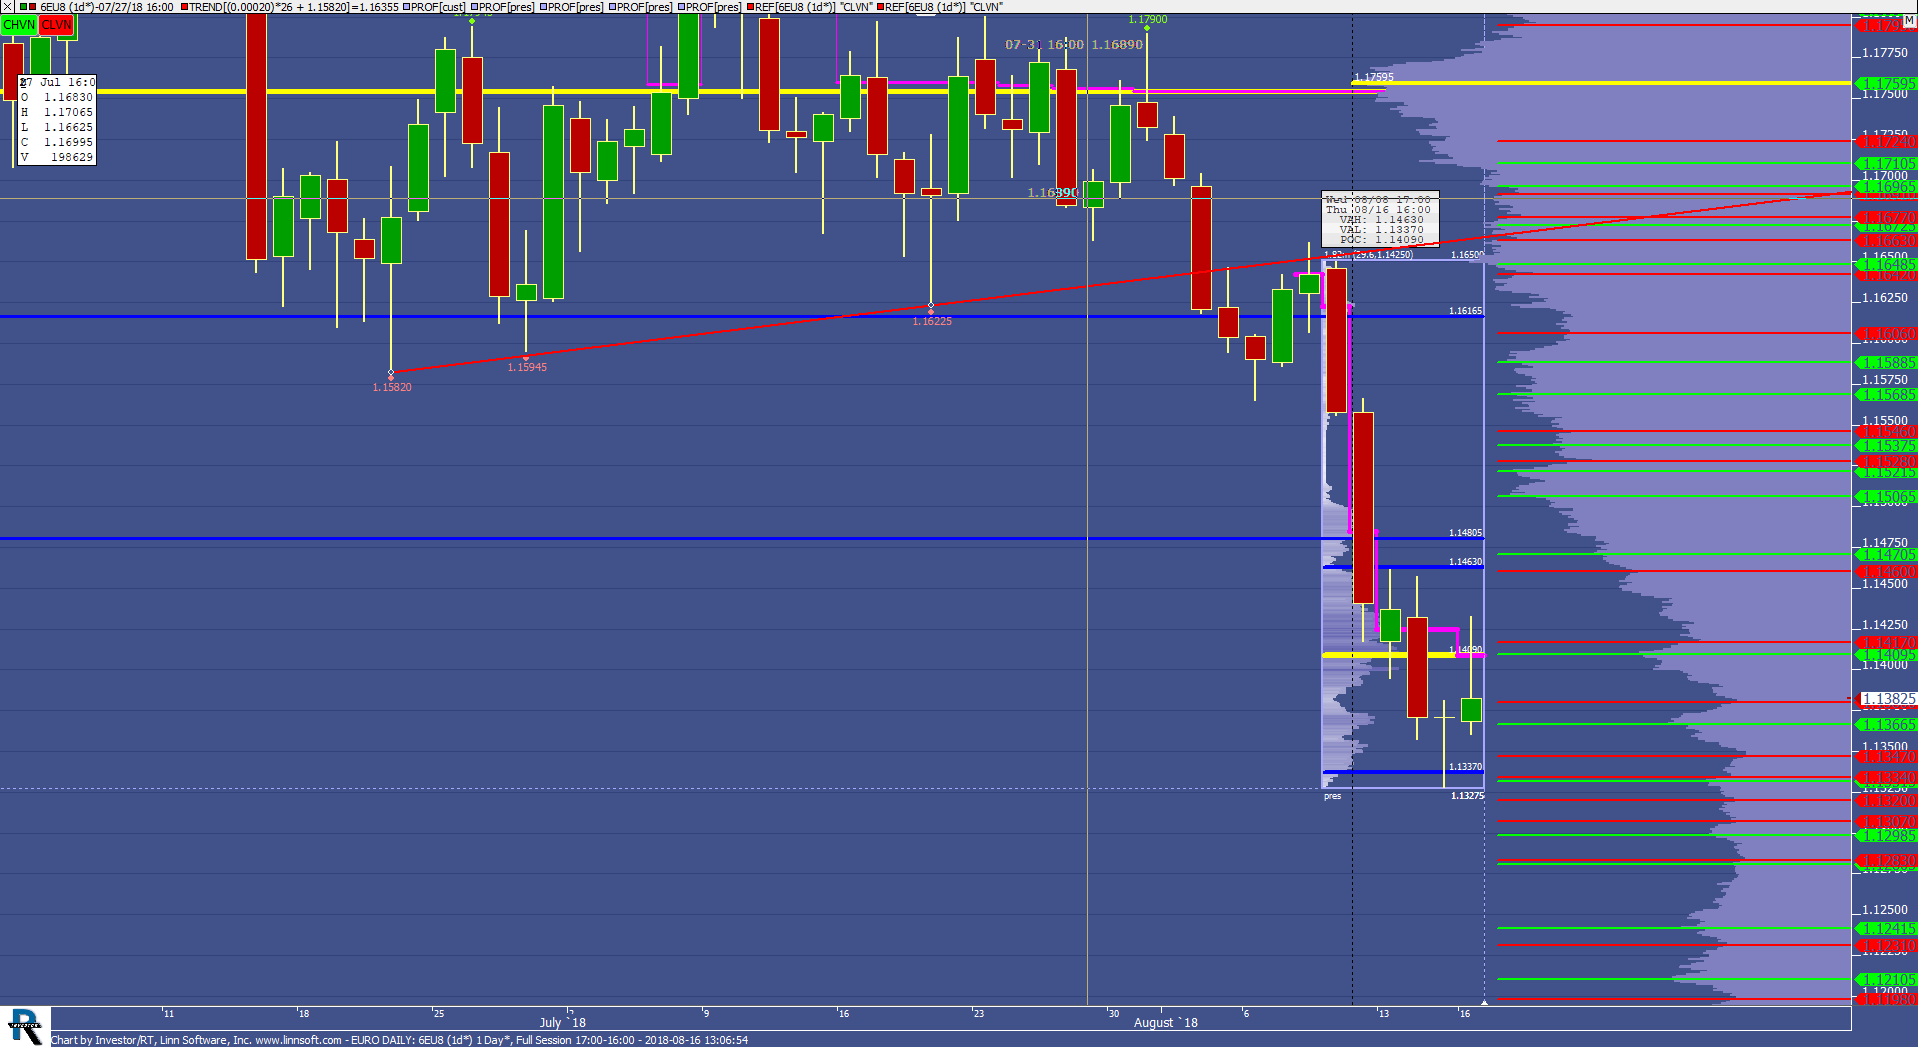 |
EURO DAILY (6EU8) scottz46 [totalcount]
7 years 4 months ago
This chart was uploaded by Investor/RT 13.3.5 showing symbol: 6EU8. |
View |
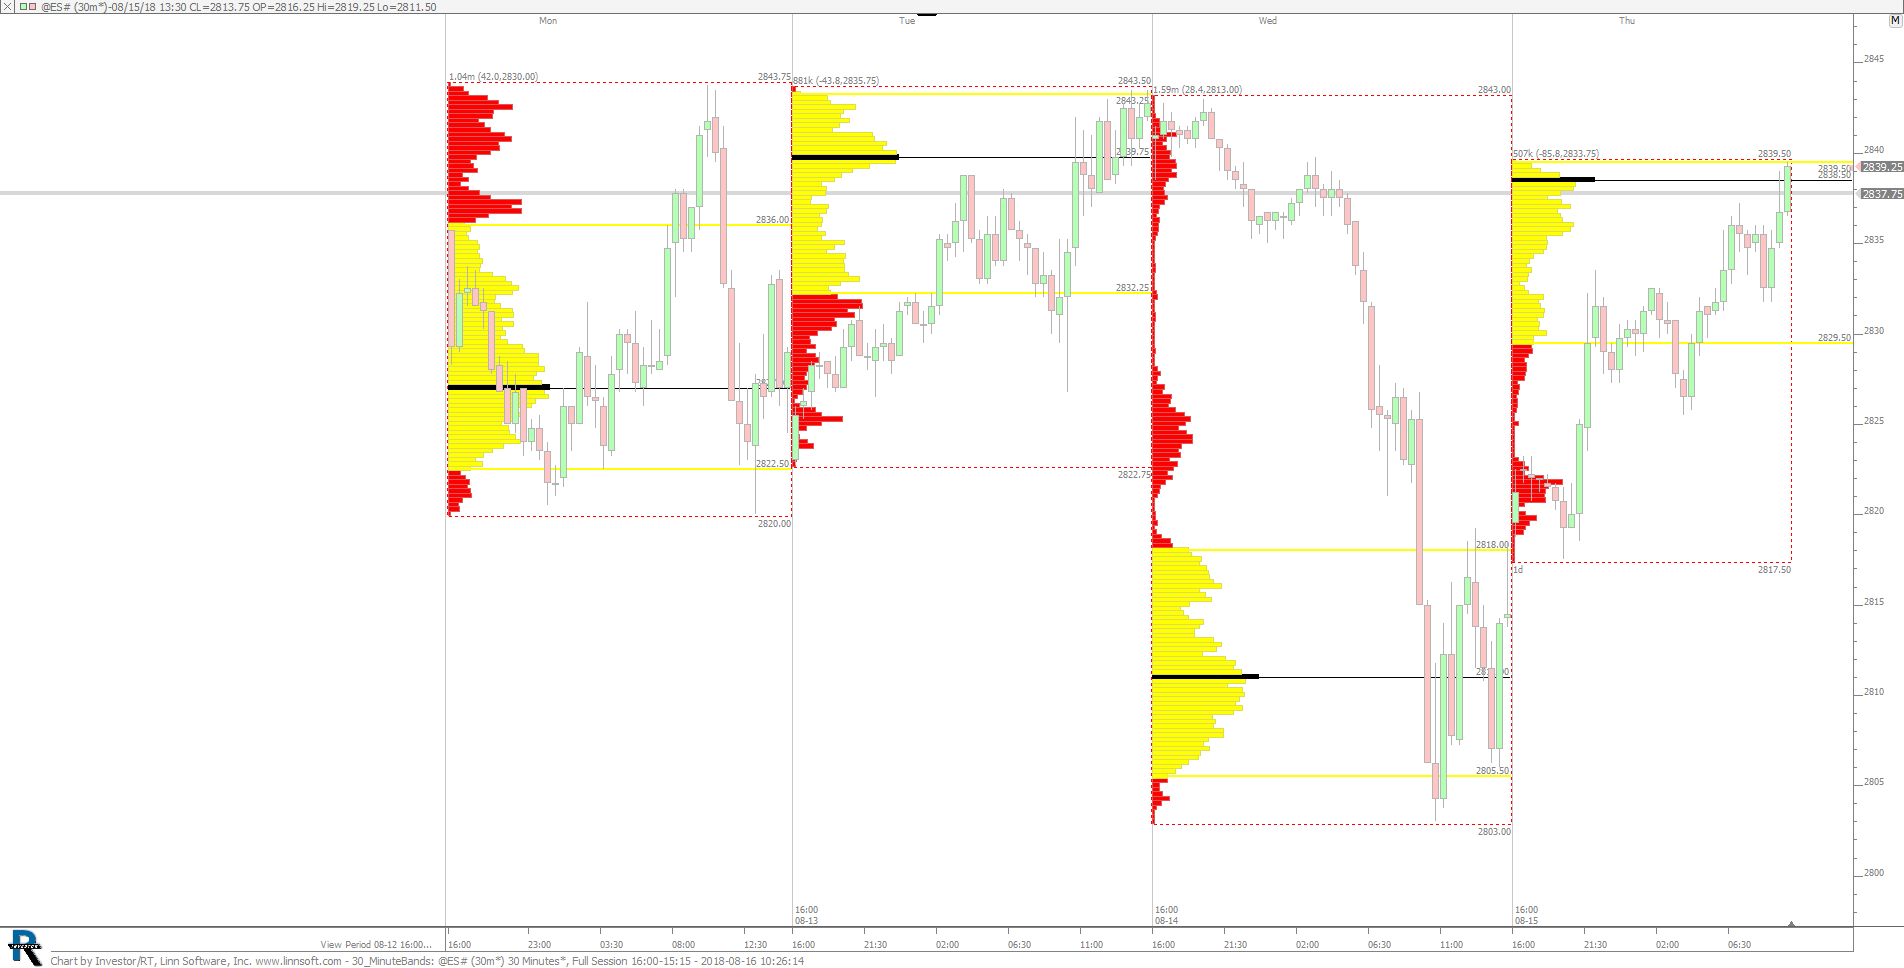 |
30 MinuteBands (@ES#) 2 scooke [totalcount]
7 years 4 months ago
This chart was uploaded by Investor/RT 13.5.4 showing symbol: @ES#. |
View |
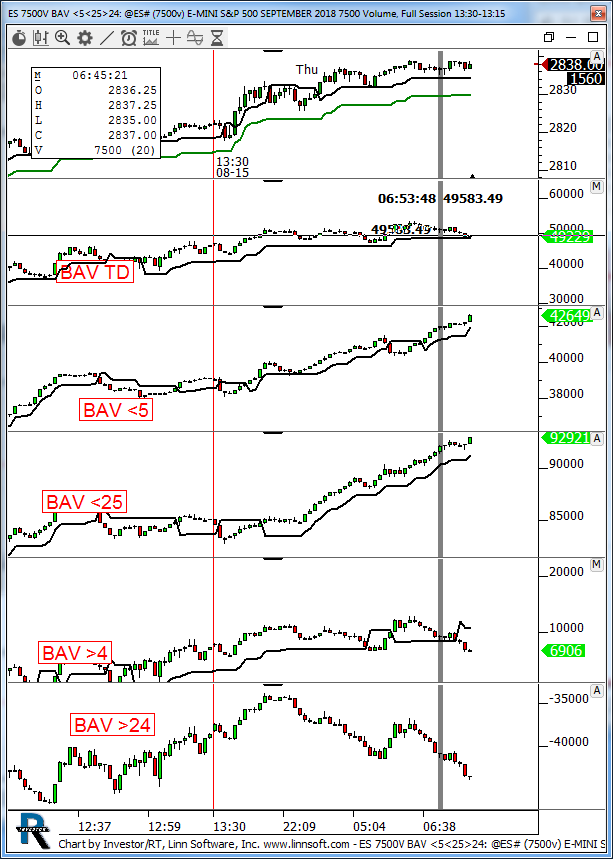 |
ES 7500V BAV (@ES#) kencassorla [totalcount]
7 years 4 months ago
7500v. This chart was uploaded by Investor/RT 13.3.4 showing symbol: @ES#. |
View |
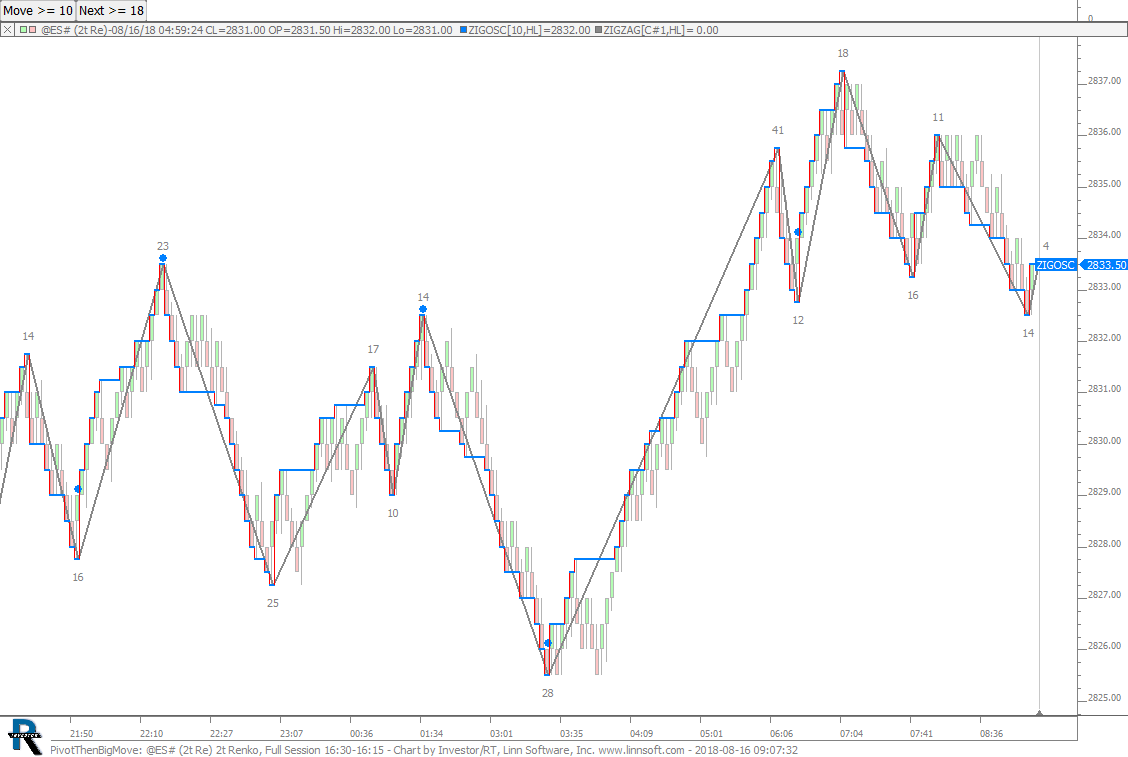 |
PivotThenBigMove (@ES#) cpayne [totalcount]
7 years 4 months ago
Blue dot identifies pivots with a big move after. This chart was uploaded by Investor/RT 13.5.4 showing symbol: @ES#. |
View |
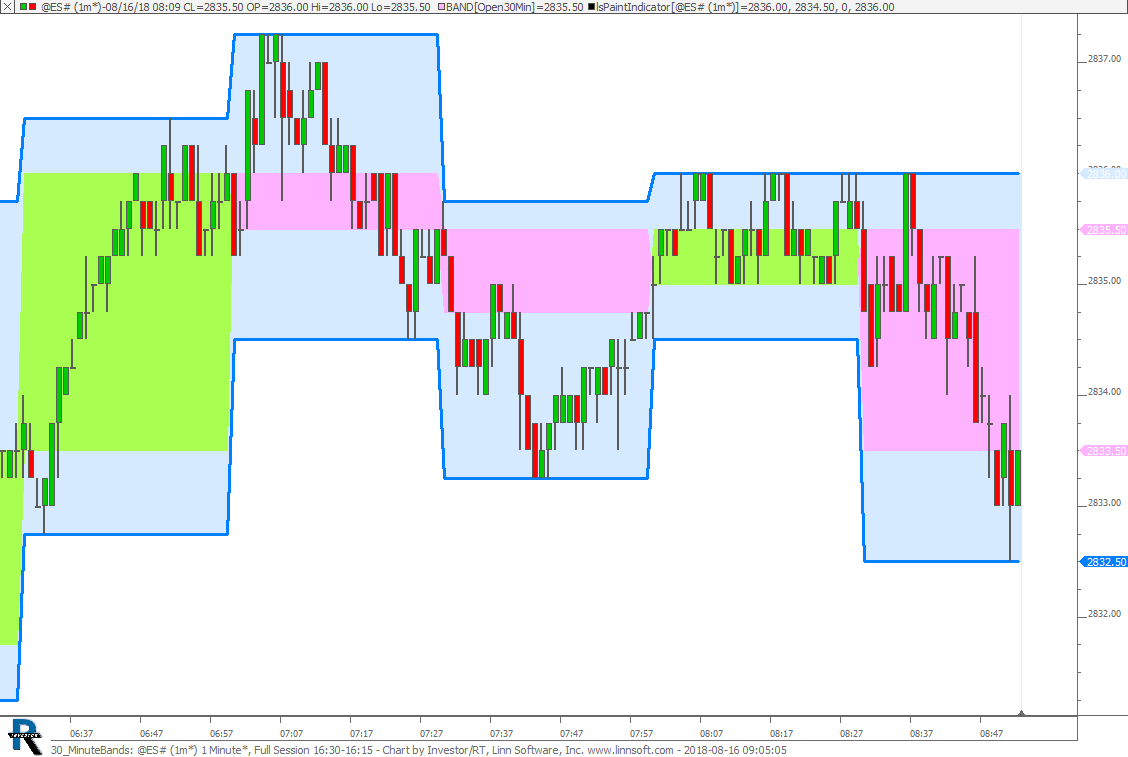 |
30 MinuteBands (@ES#) cpayne [totalcount]
7 years 4 months ago
30 Minute High and Low Bands on 1-min Chart. This chart was uploaded by Investor/RT 13.5.4 showing symbol: @ES#. |
View |
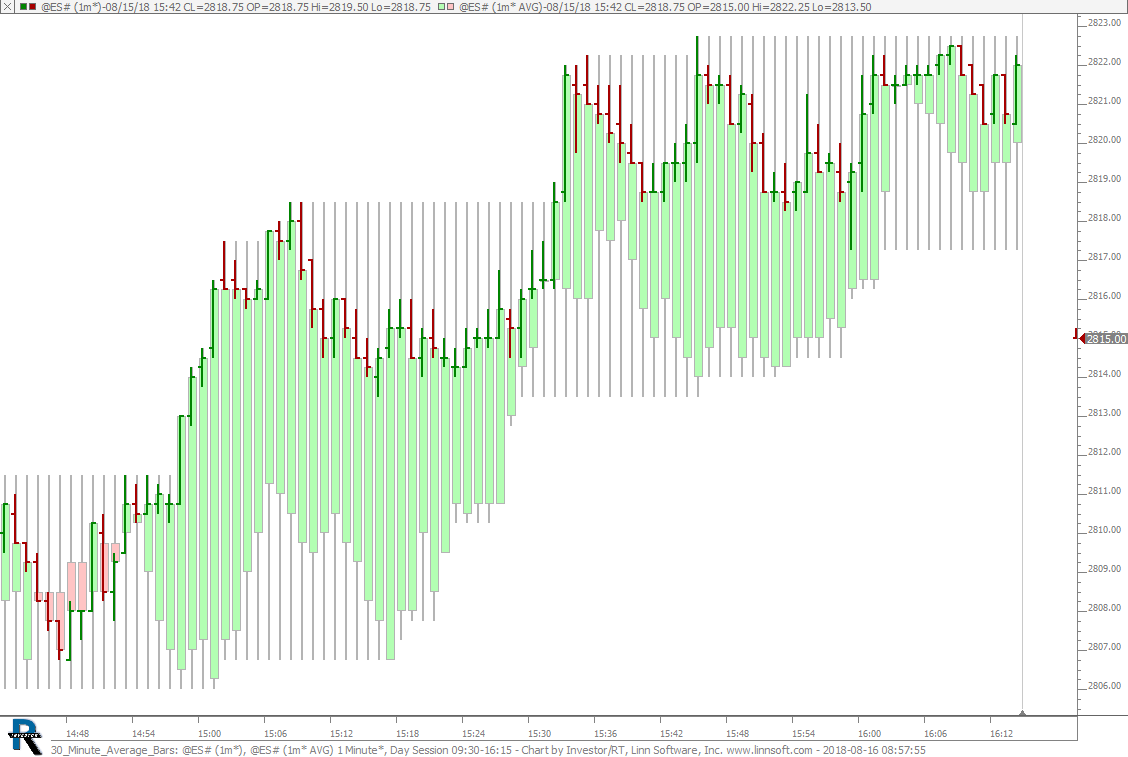 |
30 Minute Average Bars (@ES#) cpayne [totalcount]
7 years 4 months ago
30 Minute Average Bars. This chart was uploaded by Investor/RT 13.5.4 showing symbol: @ES#. |
View |
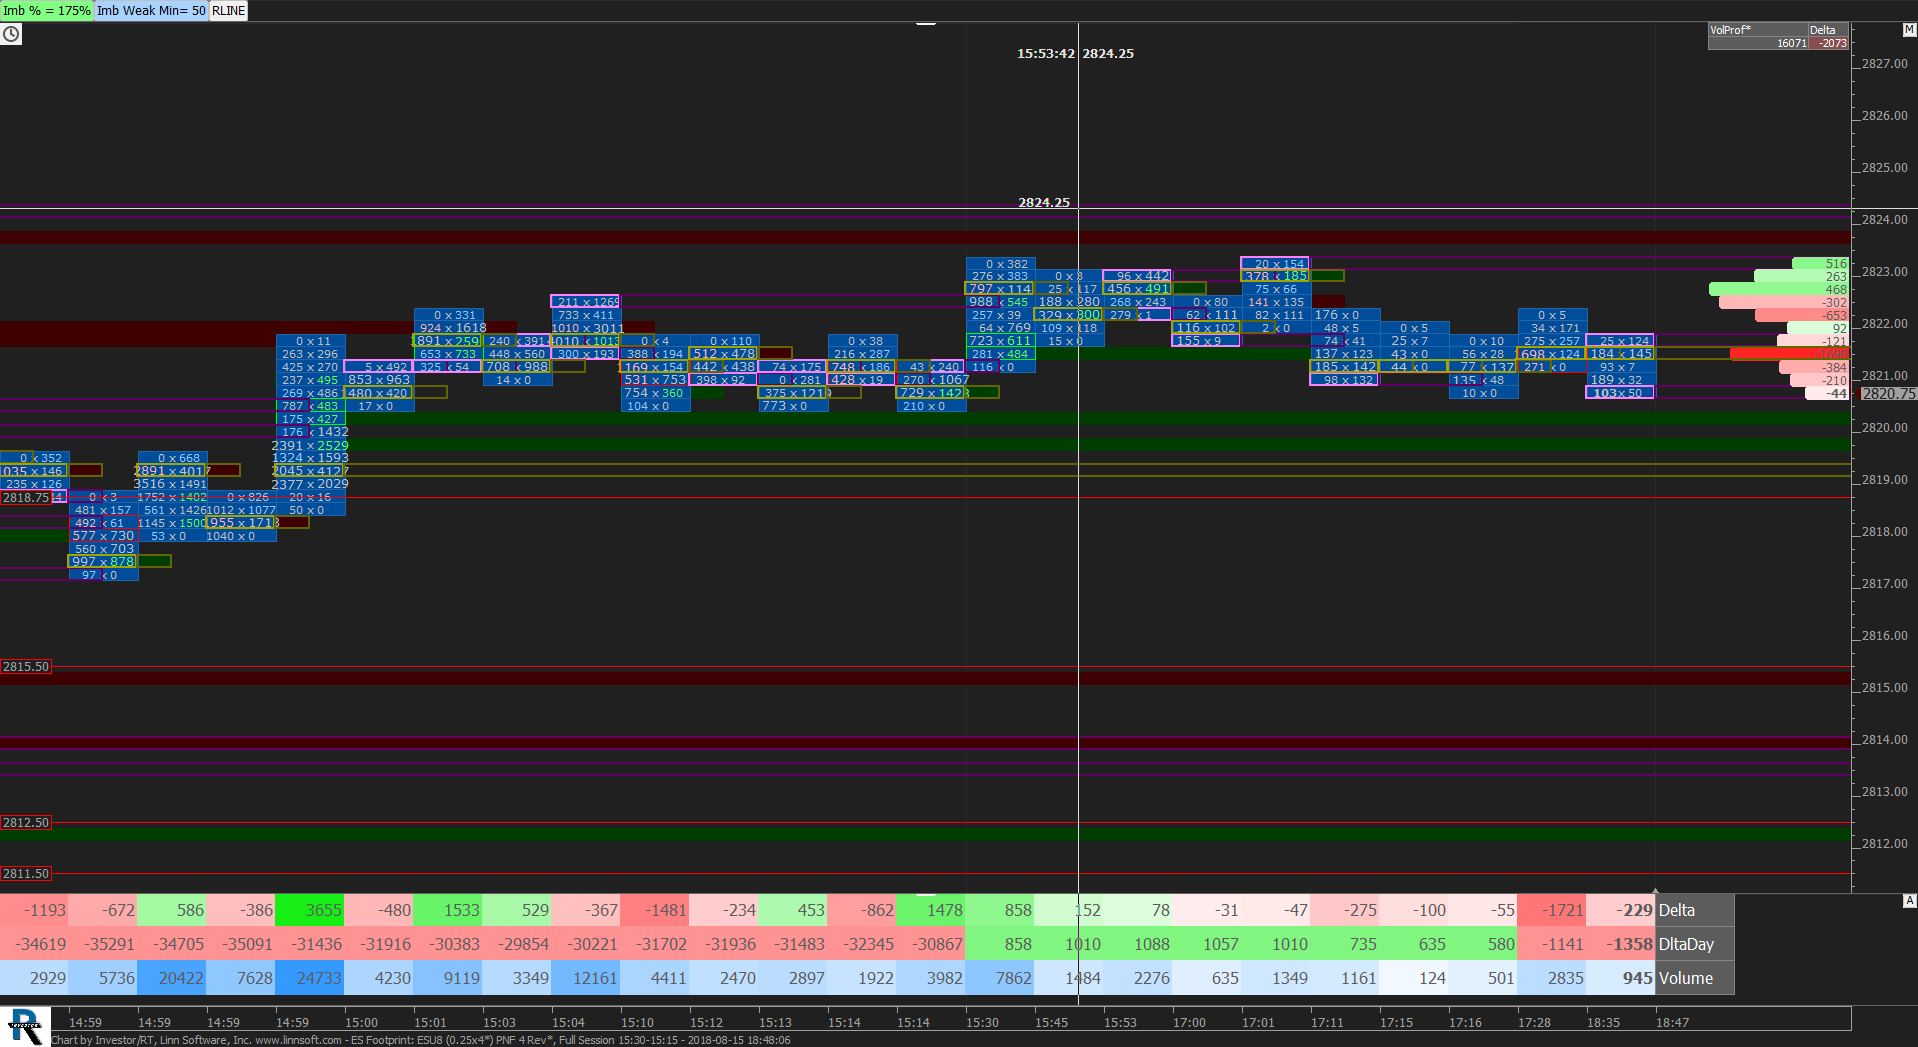 |
ES Footprint (ESU8) scottz46 [totalcount]
7 years 4 months ago
This chart was uploaded by Investor/RT 13.3.5 showing symbol: ESU8. |
View |
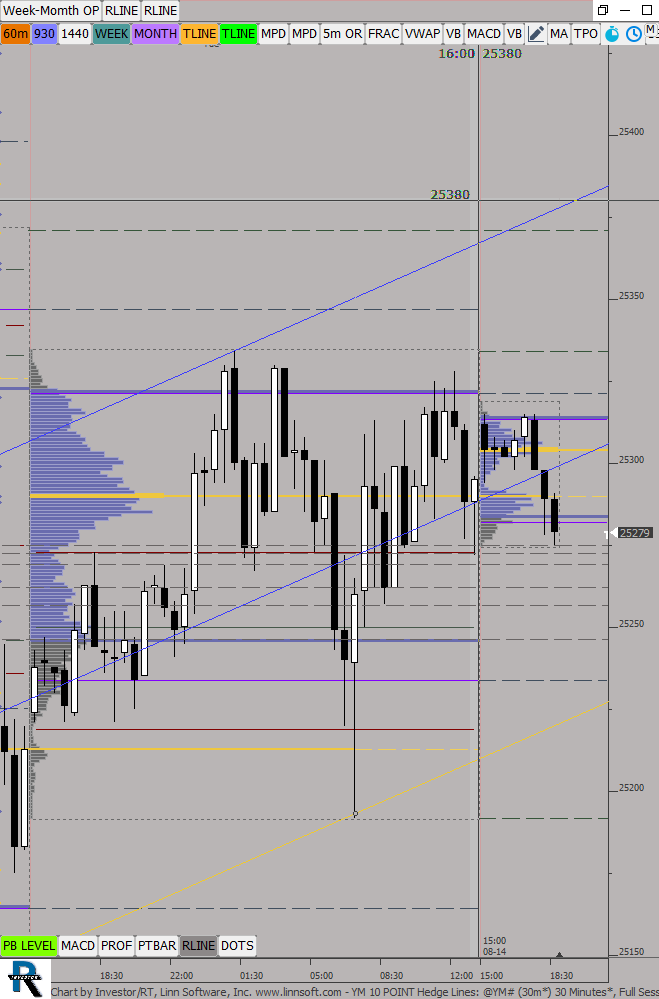 |
YM 10 POINT Hedge Lines (@YM#) ES42 [totalcount]
7 years 4 months ago
This chart was uploaded by Investor/RT 13.3.5 showing symbol: @YM#. |
View |
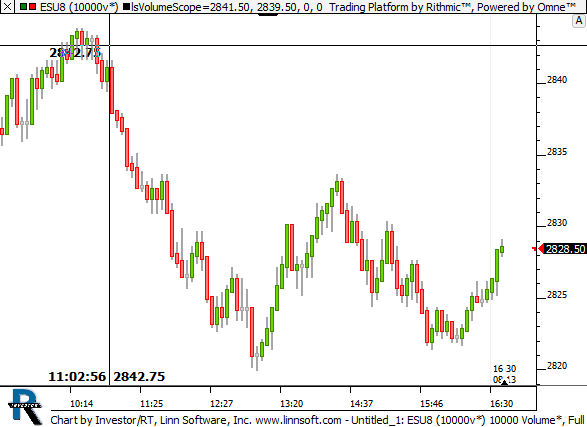 |
Untitled (ESU8) 2 gbertagna [totalcount]
7 years 4 months ago
This chart was uploaded by Investor/RT 13.5.3 showing symbol: ESU8. |
View |
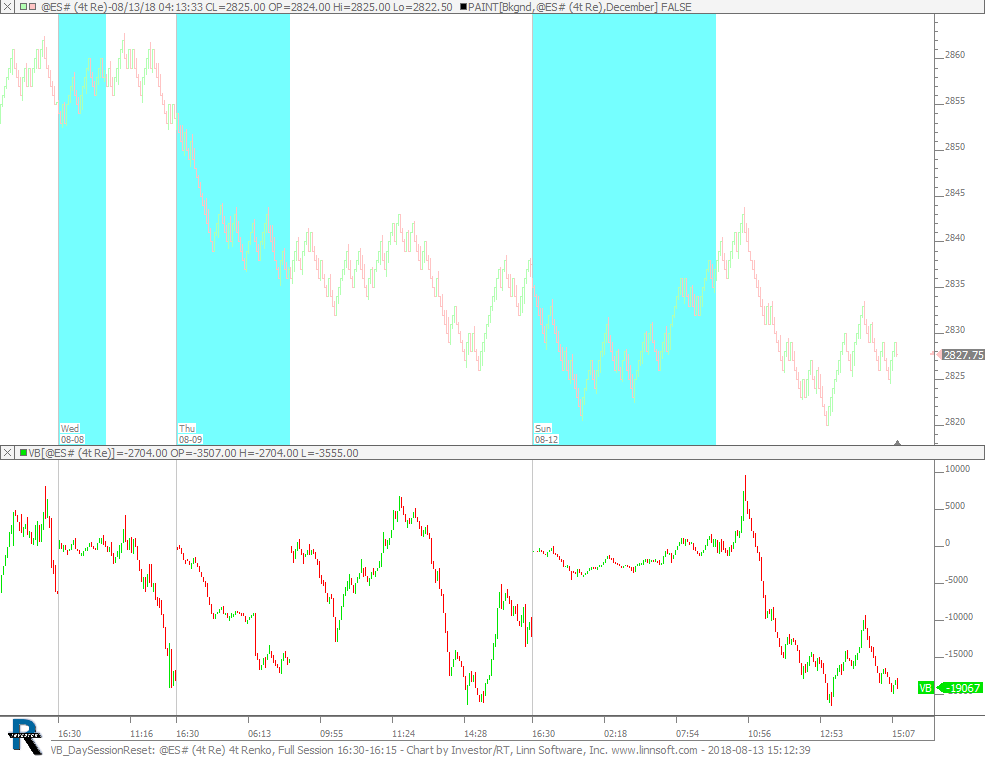 |
VB DaySessionReset (@ES#) cpayne [totalcount]
7 years 4 months ago
VB resets at start of day session (1020 minutes for ES). This chart was uploaded by Investor/RT 13.5.4 showing symbol: @ES#. |
View |
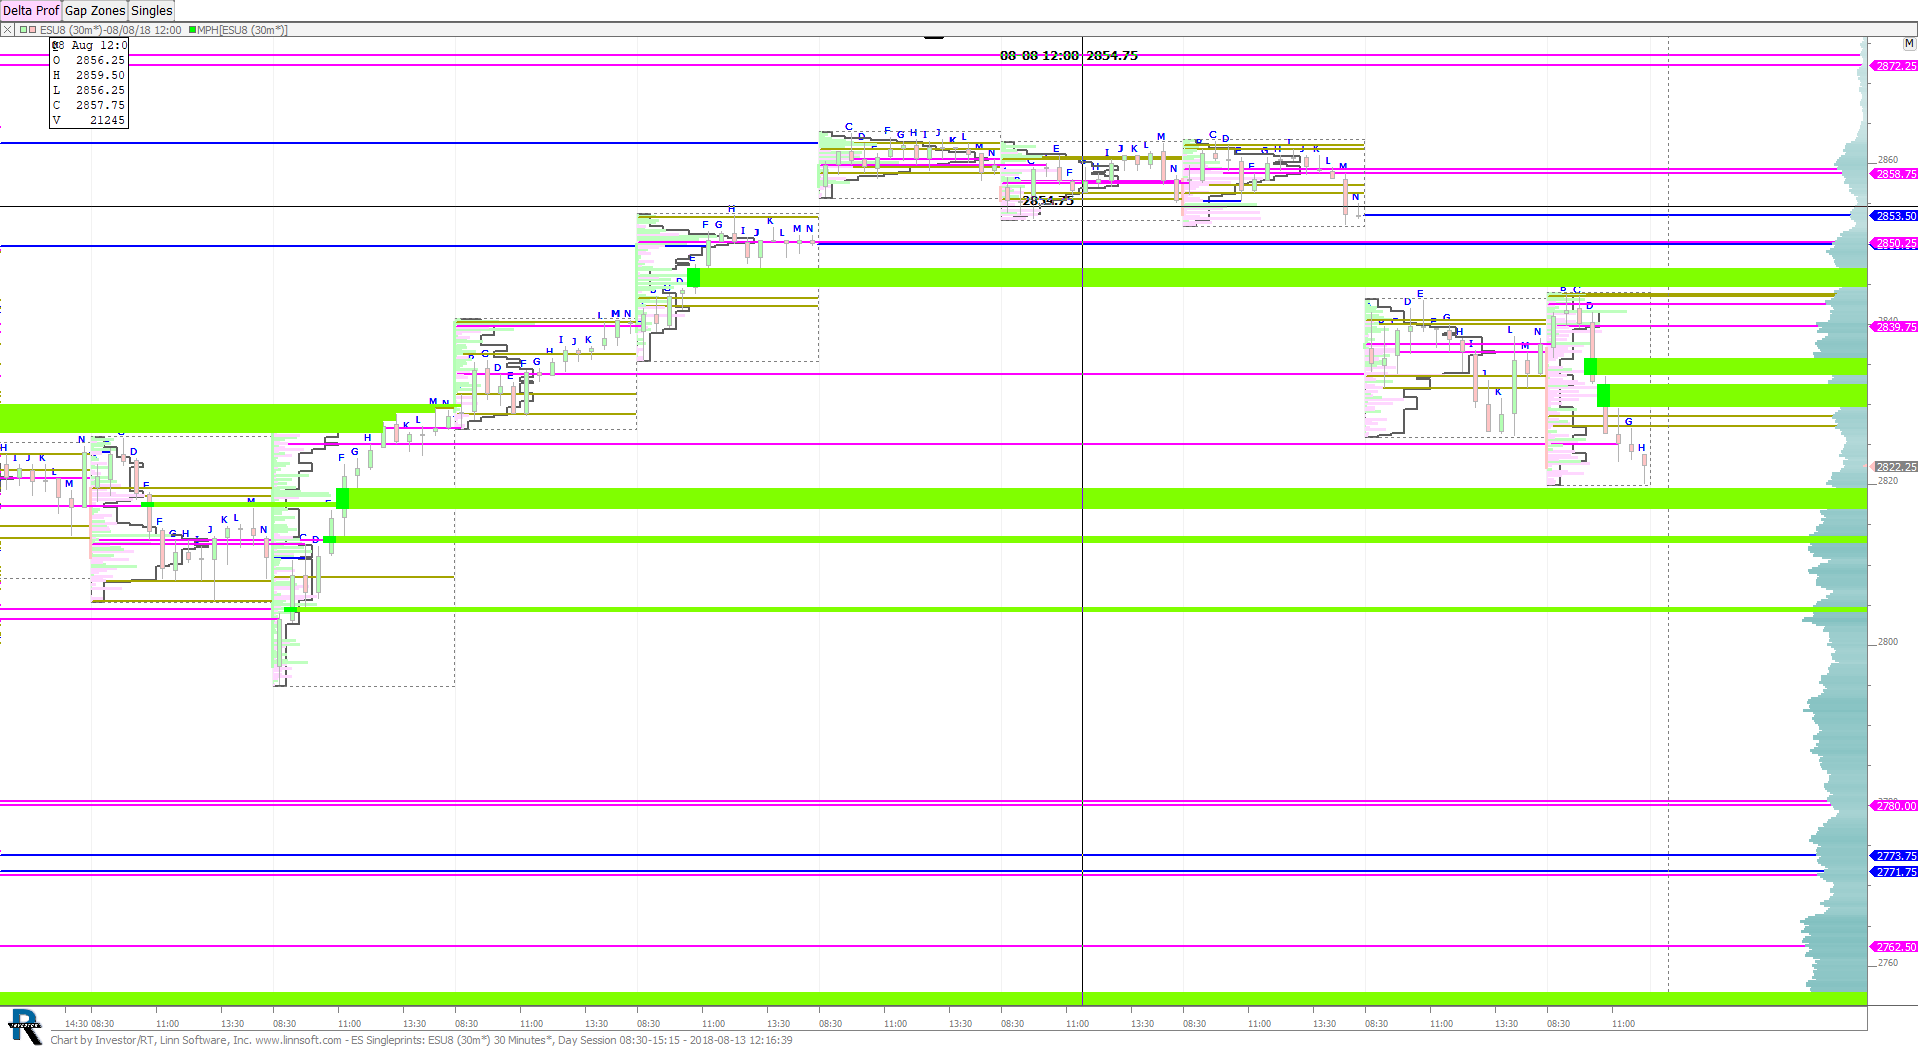 |
ES Singleprints (ESU8) scottz46 [totalcount]
7 years 4 months ago
This chart was uploaded by Investor/RT 13.3.3 showing symbol: ESU8. |
View |