 |
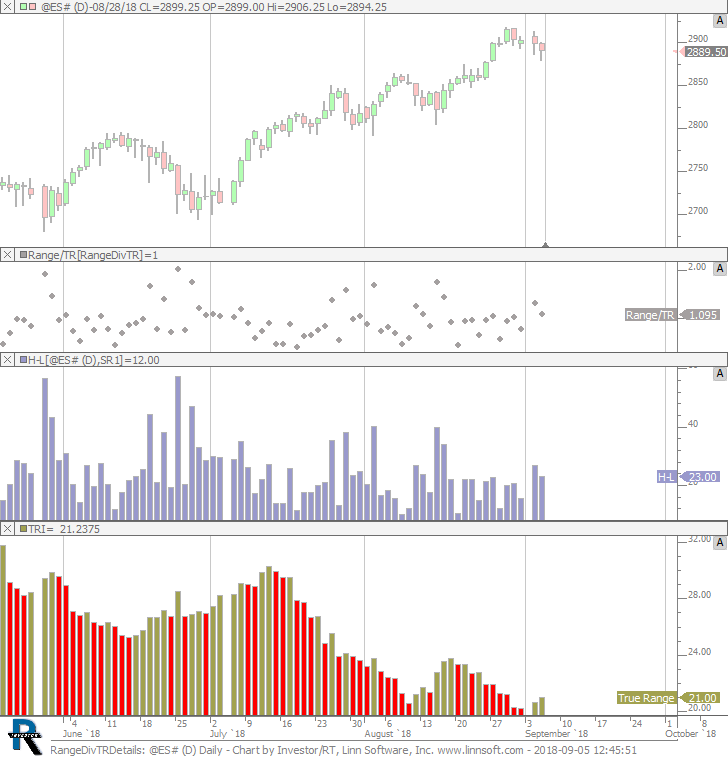
RangeDivTRDetails (@ES#) cpayne [totalcount]
7 years 11 months ago
This chart was uploaded by Investor/RT 13.5.5 showing symbol: @ES#. |
View |
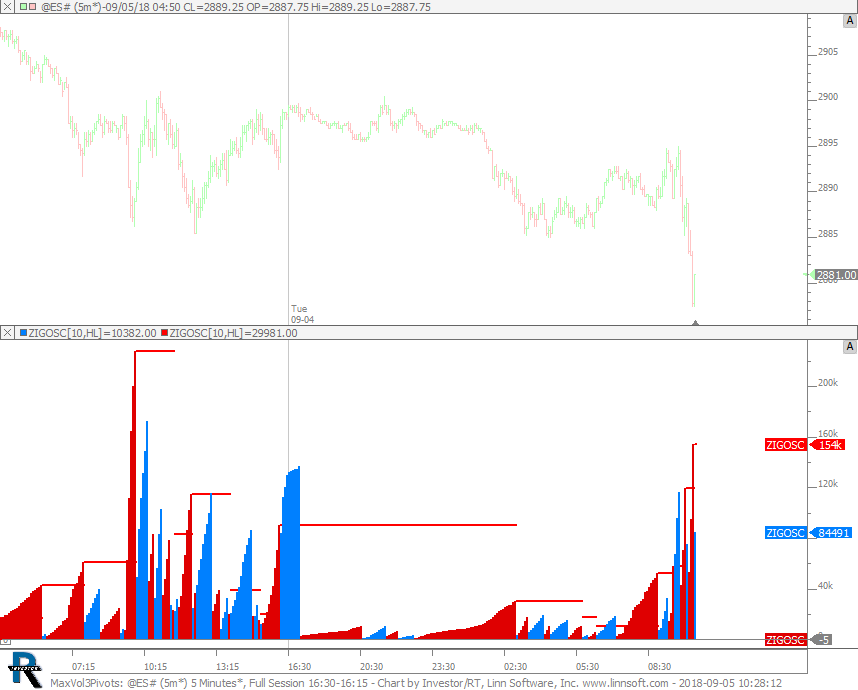 |
MaxVol3Pivots (@ES#) cpayne [totalcount]
7 years 11 months ago
This chart was uploaded by Investor/RT 13.5.5 showing symbol: @ES#. |
View |
 |
RangeDivTR cpayne [totalcount]
7 years 11 months ago
Range Divided by 20 Period True Range. This chart was uploaded by Investor/RT 13.5.5. |
View |
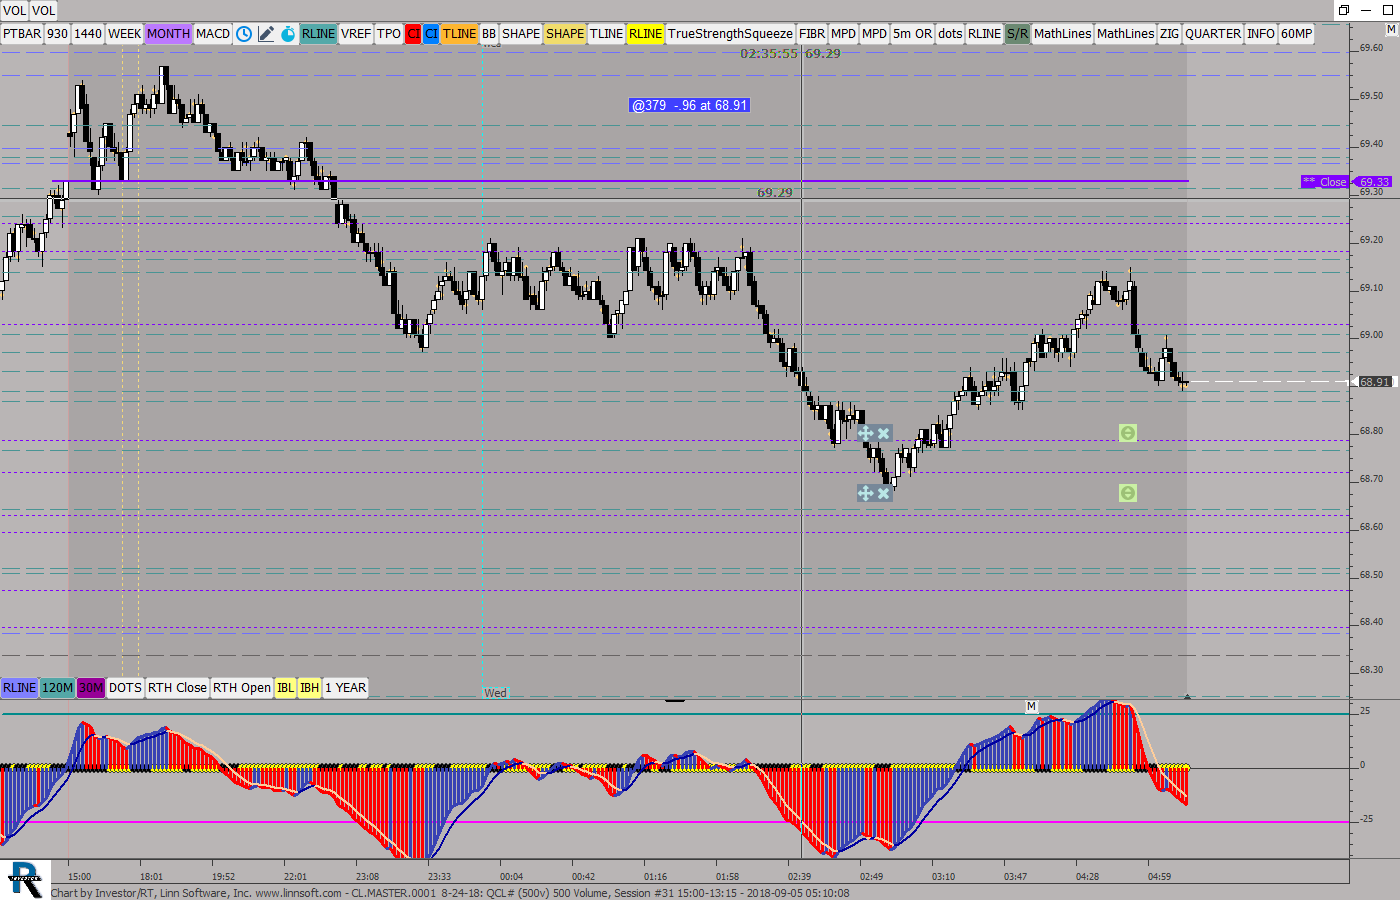 |
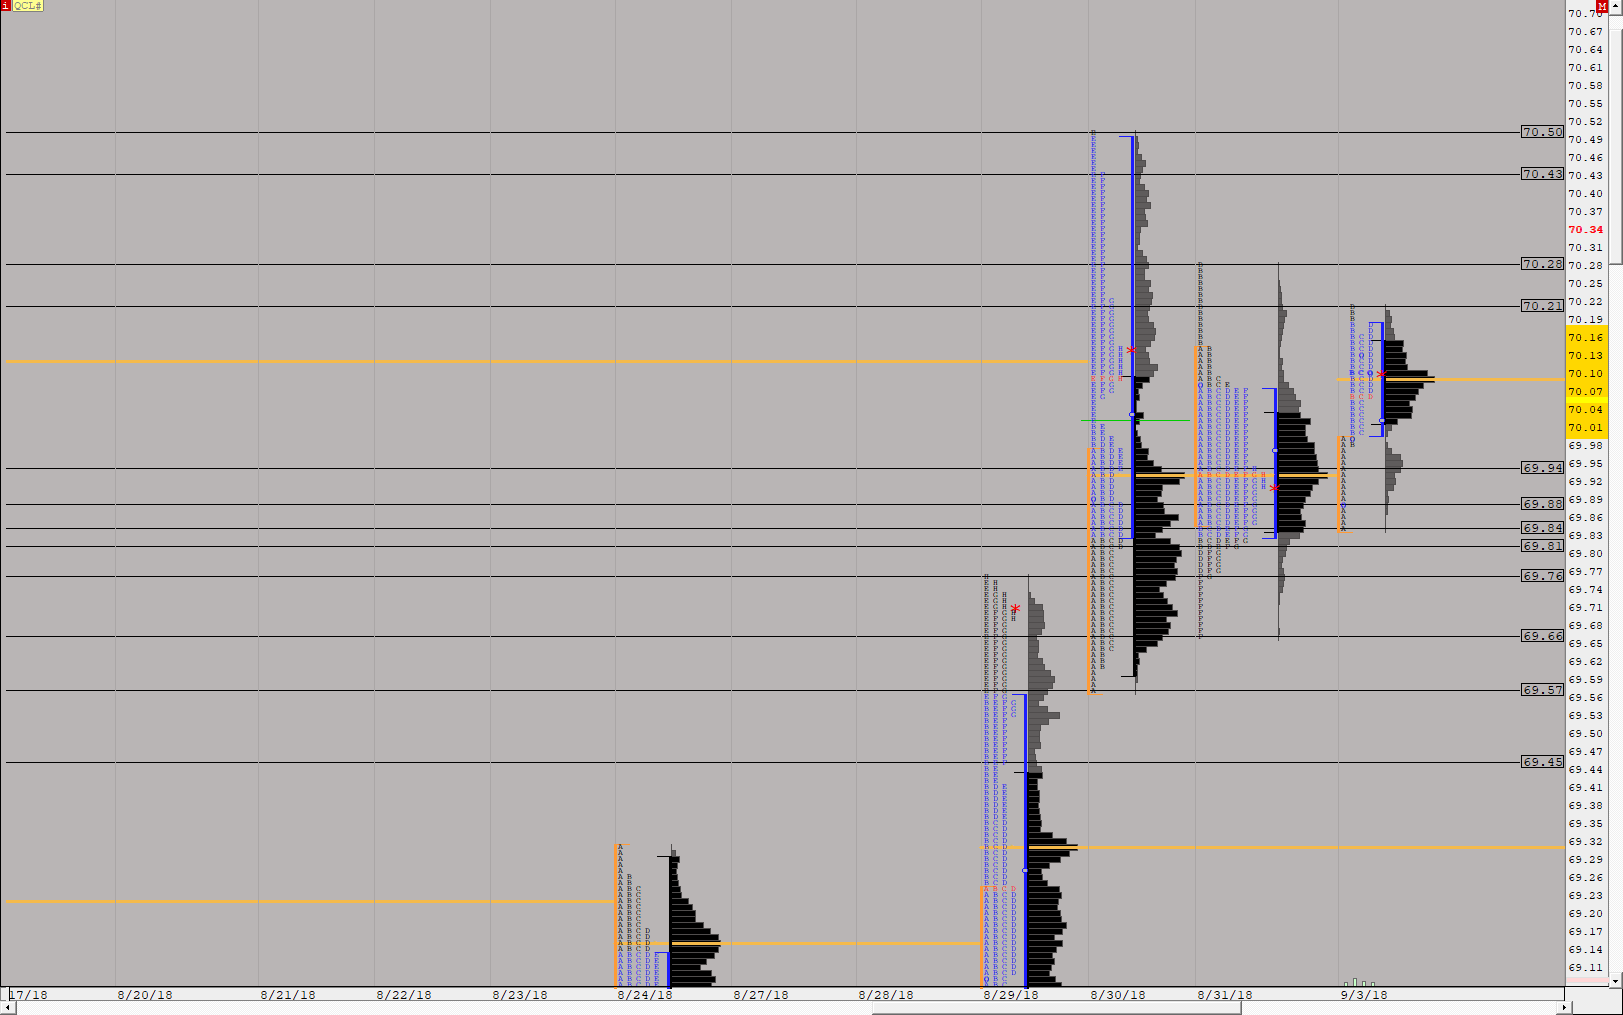
CLMASTER0001 8 24 (QCL#) ES42 [totalcount]
7 years 11 months ago
This chart was uploaded by Investor/RT 13.3.5 showing symbol: QCL#. |
View |
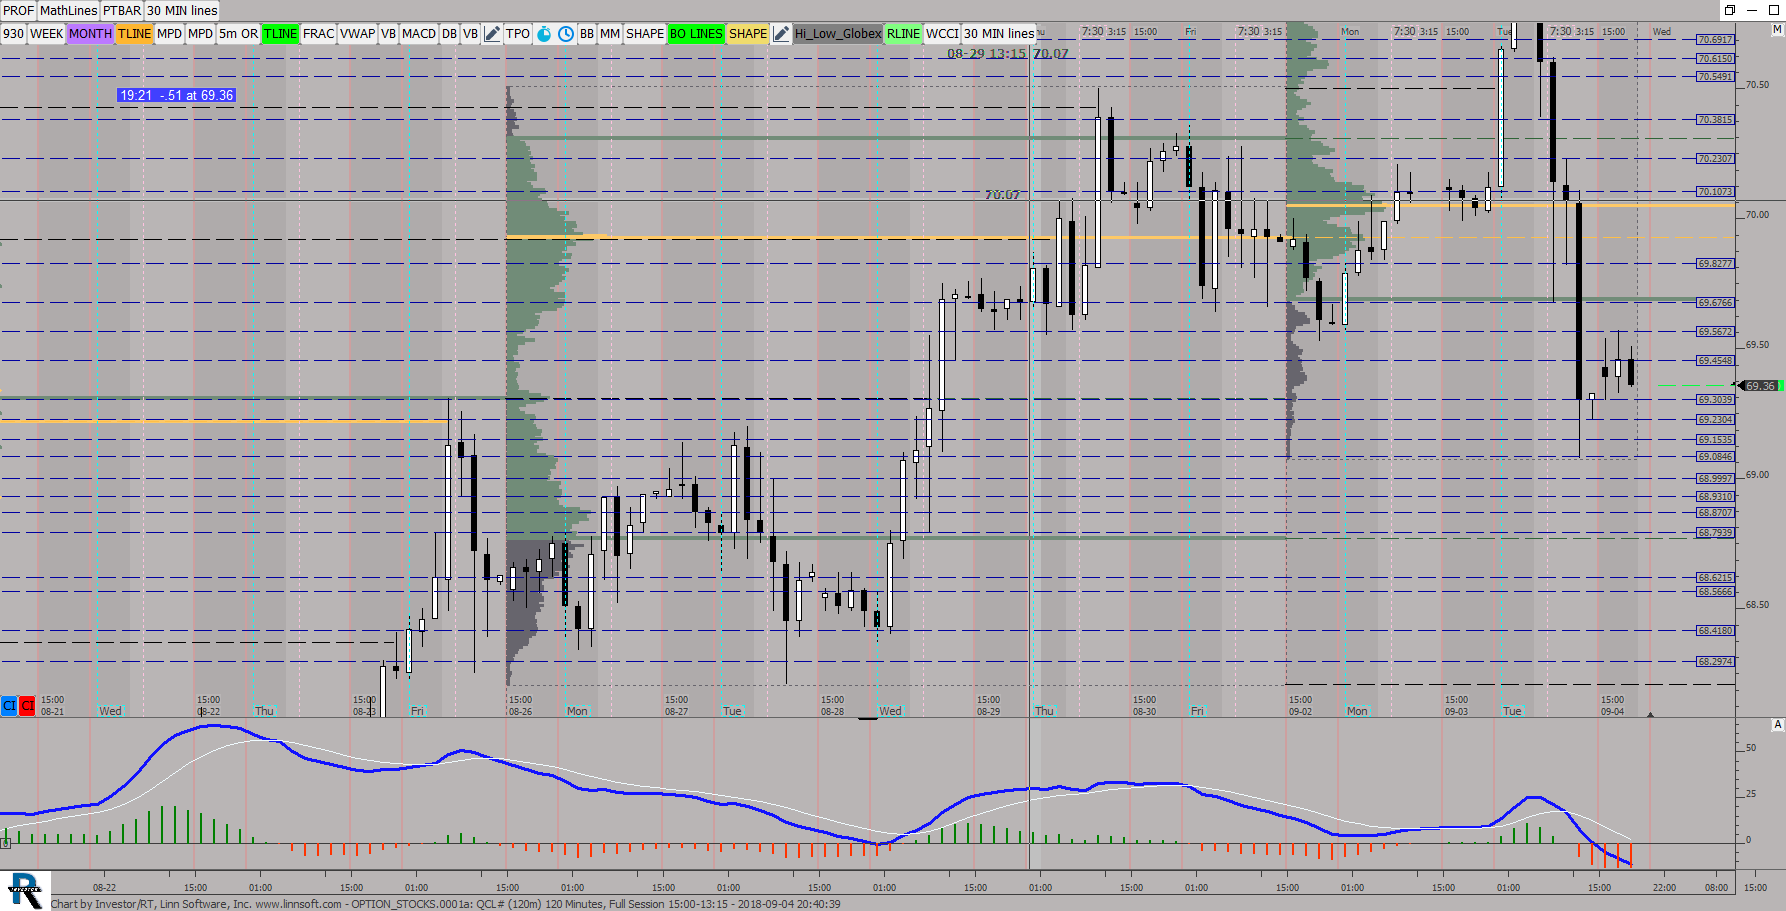 |
OPTION STOCKS0001a (QCL#) ES42 [totalcount]
7 years 11 months ago
This chart was uploaded by Investor/RT 13.3.5 showing symbol: QCL#. |
View |
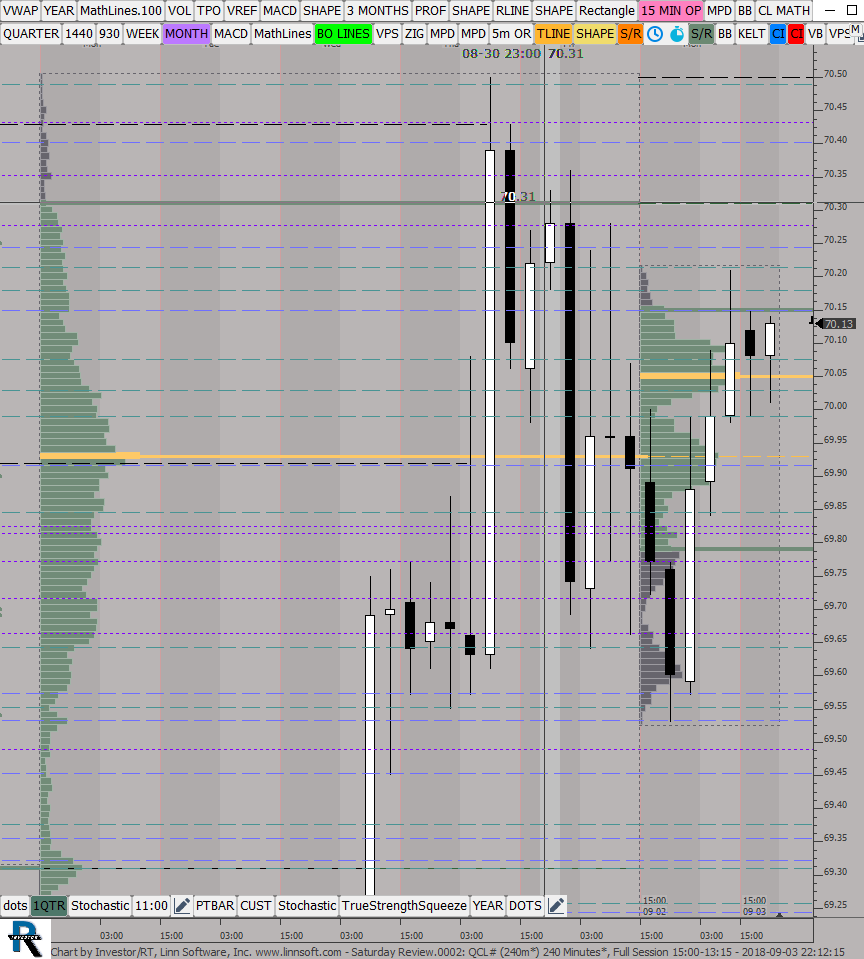 |
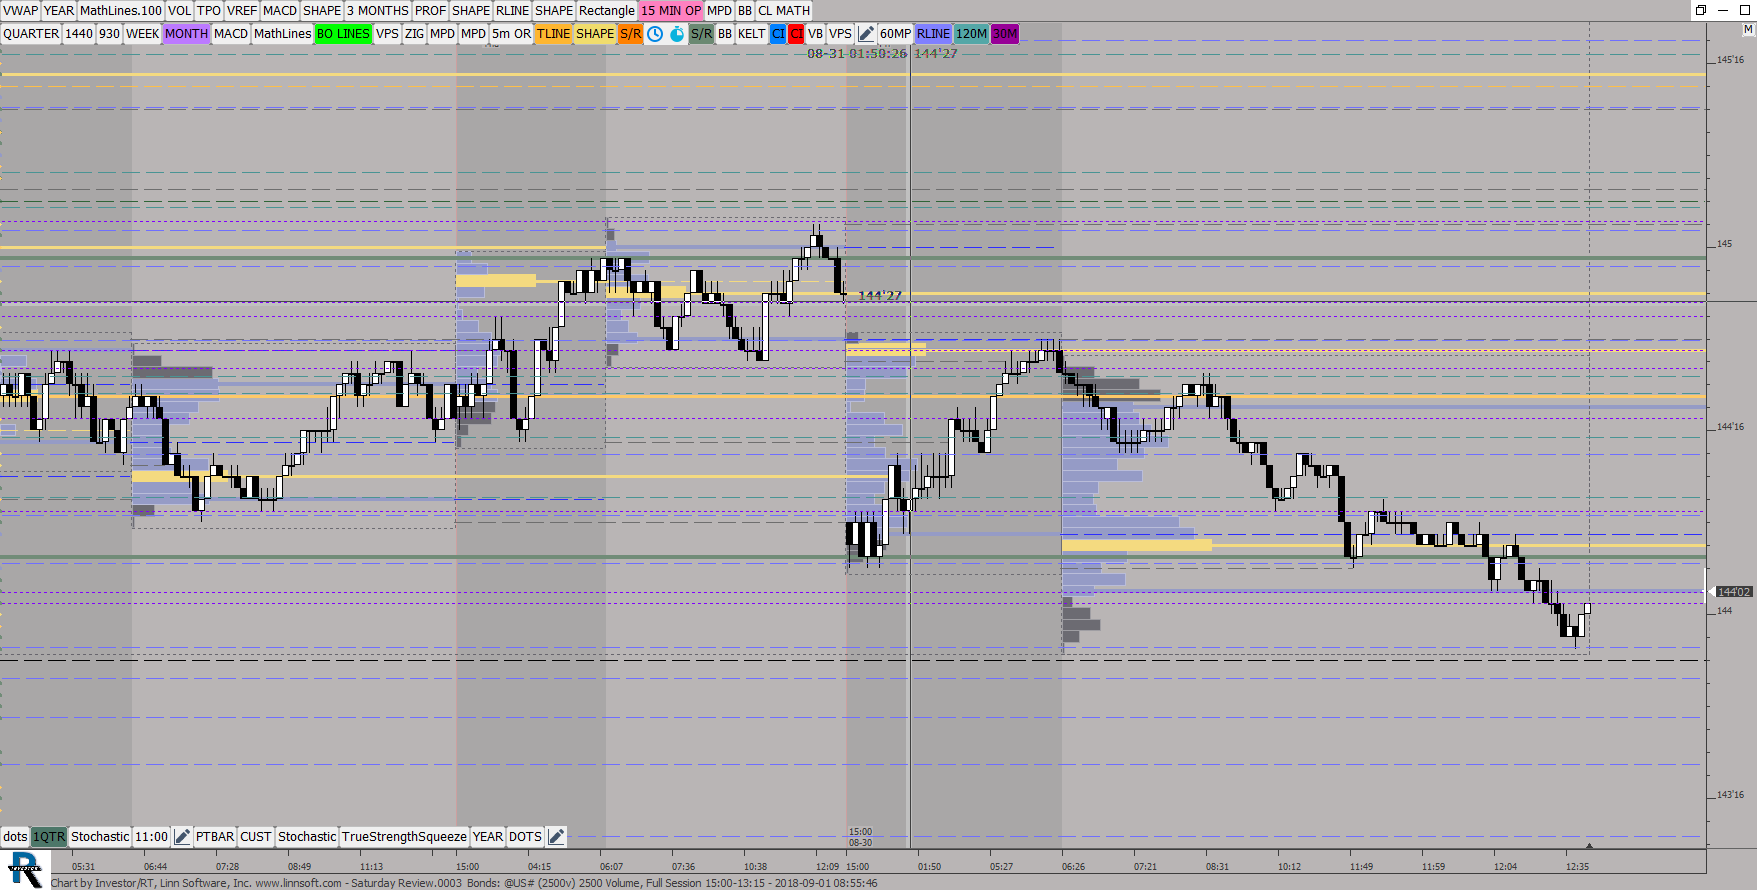
Saturday Review (QCL#) ES42 [totalcount]
7 years 11 months ago
This chart was uploaded by Investor/RT 13.3.5 showing symbol: QCL#. |
View |
 |
MP DAILY (QCL#) ES42 [totalcount]
7 years 11 months ago
This chart was uploaded by Investor/RT 13.3.5 showing symbol: QCL#. |
View |
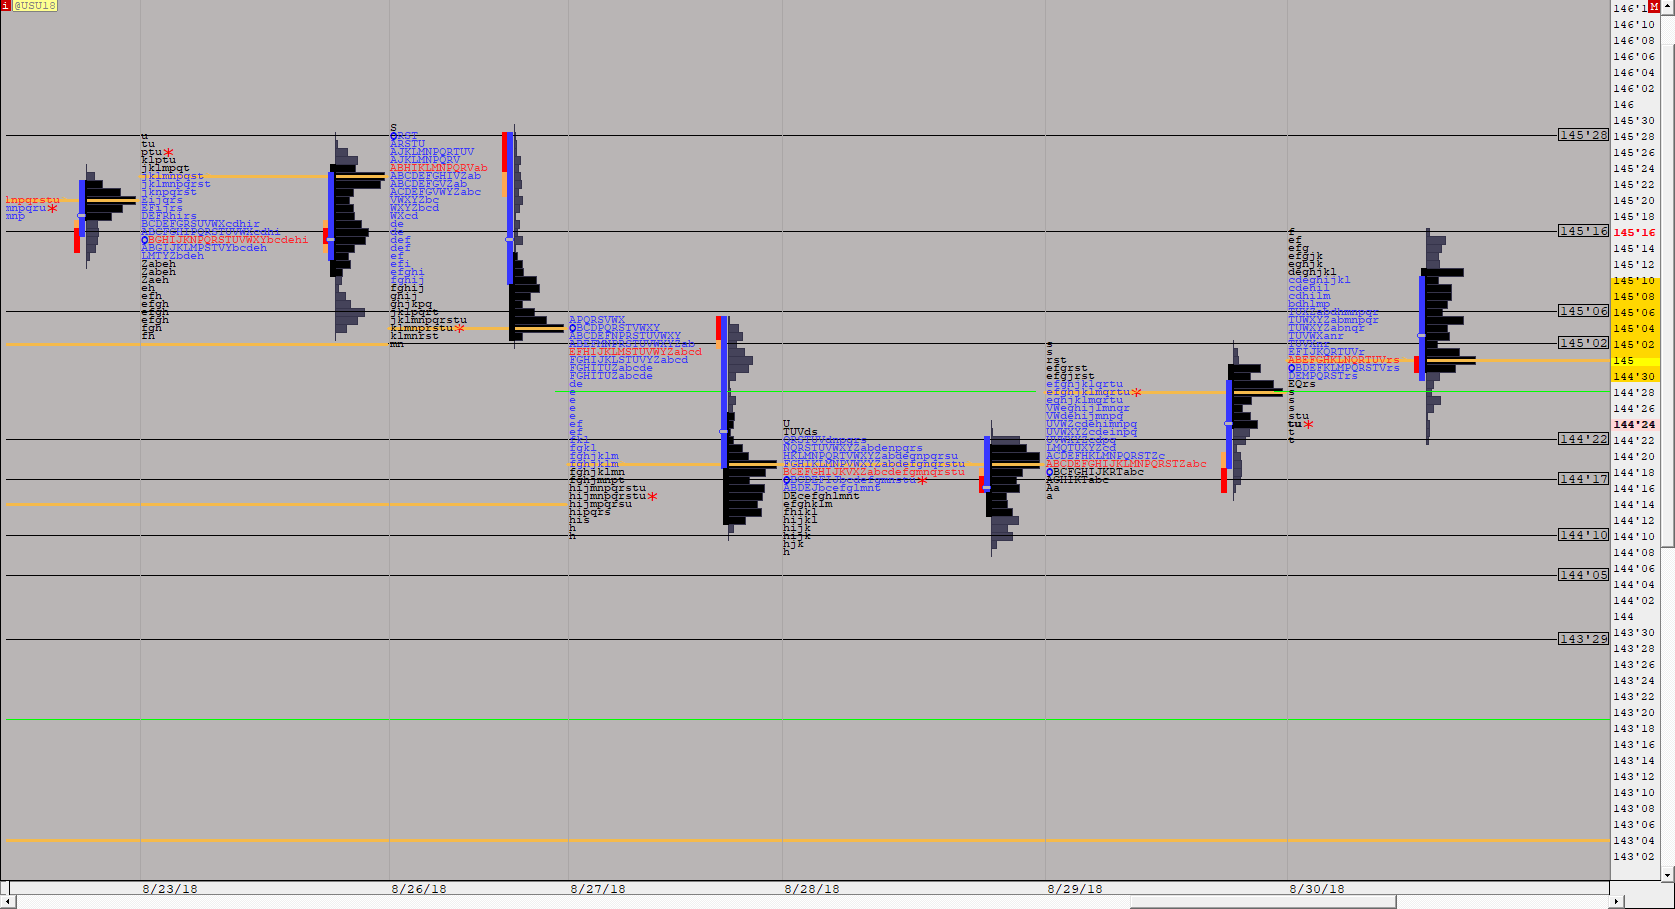 |
BONDS (@USU18) ES42 [totalcount]
7 years 11 months ago
This chart was uploaded by Investor/RT 13.3.5 showing symbol: @USU18. |
View |
 |
Saturday Review0003 Bonds (@US#) ES42 [totalcount]
7 years 11 months ago
This chart was uploaded by Investor/RT 13.3.5 showing symbol: @US#. |
View |
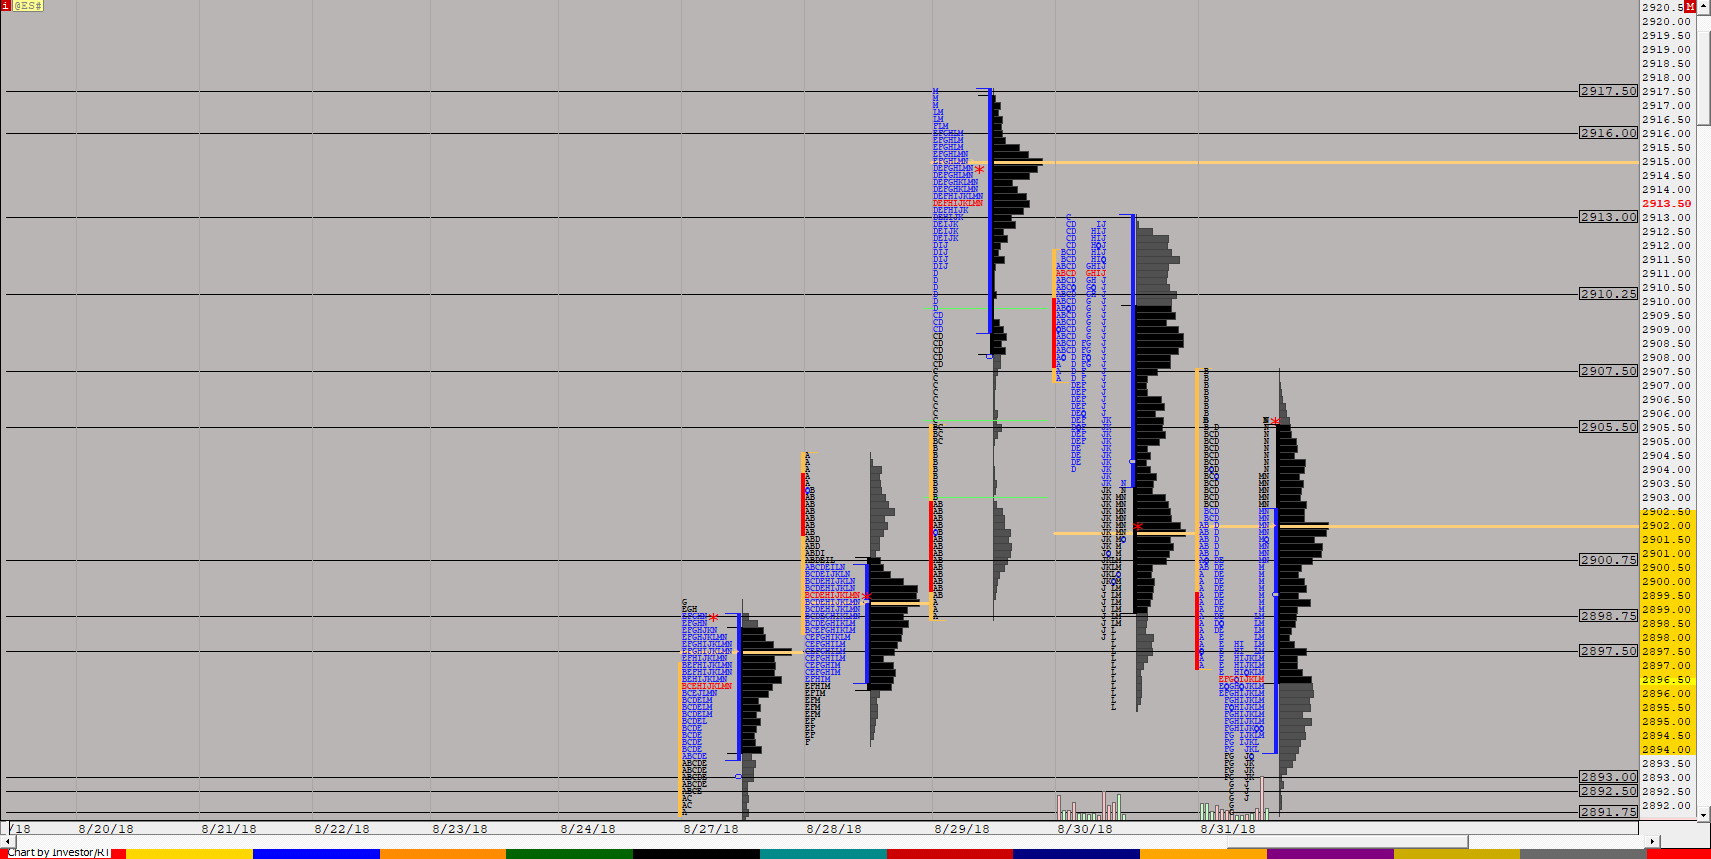 |
ES Group01c (@ES#) ES42 [totalcount]
7 years 11 months ago
This chart was uploaded by Investor/RT 13.3.5 showing symbol: @ES#. |
View |
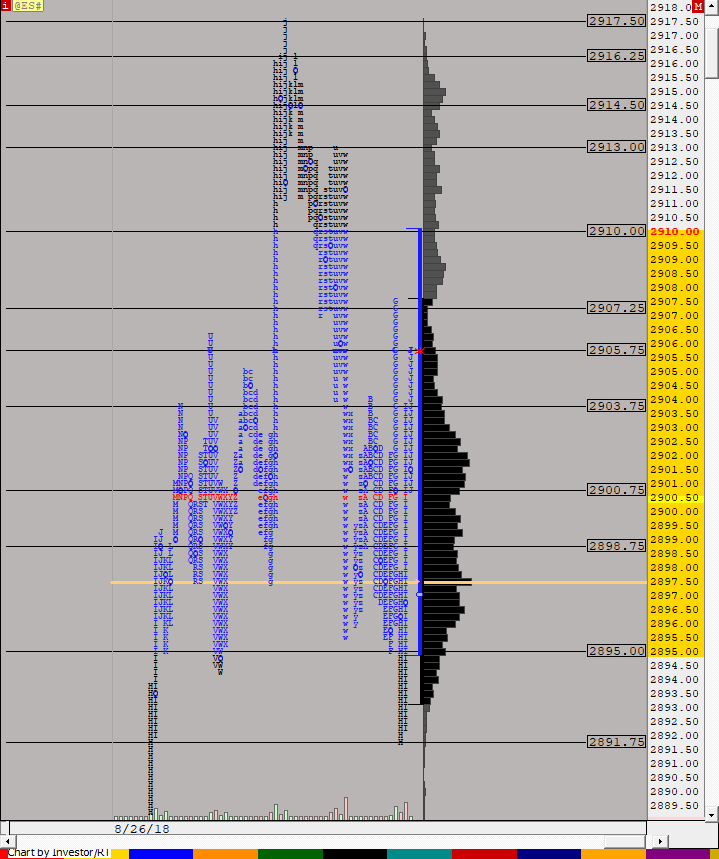 |
Untitled TPO (@ES#) ES42 [totalcount]
7 years 11 months ago
This chart was uploaded by Investor/RT 13.3.5 showing symbol: @ES#. |
View |
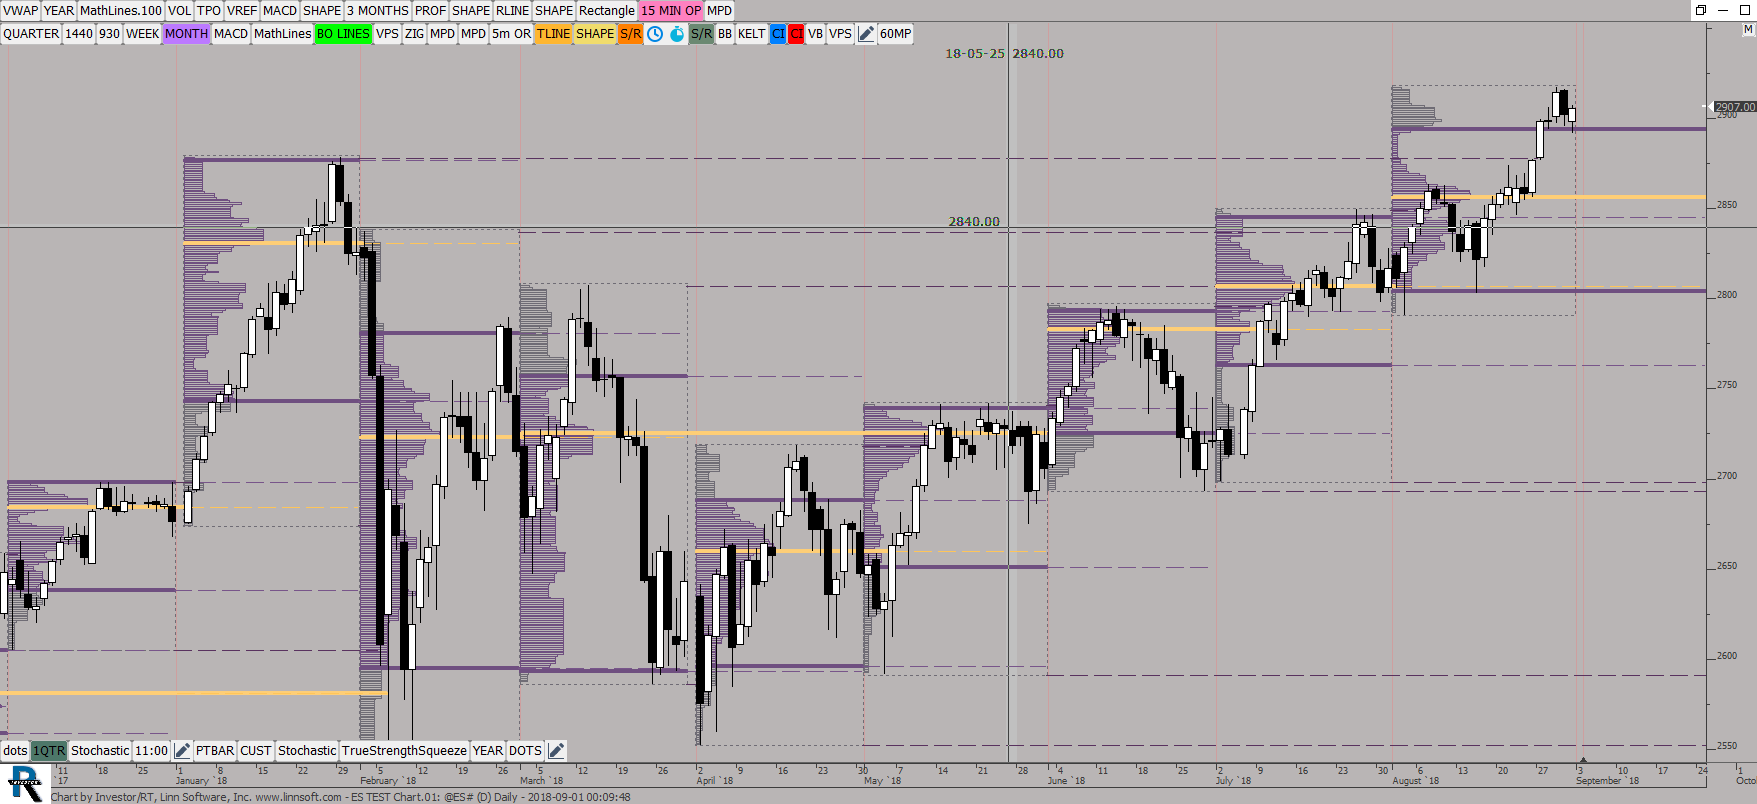 |
ES TEST Chart (@ES#) ES42 [totalcount]
7 years 11 months ago
This chart was uploaded by Investor/RT 13.3.5 showing symbol: @ES#. |
View |
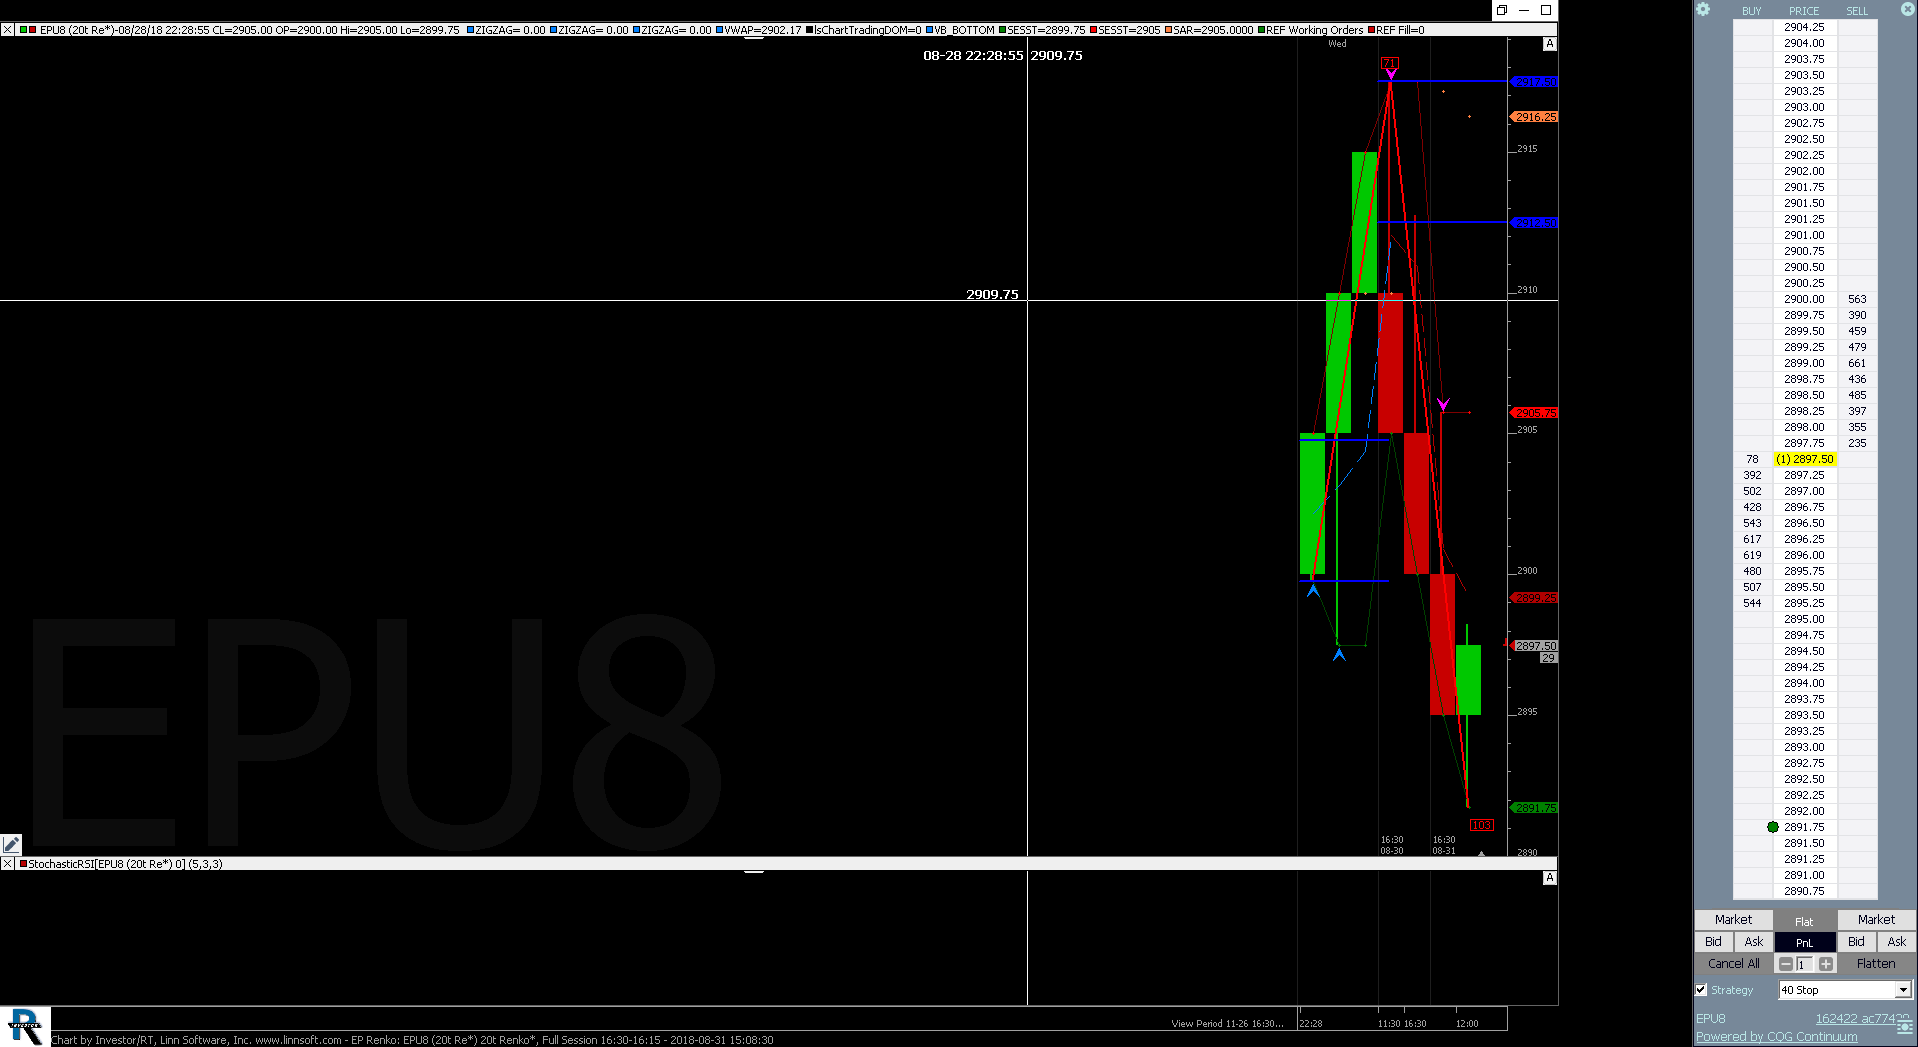 |
EP Renko (EPU8) Geoff Lawrence [totalcount]
7 years 11 months ago
This chart was uploaded by Investor/RT 13.5.5 showing symbol: EPU8. |
View |
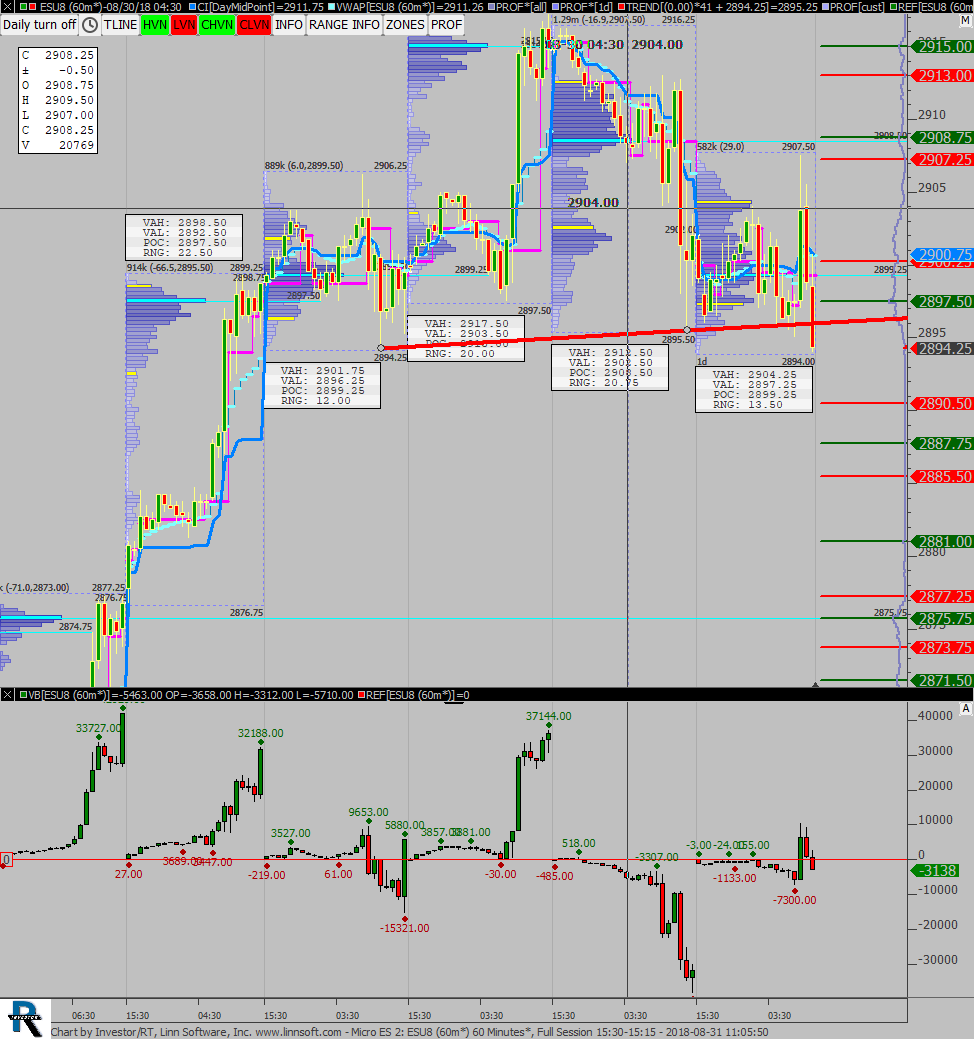 |
Micro ES (ESU8) scottz46 [totalcount]
7 years 11 months ago
This chart was uploaded by Investor/RT 13.3.5 showing symbol: ESU8. |
View |
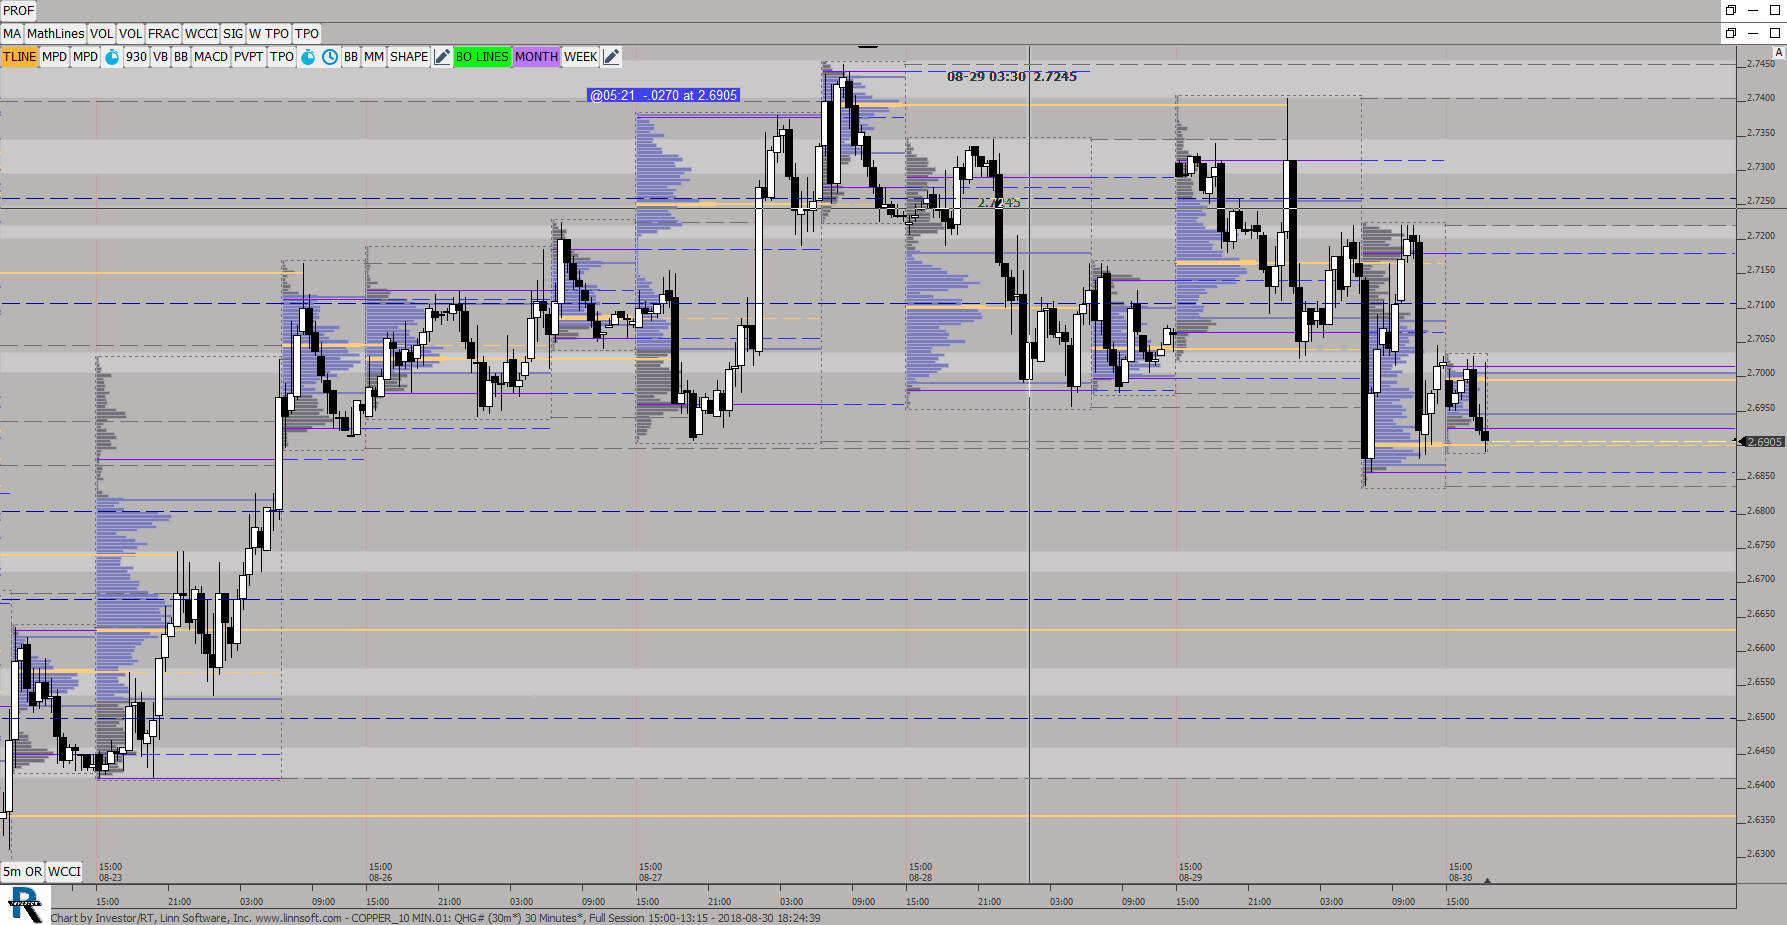 |
COPPER 10 MIN (QHG#) ES42 [totalcount]
7 years 11 months ago
This chart was uploaded by Investor/RT 13.3.5 showing symbol: QHG#. |
View |
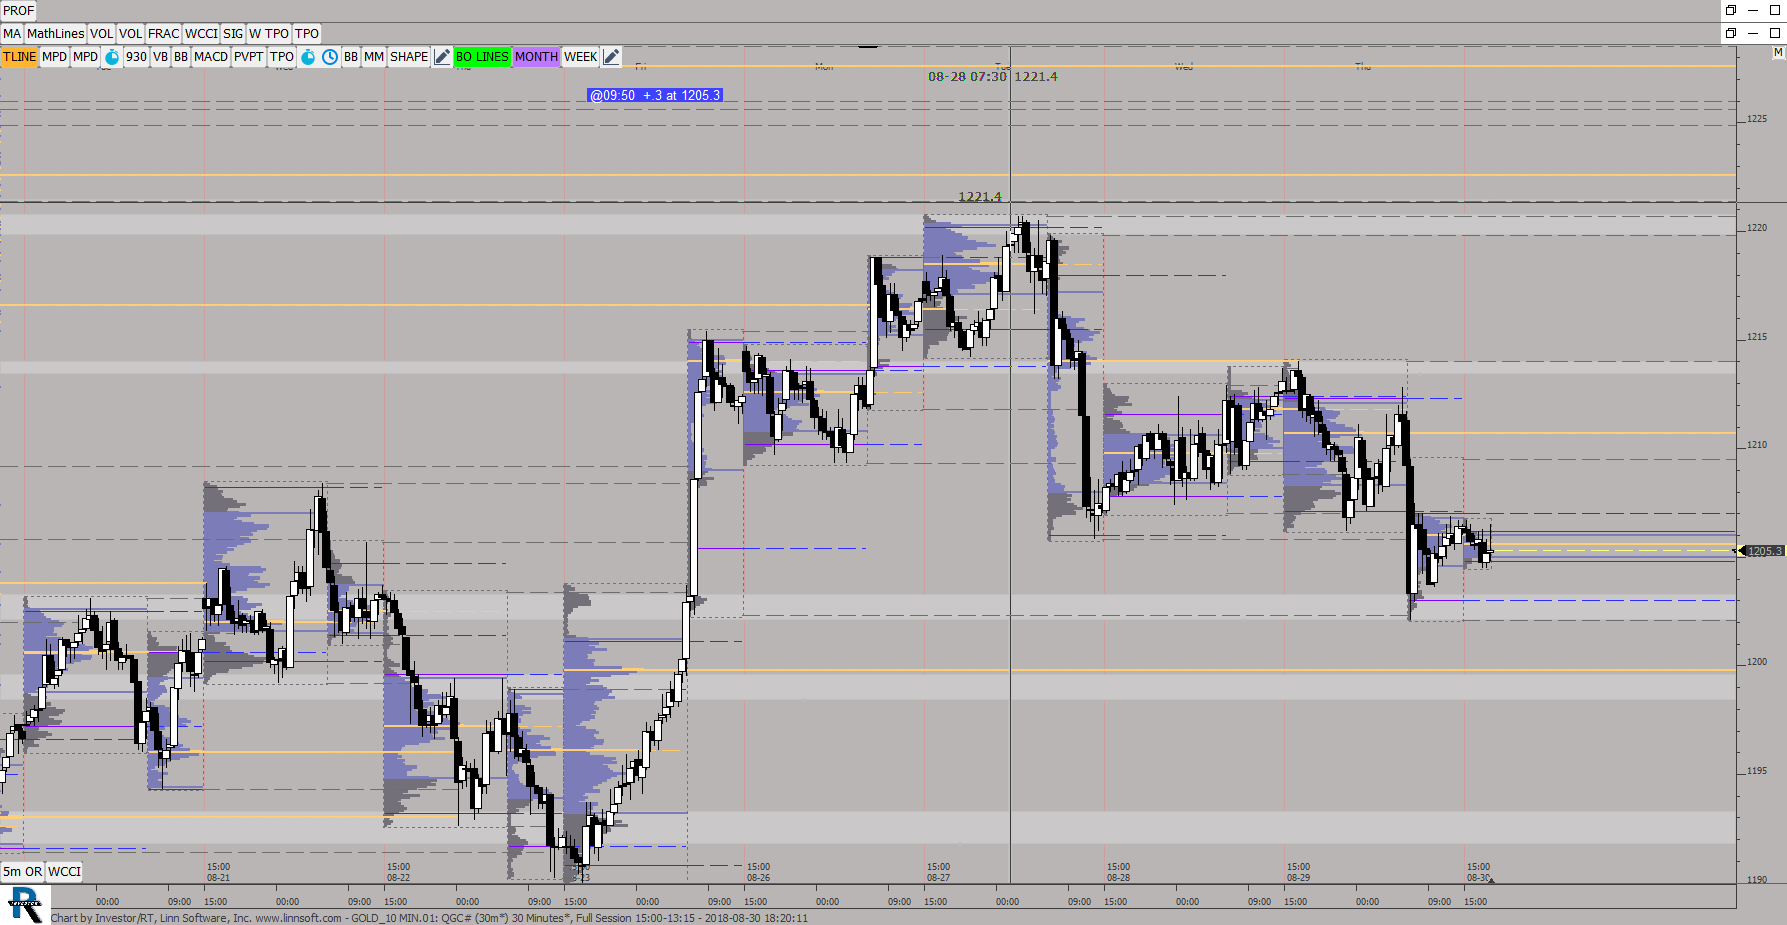 |
GOLD 10 MIN (QGC#) ES42 [totalcount]
7 years 11 months ago
This chart was uploaded by Investor/RT 13.3.5 showing symbol: QGC#. |
View |
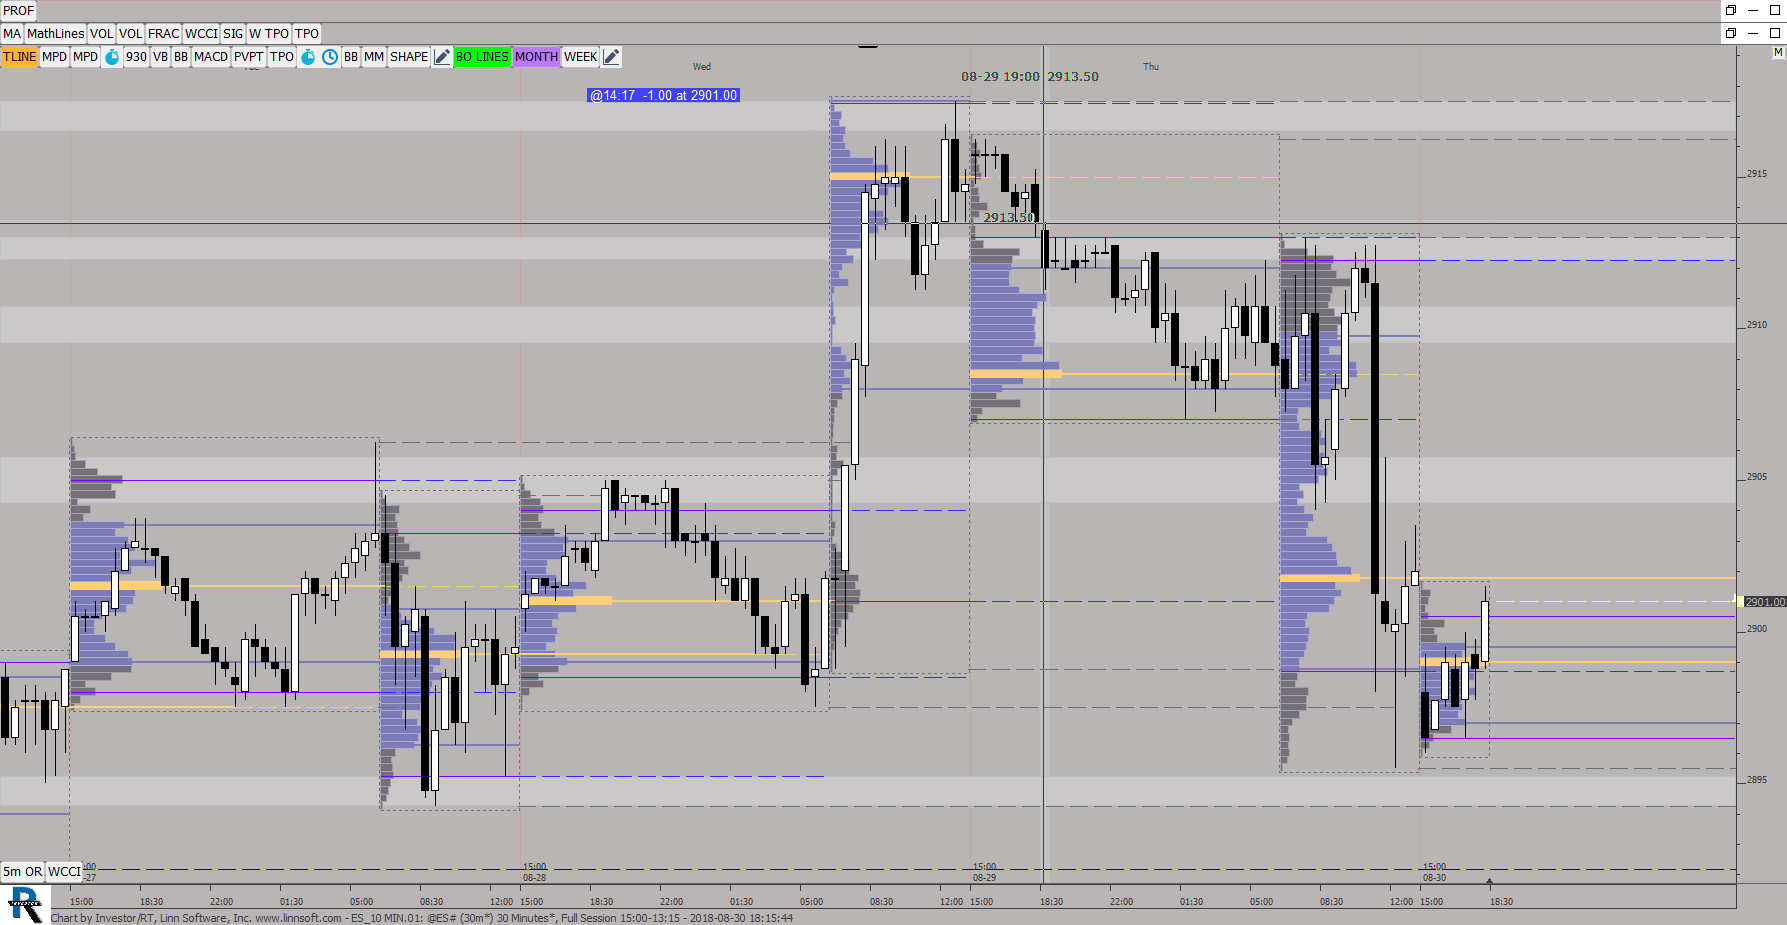 |
ES 10 MIN (@ES#) ES42 [totalcount]
7 years 11 months ago
This chart was uploaded by Investor/RT 13.3.5 showing symbol: @ES#. |
View |
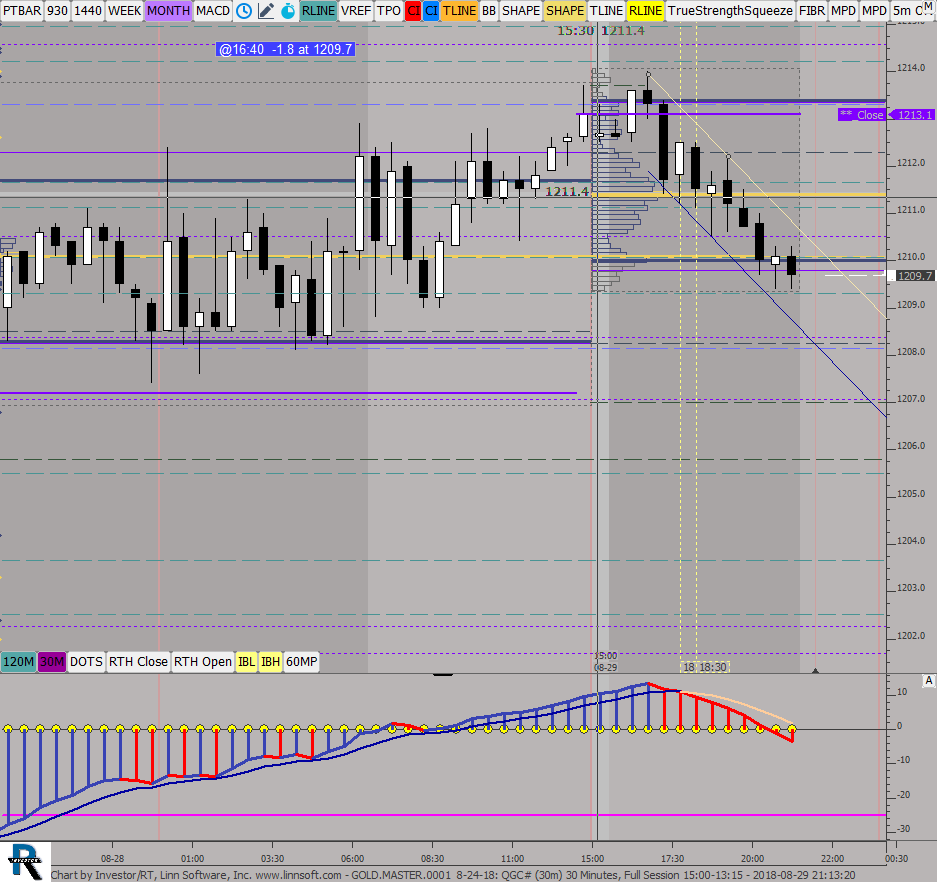 |
GOLDMASTER0001 8 24 (QGC#) ES42 [totalcount]
7 years 11 months ago
This chart was uploaded by Investor/RT 13.3.5 showing symbol: QGC#. |
View |
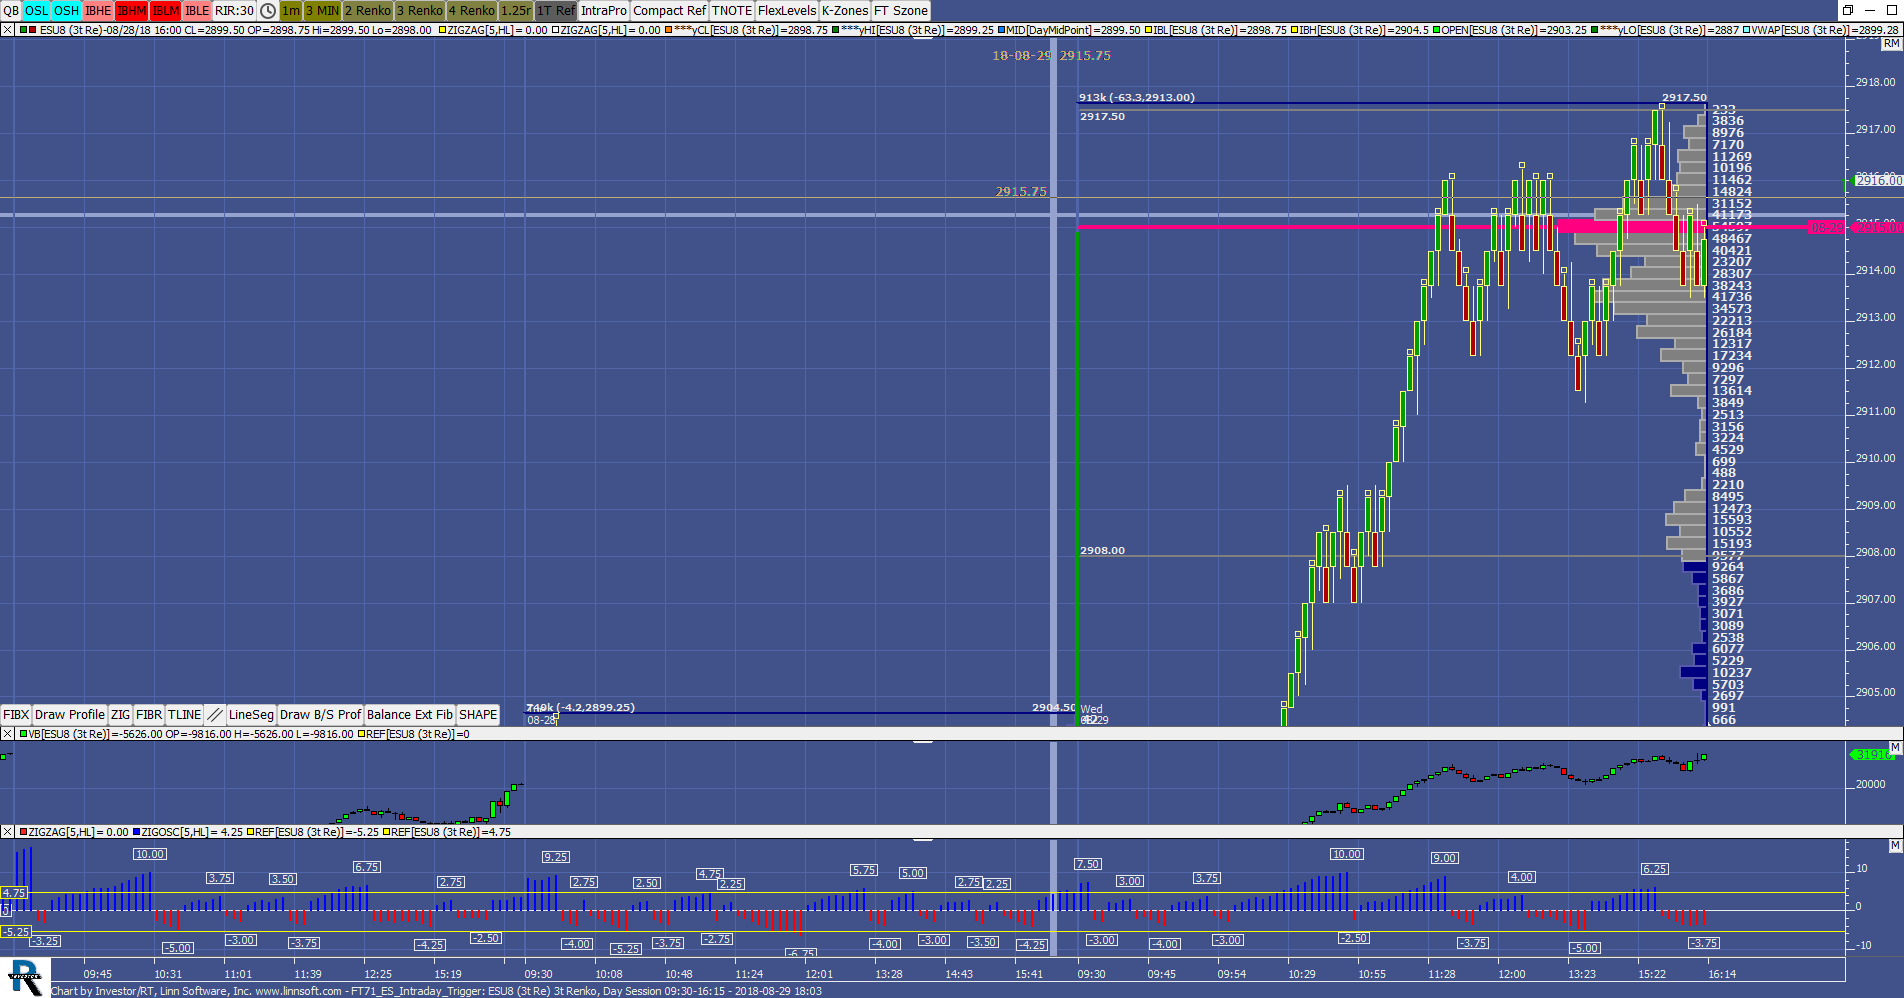 |
FT71 ES Intraday Trigger (ESU8) Food4Monkeys [totalcount]
7 years 11 months ago
ProfChart example. This chart was uploaded by Investor/RT 13.3.5 showing symbol: ESU8. |
View |
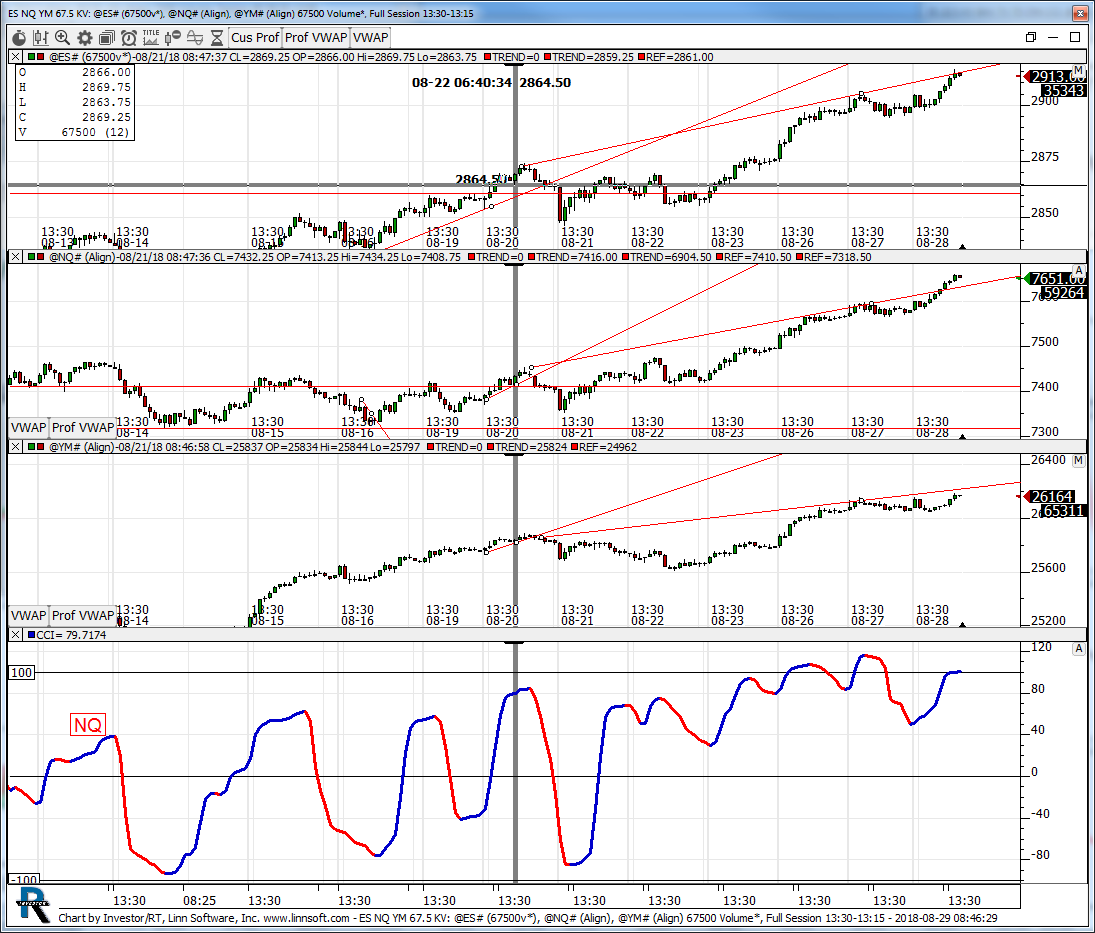 |
ES NQ YM 675 KV (@ES#) kencassorla [totalcount]
7 years 11 months ago
67.5 KV. This chart was uploaded by Investor/RT 13.3.5 showing symbol: @ES#. |
View |
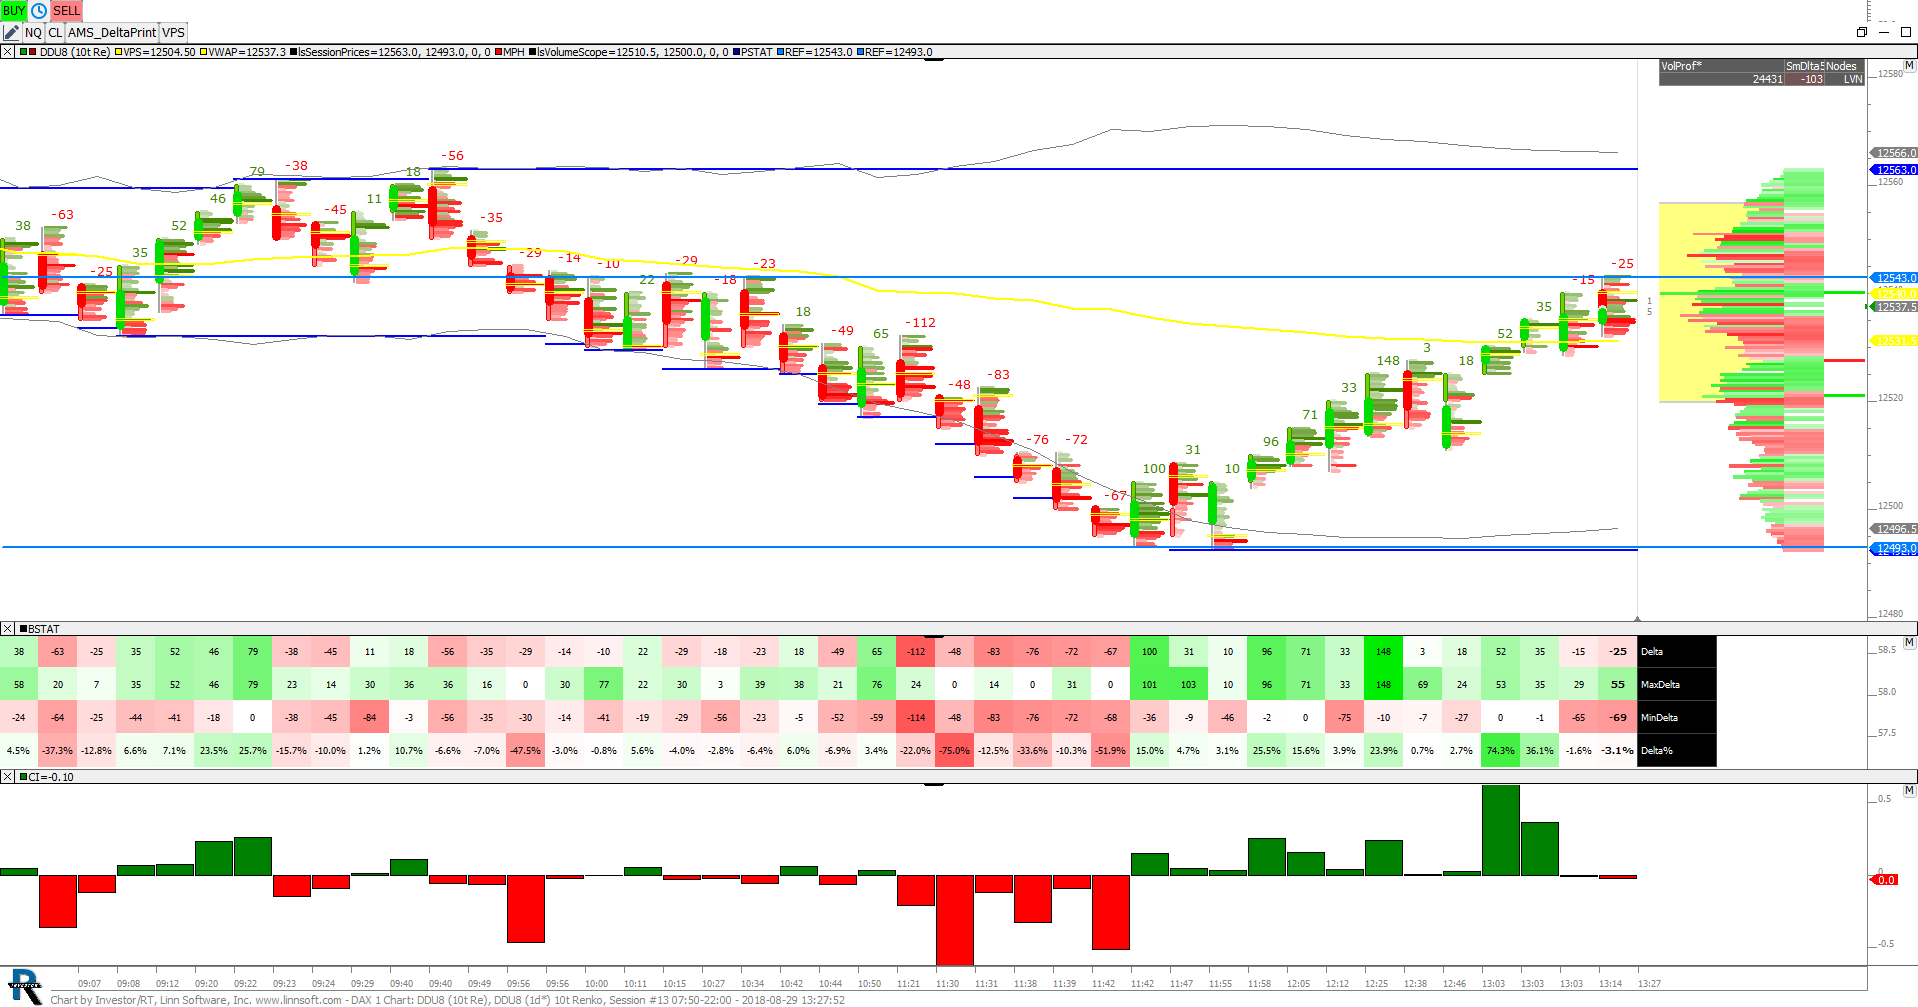 |
DAX 1 Chart (DDU8) Steve [totalcount]
7 years 11 months ago
This chart was uploaded by Investor/RT 13.5.4 showing symbol: DDU8. |
View |
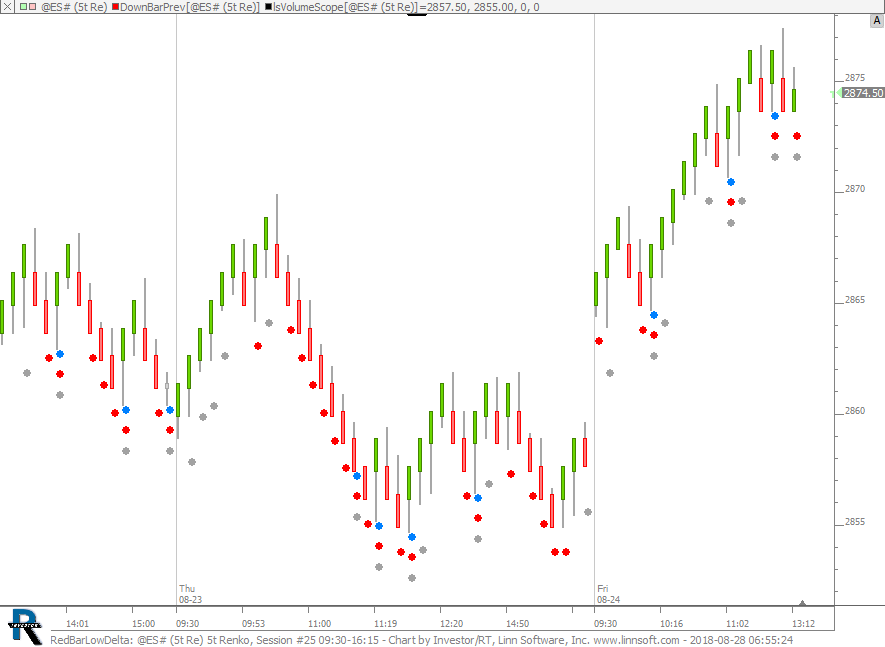 |
RedBarLowDelta (@ES#) cpayne [totalcount]
7 years 11 months ago
This chart was uploaded by Investor/RT 13.5.4 showing symbol: @ES#. |
View |
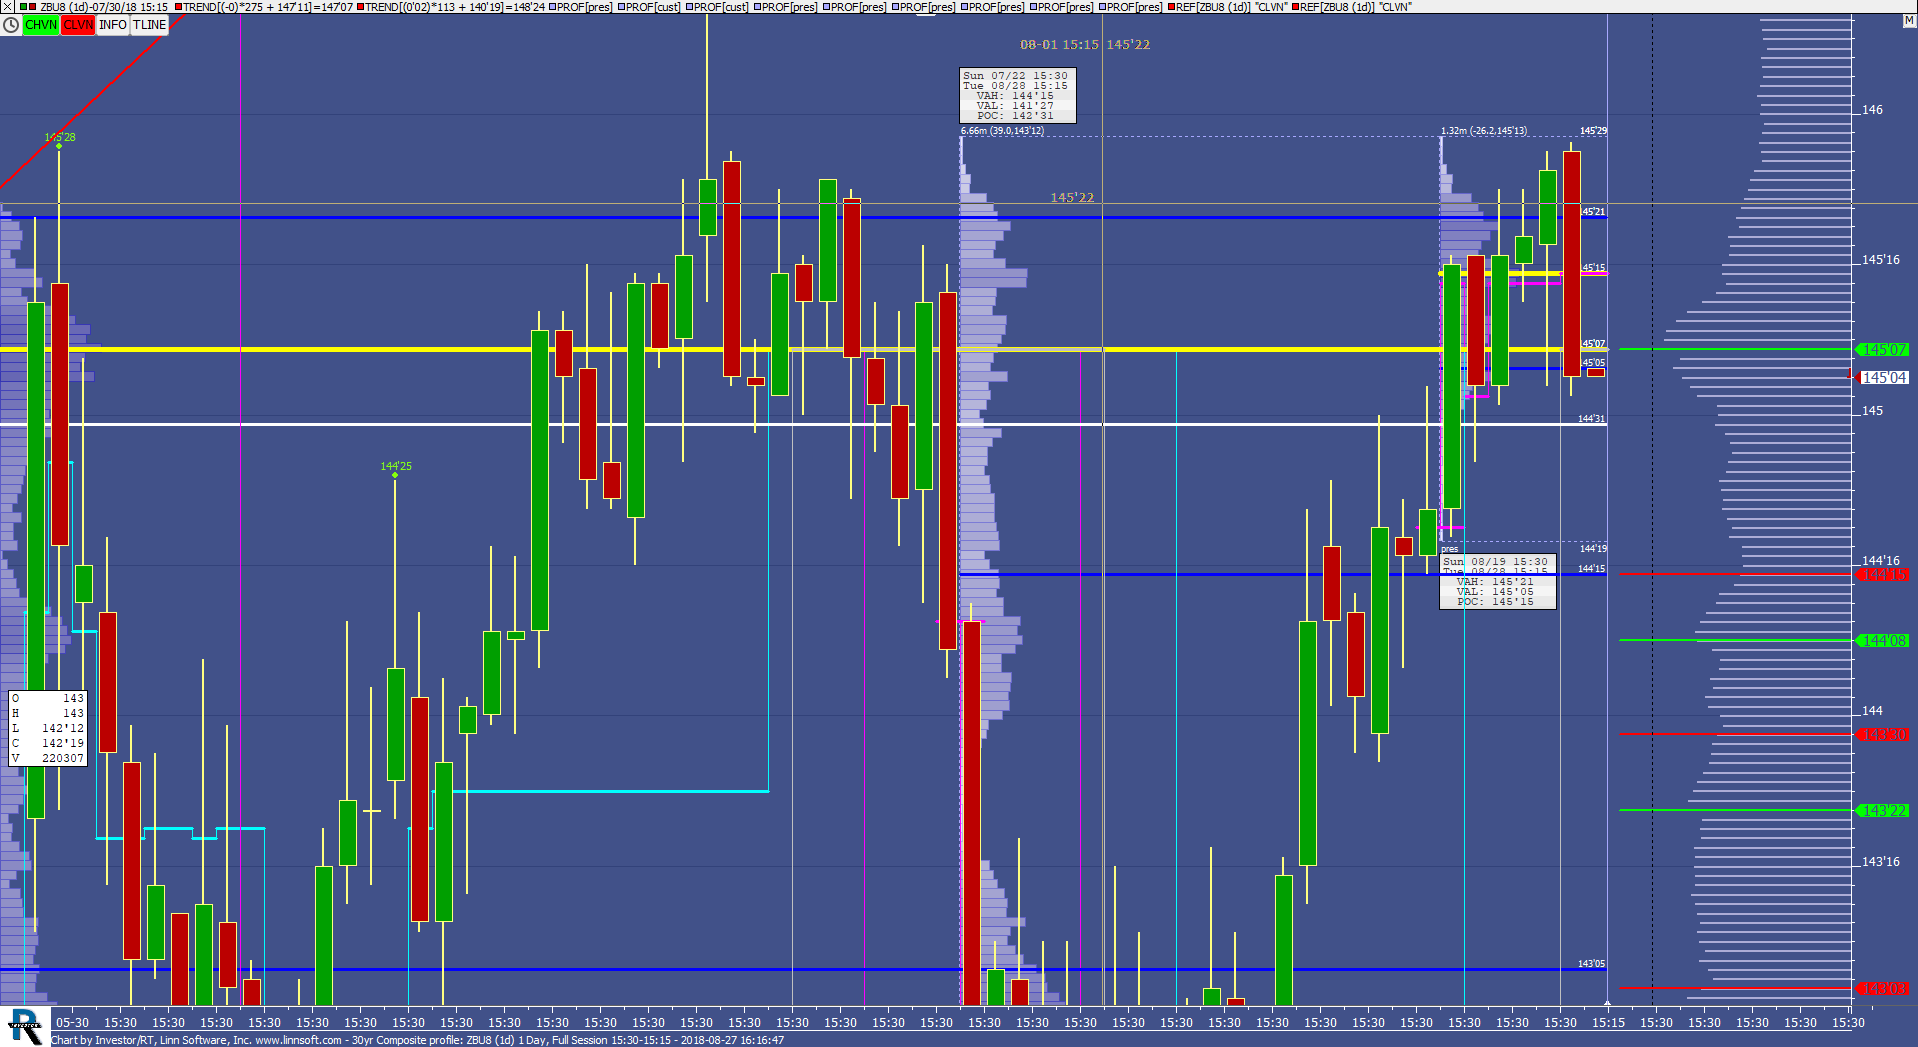 |
30yr Composite profile (ZBU8) scottz46 [totalcount]
7 years 11 months ago
This chart was uploaded by Investor/RT 13.3.3 showing symbol: ZBU8. |
View |
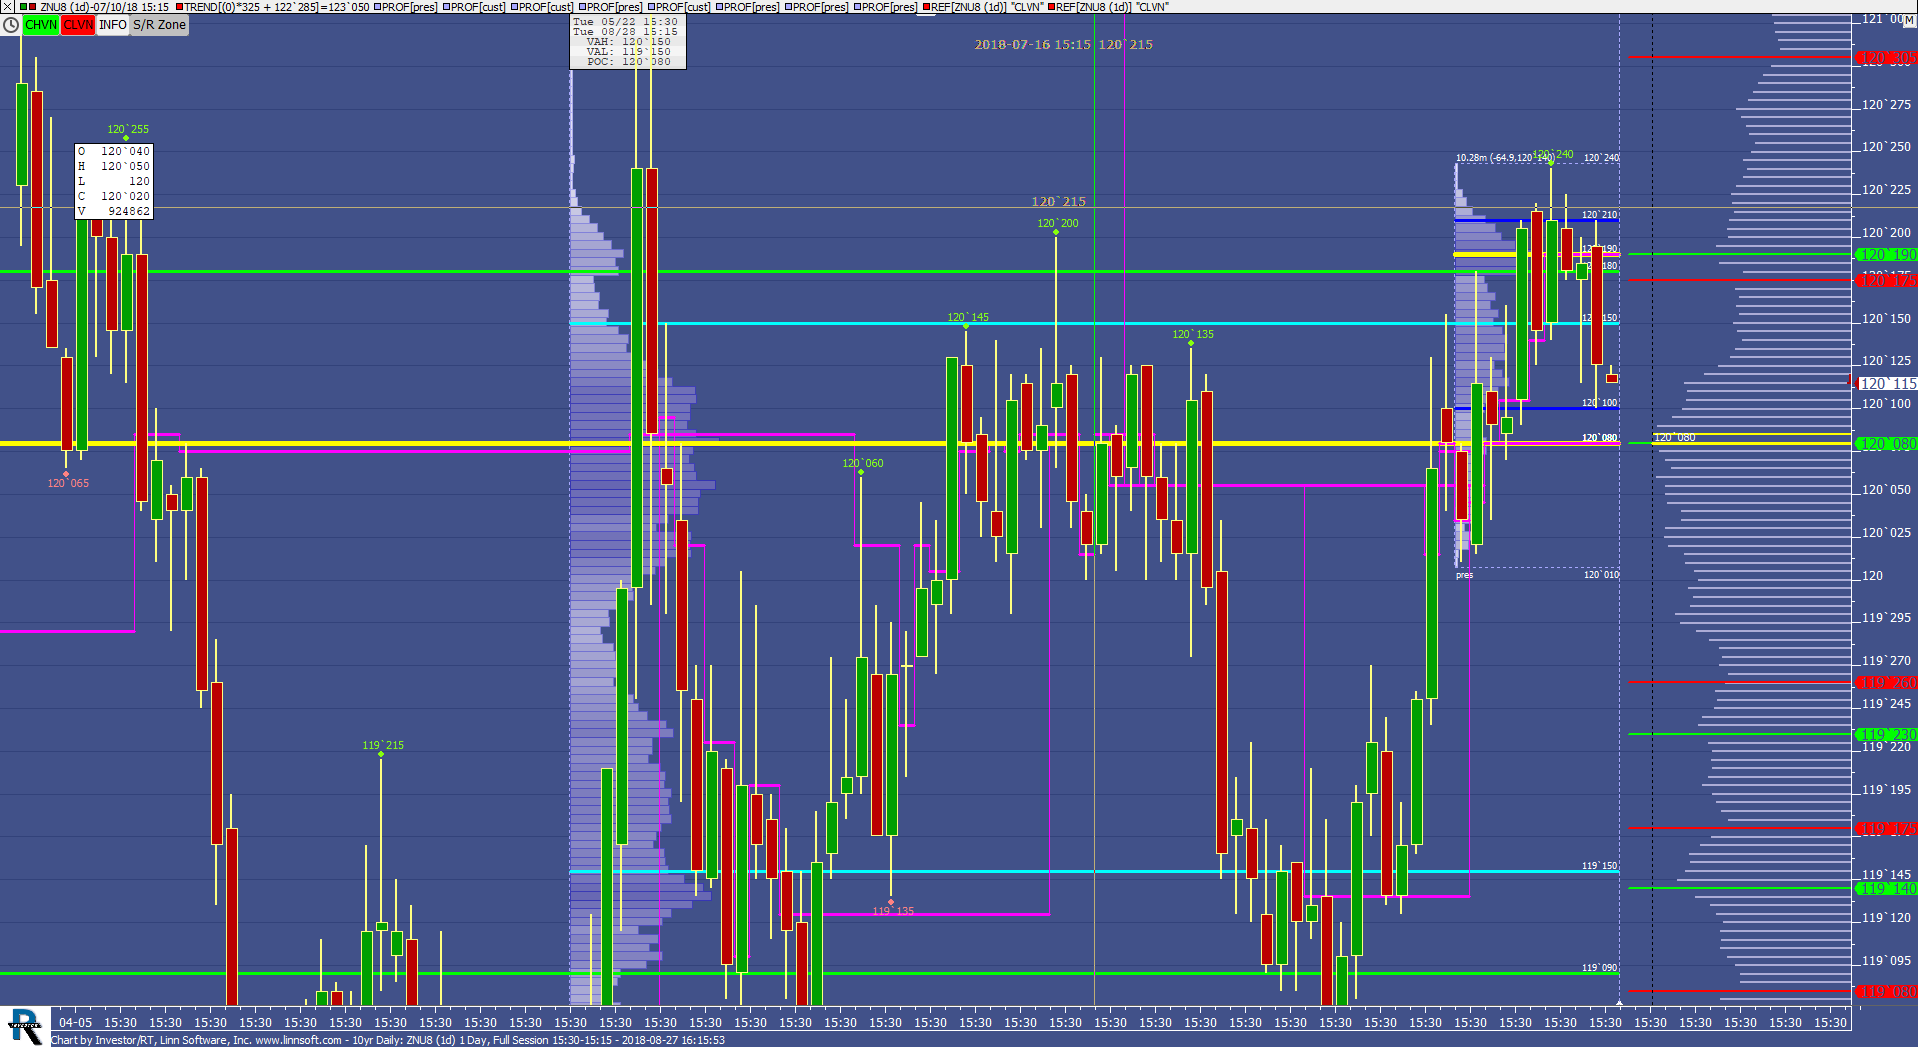 |
10yr Daily (ZNU8) scottz46 [totalcount]
7 years 11 months ago
This chart was uploaded by Investor/RT 13.3.3 showing symbol: ZNU8. |
View |
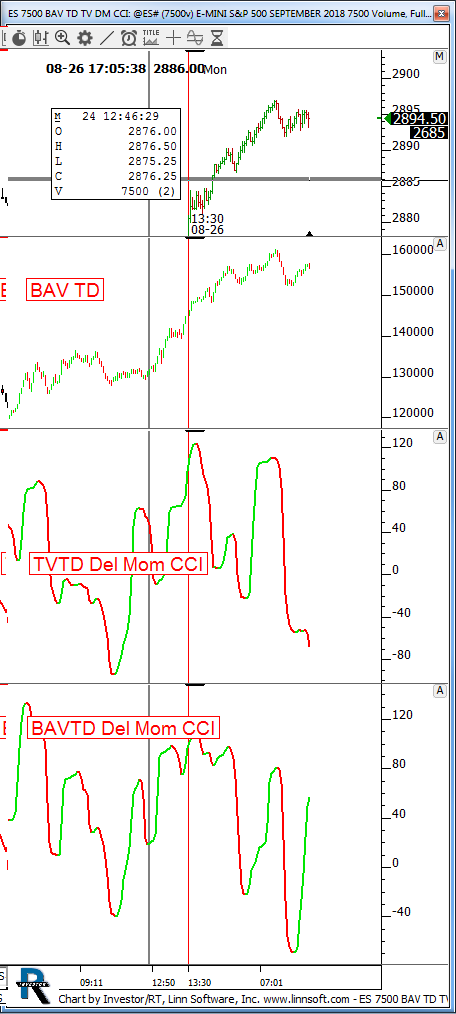 |
ES 7500 BAV TD TV DM CCI (@ES#) kencassorla [totalcount]
7 years 11 months ago
deltas. This chart was uploaded by Investor/RT 13.3.5 showing symbol: @ES#. |
View |