 |
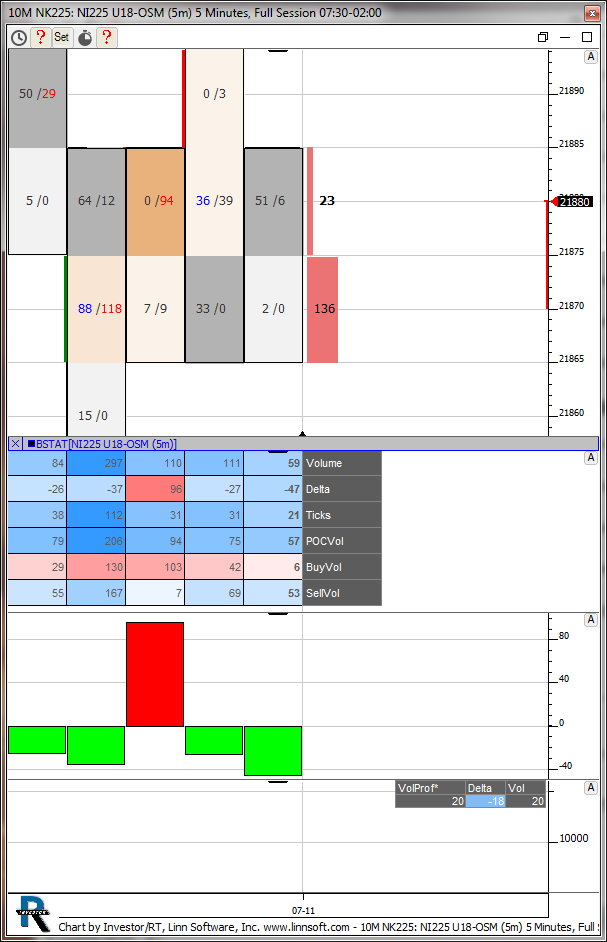
10M NK225 (NI225 U18-OSM) Hitoshi Kosaki [totalcount]
7 years 5 months ago
This chart was uploaded by Investor/RT 13.3.5 showing symbol: NI225 U18-OSM. |
View |
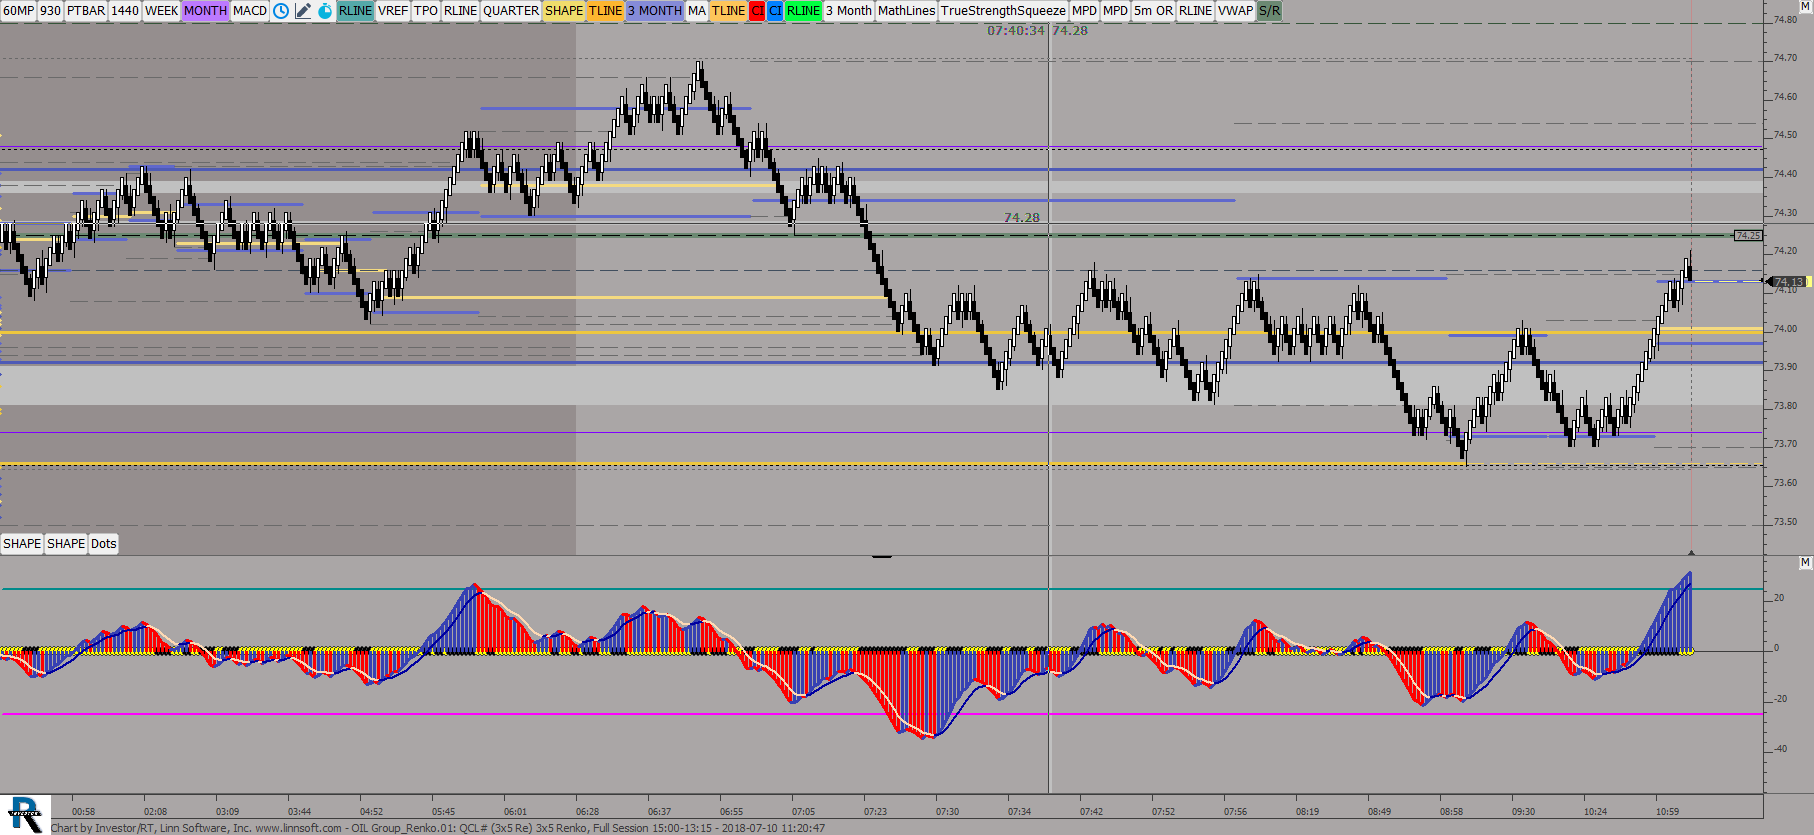 |
OIL Group Renko (QCL#) ES42 [totalcount]
7 years 5 months ago
This chart was uploaded by Investor/RT 13.3.5 showing symbol: QCL#. |
View |
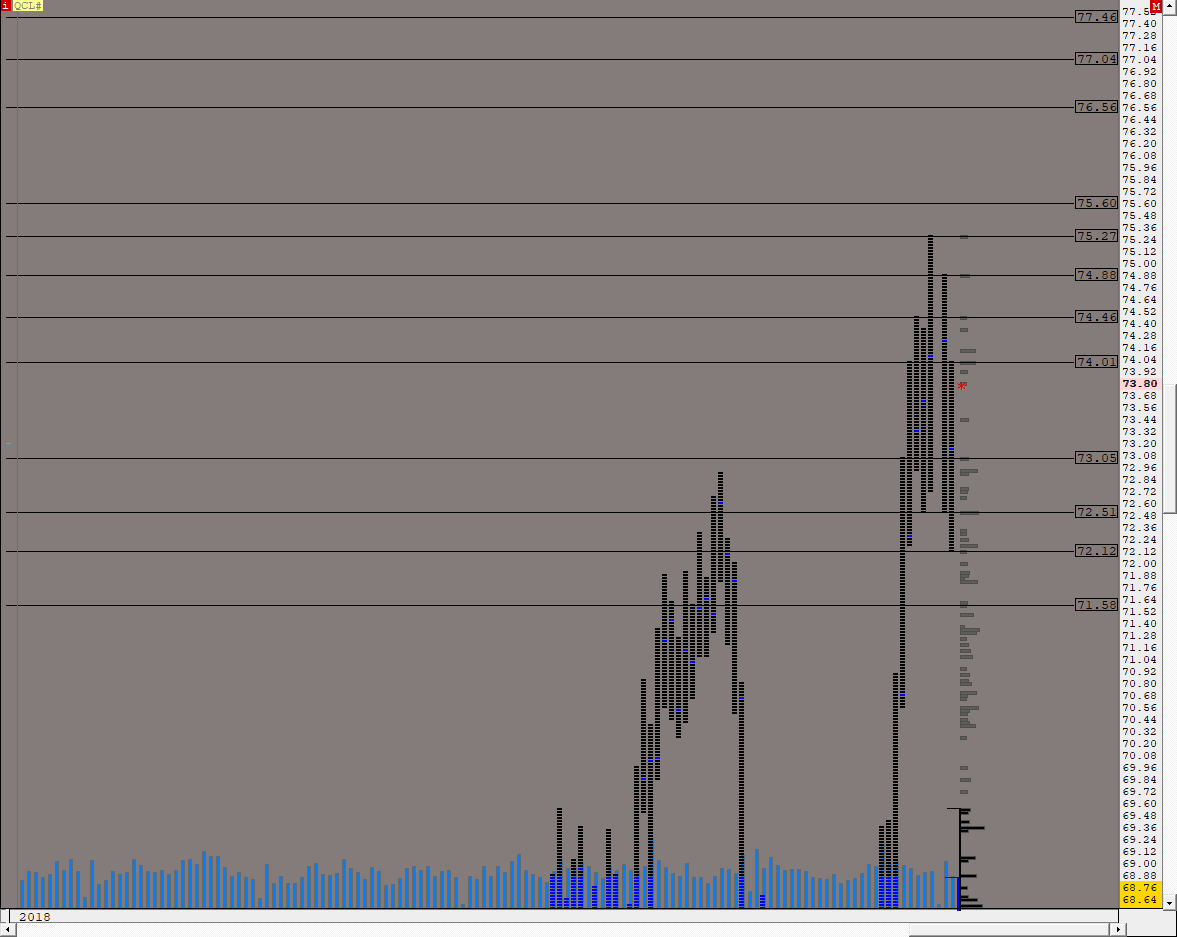 |
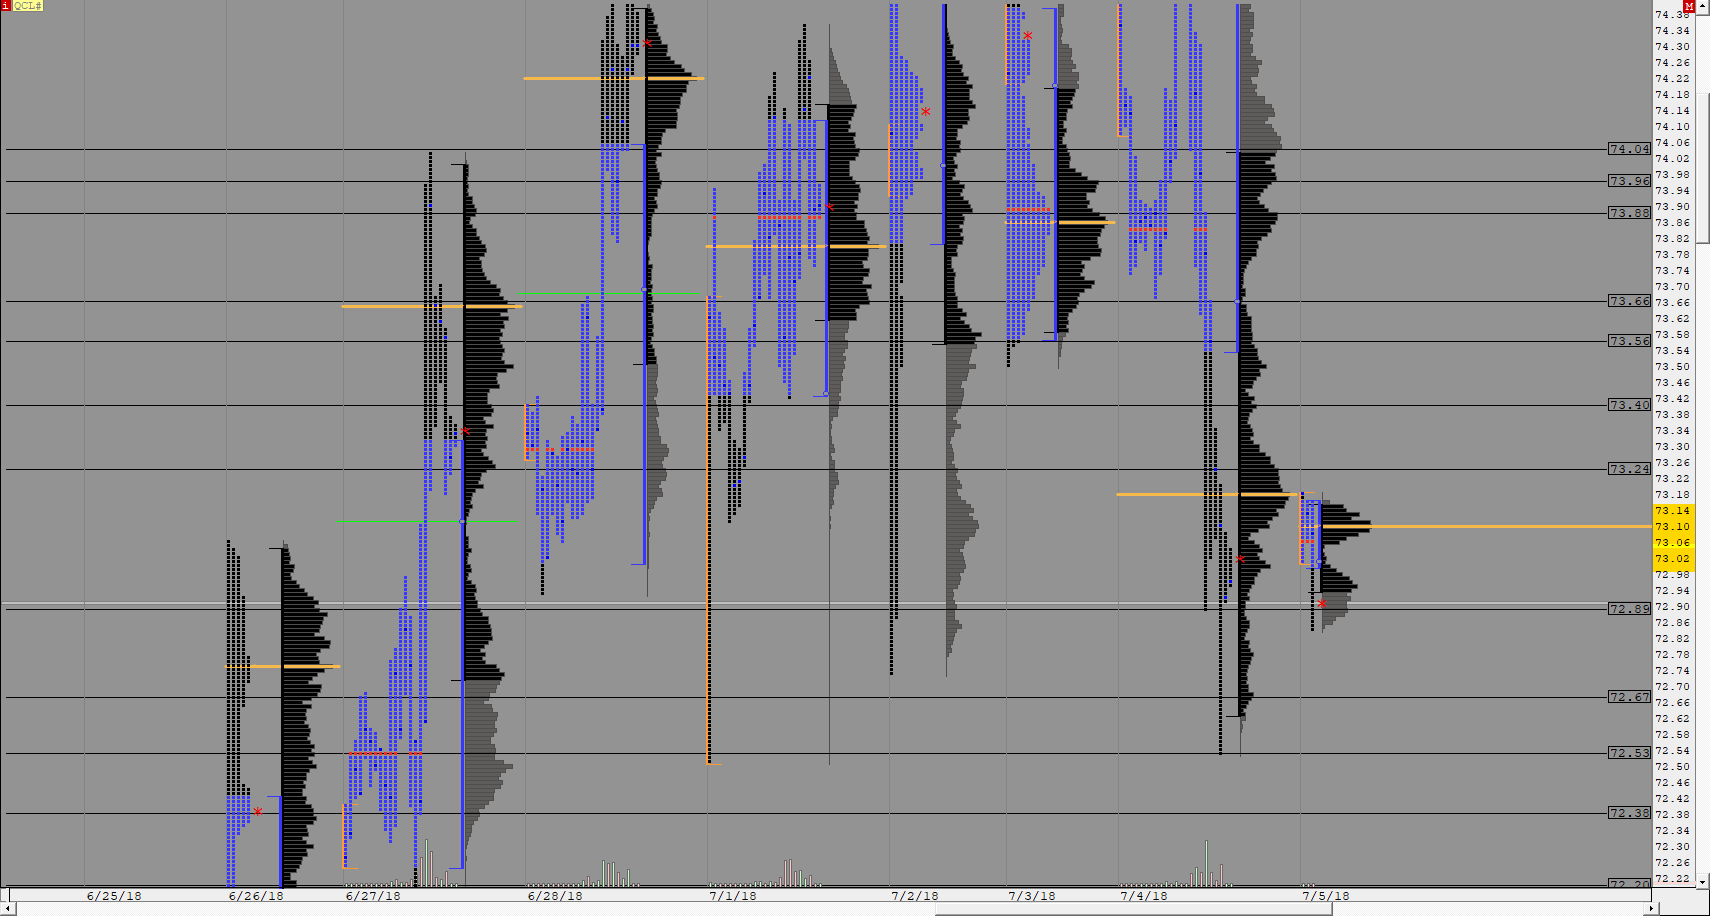
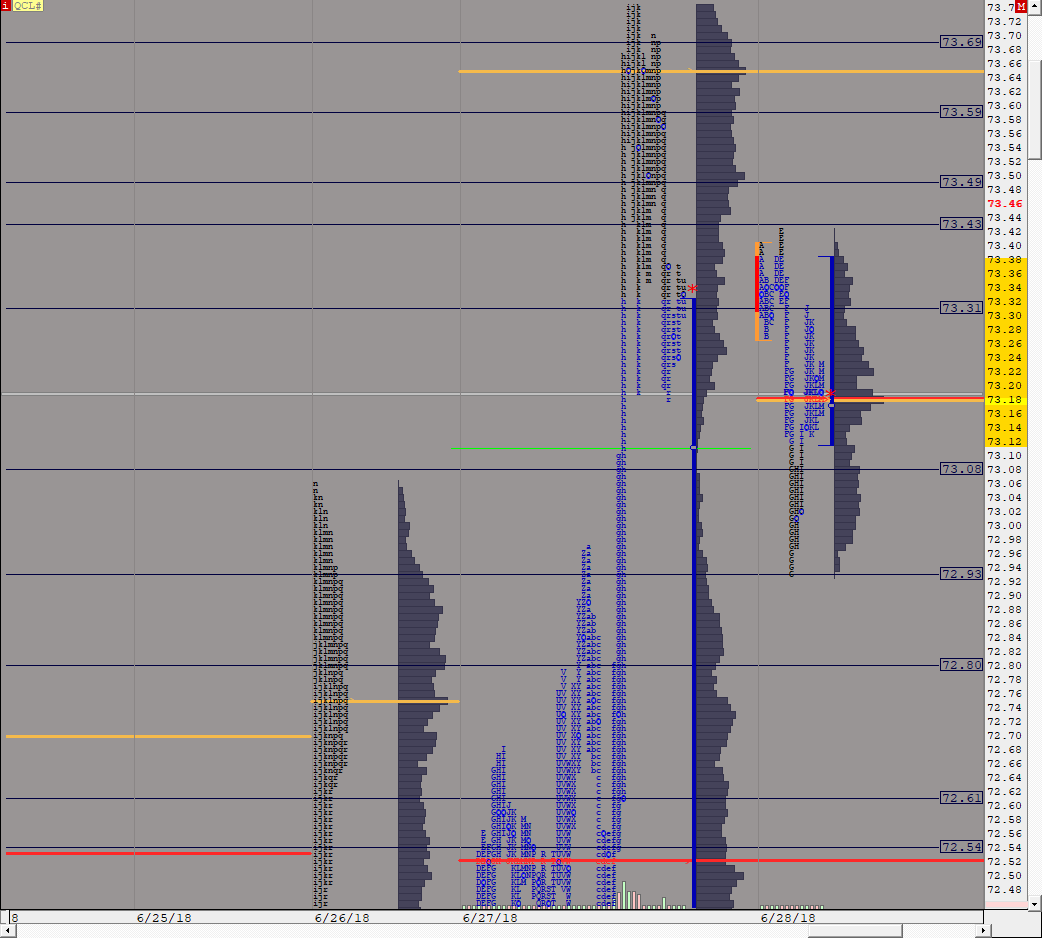
MP CL GLOBEX VALUE DAILY (QCL#) ES42 [totalcount]
7 years 5 months ago
This chart was uploaded by Investor/RT 13.3.5 showing symbol: QCL#. |
View |
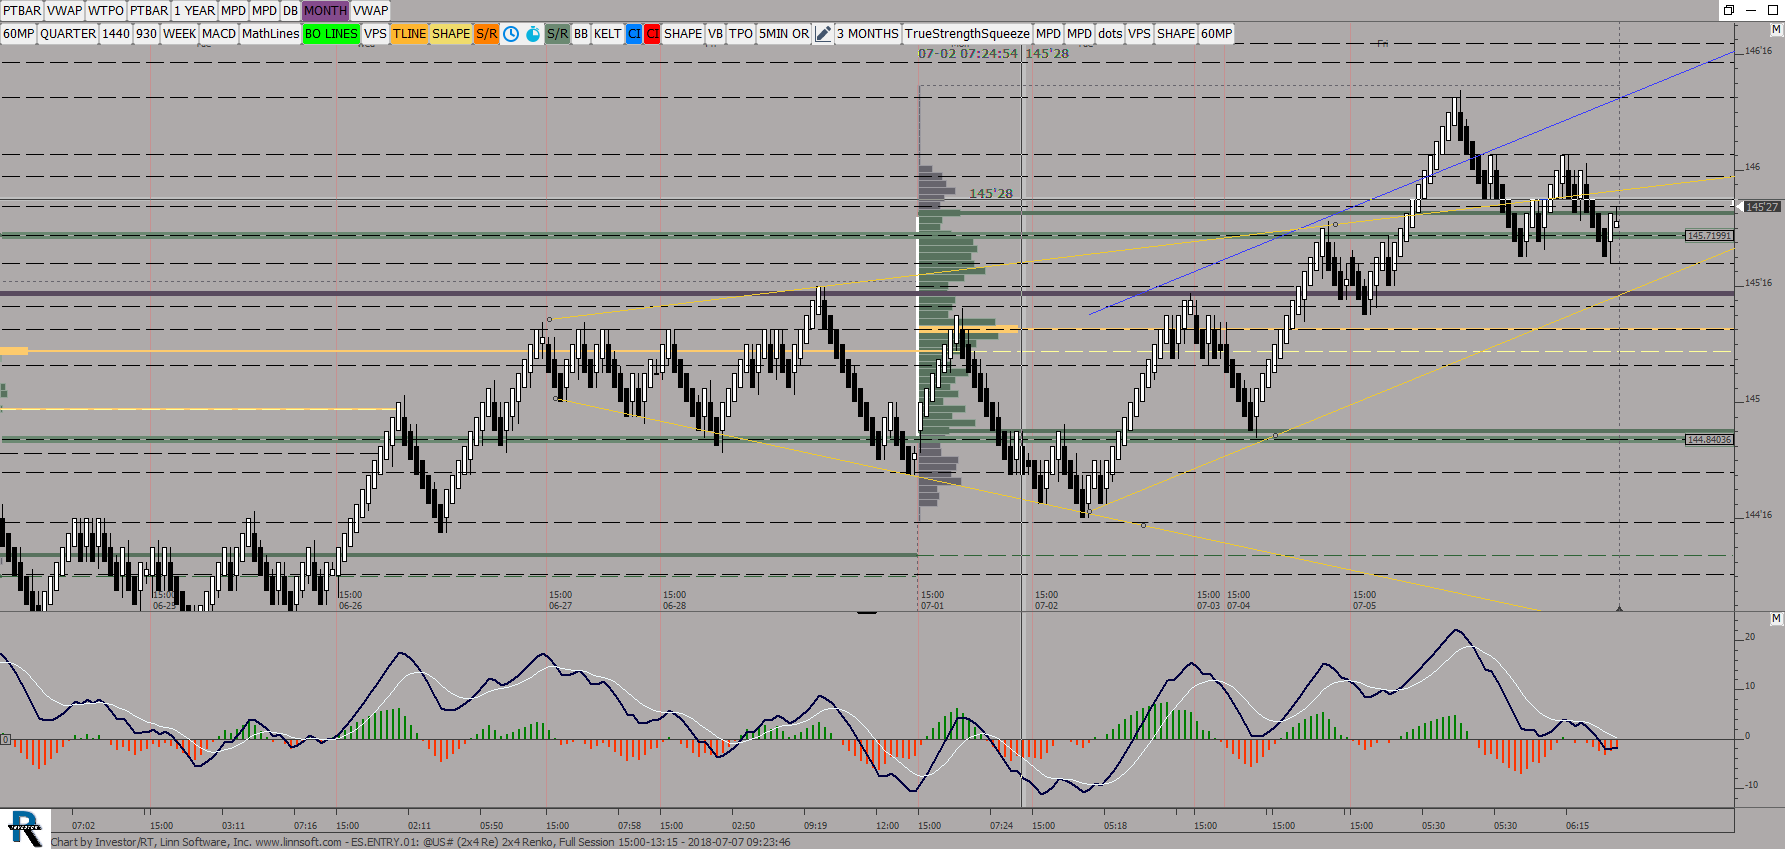 |
ESENTRY (@US#) ES42 [totalcount]
7 years 5 months ago
This chart was uploaded by Investor/RT 13.3.5 showing symbol: @US#. |
View |
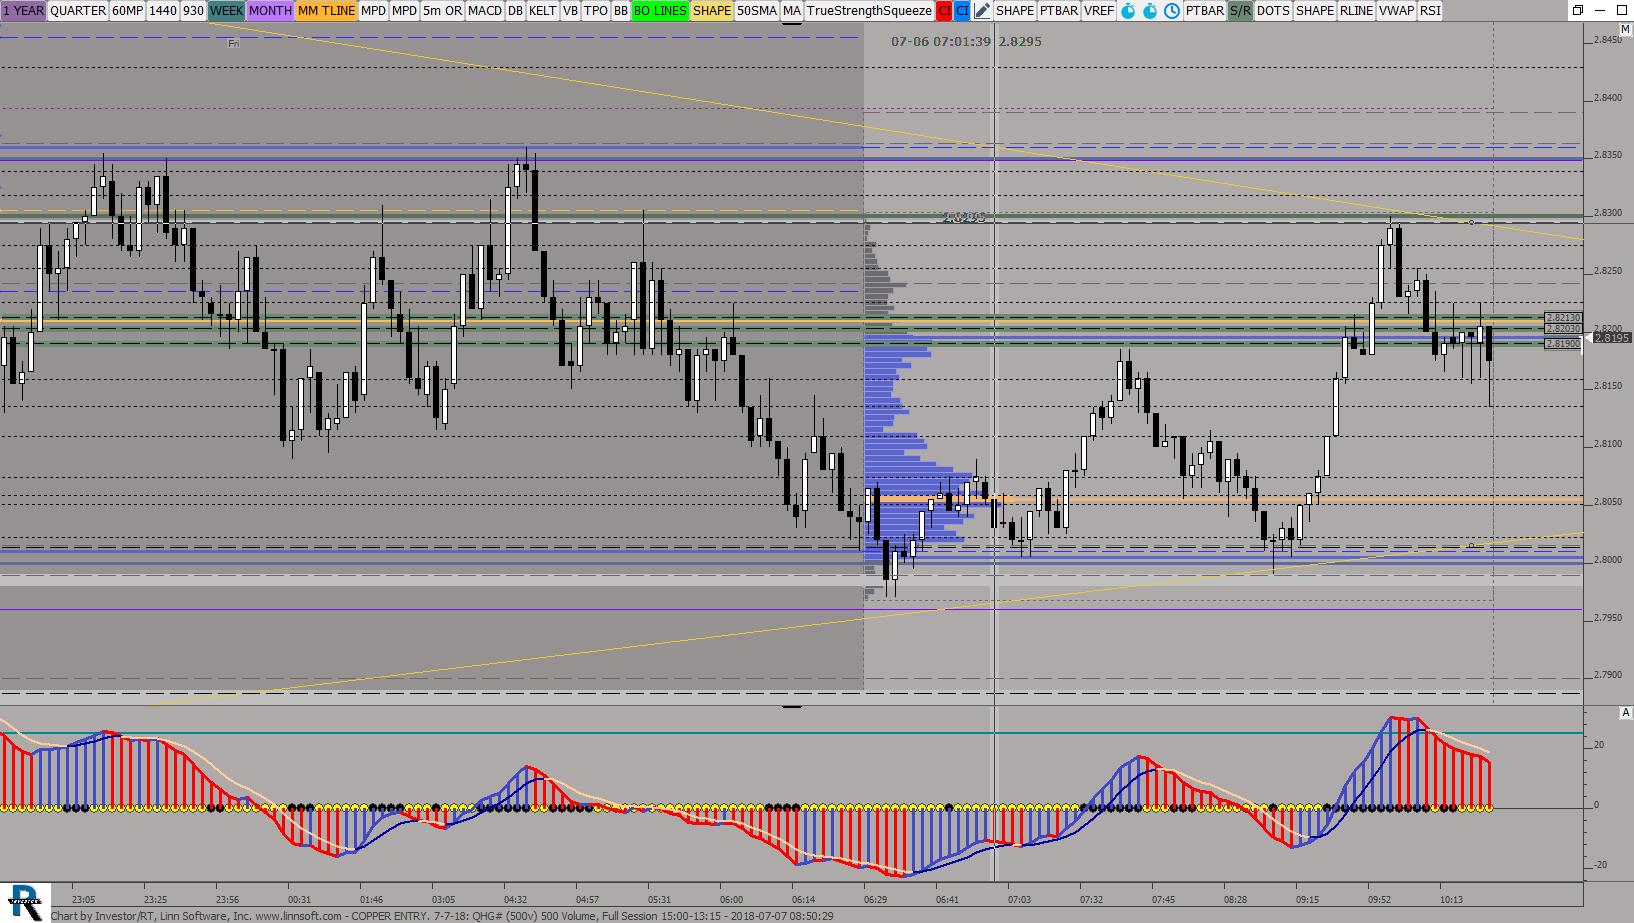 |
COPPER ENTRY 7 7 (QHG#) ES42 [totalcount]
7 years 5 months ago
This chart was uploaded by Investor/RT 13.3.5 showing symbol: QHG#. |
View |
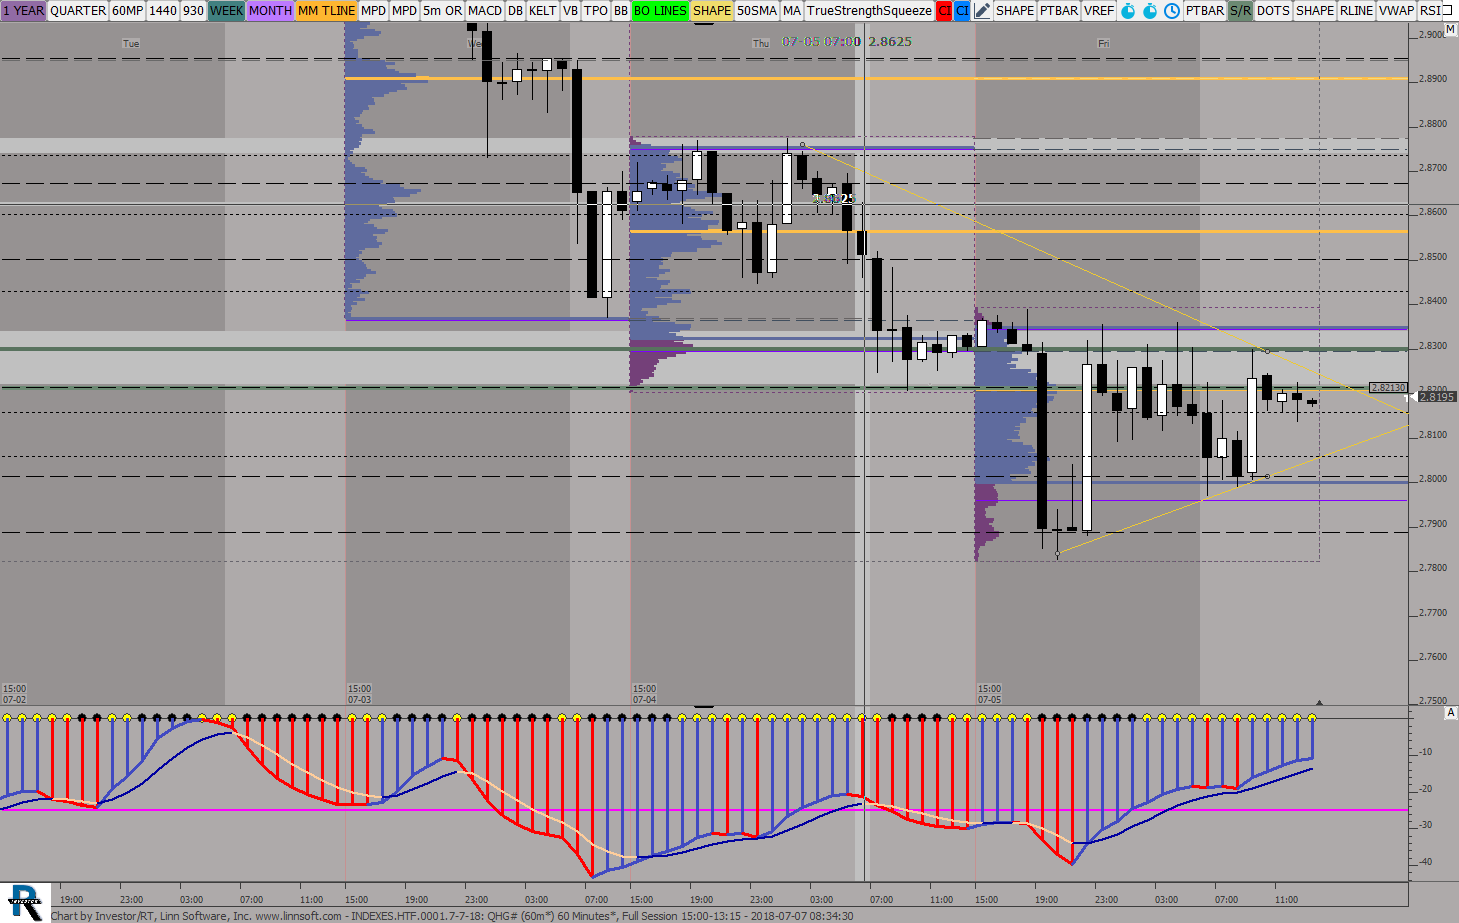 |
INDEXESHTF00017 7 (QHG#) ES42 [totalcount]
7 years 5 months ago
This chart was uploaded by Investor/RT 13.3.5 showing symbol: QHG#. |
View |
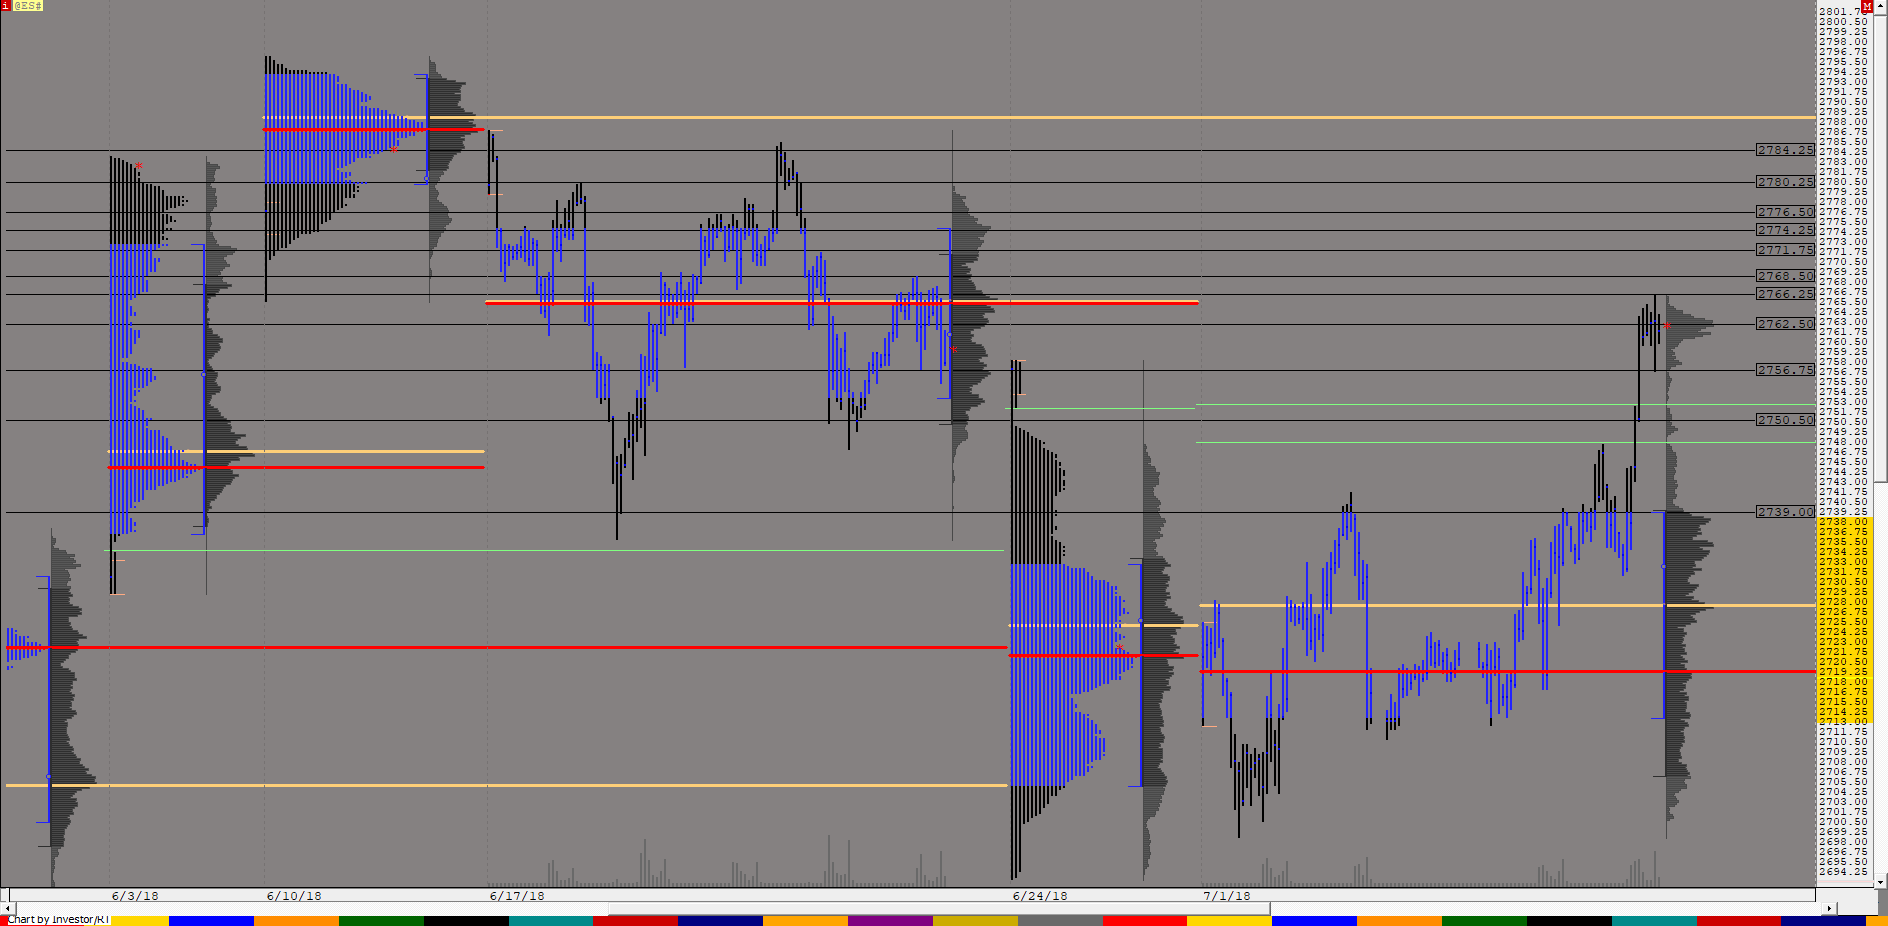 |
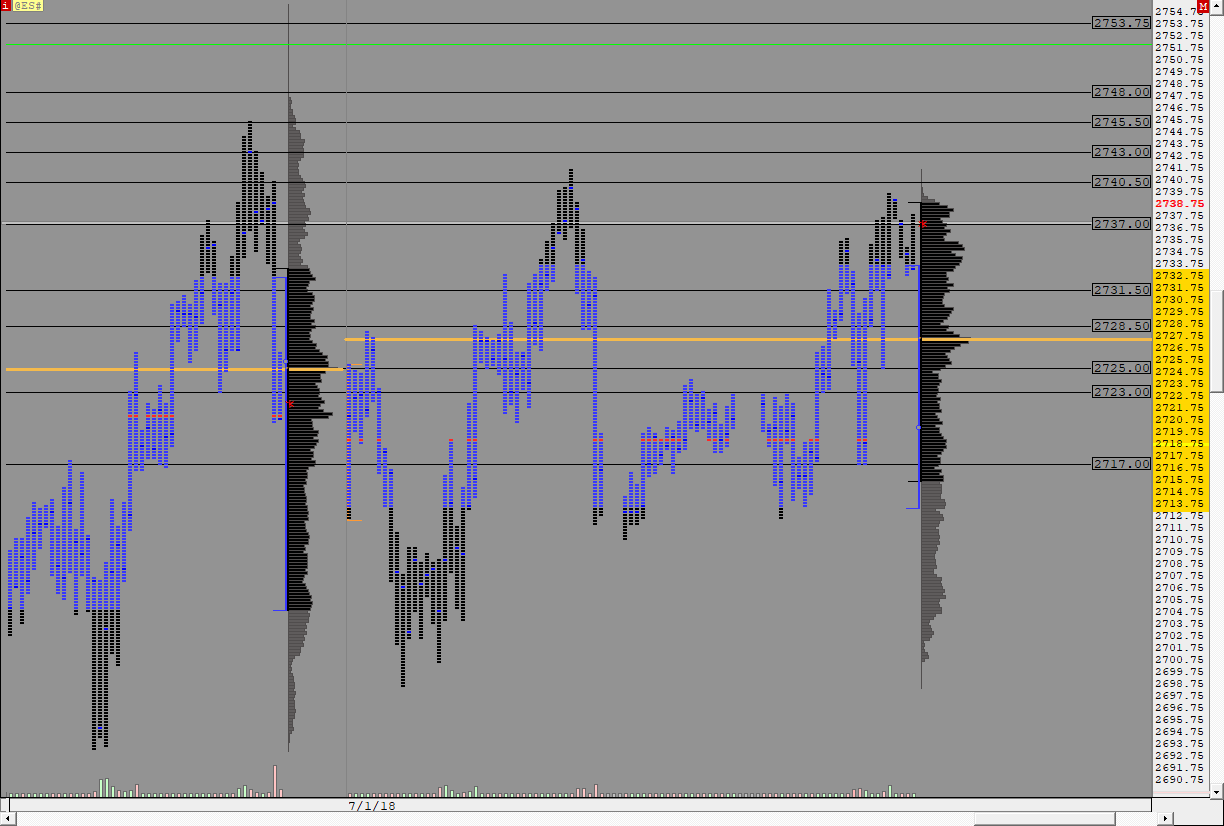
Market ProfileWEEKLYClass (@ES#) ES42 [totalcount]
7 years 5 months ago
This chart was uploaded by Investor/RT 13.3.5 showing symbol: @ES#. |
View |
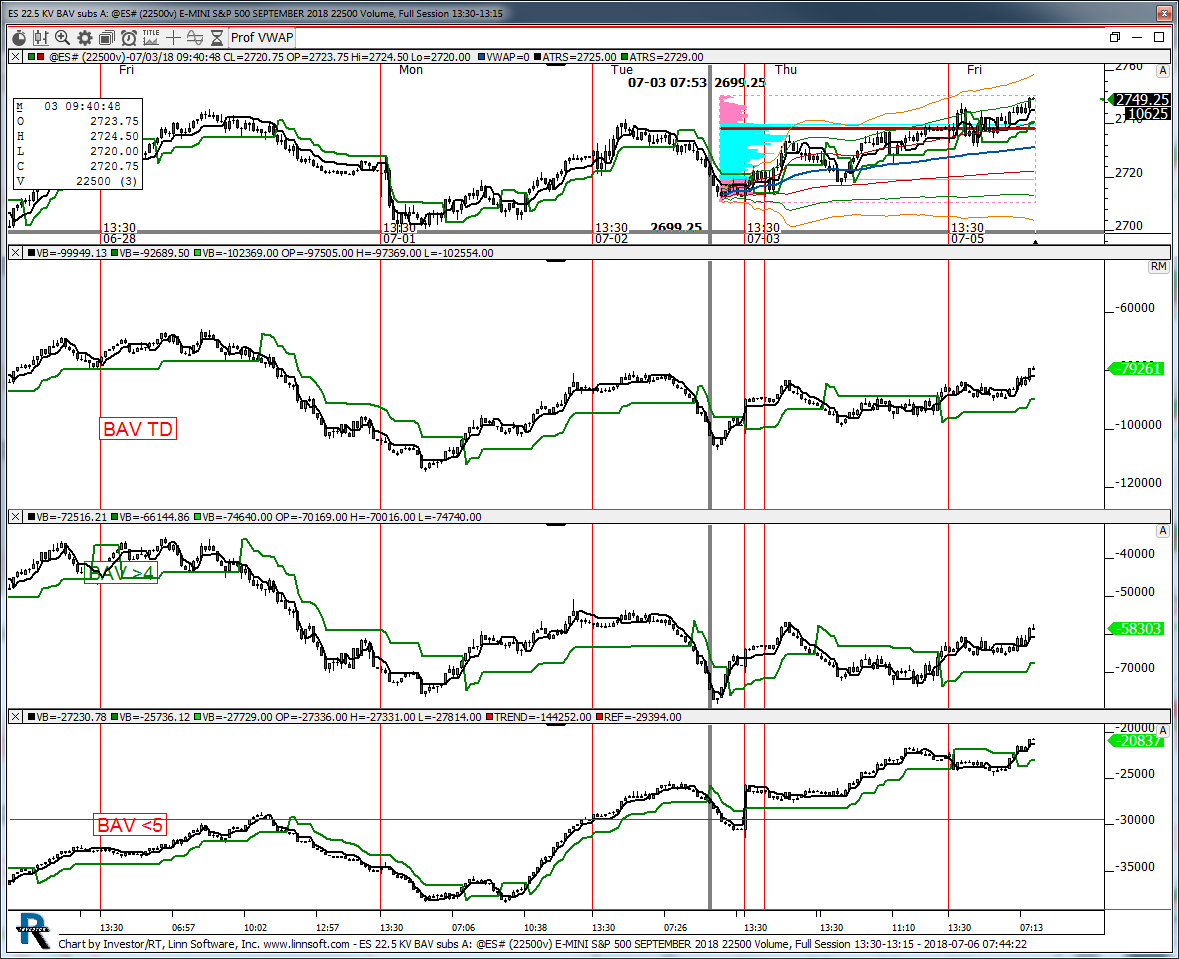 |
ES 225 KV BAV subs A (@ES#) kencassorla [totalcount]
7 years 5 months ago
22.5 kv. This chart was uploaded by Investor/RT 13.3.4 showing symbol: @ES#. |
View |
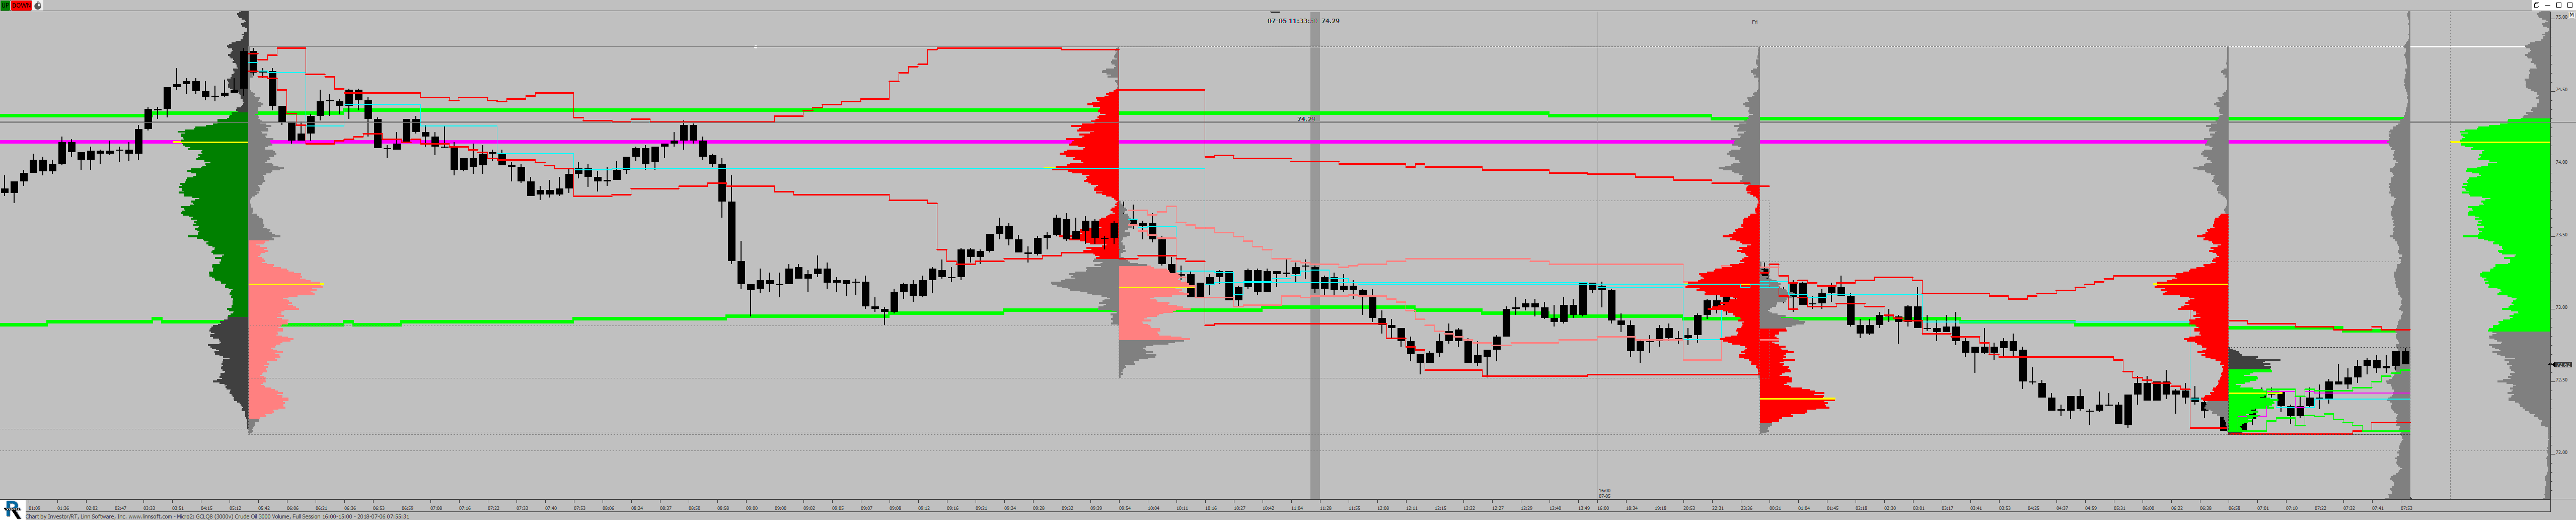 |
Micro2 (GCLQ8) jjpadg [totalcount]
7 years 5 months ago
This chart was uploaded by Investor/RT 13.3.5 showing symbol: GCLQ8. |
View |
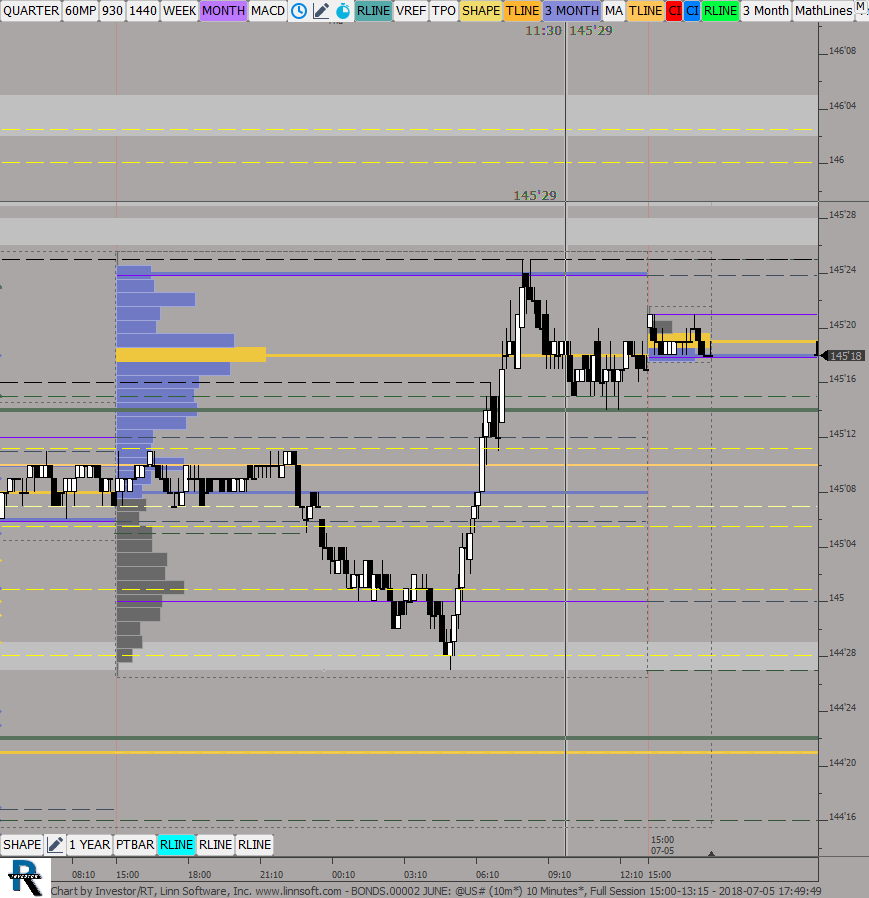 |
BONDS00002 JUNE (@US#) ES42 [totalcount]
7 years 5 months ago
This chart was uploaded by Investor/RT 13.3.4 showing symbol: @US#. |
View |
 |
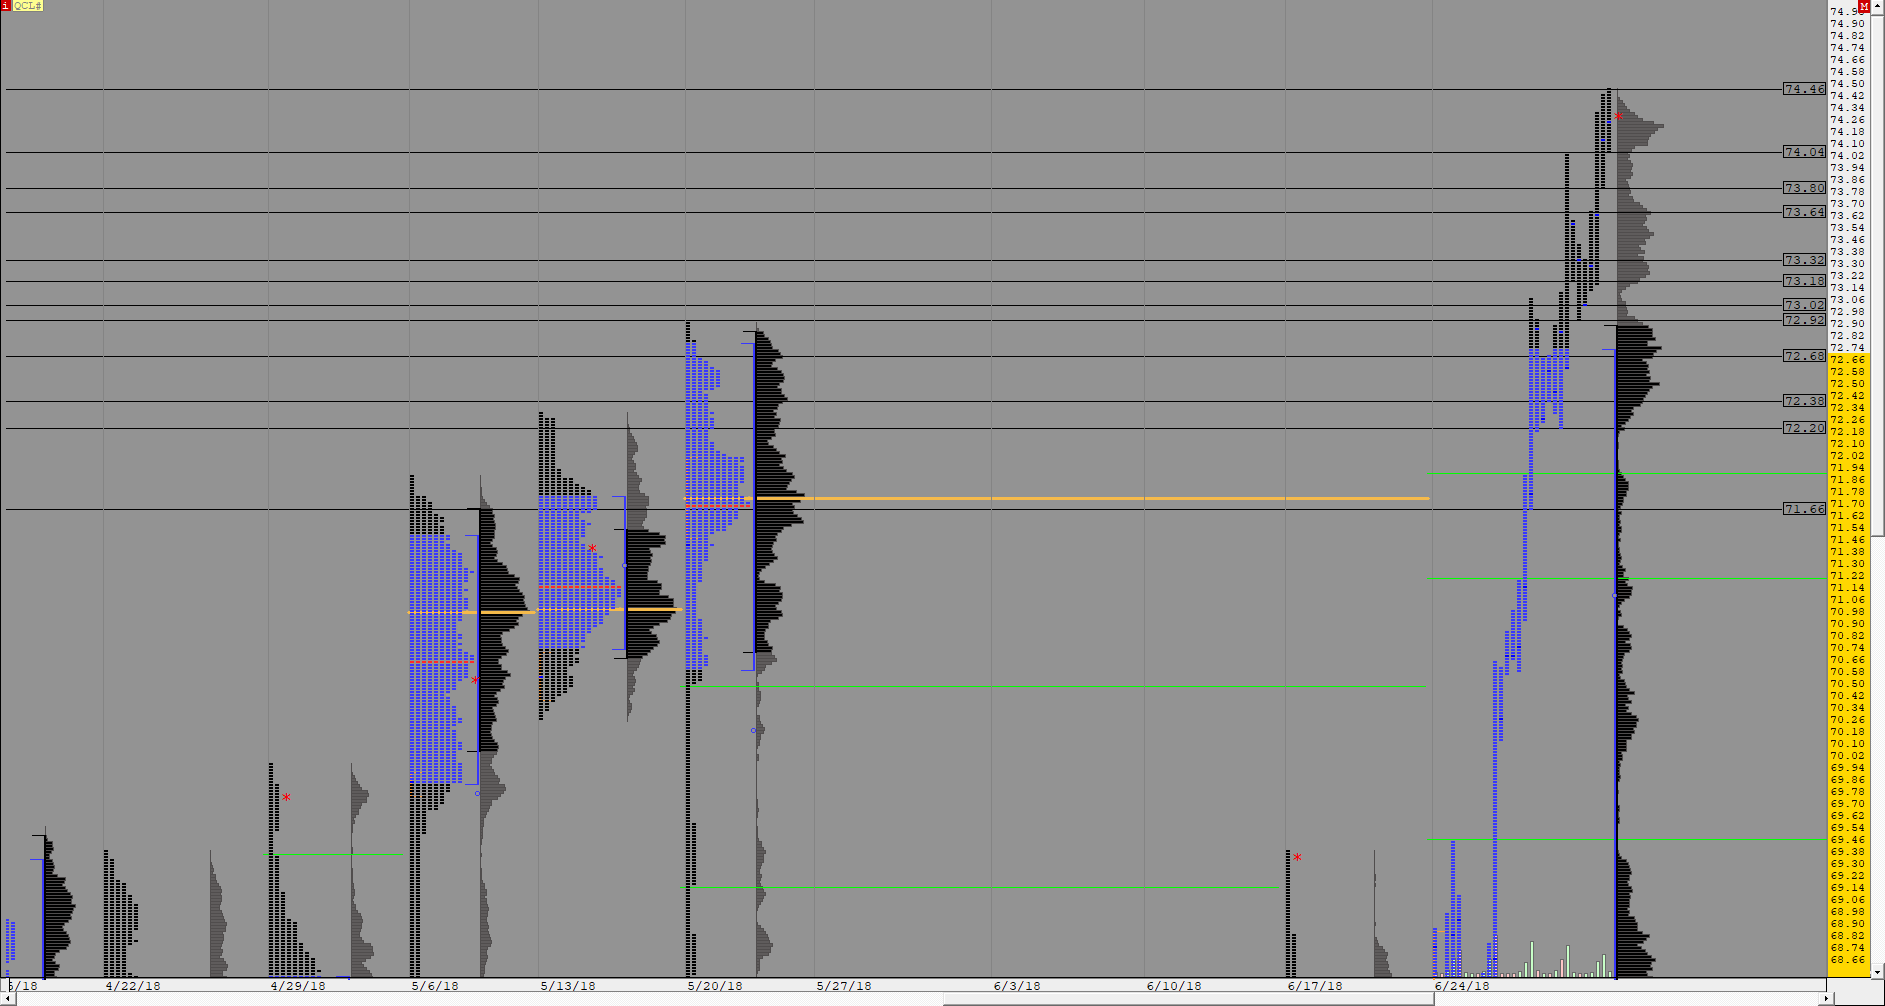
OIL Group01c (QCL#) ES42 [totalcount]
7 years 5 months ago
This chart was uploaded by Investor/RT 13.3.5 showing symbol: QCL#. |
View |
 |
ES Group01d (@ES#) ES42 [totalcount]
7 years 5 months ago
This chart was uploaded by Investor/RT 13.3.5 showing symbol: @ES#. |
View |
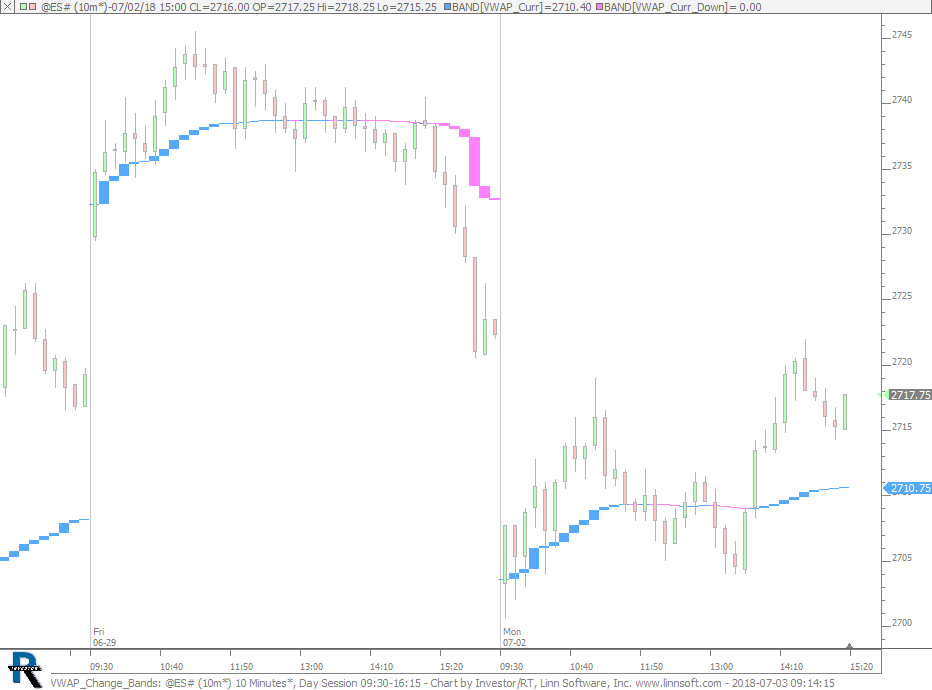 |
VWAP Change Bands (@ES#) cpayne [totalcount]
7 years 5 months ago
VWAP Change Bands. This chart was uploaded by Investor/RT 13.3.5 showing symbol: @ES#. |
View |
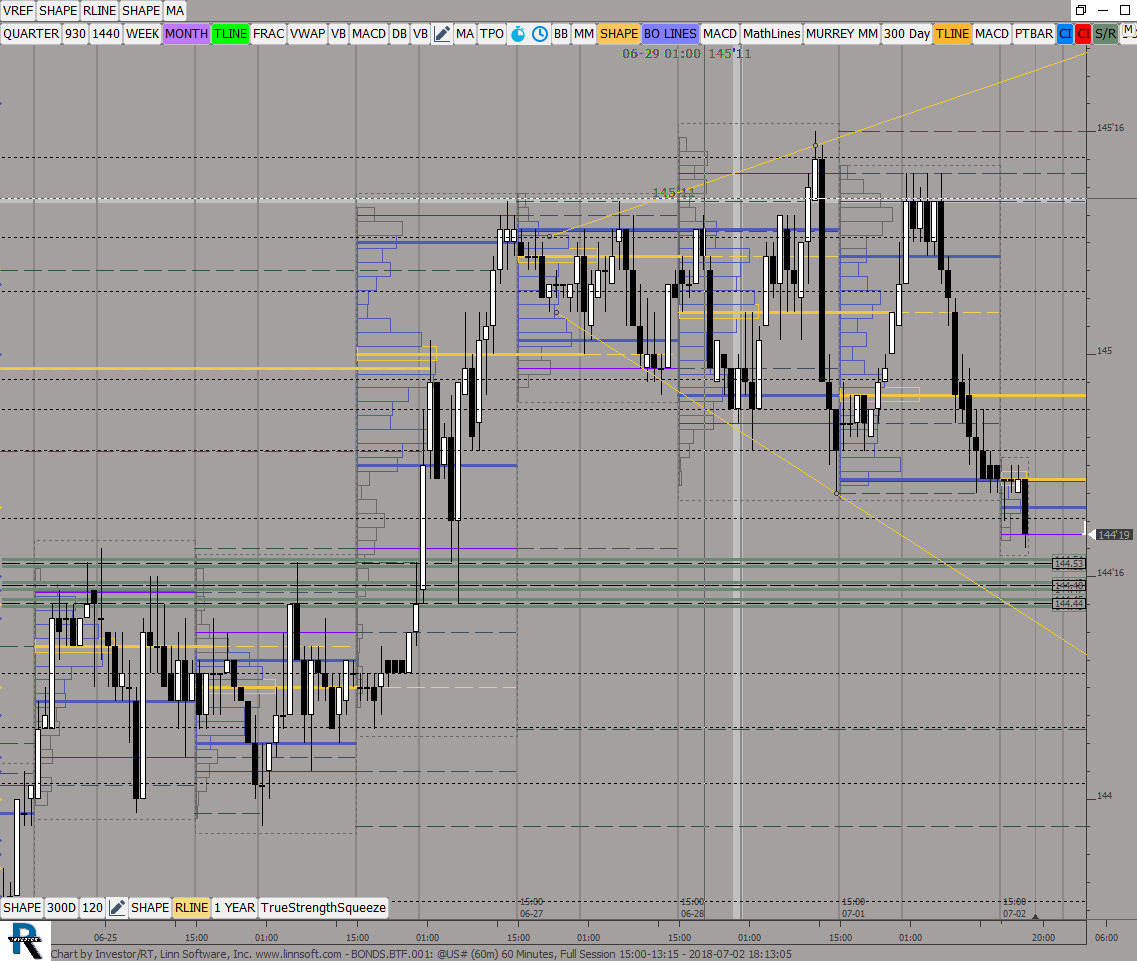 |
BONDSBTF (@US#) ES42 [totalcount]
7 years 5 months ago
This chart was uploaded by Investor/RT 13.3.5 showing symbol: @US#. |
View |
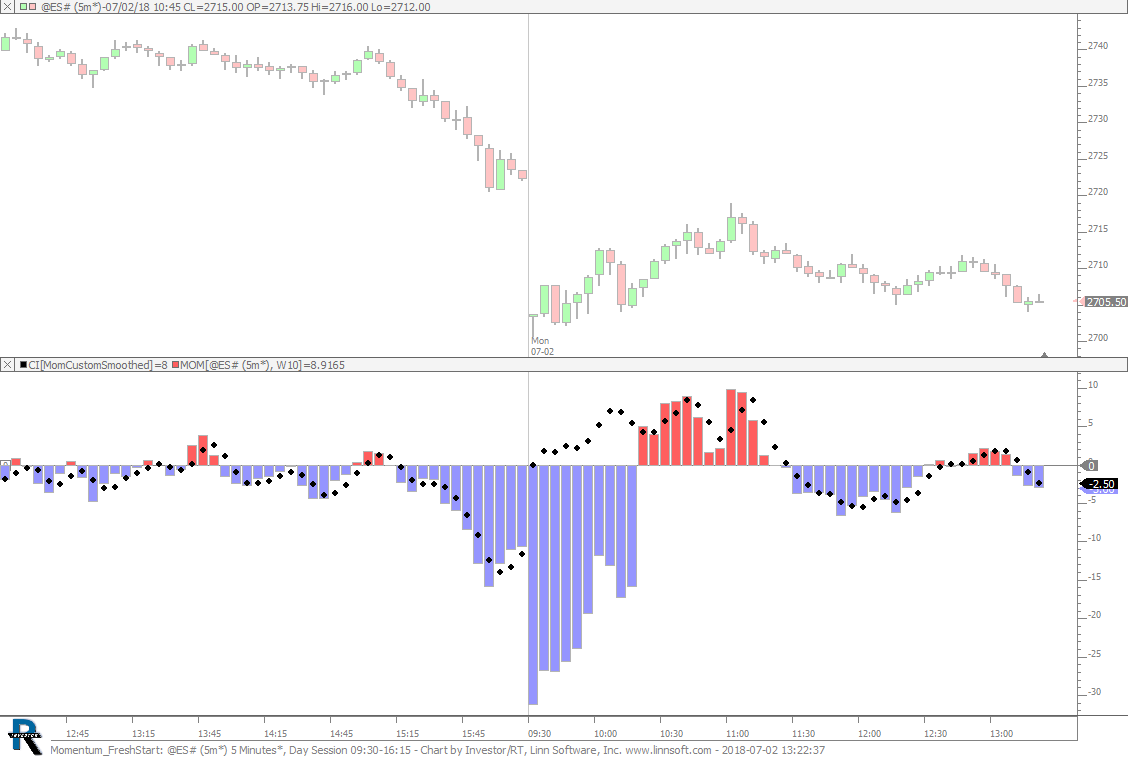 |
Momentum FreshStart (@ES#) cpayne [totalcount]
7 years 5 months ago
Momentum with Fresh Start. This chart was uploaded by Investor/RT 13.3.5 showing symbol: @ES#. |
View |
 |
OILMP (QCL#) ES42 [totalcount]
7 years 5 months ago
This chart was uploaded by Investor/RT 13.3.5 showing symbol: QCL#. |
View |
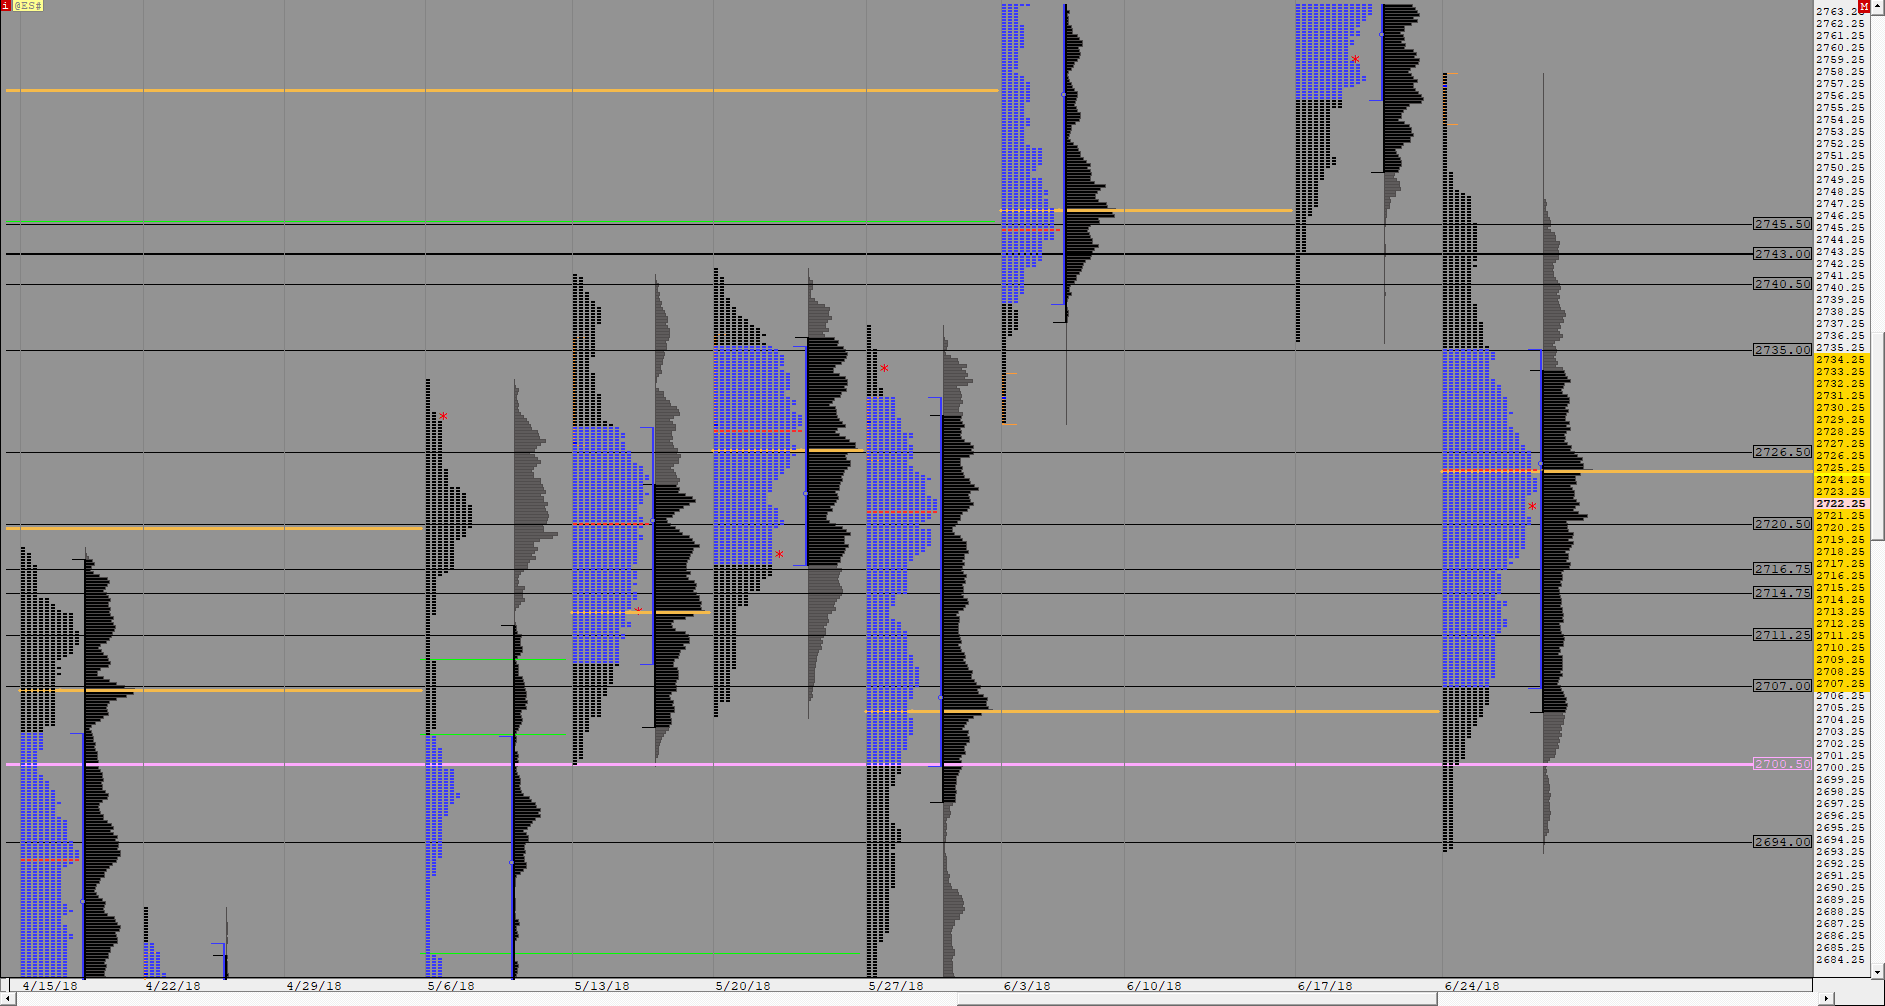 |
MP GLOBEX WEEKLY VALUE (@ES#) ES42 [totalcount]
7 years 5 months ago
This chart was uploaded by Investor/RT 13.3.3 showing symbol: @ES#. |
View |
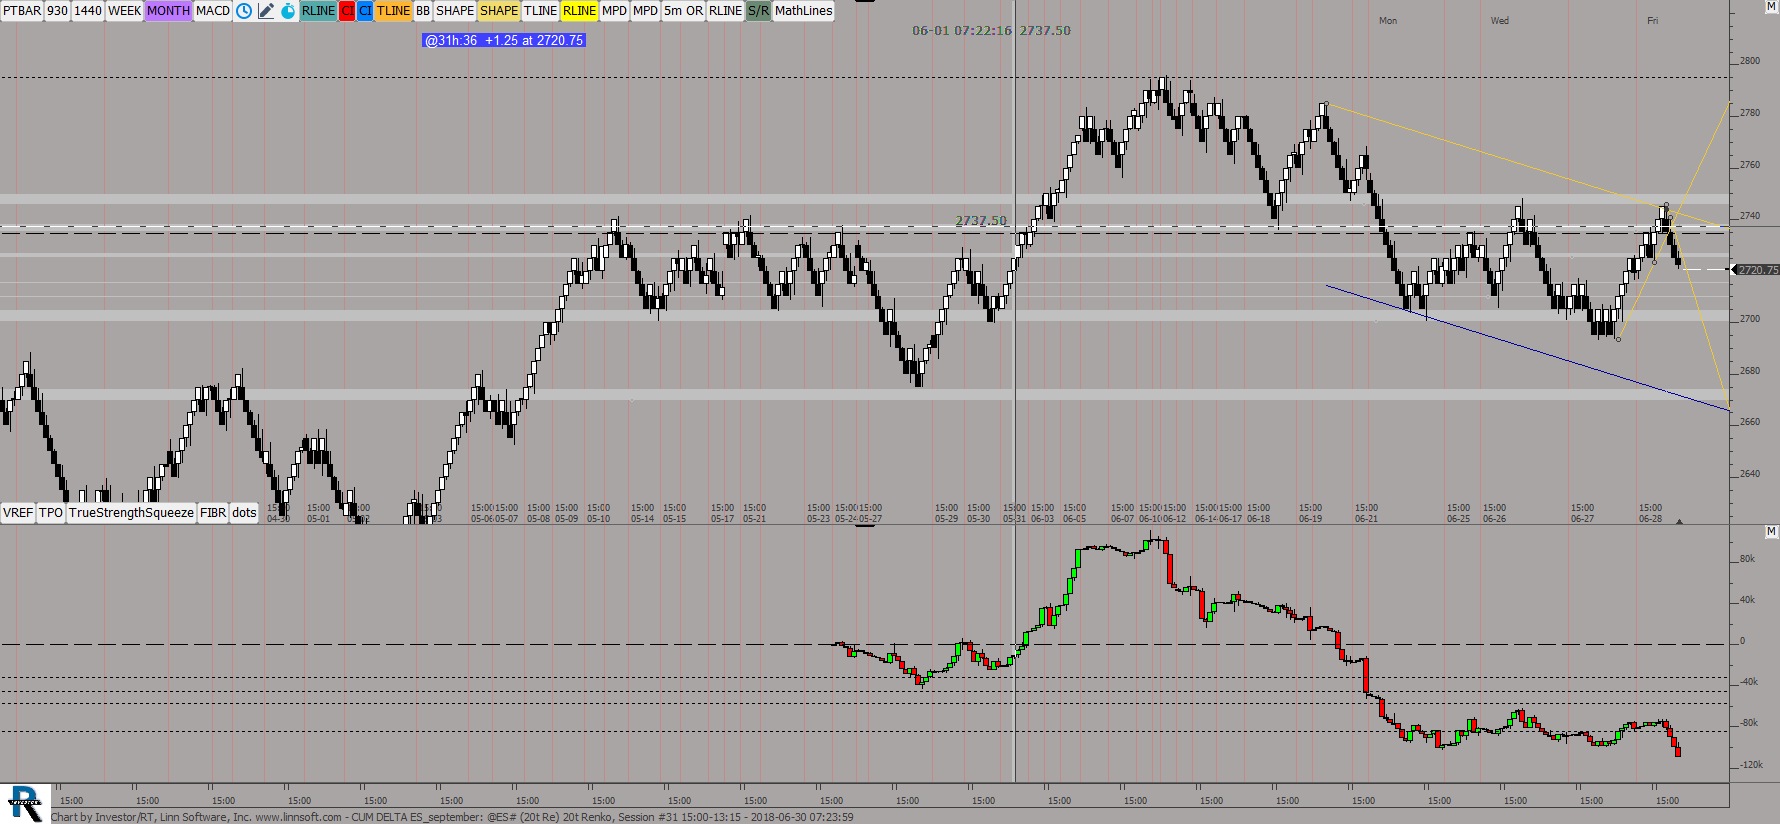 |
CUM DELTA ES september (@ES#) ES42 [totalcount]
7 years 5 months ago
This chart was uploaded by Investor/RT 13.3.5 showing symbol: @ES#. |
View |
 |
OIL Layout001c (QCL#) ES42 [totalcount]
7 years 5 months ago
This chart was uploaded by Investor/RT 13.3.3 showing symbol: QCL#. |
View |
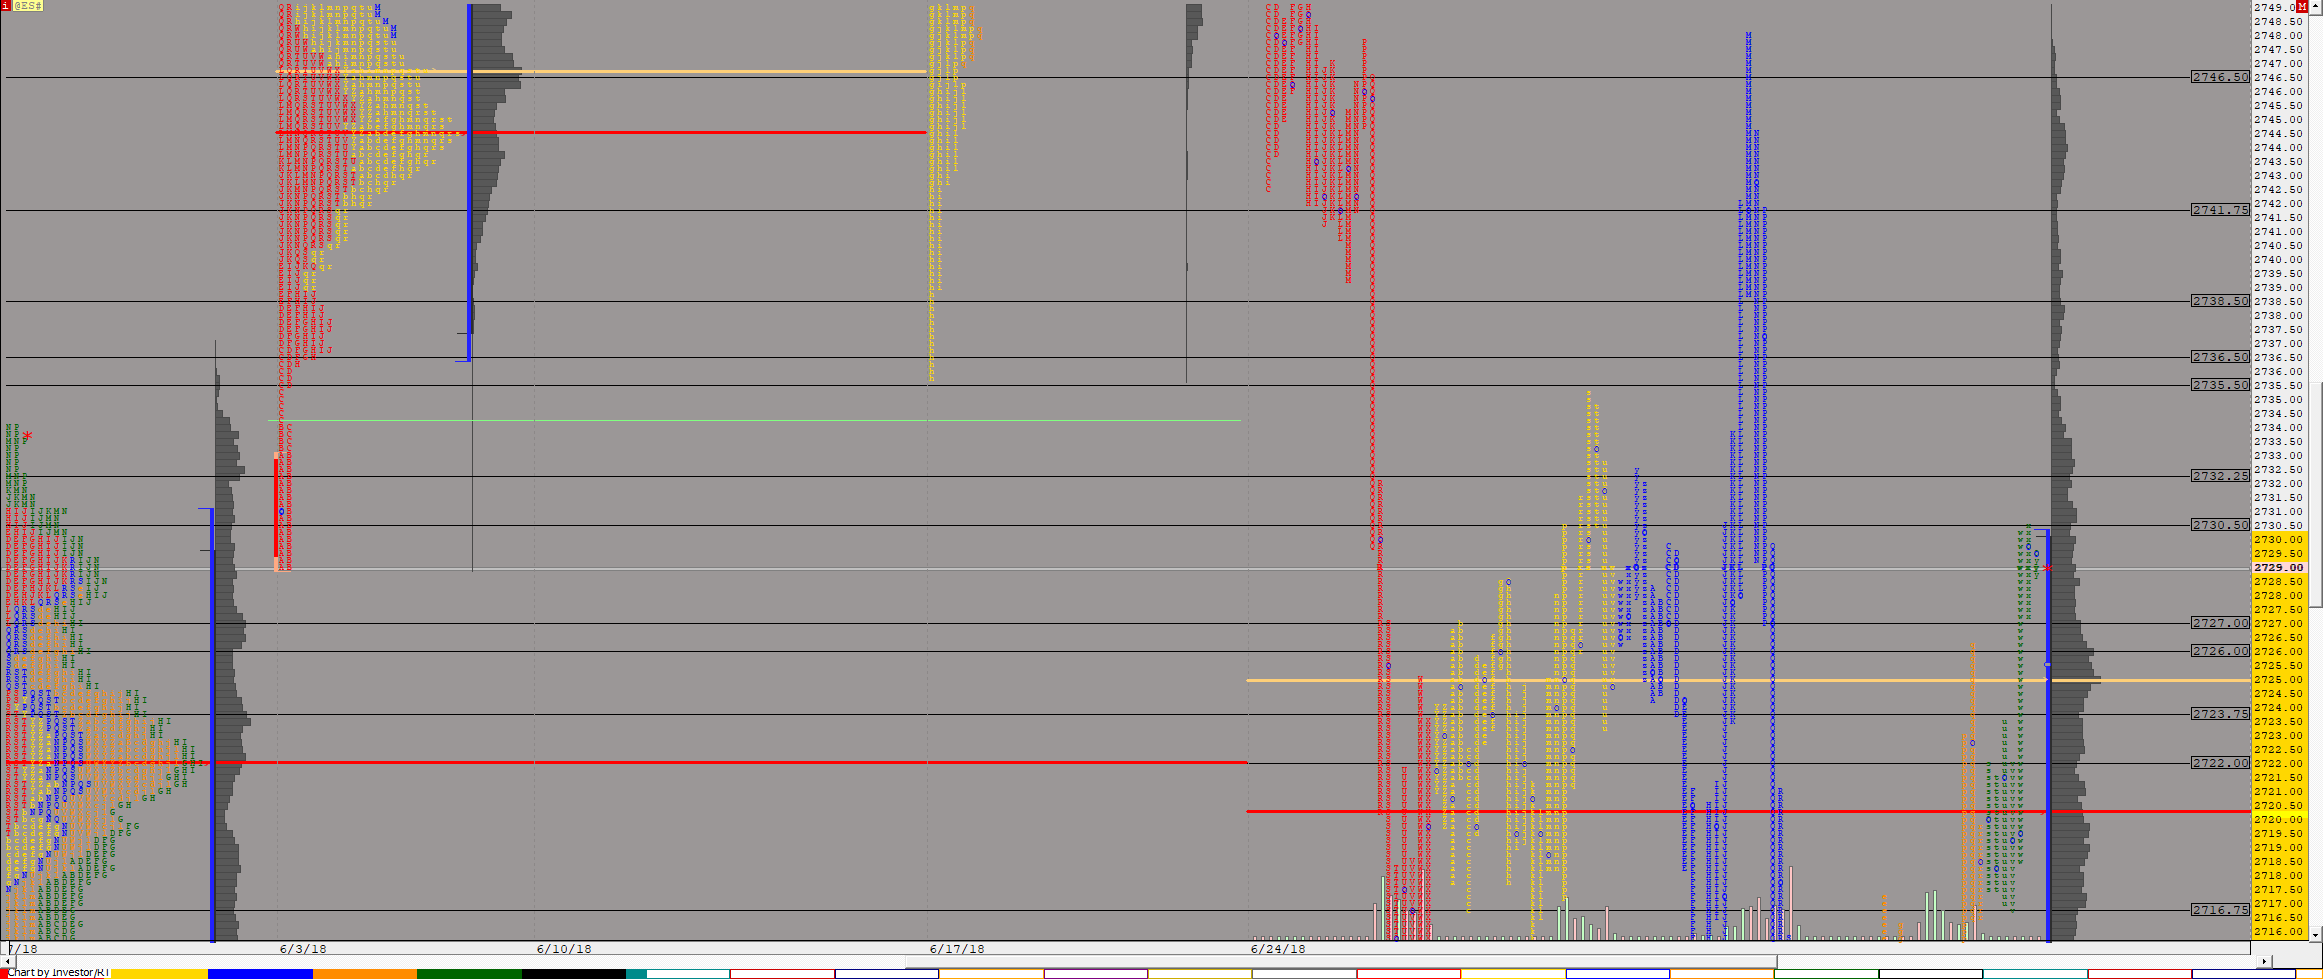 |
Market Profile Globex WEEKLY (@ES#) ES42 [totalcount]
7 years 5 months ago
This chart was uploaded by Investor/RT 13.3.3 showing symbol: @ES#. |
View |
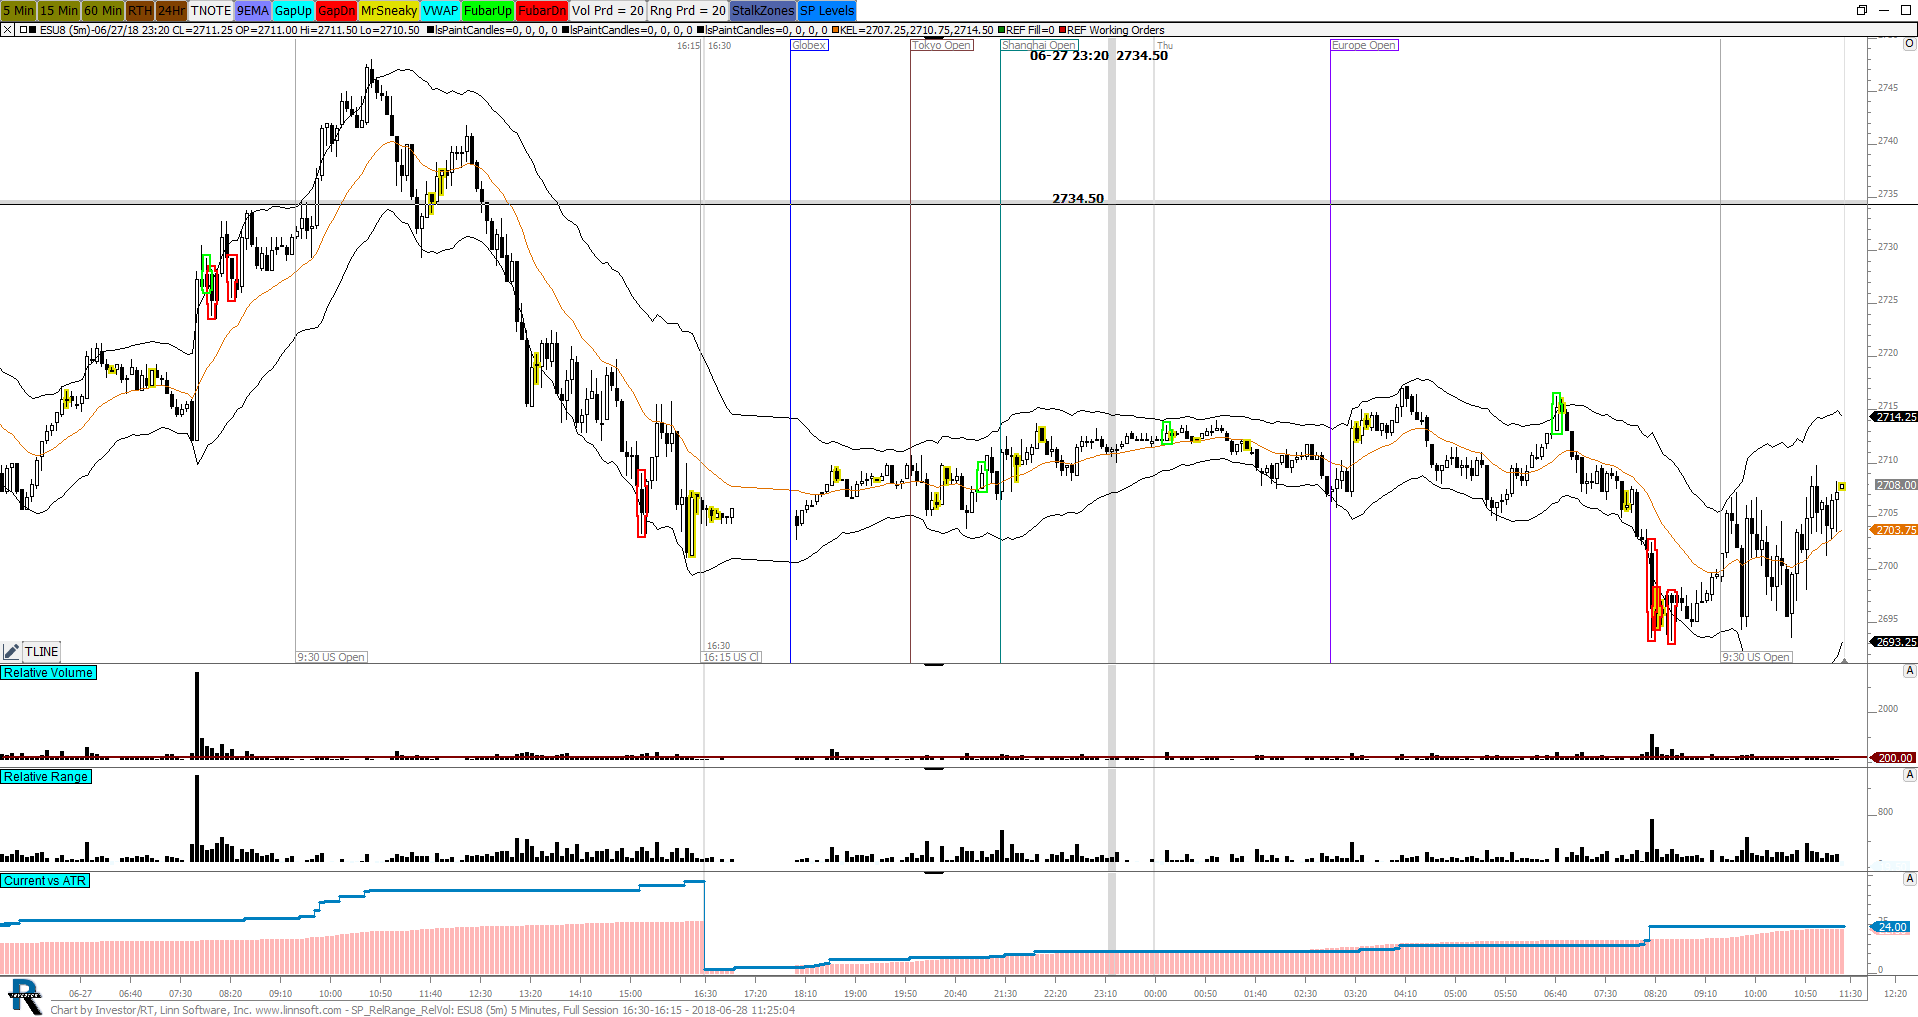 |
SP RelRange RelVol (ESU8) SPetkov [totalcount]
7 years 5 months ago
This chart was uploaded by Investor/RT 13.3.5 showing symbol: ESU8. |
View |
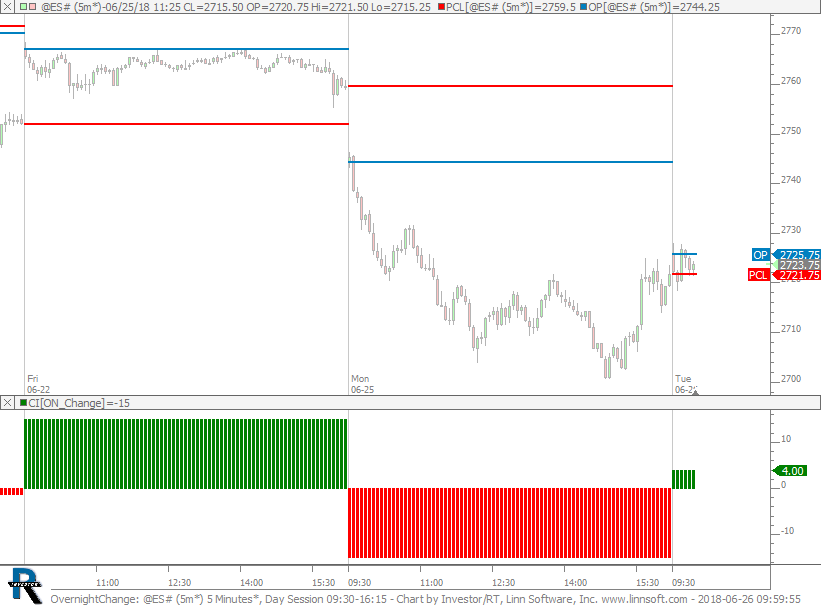 |
OvernightChange (@ES#) cpayne [totalcount]
7 years 5 months ago
Overnight Change, Session Open, Previous Close. This chart was uploaded by Investor/RT 13.3.5 showing symbol: @ES#. |
View |
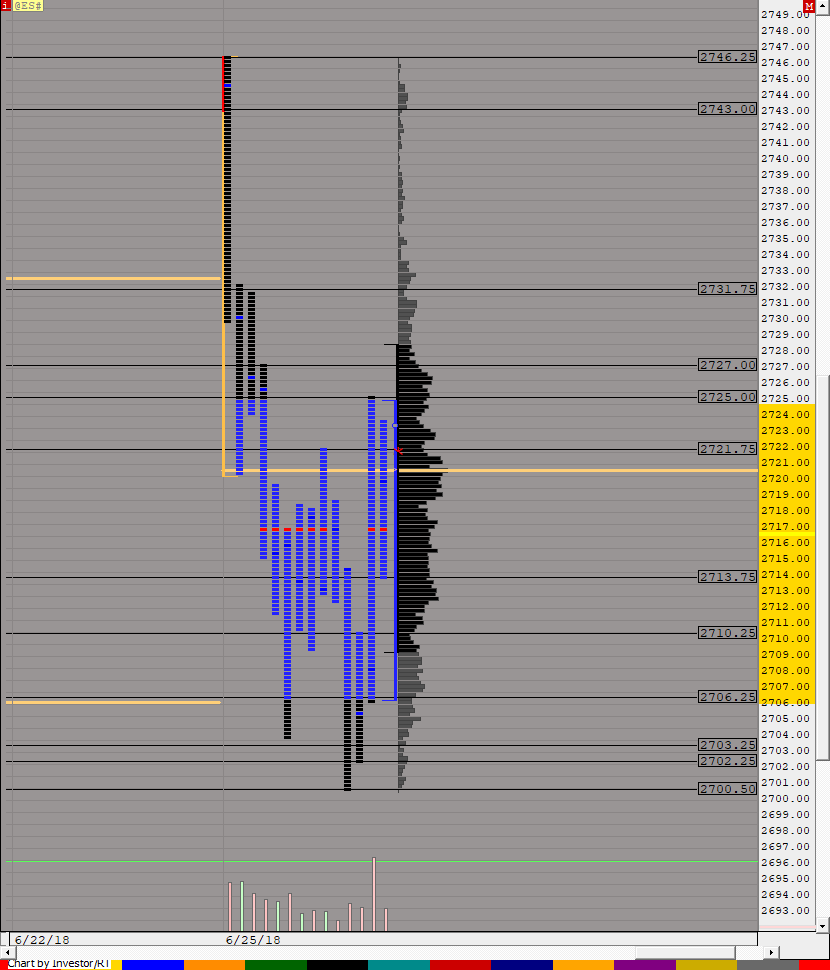 |
Market Profile Day Night (@ES#) ES42 [totalcount]
7 years 6 months ago
This chart was uploaded by Investor/RT 13.3.5 showing symbol: @ES#. |
View |
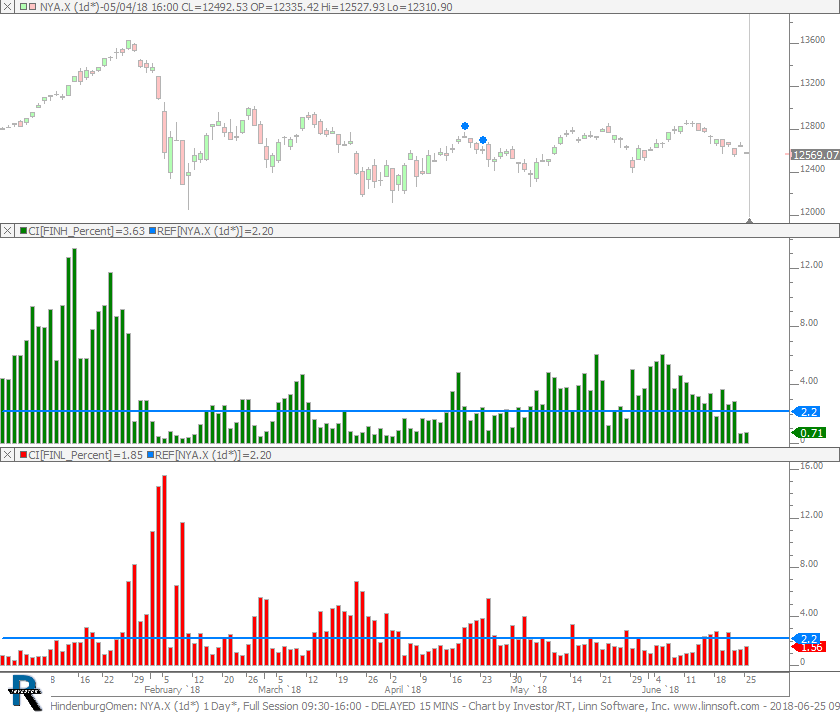 |
HindenburgOmen (NYA.X) cpayne [totalcount]
7 years 6 months ago
Hindenburg Omen. This chart was uploaded by Investor/RT 13.3.5 showing symbol: NYA.X. |
View |
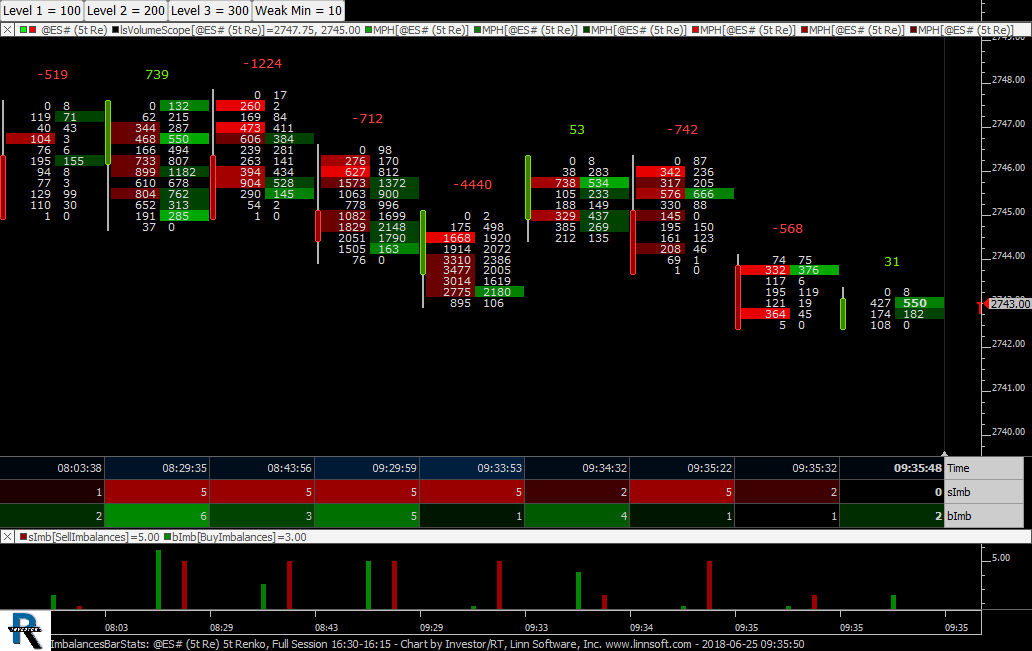 |
ImbalancesBarStats (@ES#) cpayne [totalcount]
7 years 6 months ago
Imbalances Counts via Bar Statistics. This chart was uploaded by Investor/RT 13.3.5 showing symbol: @ES#. |
View |