 |
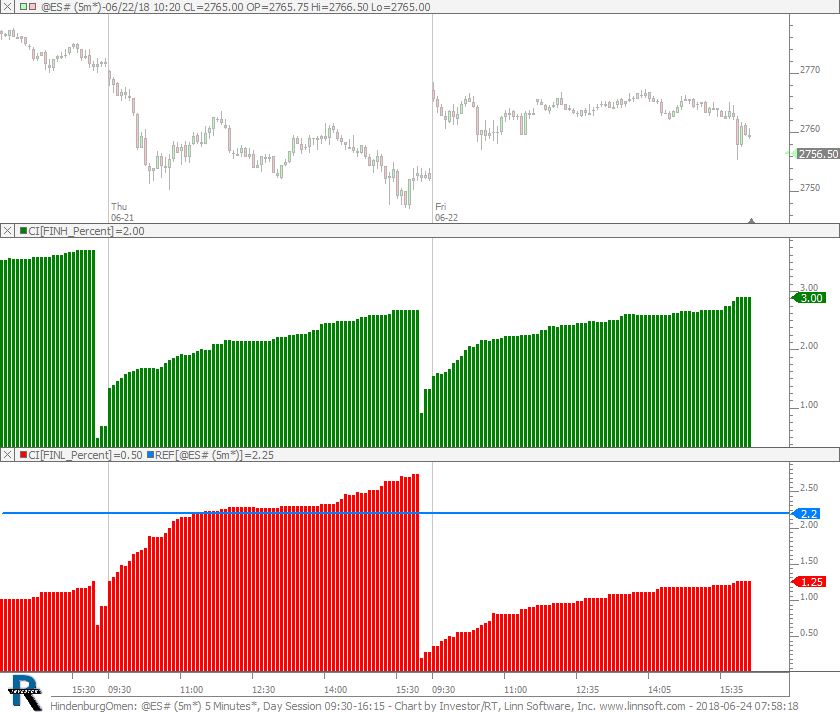
HindenburgOmen (@ES#) cpayne [totalcount]
7 years 6 months ago
Hindenburg Omen. This chart was uploaded by Investor/RT 13.3.5 showing symbol: @ES#. |
View |
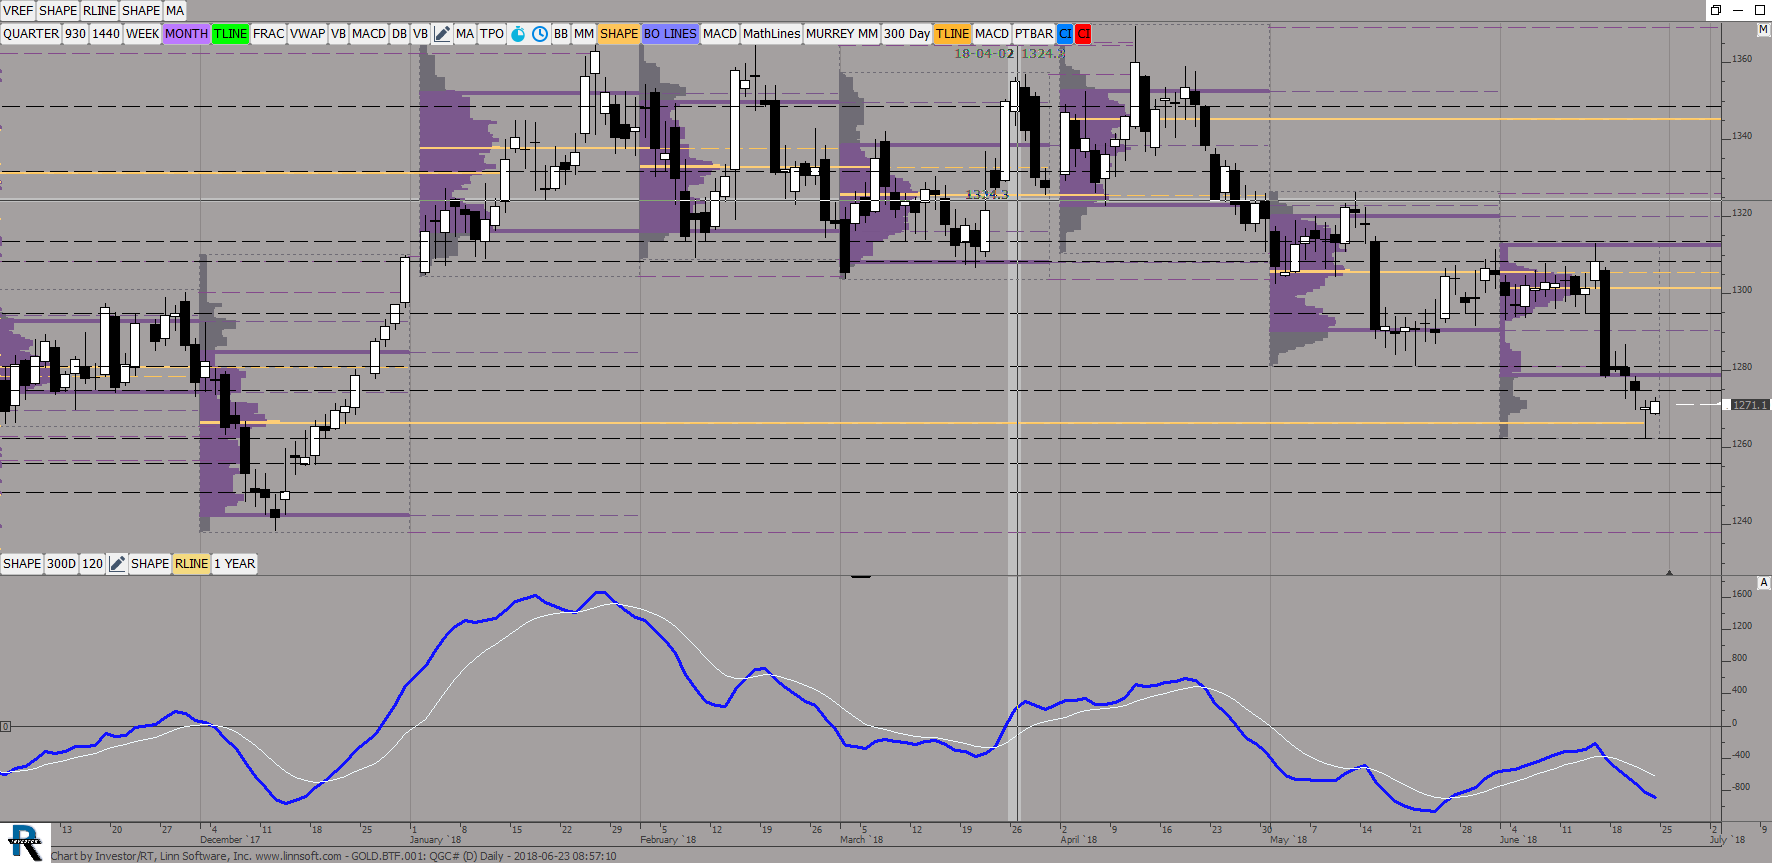 |
GOLDBTF (QGC#) ES42 [totalcount]
7 years 6 months ago
This chart was uploaded by Investor/RT 13.3.5 showing symbol: QGC#. |
View |
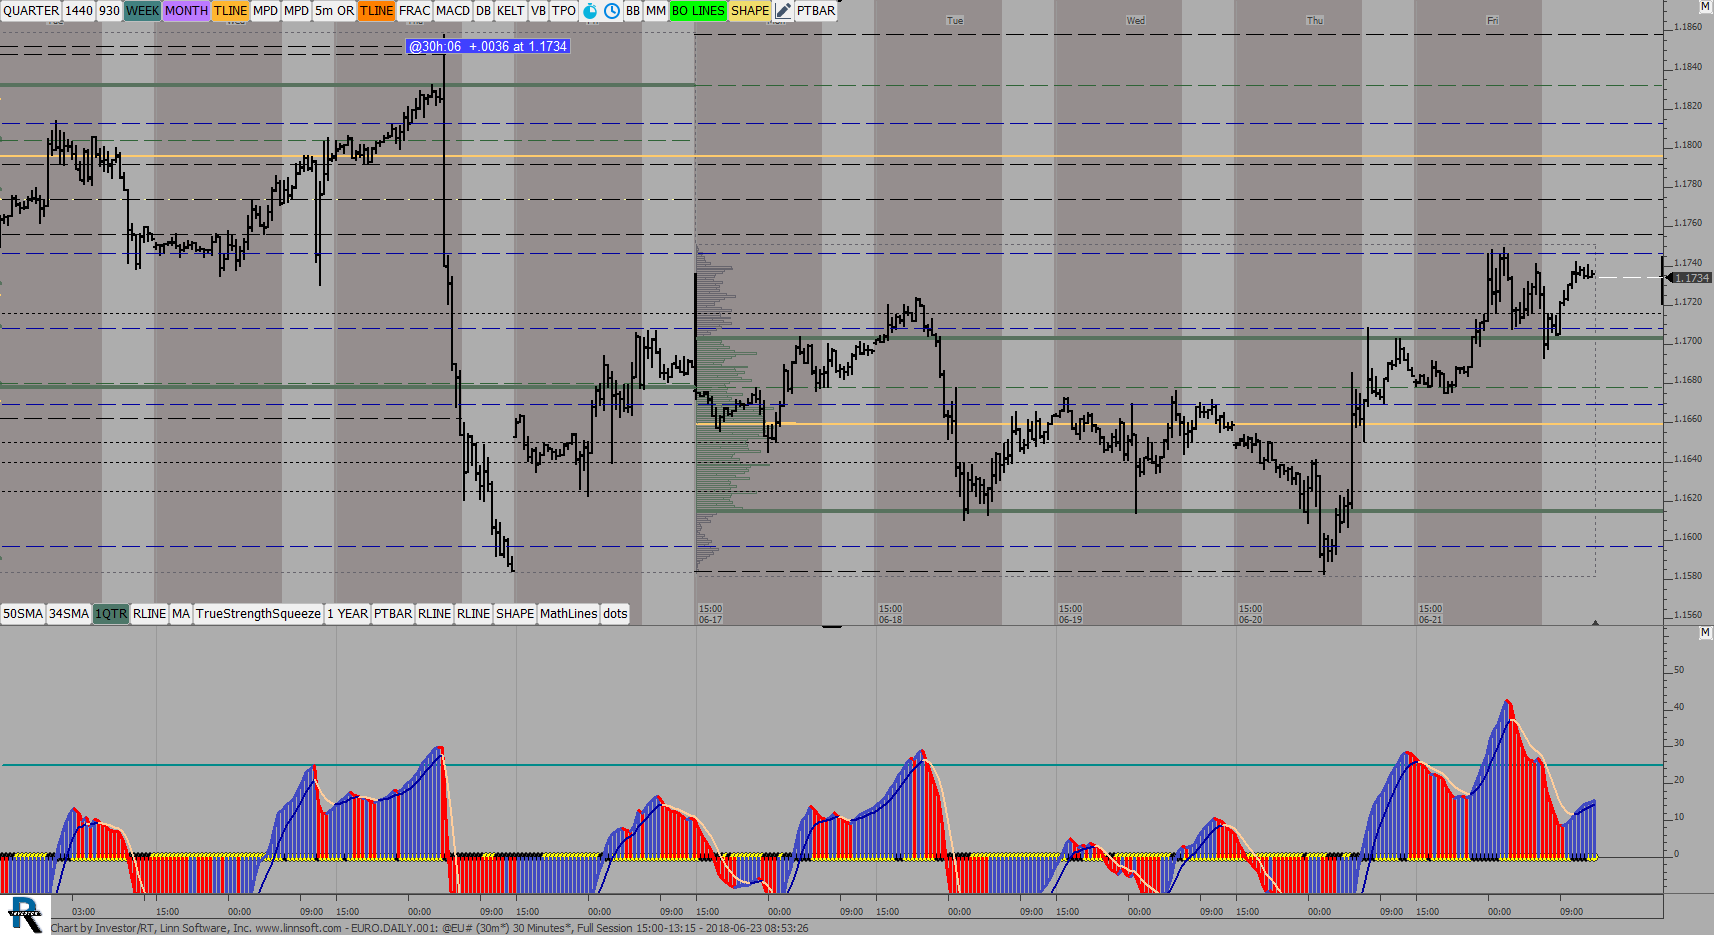 |
EURODAILY (@EU#) ES42 [totalcount]
7 years 6 months ago
This chart was uploaded by Investor/RT 13.3.4 showing symbol: @EU#. |
View |
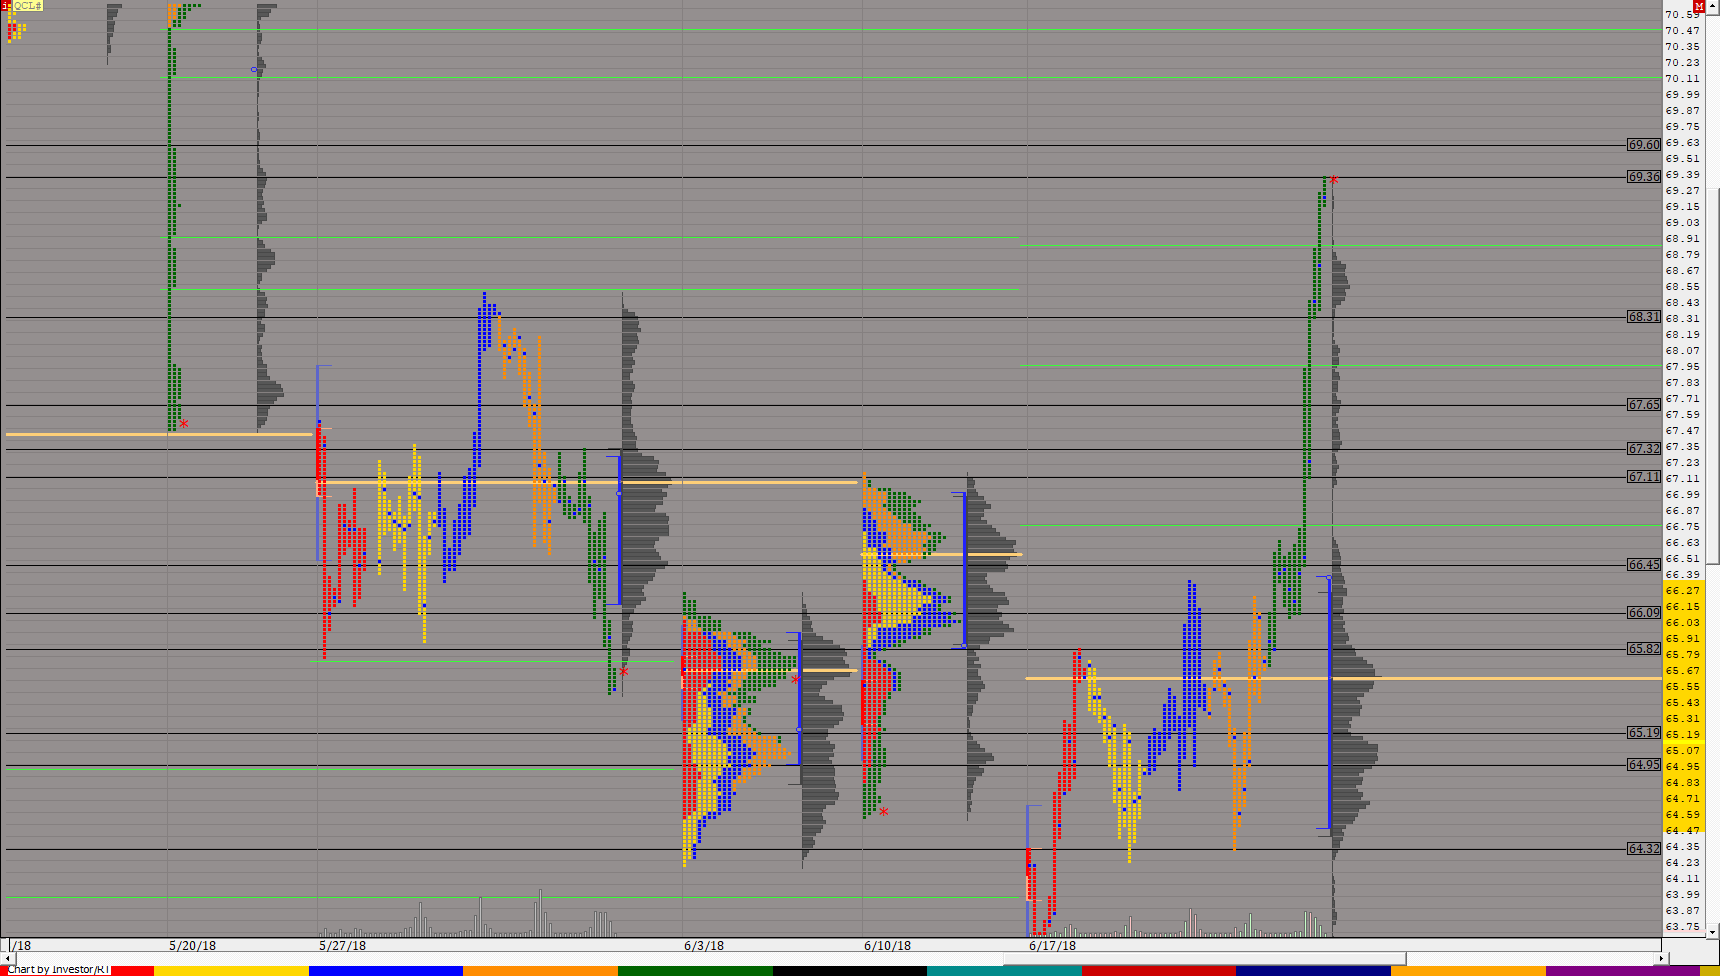 |
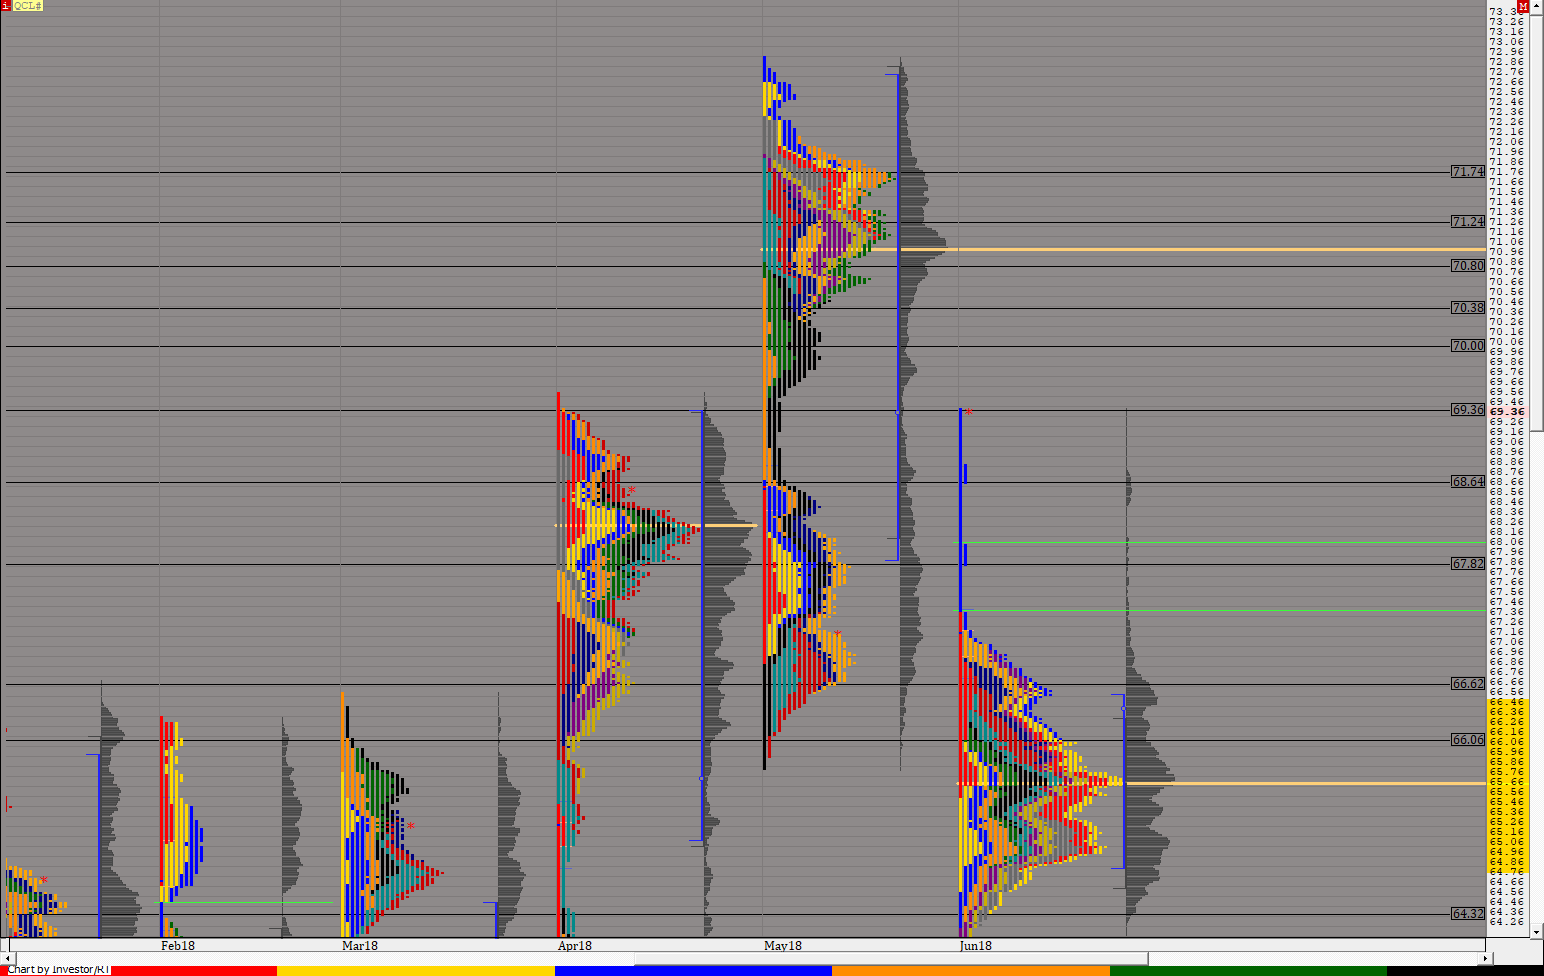
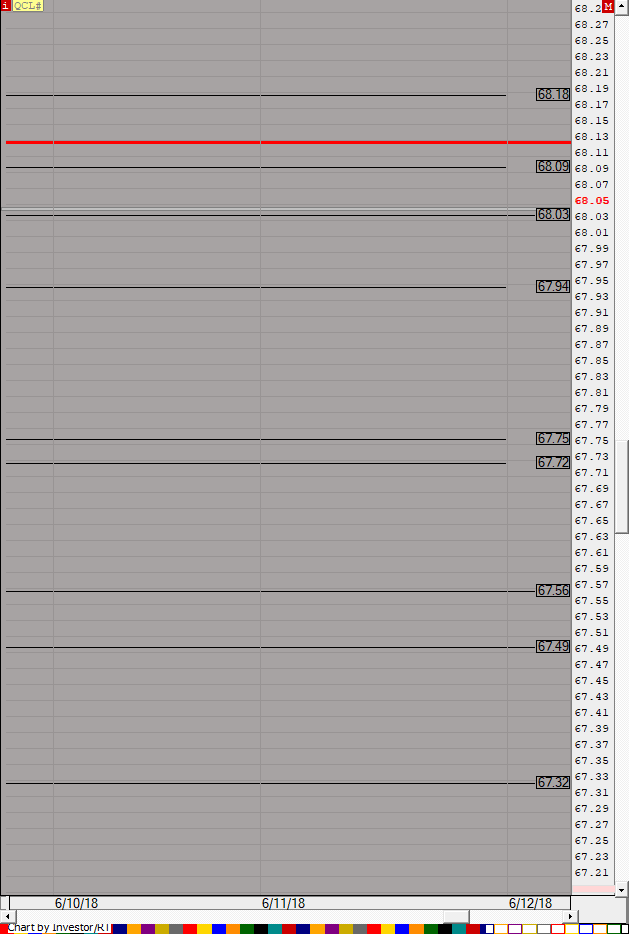
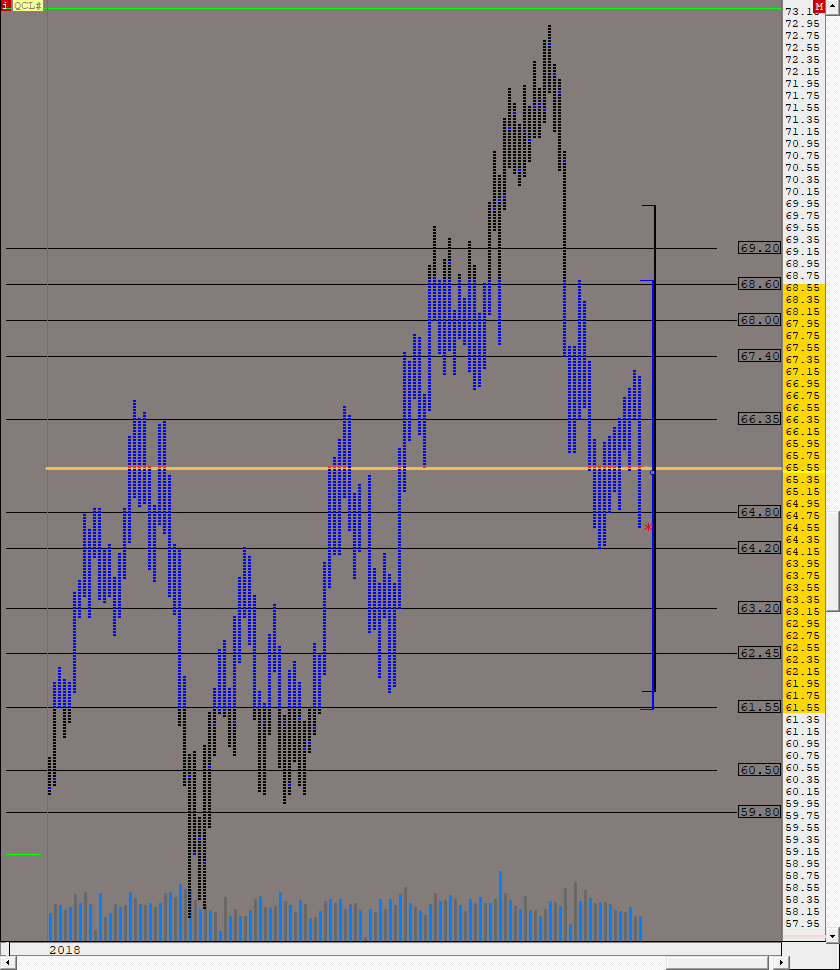
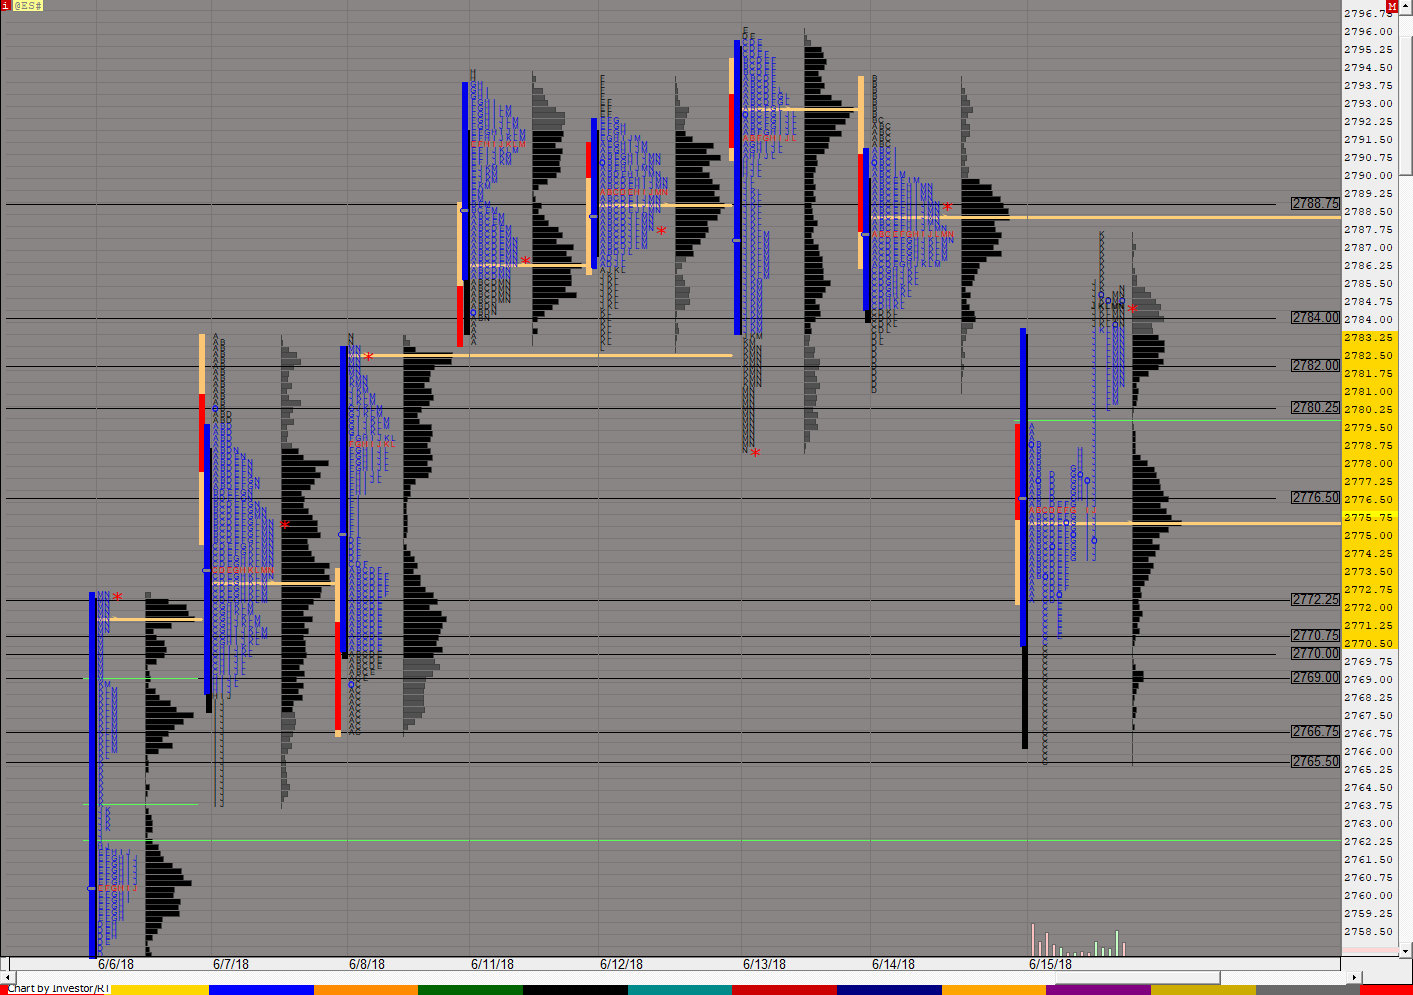
Market profileGlobexWEEKLY (QCL#) ES42 [totalcount]
7 years 6 months ago
This chart was uploaded by Investor/RT 13.3.5 showing symbol: QCL#. |
View |
 |
OIL DUPE (QCL#) ES42 [totalcount]
7 years 6 months ago
This chart was uploaded by Investor/RT 13.3.5 showing symbol: QCL#. |
View |
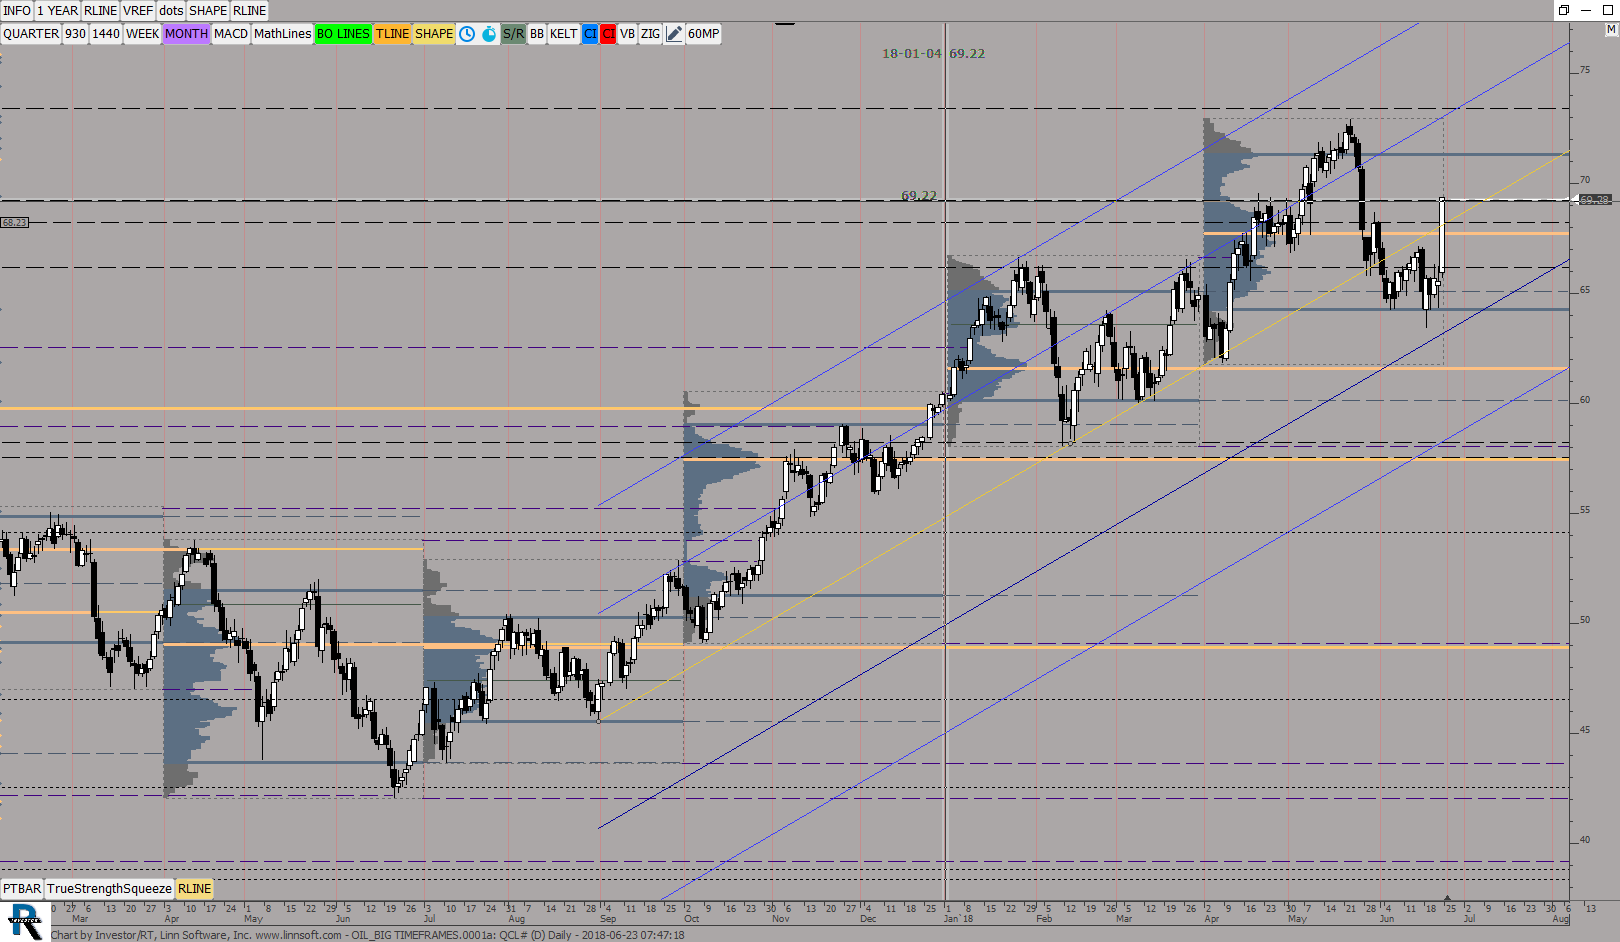 |
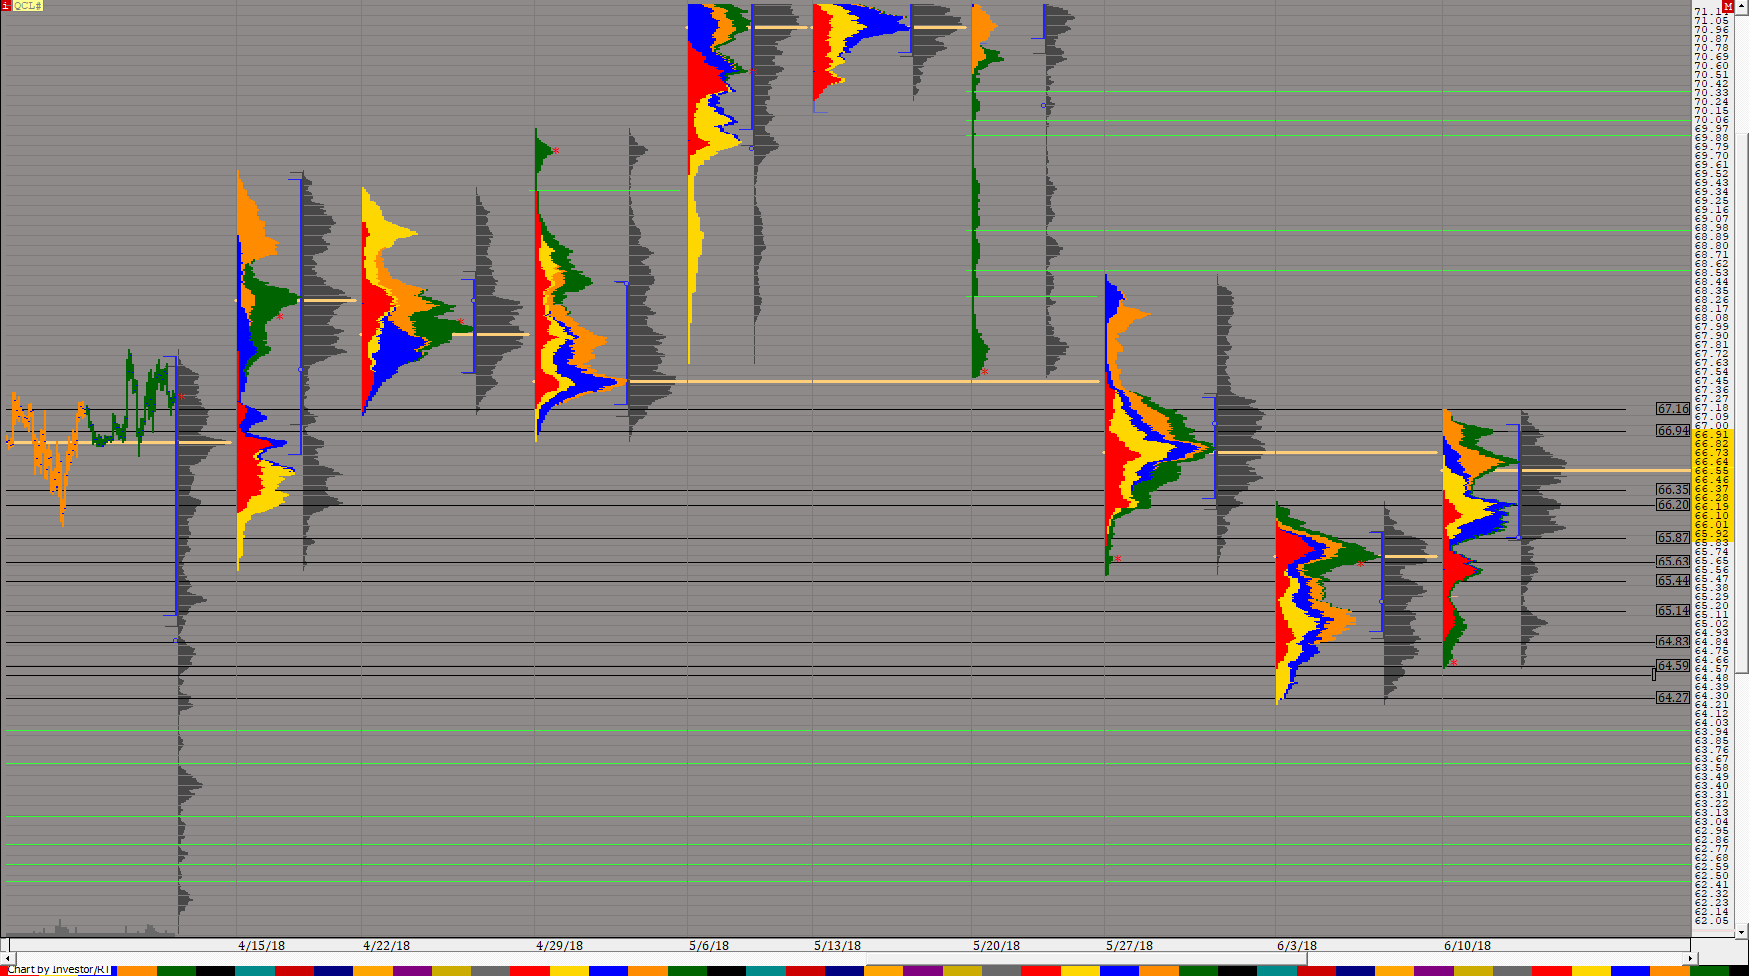
OIL BIG TIMEFRAMES0001a (QCL#) ES42 [totalcount]
7 years 6 months ago
This chart was uploaded by Investor/RT 13.3.5 showing symbol: QCL#. |
View |
 |
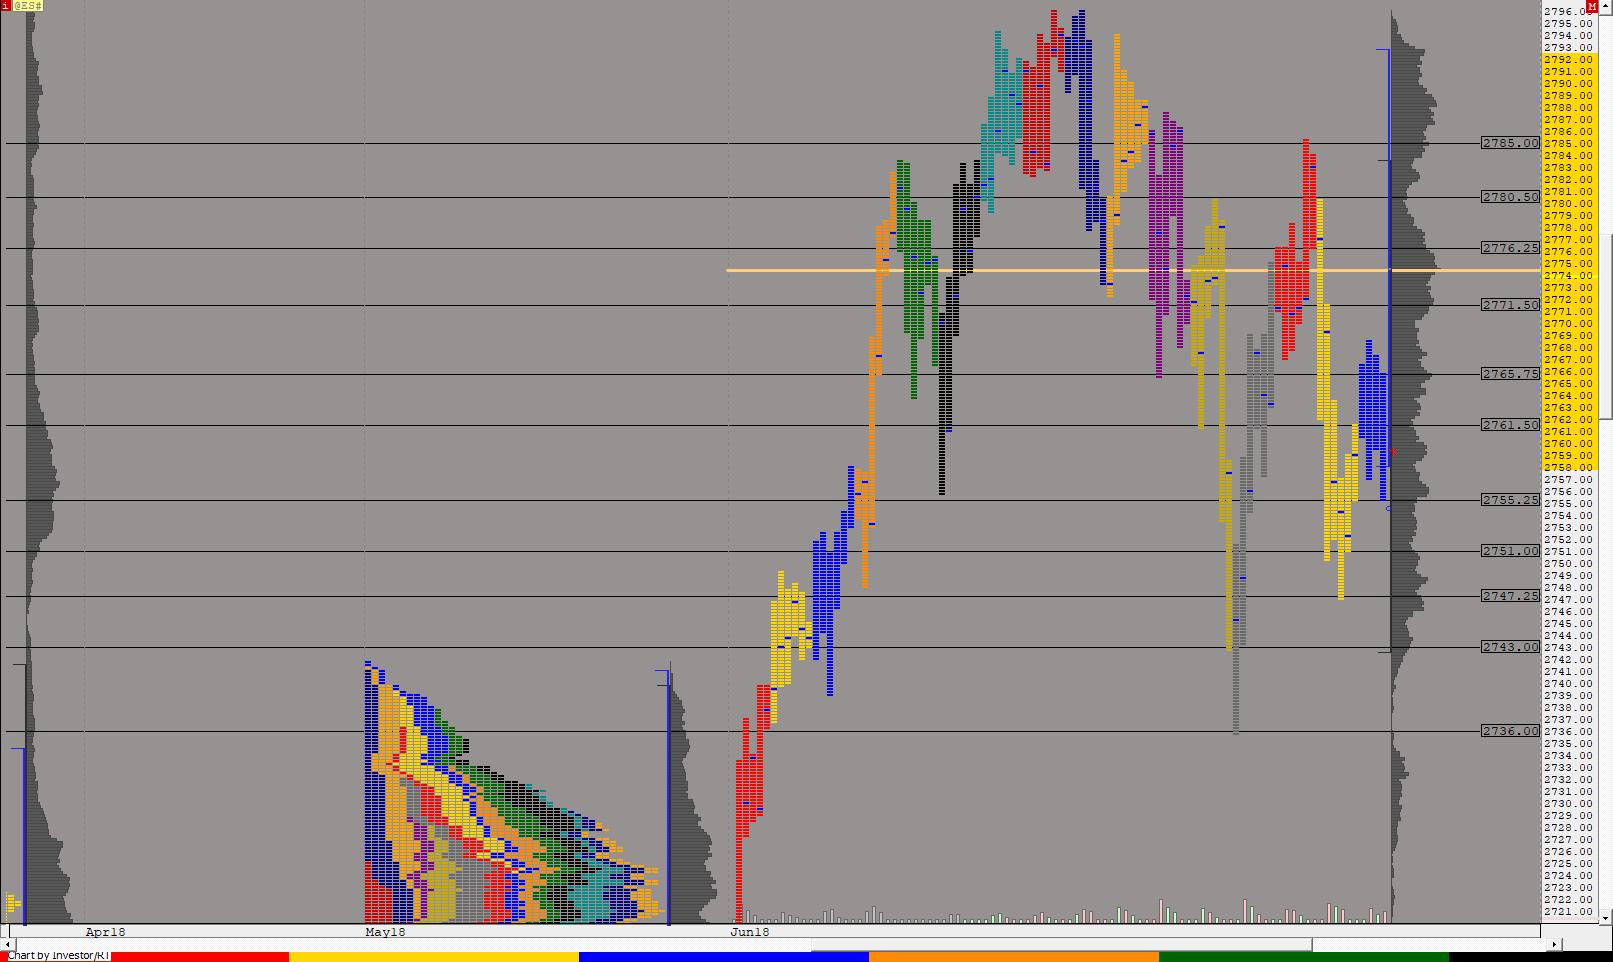
Market Profile Yearly (@ES#) ES42 [totalcount]
7 years 6 months ago
This chart was uploaded by Investor/RT 13.3.4 showing symbol: @ES#. |
View |
 |
Market Profile Globex MONTHLY (@ES#) ES42 [totalcount]
7 years 6 months ago
This chart was uploaded by Investor/RT 13.3.4 showing symbol: @ES#. |
View |
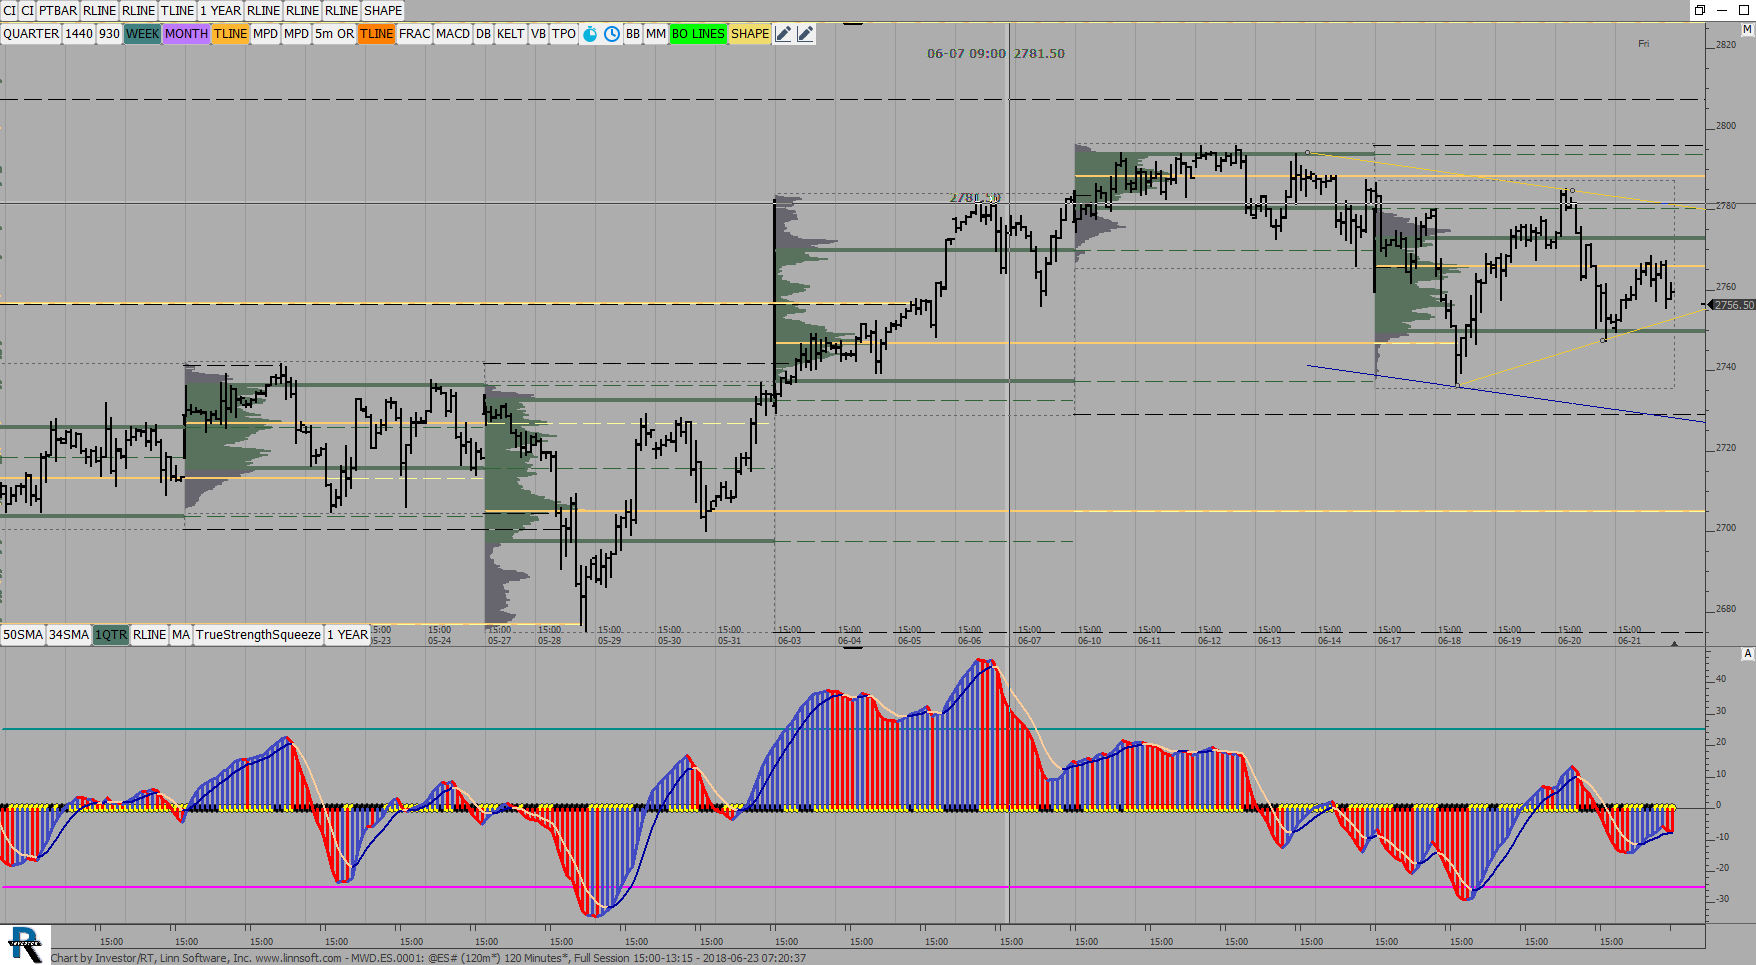 |
MWDES (@ES#) ES42 [totalcount]
7 years 6 months ago
This chart was uploaded by Investor/RT 13.3.4 showing symbol: @ES#. |
View |
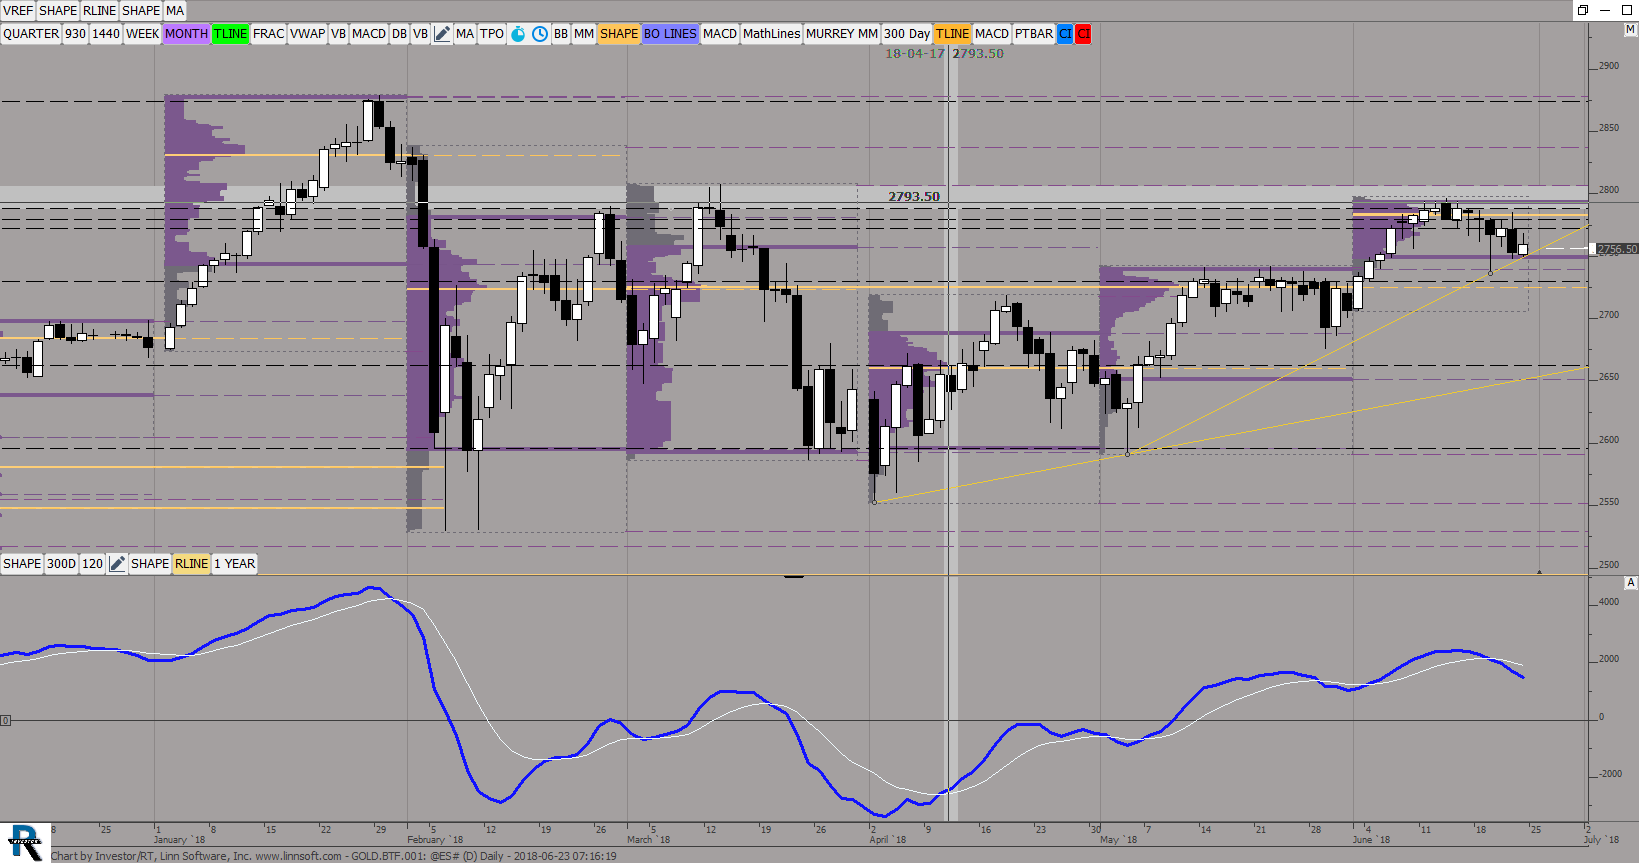 |
GOLDBTF (@ES#) ES42 [totalcount]
7 years 6 months ago
This chart was uploaded by Investor/RT 13.3.5 showing symbol: @ES#. |
View |
 |
MP Day chart (QCL#) ES42 [totalcount]
7 years 6 months ago
This chart was uploaded by Investor/RT 13.3.4 showing symbol: QCL#. |
View |
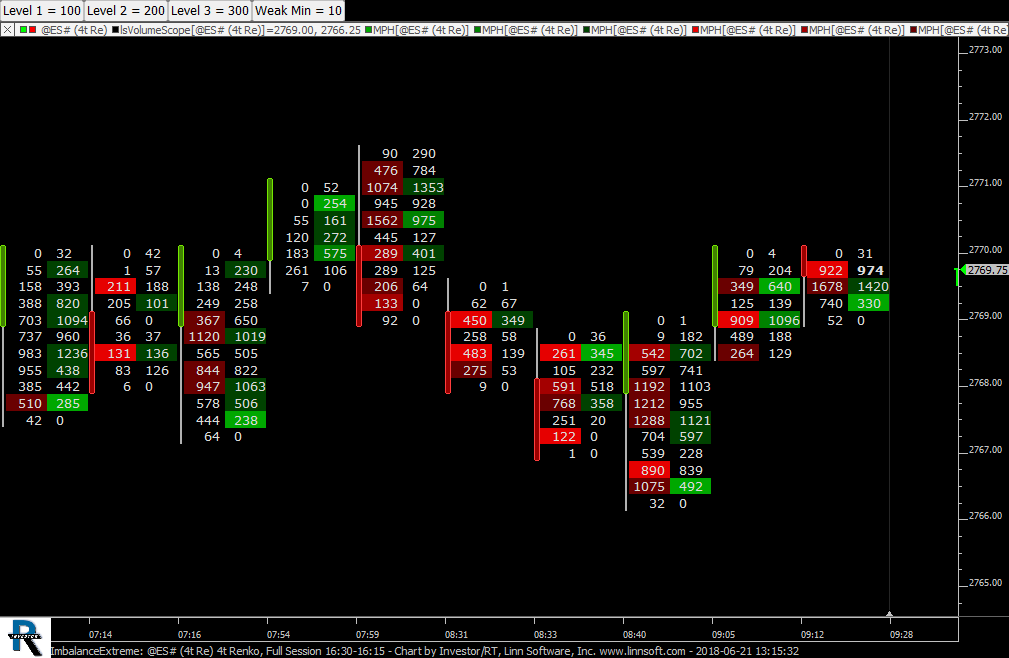 |
ImbalanceExtreme (@ES#) cpayne [totalcount]
7 years 6 months ago
Three Levels of Imbalance Controlled by Buttons. Darker colors for 100-200%. Medium shades for 200-300%. Lighter Shades for 300-400%. Weak Side Minimum controlled by button also. |
View |
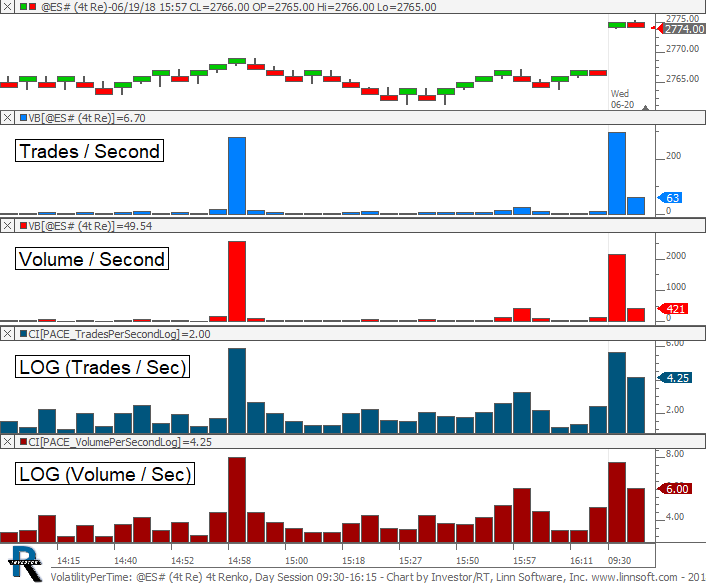 |
VolatilityPerTime (@ES#) cpayne [totalcount]
7 years 6 months ago
Trades and Volume Per Second. This chart was uploaded by Investor/RT 13.3.5 showing symbol: @ES#. |
View |
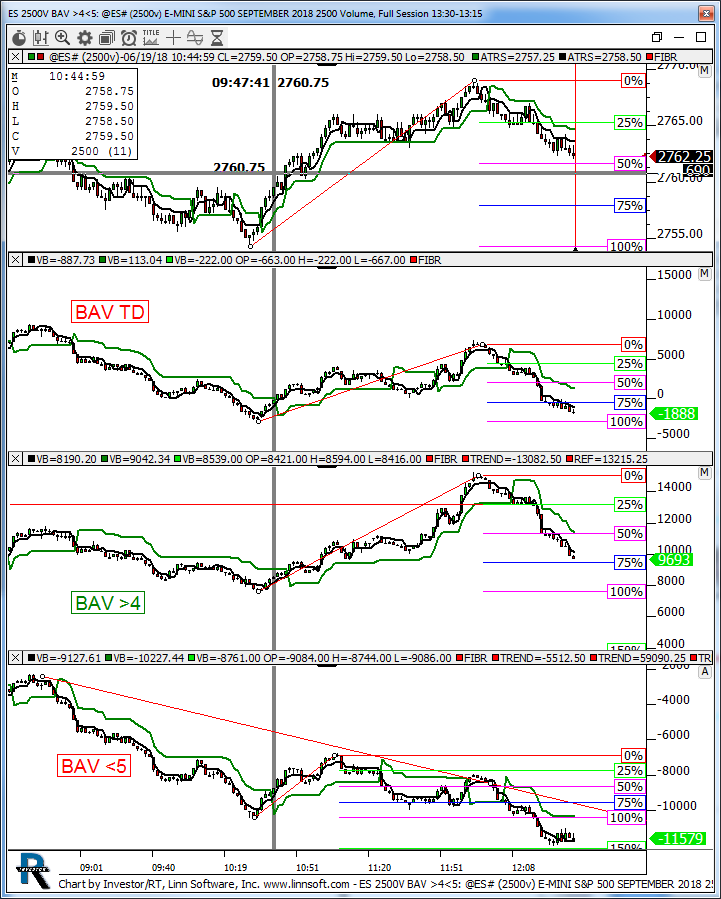 |
ES 2500V BAV (@ES#) kencassorla [totalcount]
7 years 6 months ago
2500v. This chart was uploaded by Investor/RT 13.3.4 showing symbol: @ES#. |
View |
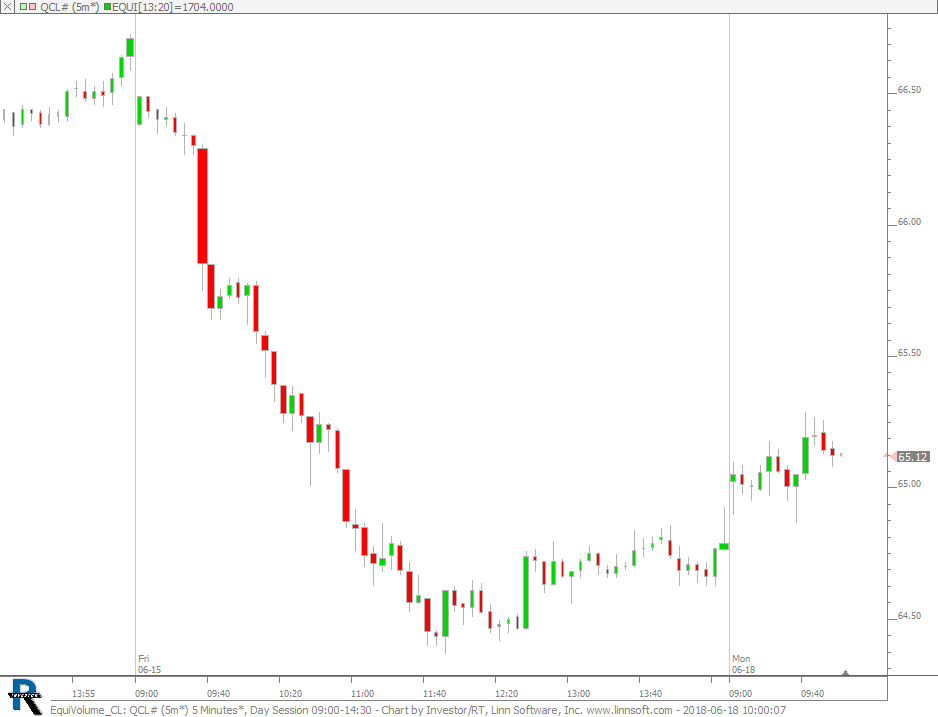 |
EquiVolume CL (QCL#) cpayne [totalcount]
7 years 6 months ago
Equ-Volume Candles - CL. This chart was uploaded by Investor/RT 13.3.5 showing symbol: QCL#. |
View |
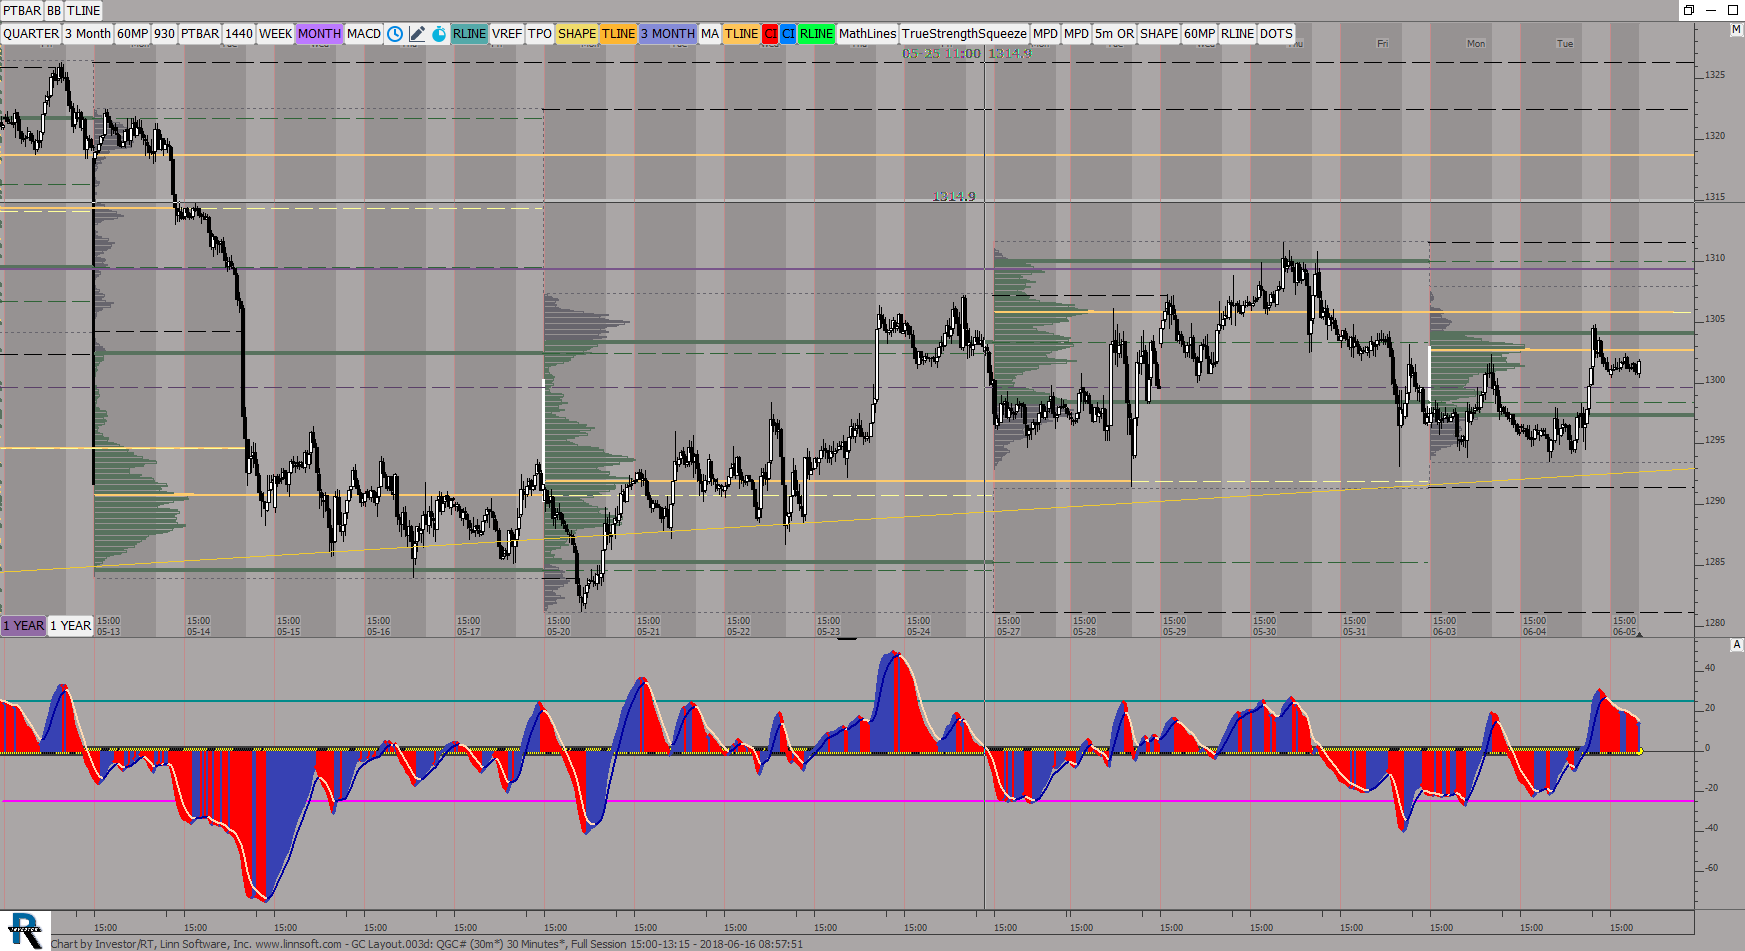 |
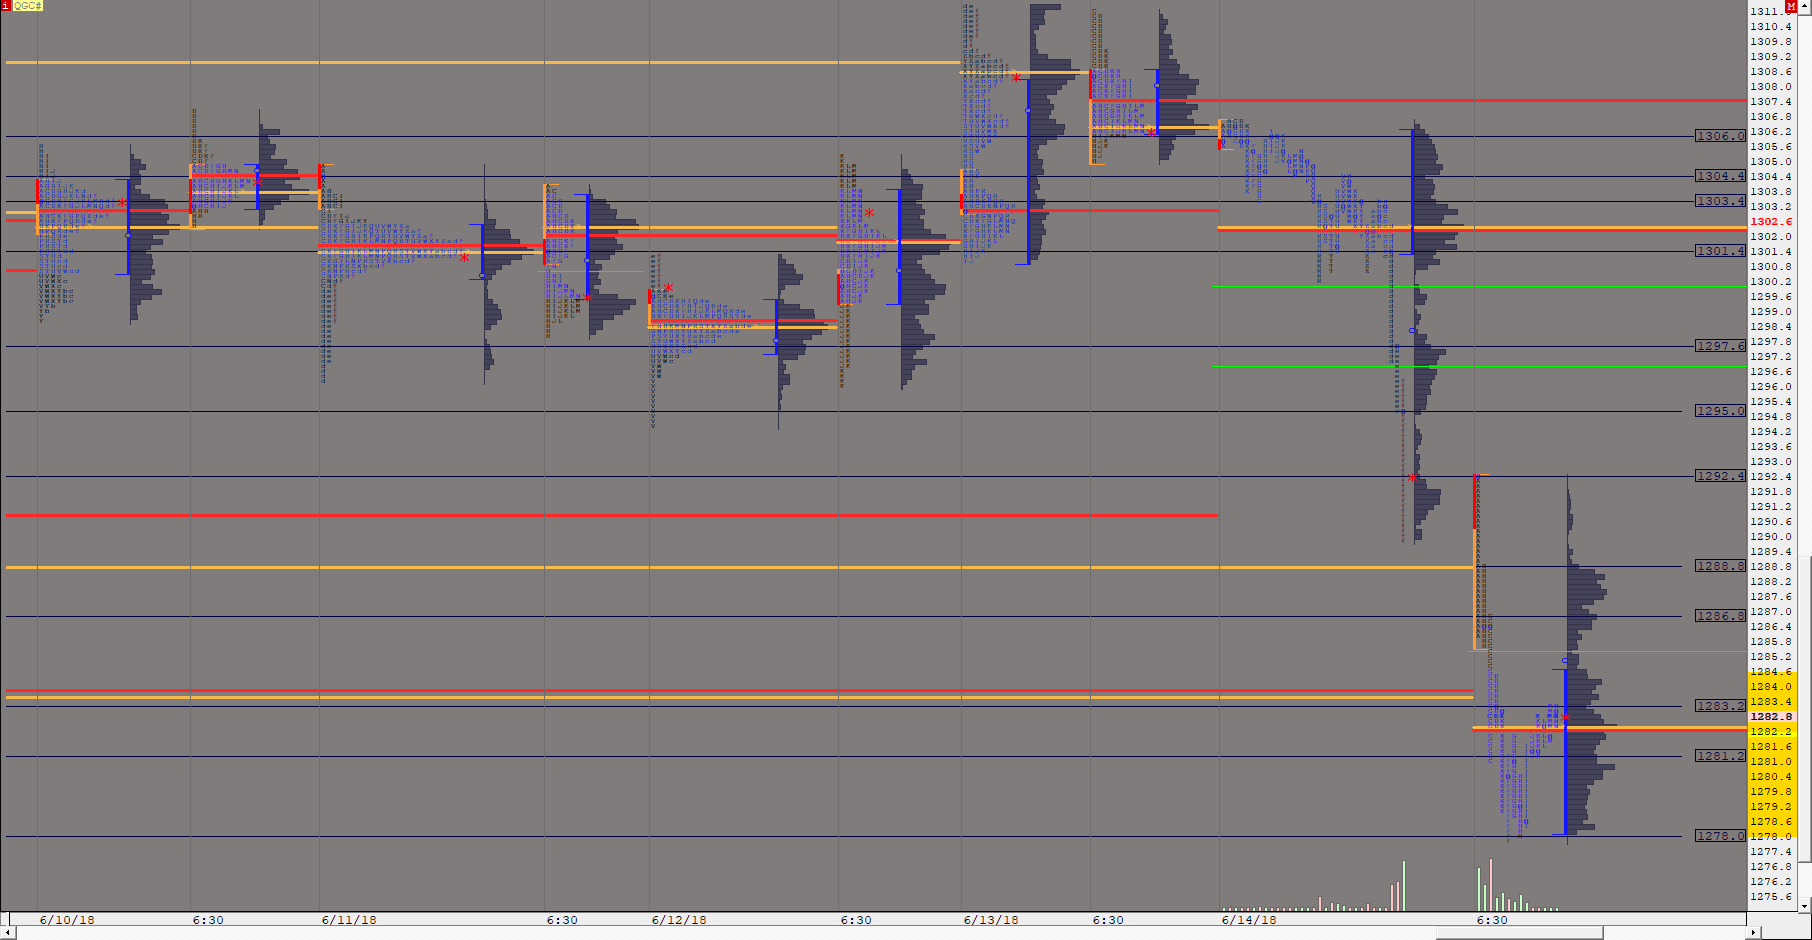
GC Layout003d (QGC#) ES42 [totalcount]
7 years 6 months ago
This chart was uploaded by Investor/RT 13.3.3 showing symbol: QGC#. |
View |
 |
GC Layout003c (QGC#) ES42 [totalcount]
7 years 6 months ago
This chart was uploaded by Investor/RT 13.3.4 showing symbol: QGC#. |
View |
 |
MPBONDS GLOBEX WEEKLY (@US#) ES42 [totalcount]
7 years 6 months ago
This chart was uploaded by Investor/RT 13.3.4 showing symbol: @US#. |
View |
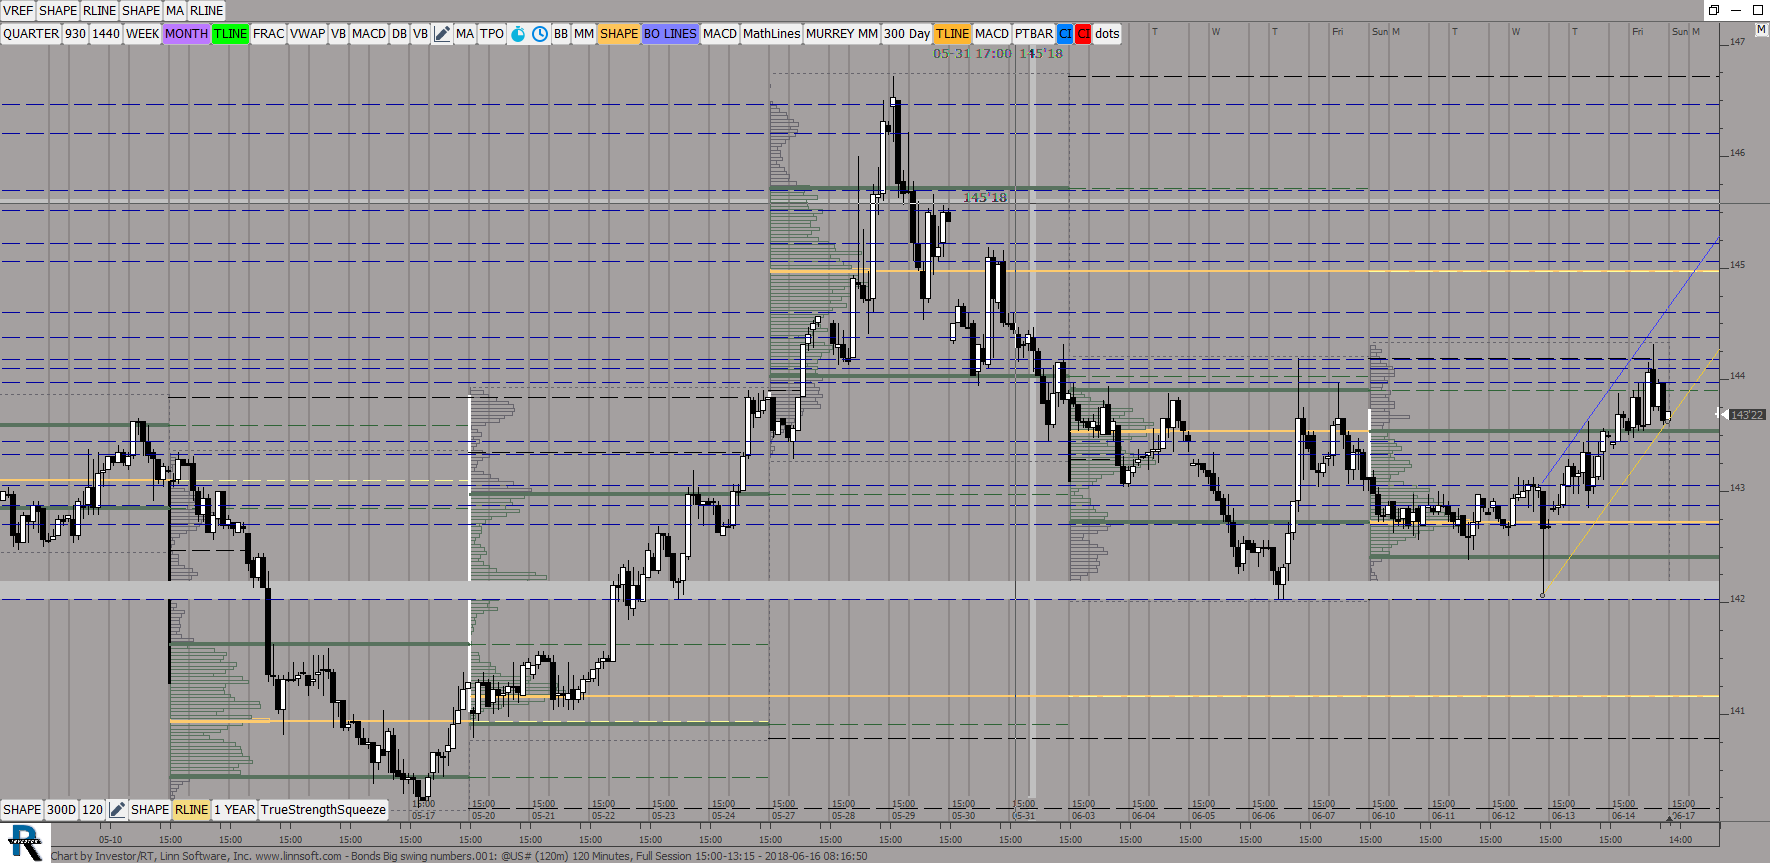 |
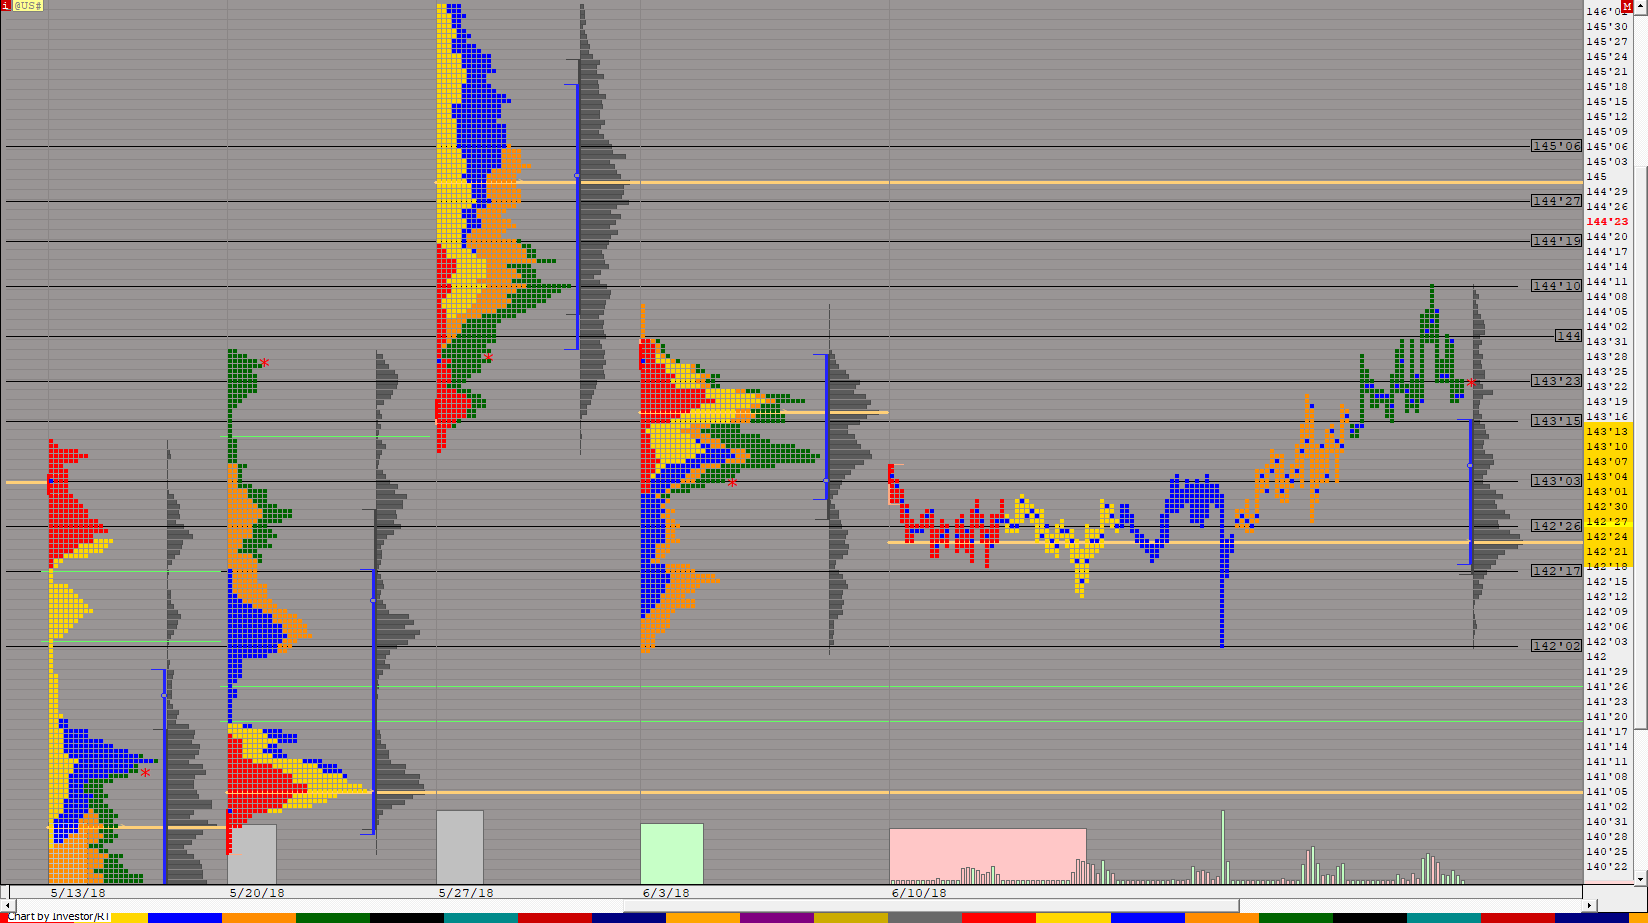
Bonds Big swing numbers (@US#) ES42 [totalcount]
7 years 6 months ago
This chart was uploaded by Investor/RT 13.3.4 showing symbol: @US#. |
View |
 |
OIL Layout001b (QCL#) ES42 [totalcount]
7 years 6 months ago
This chart was uploaded by Investor/RT 13.3.3 showing symbol: QCL#. |
View |
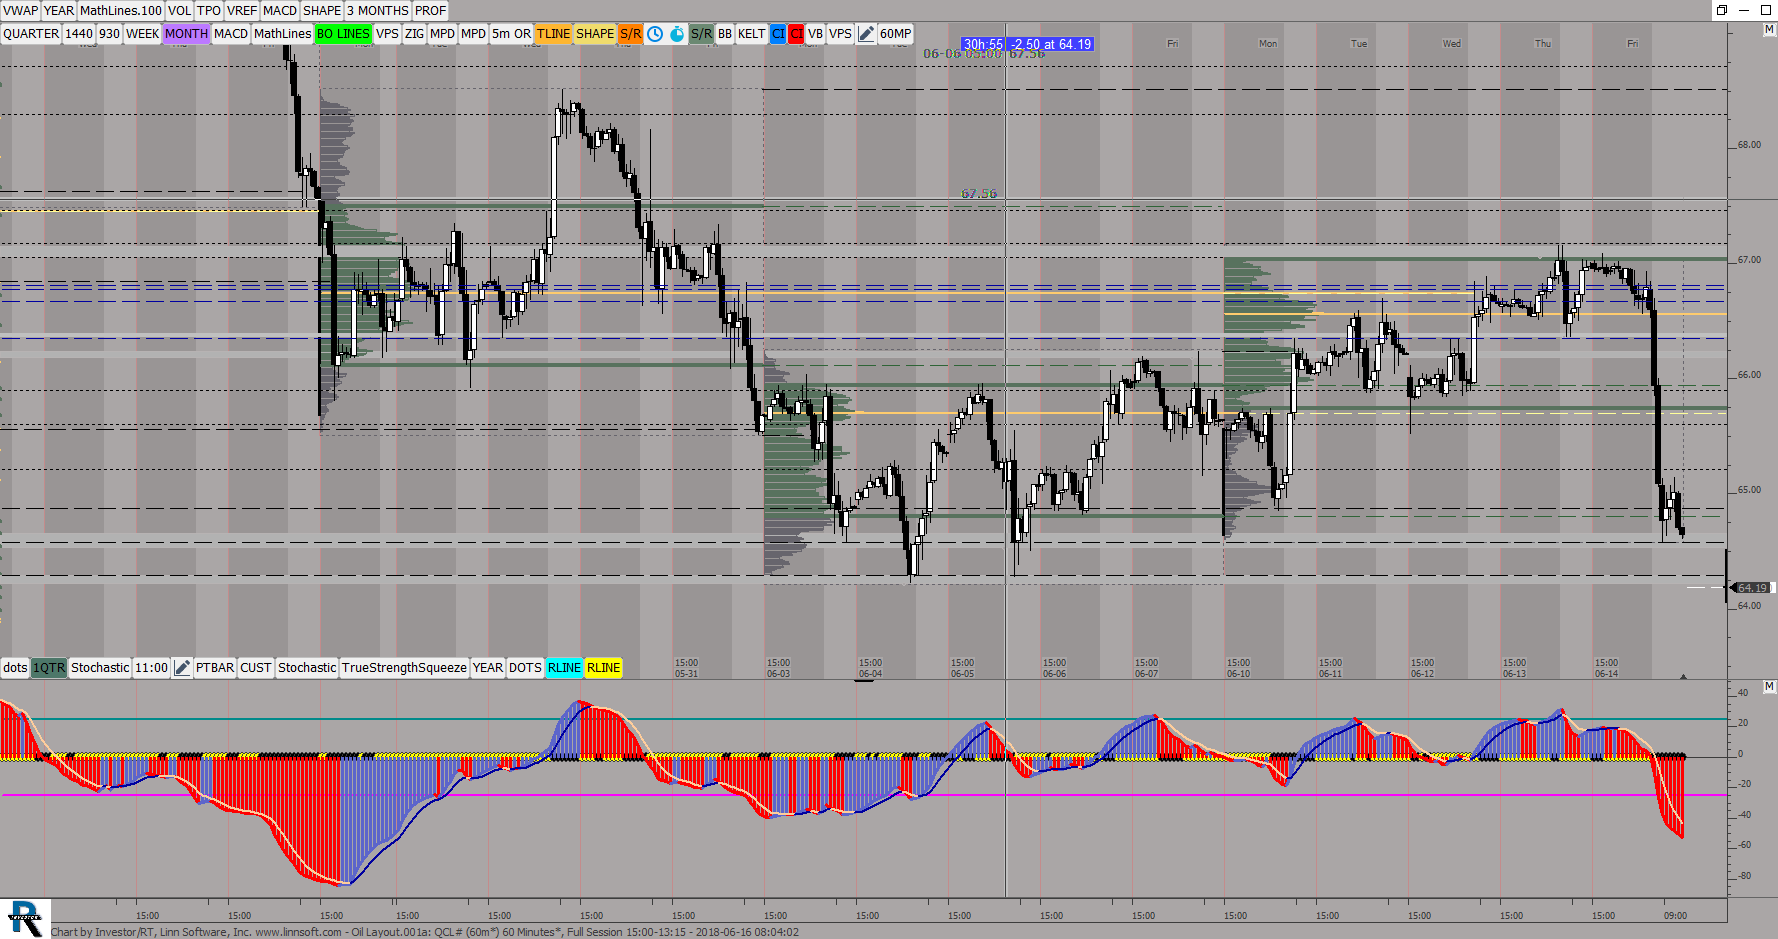 |
Oil Layout001a (QCL#) ES42 [totalcount]
7 years 6 months ago
This chart was uploaded by Investor/RT 13.3.3 showing symbol: QCL#. |
View |
 |
Market profileGlobexmonthly (QCL#) ES42 [totalcount]
7 years 6 months ago
This chart was uploaded by Investor/RT 13.3.4 showing symbol: QCL#. |
View |
 |
Market Profile 24 hour (@ES#) ES42 [totalcount]
7 years 6 months ago
This chart was uploaded by Investor/RT 13.3.4 showing symbol: @ES#. |
View |
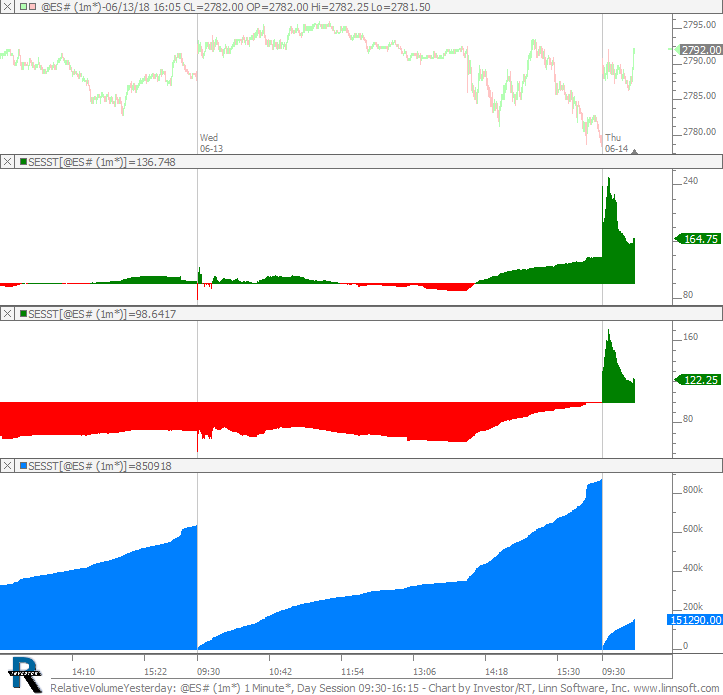 |
RelativeVolumeYesterday (@ES#) cpayne [totalcount]
7 years 6 months ago
Relative Volume (at time of day) vs Yesterday and vs 20 day average. This chart was uploaded by Investor/RT 13.3.5 showing symbol: @ES#. |
View |
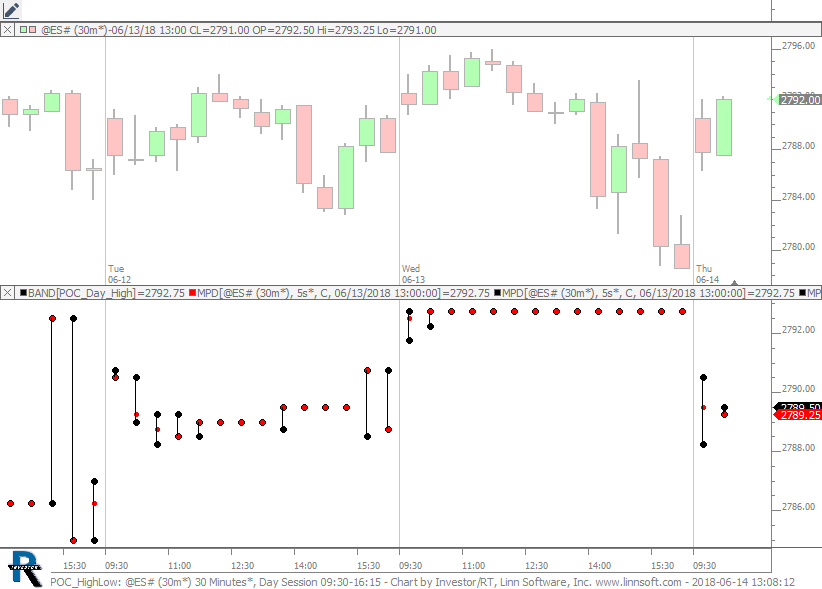 |
POC HighLow (@ES#) cpayne [totalcount]
7 years 6 months ago
This chart was uploaded by Investor/RT 13.3.5 showing symbol: @ES#. |
View |