 |
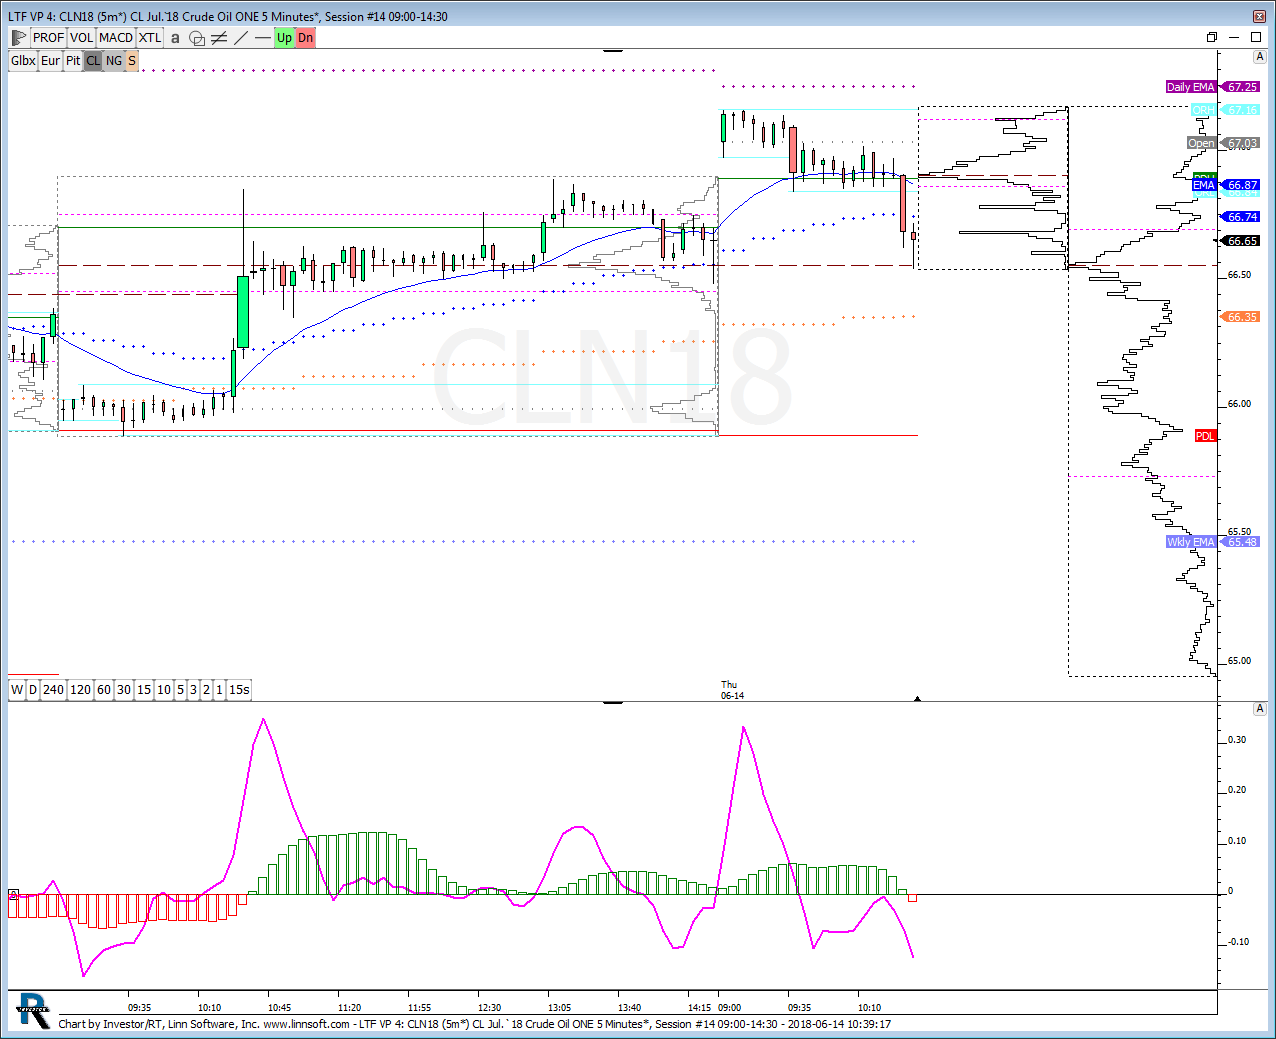
LTF VP (CLN18) carlosleon2005 [totalcount]
7 years 6 months ago
This chart was uploaded by Investor/RT 13.3.4 showing symbol: CLN18. |
View |
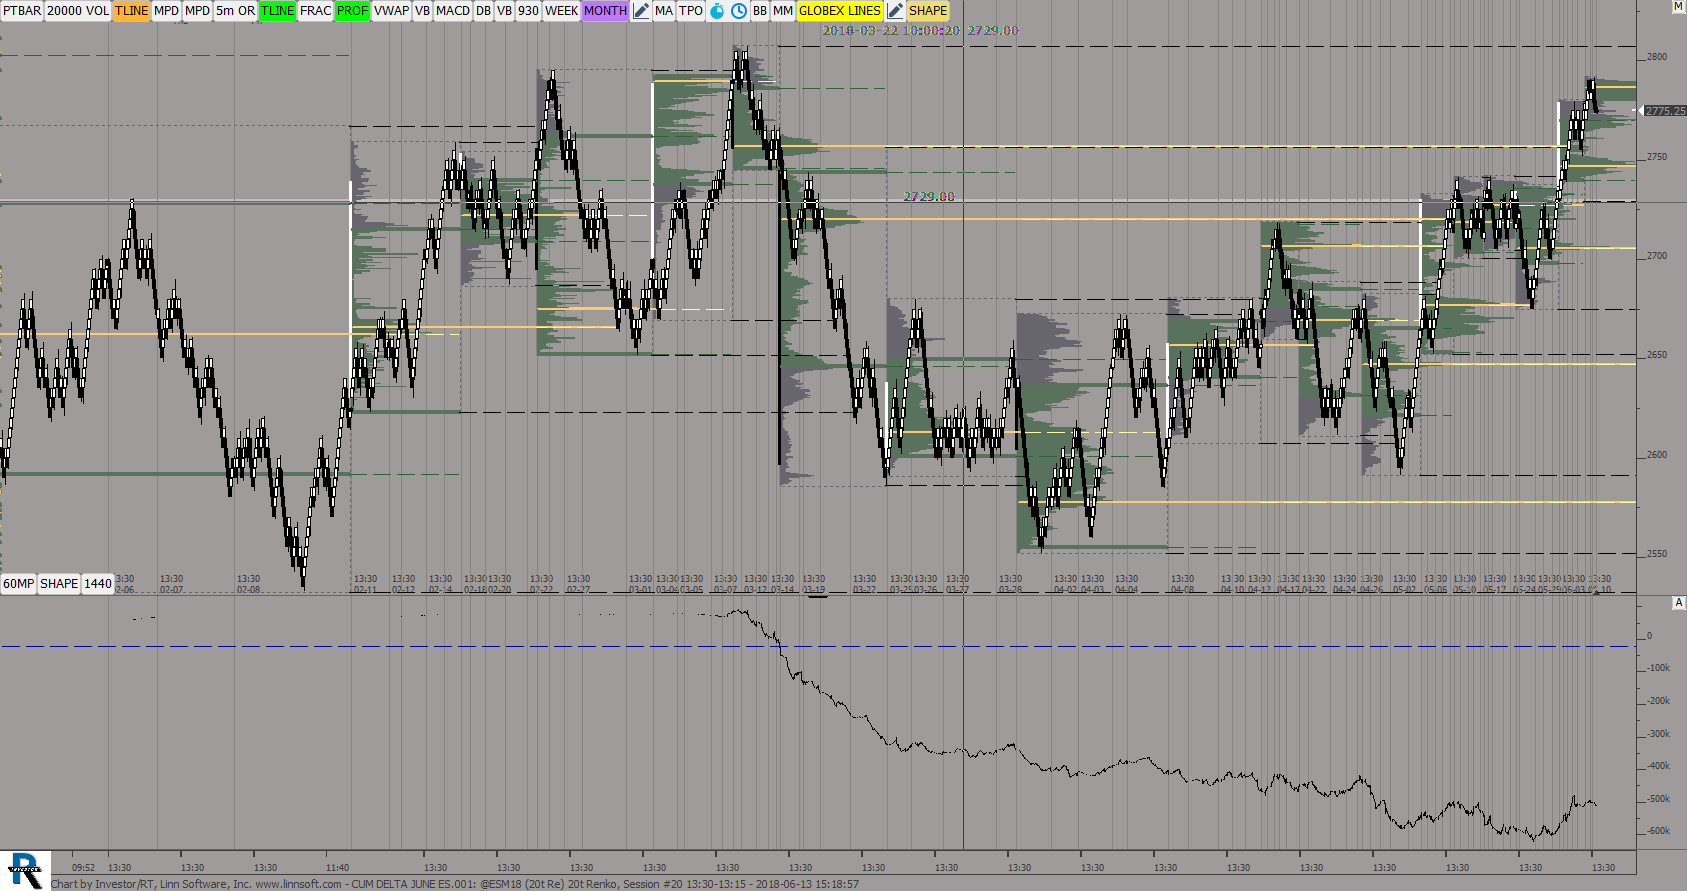 |
CUM DELTA JUNE ES (@ESM18) ES42 [totalcount]
7 years 6 months ago
This chart was uploaded by Investor/RT 13.3.3 showing symbol: @ESM18. |
View |
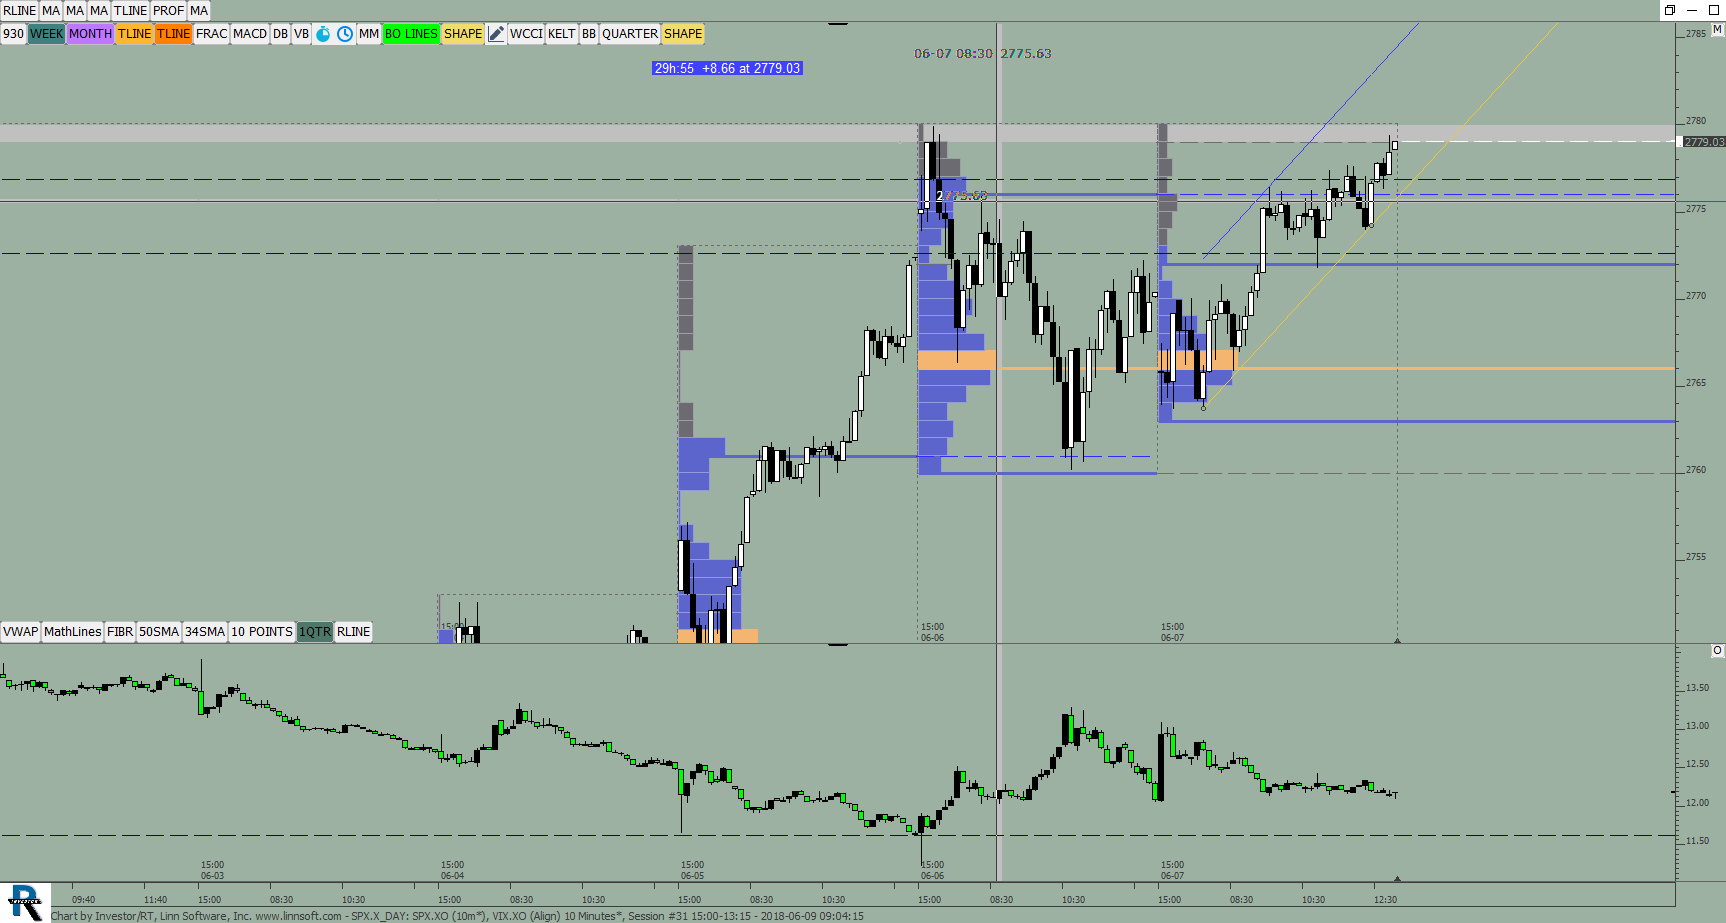 |
SPXX DAY (SPX.XO) ES42 [totalcount]
7 years 6 months ago
This chart was uploaded by Investor/RT 13.3.3 showing symbol: SPX.XO. |
View |
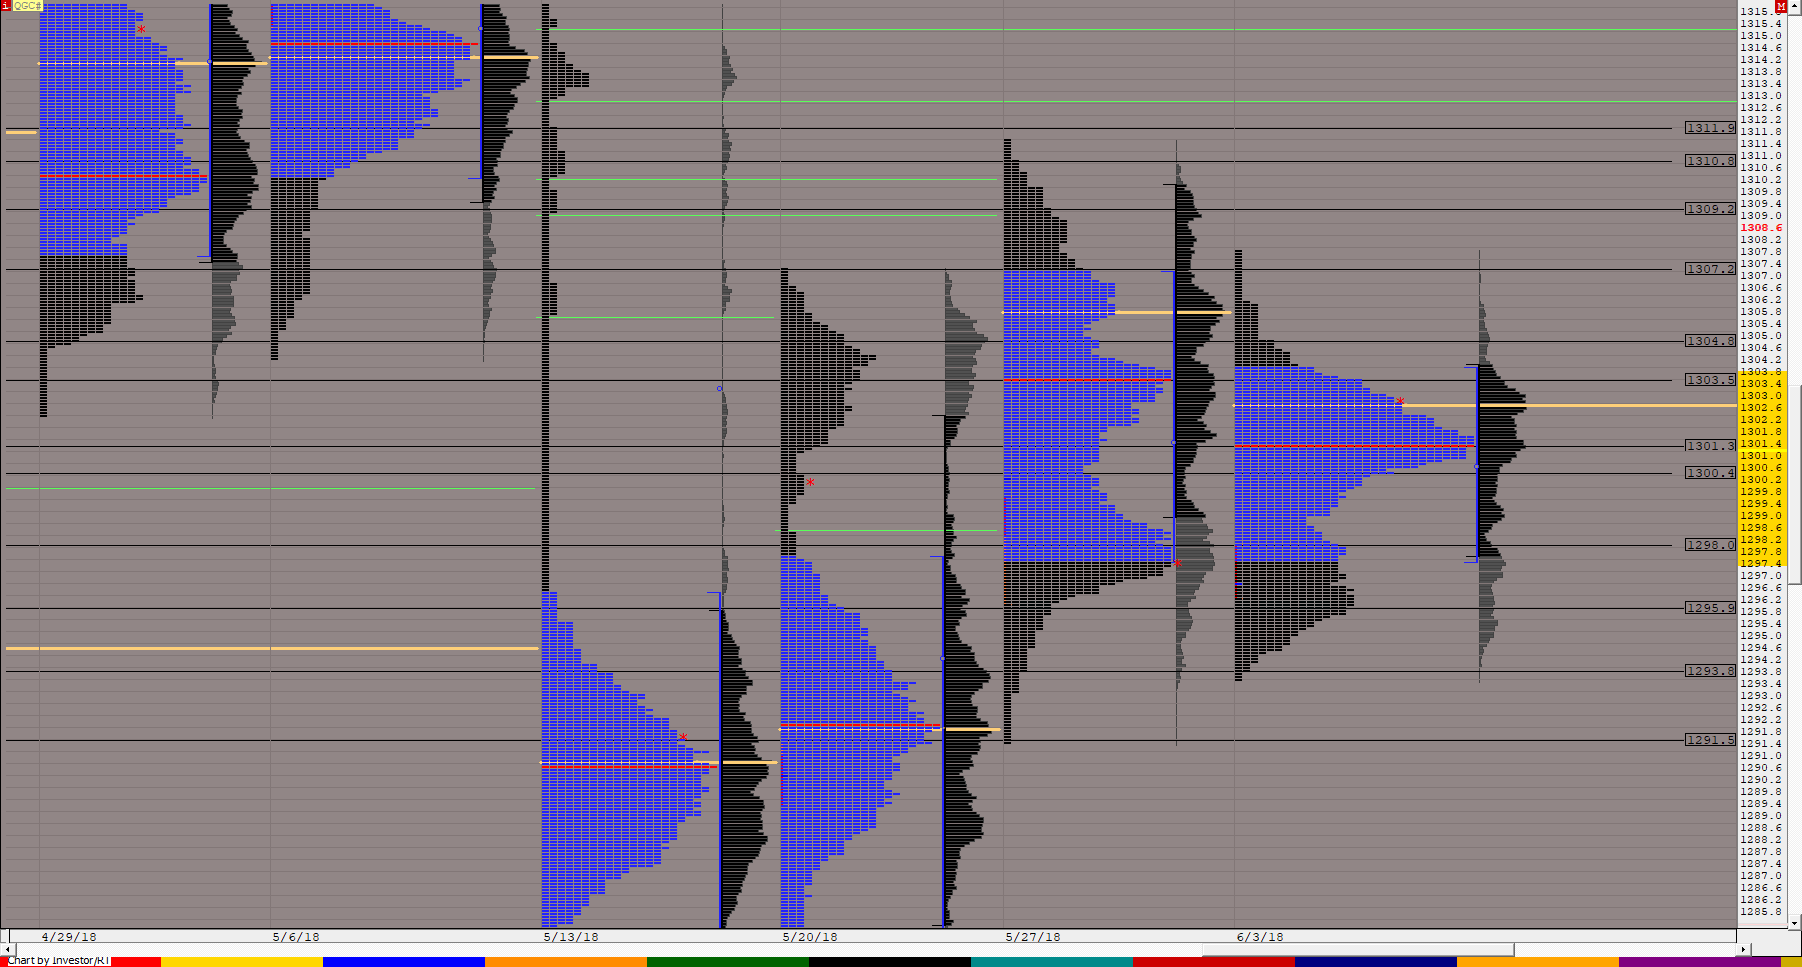 |
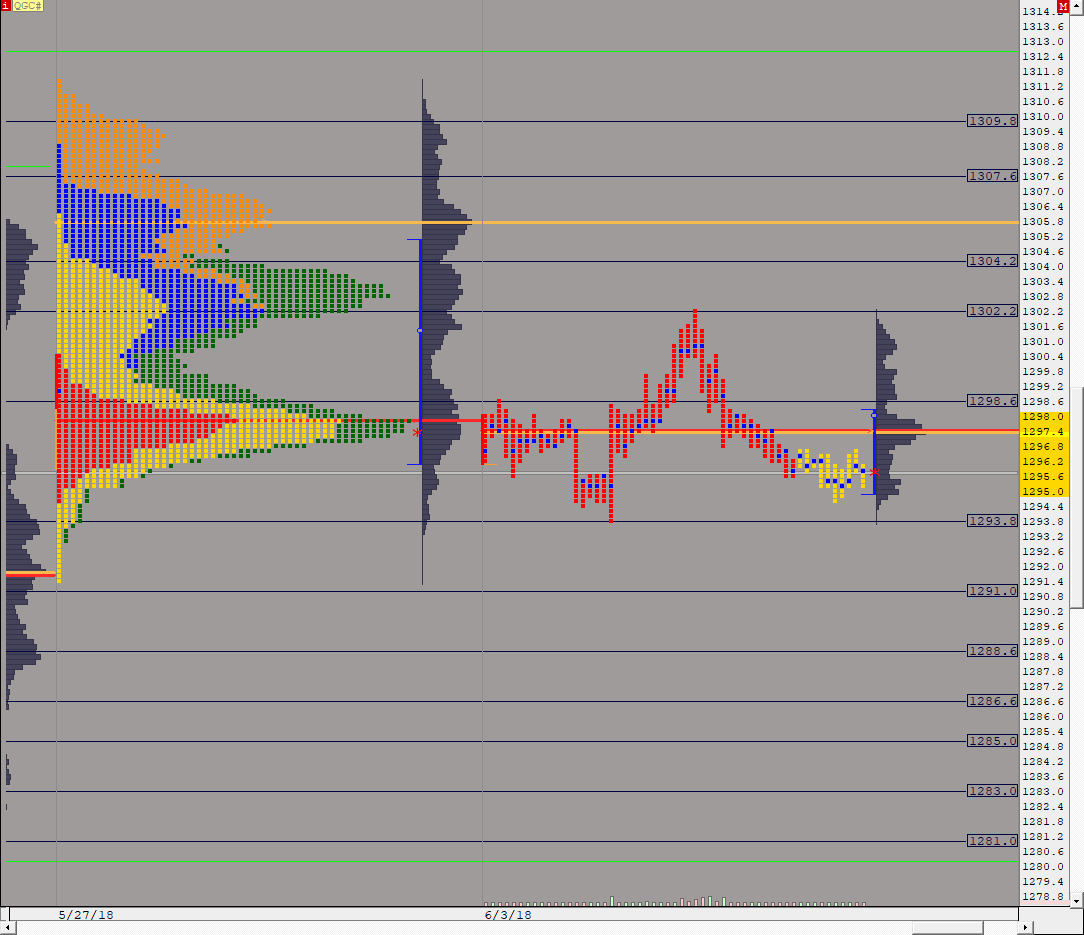
GC Layout003f (QGC#) ES42 [totalcount]
7 years 6 months ago
This chart was uploaded by Investor/RT 13.3.3 showing symbol: QGC#. |
View |
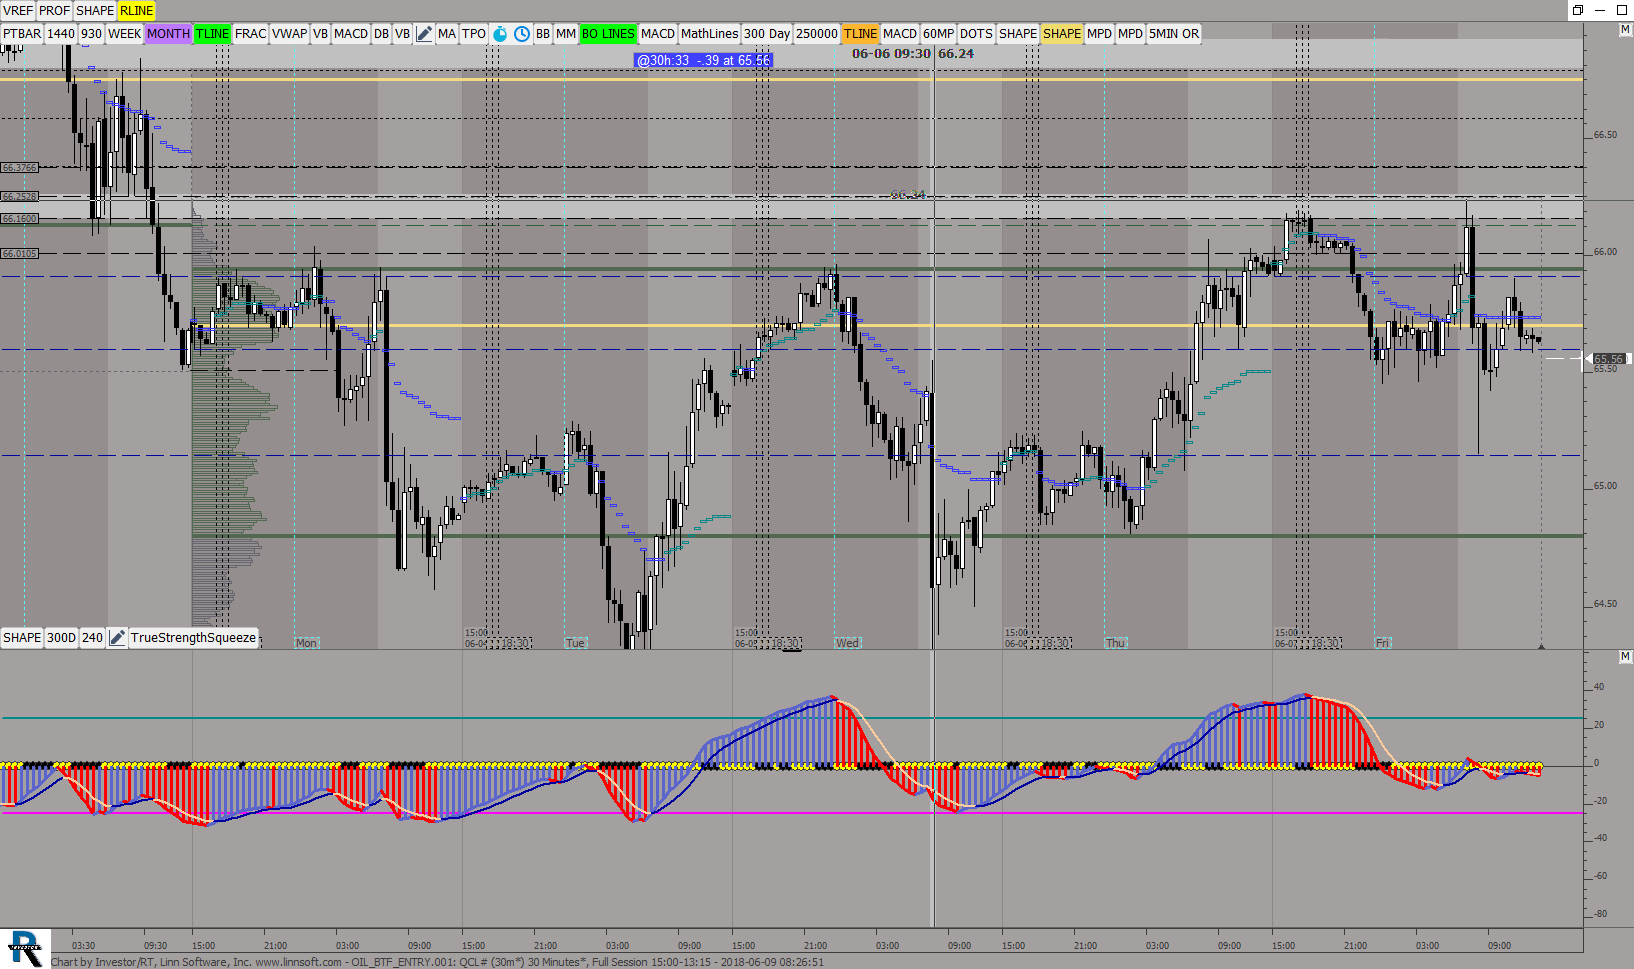 |
OIL BTF ENTRY (QCL#) ES42 [totalcount]
7 years 6 months ago
This chart was uploaded by Investor/RT 13.3.3 showing symbol: QCL#. |
View |
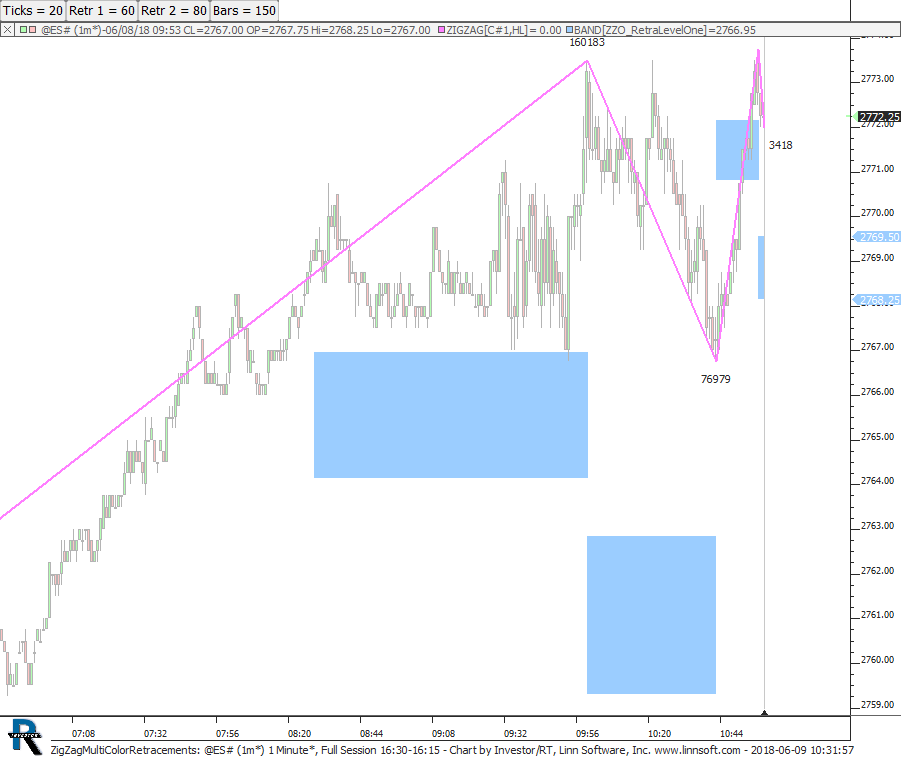 |
ZigZagMultiColorRetracements (@ES#) cpayne [totalcount]
7 years 6 months ago
This chart was uploaded by Investor/RT 13.3.3 showing symbol: @ES#. |
View |
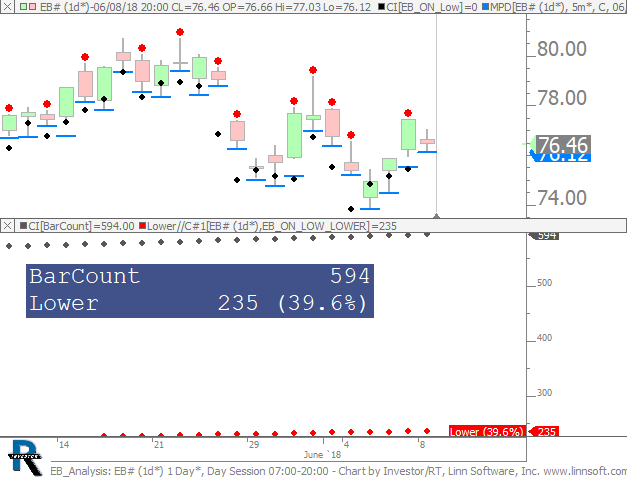 |
EB Analysis (EB#) cpayne [totalcount]
7 years 6 months ago
Analysis of IB Overnight Lows. This chart was uploaded by Investor/RT 13.3.4 showing symbol: EB#. |
View |
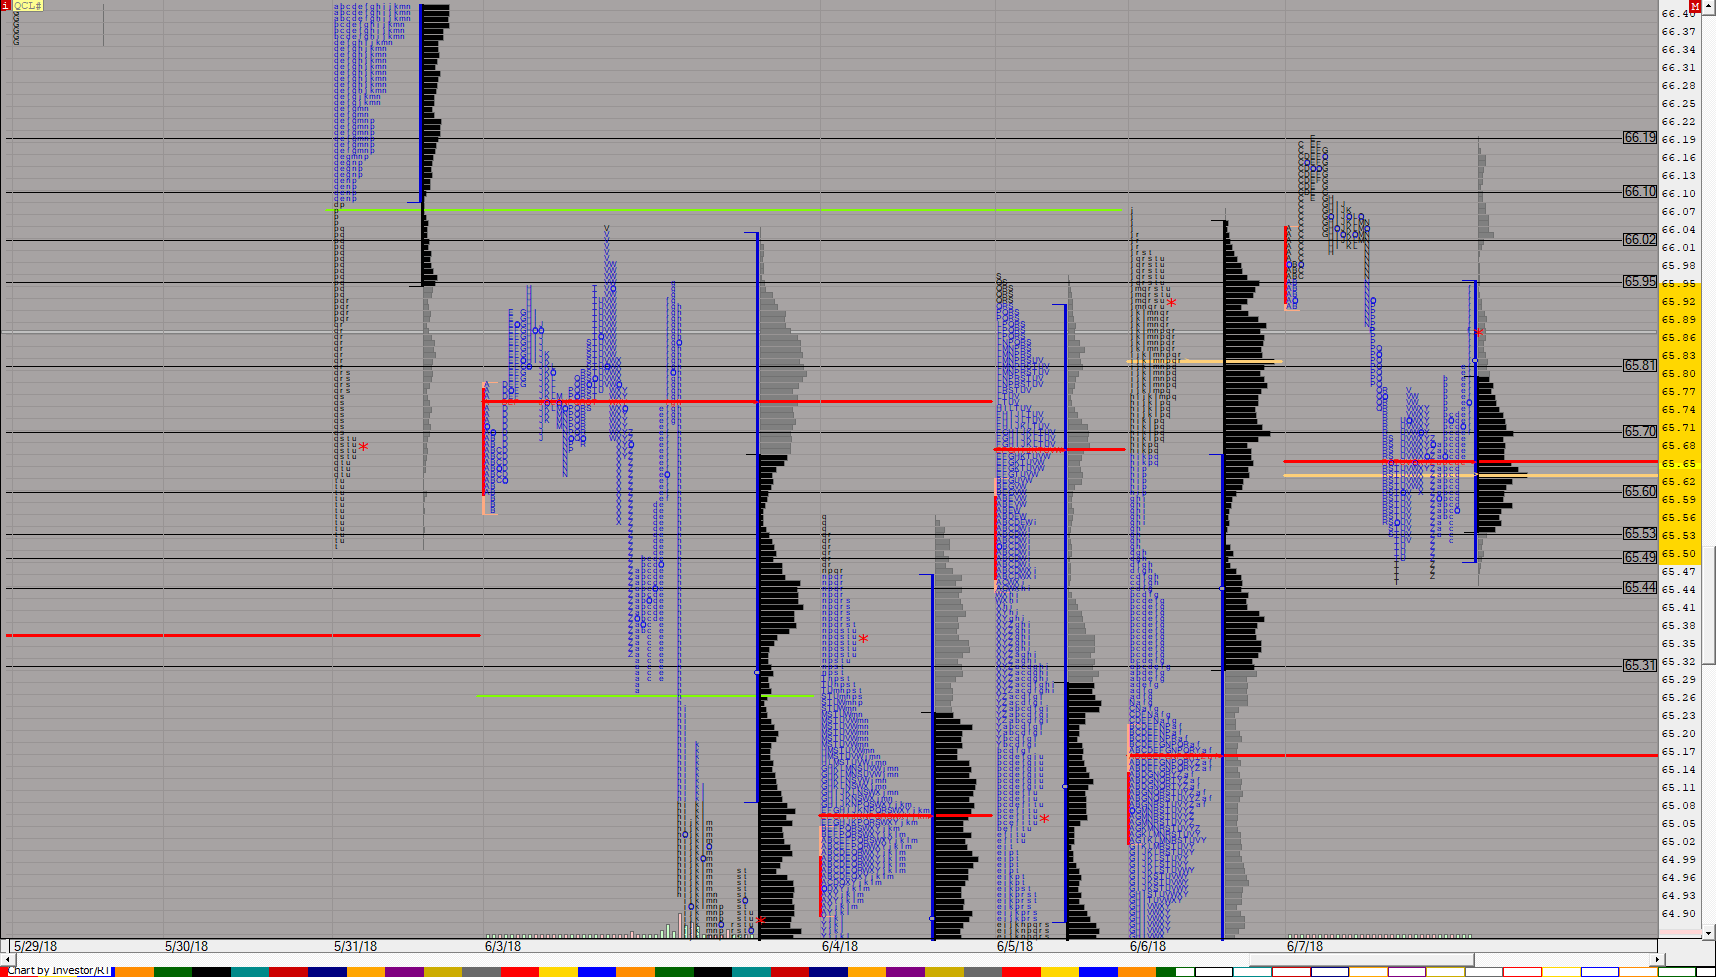 |
MP CL (QCL#) ES42 [totalcount]
7 years 6 months ago
This chart was uploaded by Investor/RT 13.3.3 showing symbol: QCL#. |
View |
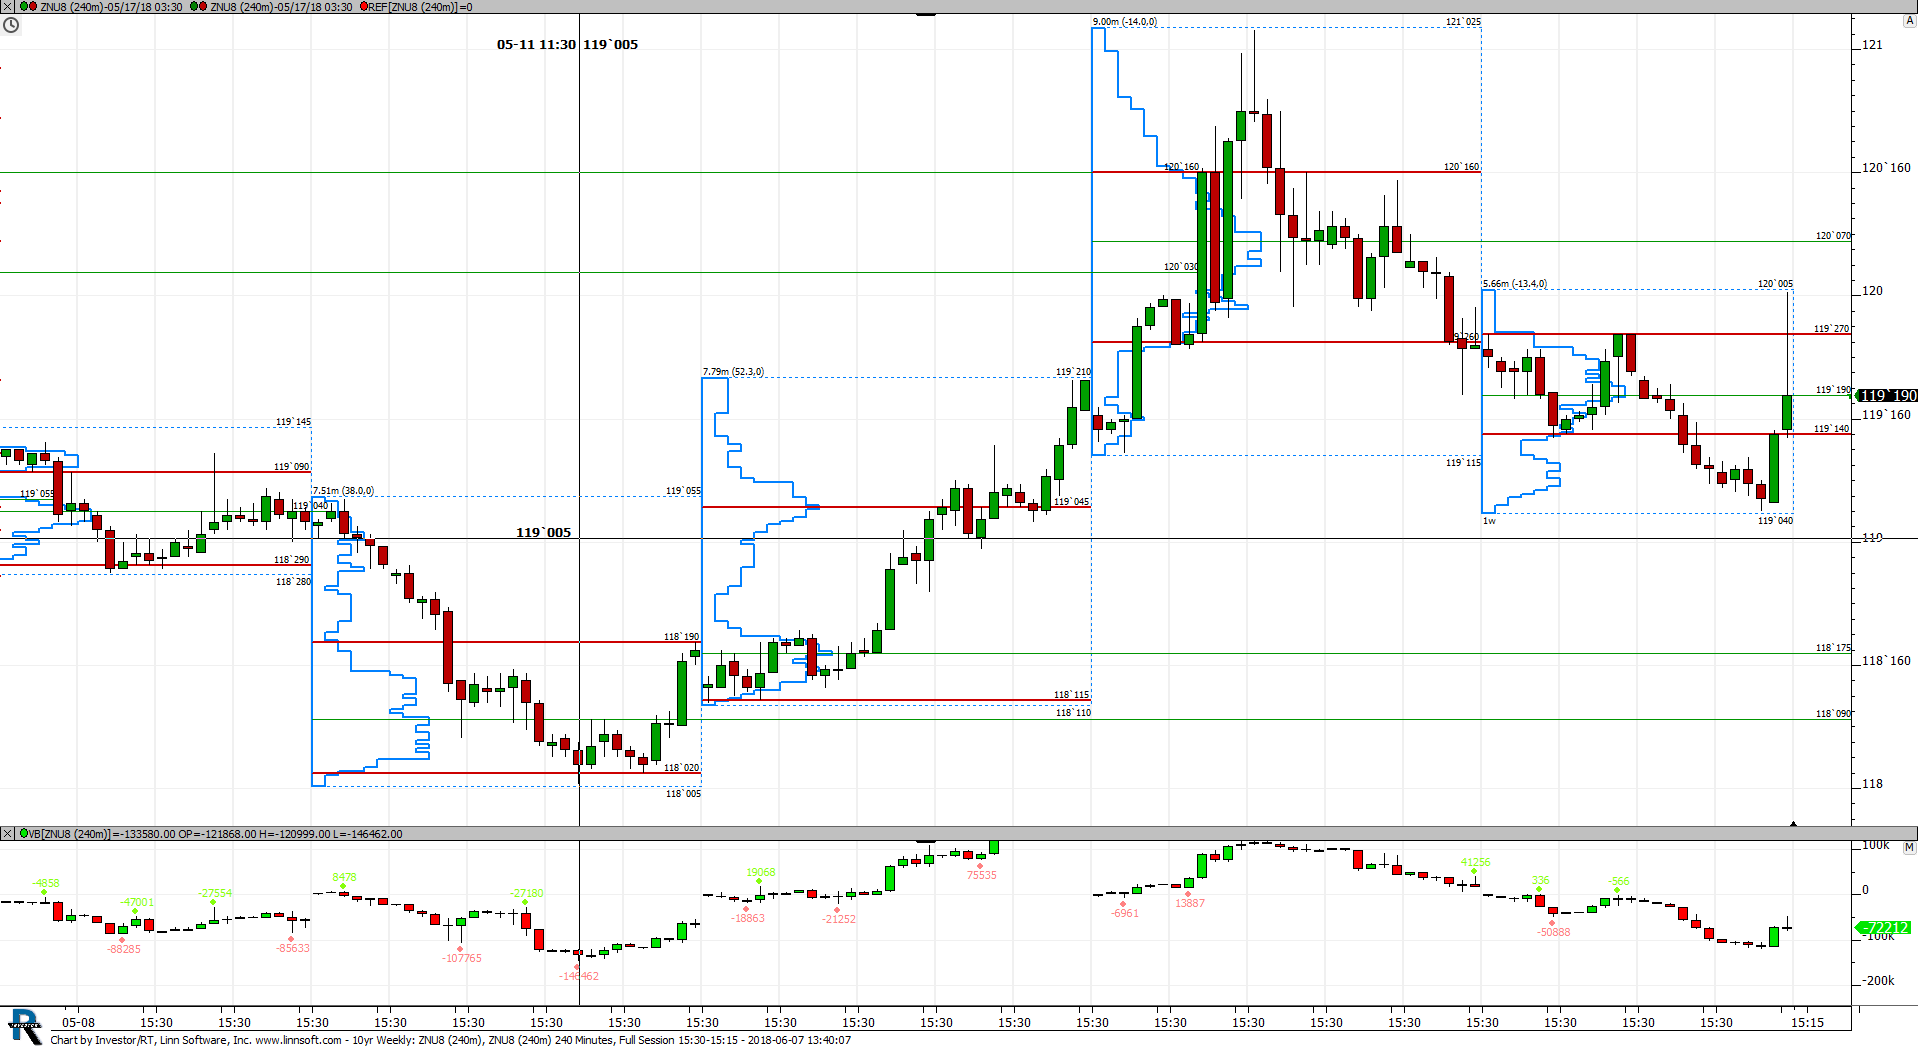 |
10yr Weekly (ZNU8) scottz46 [totalcount]
7 years 6 months ago
This chart was uploaded by Investor/RT 13.3.3 showing symbol: ZNU8. |
View |
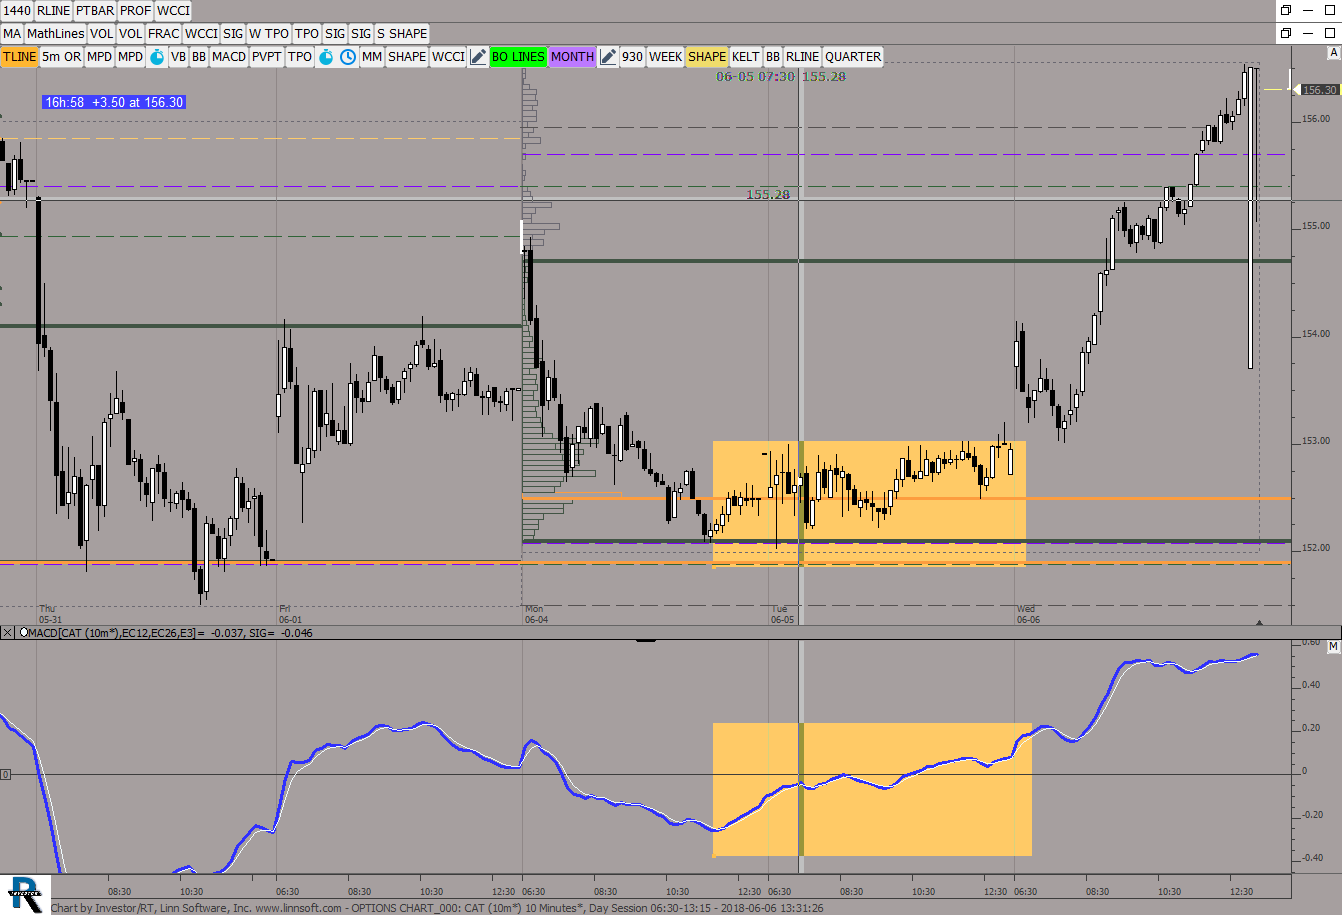 |
OPTIONS CHART (CAT) ES42 [totalcount]
7 years 6 months ago
This chart was uploaded by Investor/RT 13.3.3 showing symbol: CAT. |
View |
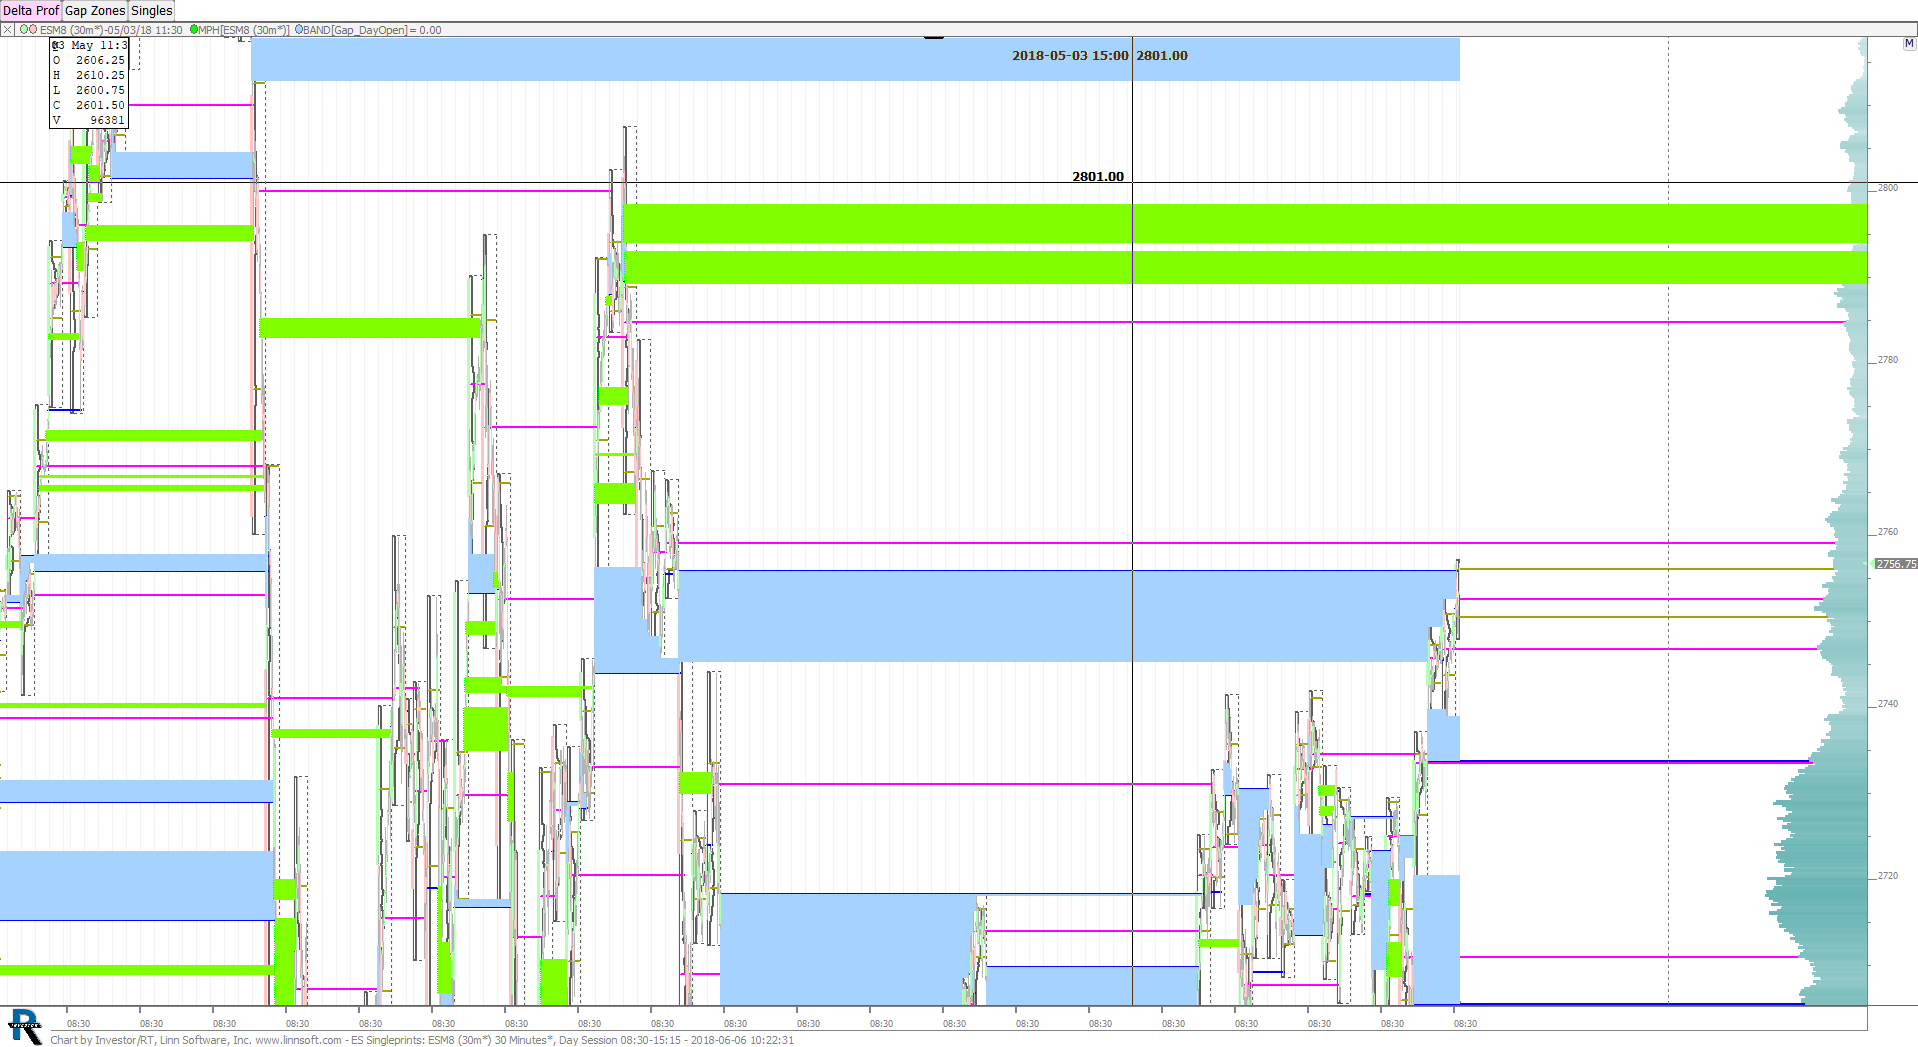 |
ES Singleprints (ESM8) scottz46 [totalcount]
7 years 6 months ago
This chart was uploaded by Investor/RT 13.3.3 showing symbol: ESM8. |
View |
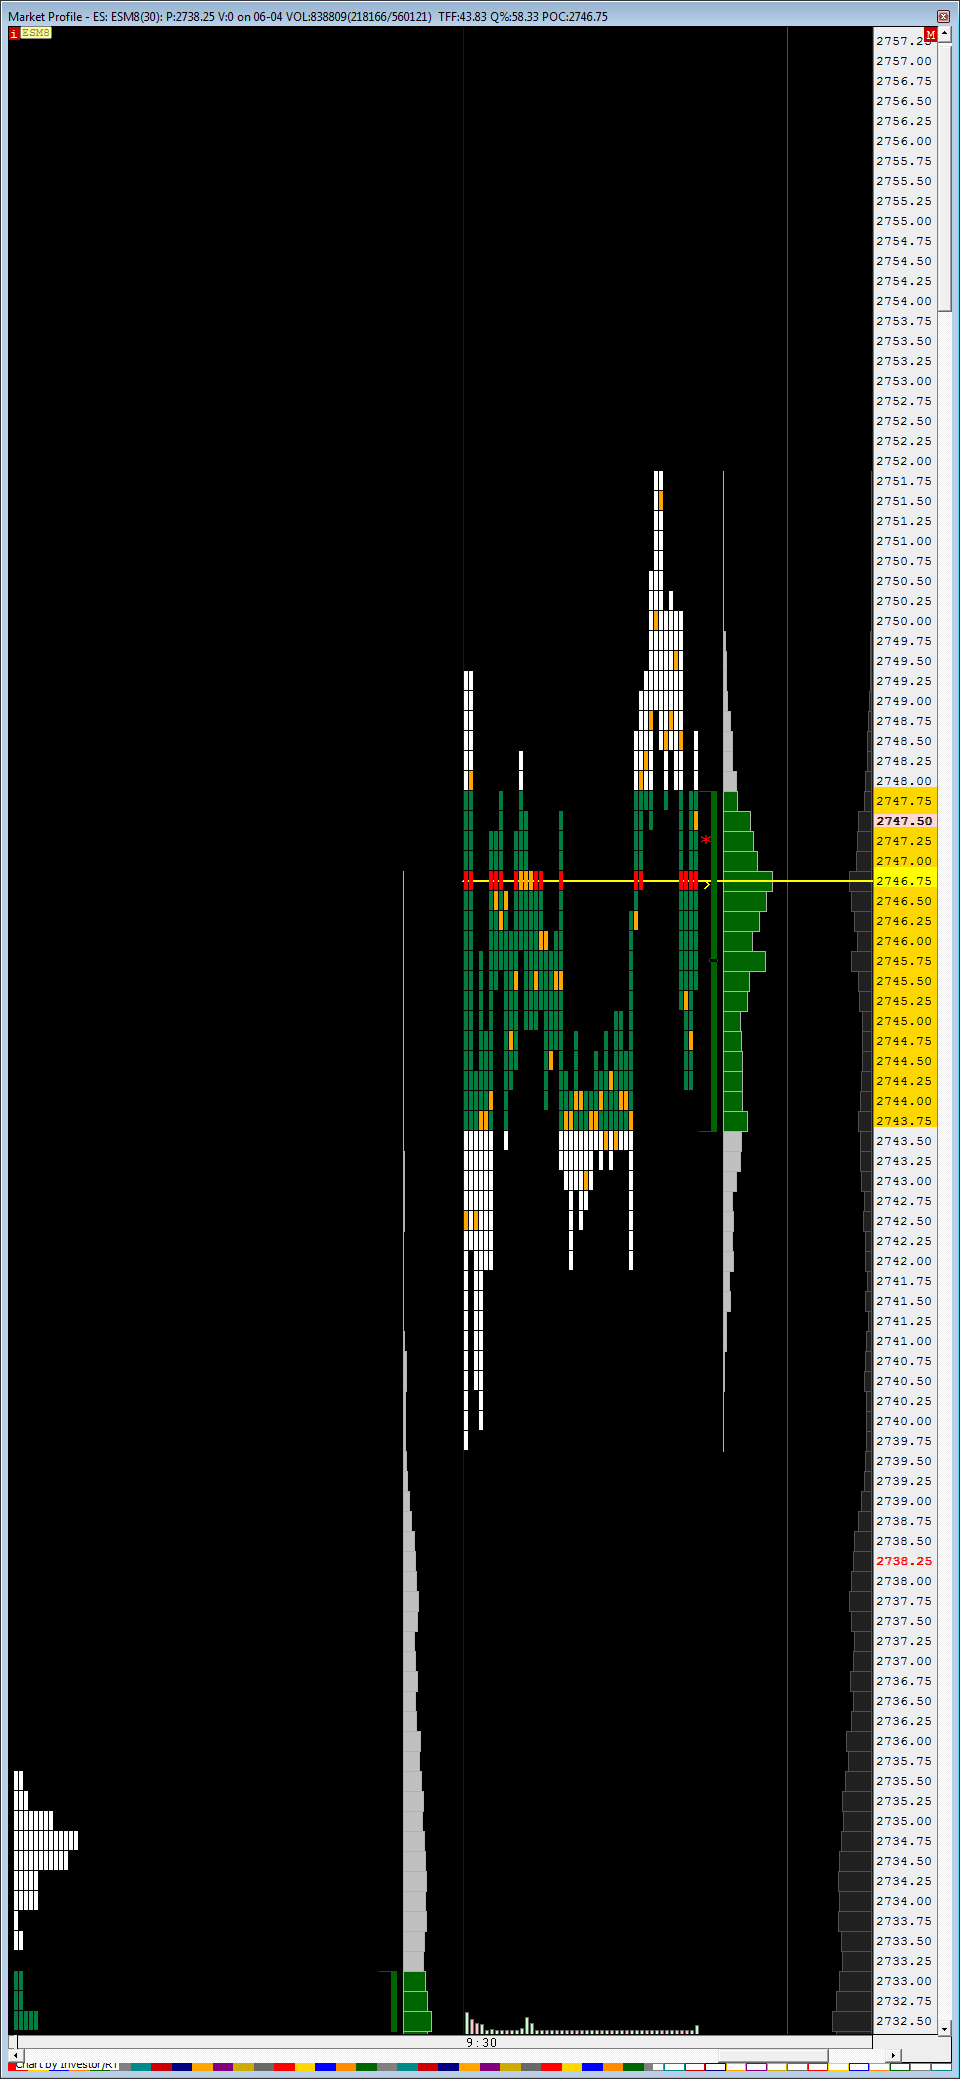 |
Market Profile ES (ESM8) carlosleon2005 [totalcount]
7 years 6 months ago
This chart was uploaded by Investor/RT 13.3.3 showing symbol: ESM8. |
View |
 |
MP GLOBEX GOLD (QGC#) ES42 [totalcount]
7 years 6 months ago
This chart was uploaded by Investor/RT 13.3.3 showing symbol: QGC#. |
View |
 |
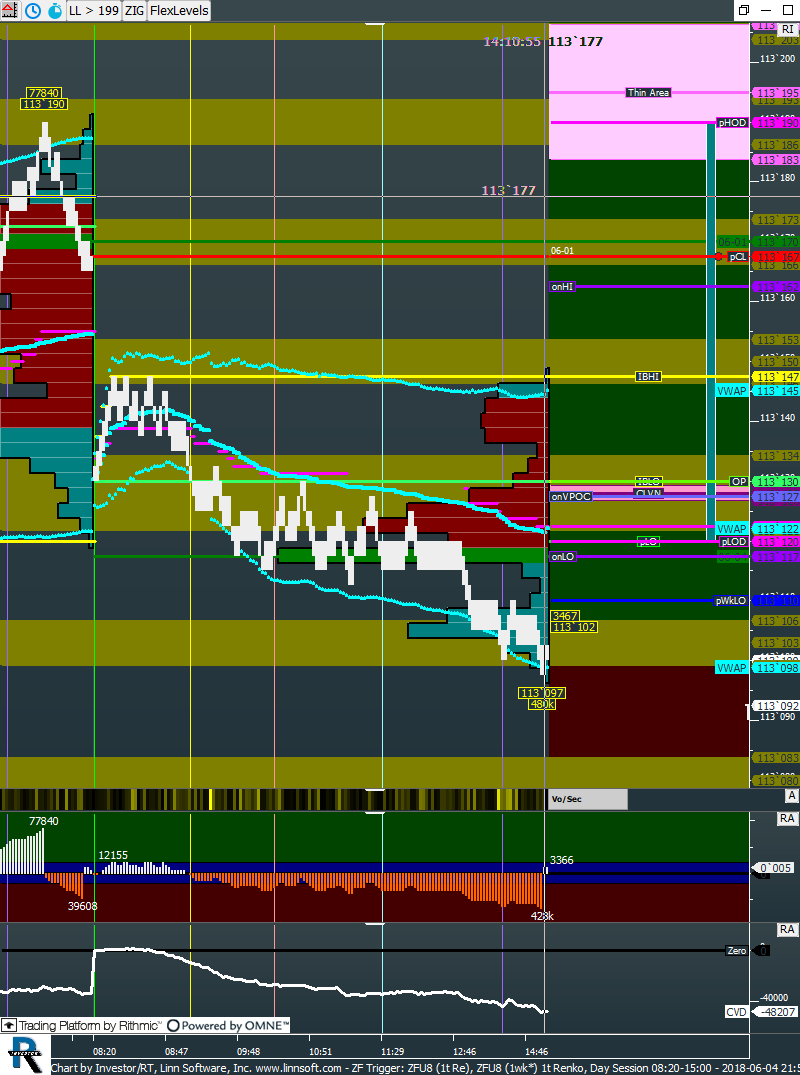
ZF Levels (ZFU8) Dylan Cleary [totalcount]
7 years 6 months ago
This chart was uploaded by Investor/RT 13.3.3 showing symbol: ZFU8. |
View |
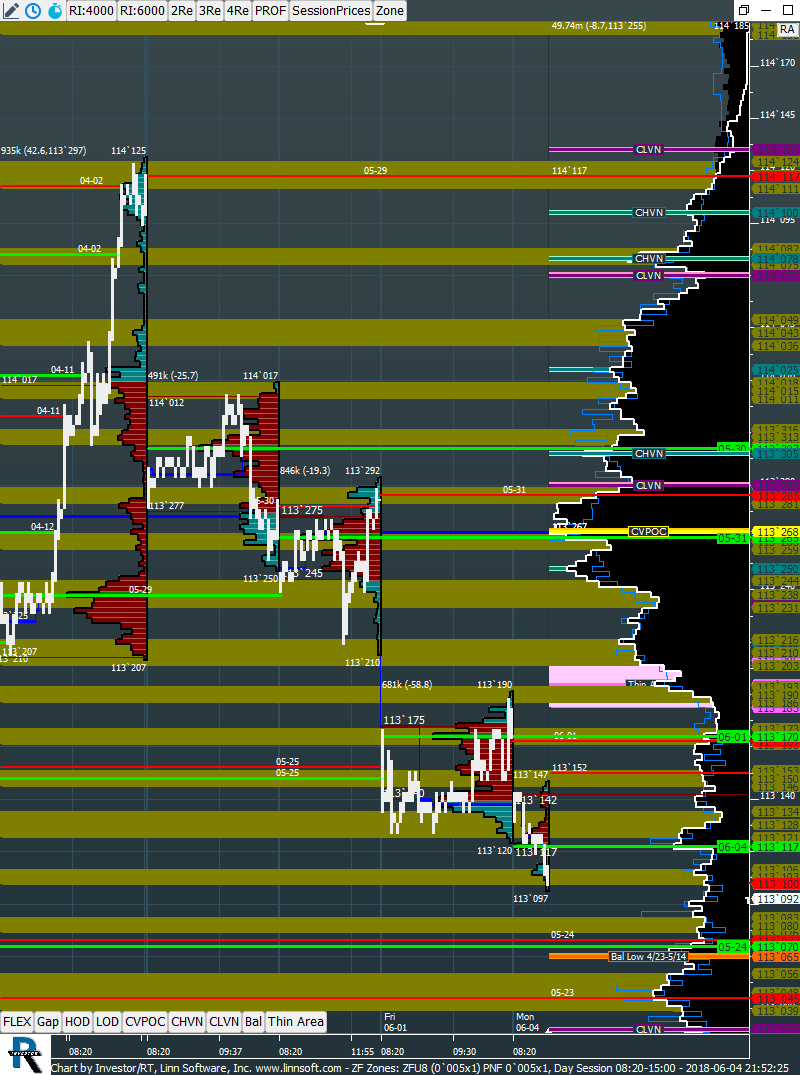 |
ZF Zones (ZFU8) Dylan Cleary [totalcount]
7 years 6 months ago
This chart was uploaded by Investor/RT 13.3.3 showing symbol: ZFU8. |
View |
 |
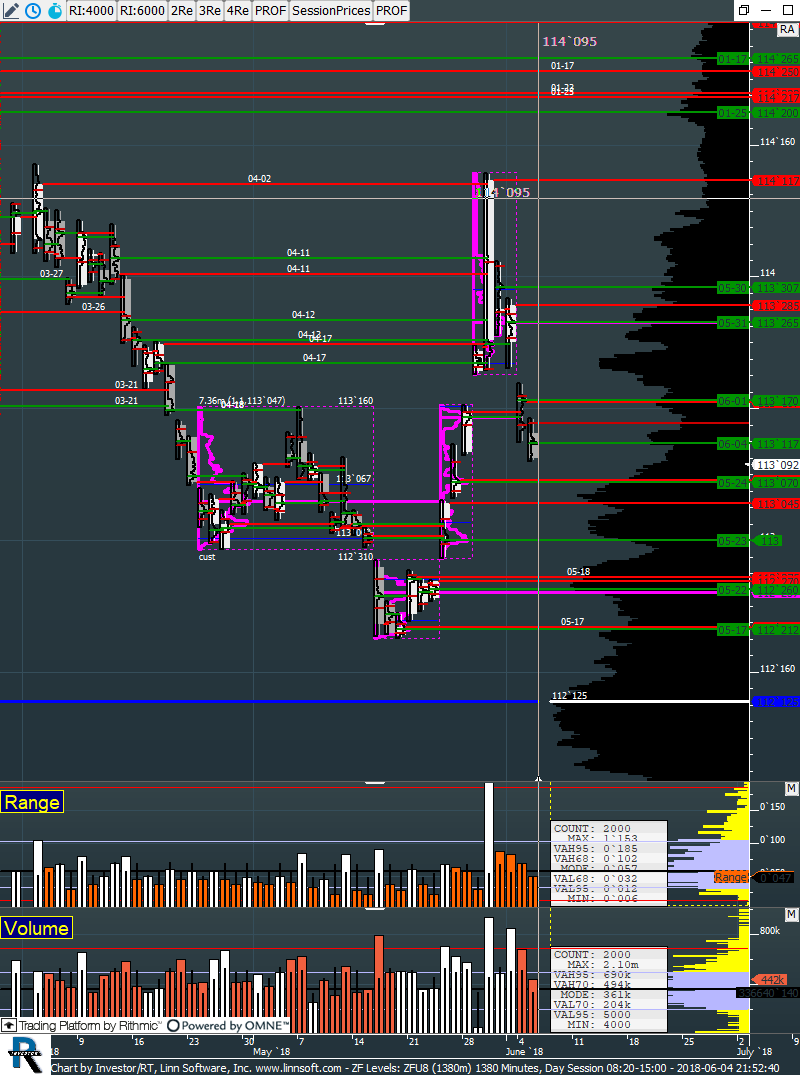
ZF Trigger (ZFU8) Dylan Cleary [totalcount]
7 years 6 months ago
This chart was uploaded by Investor/RT 13.3.3 showing symbol: ZFU8. |
View |
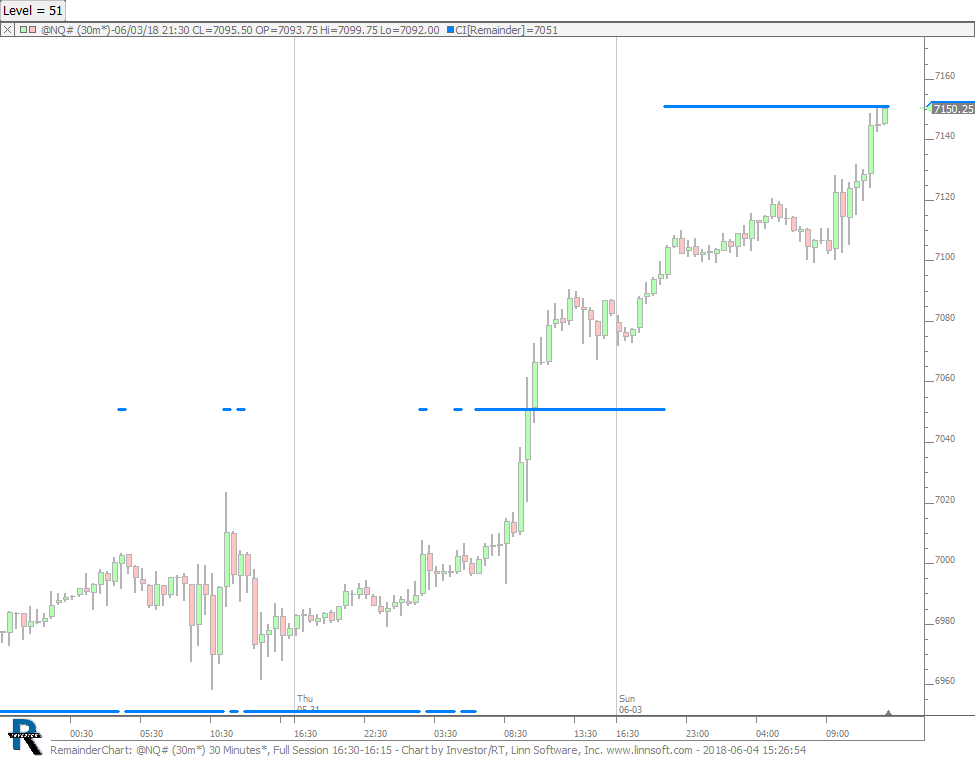 |
RemainderChart (@NQ#) cpayne [totalcount]
7 years 6 months ago
Remainder Chart. This chart was uploaded by Investor/RT 13.3.4 showing symbol: @NQ#. |
View |
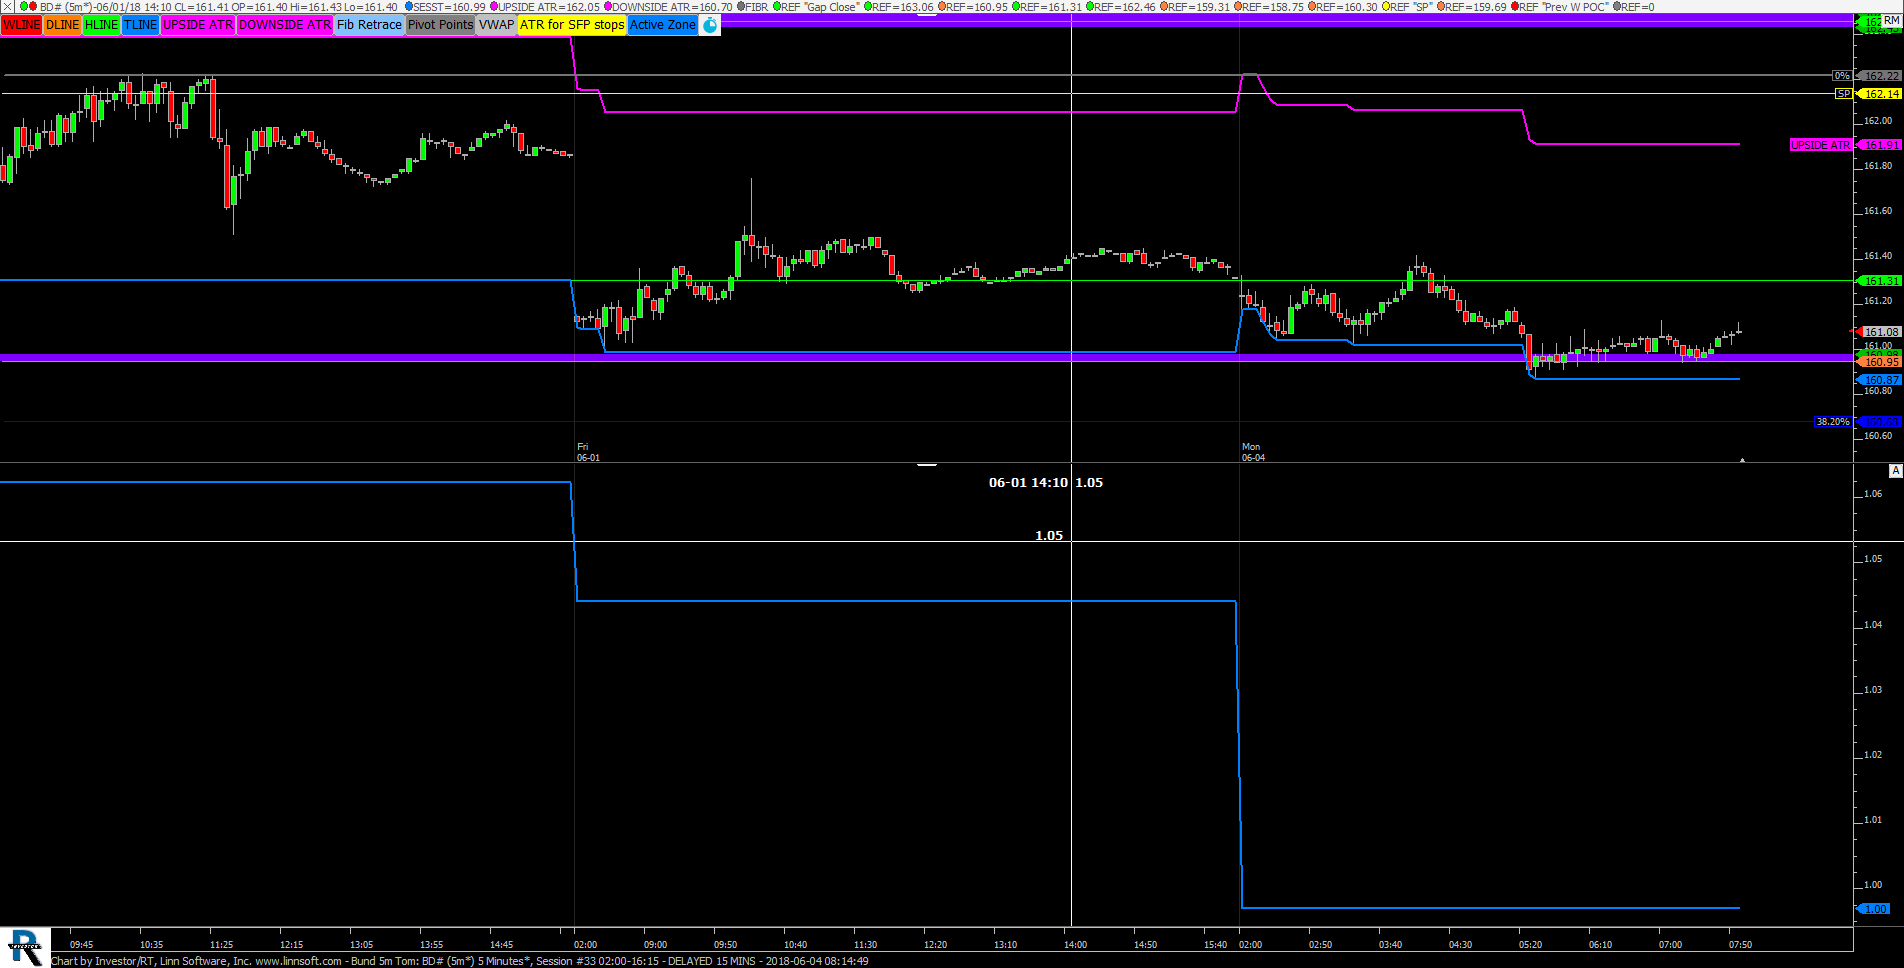 |
Bund 5m Tom (BD#) scooke [totalcount]
7 years 6 months ago
This chart was uploaded by Investor/RT 13.3.3 showing symbol: BD#. |
View |
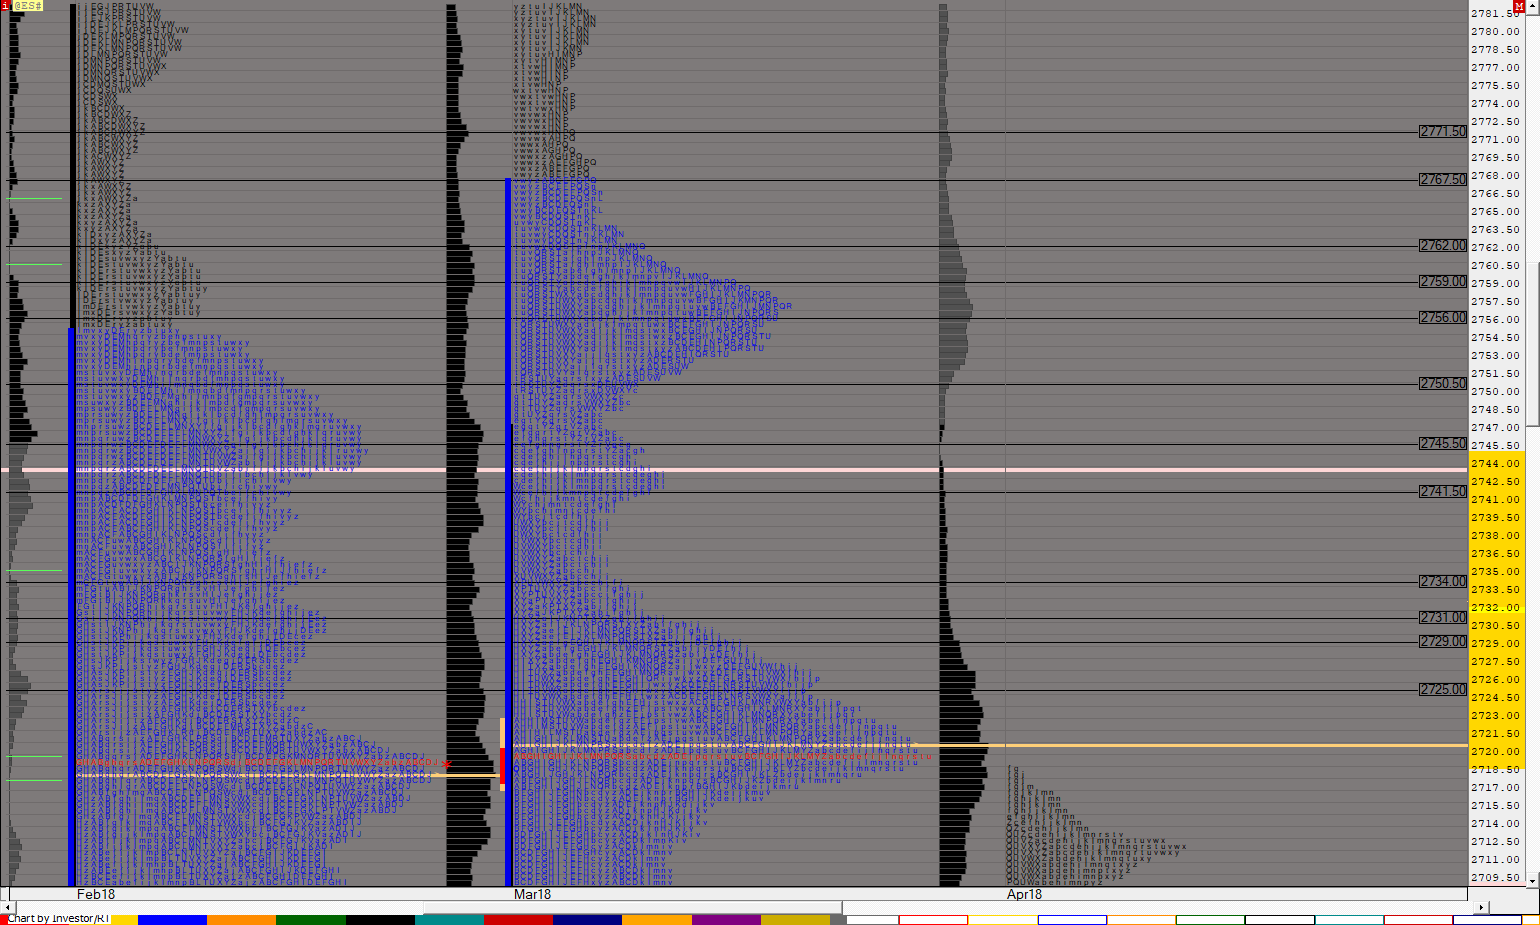 |
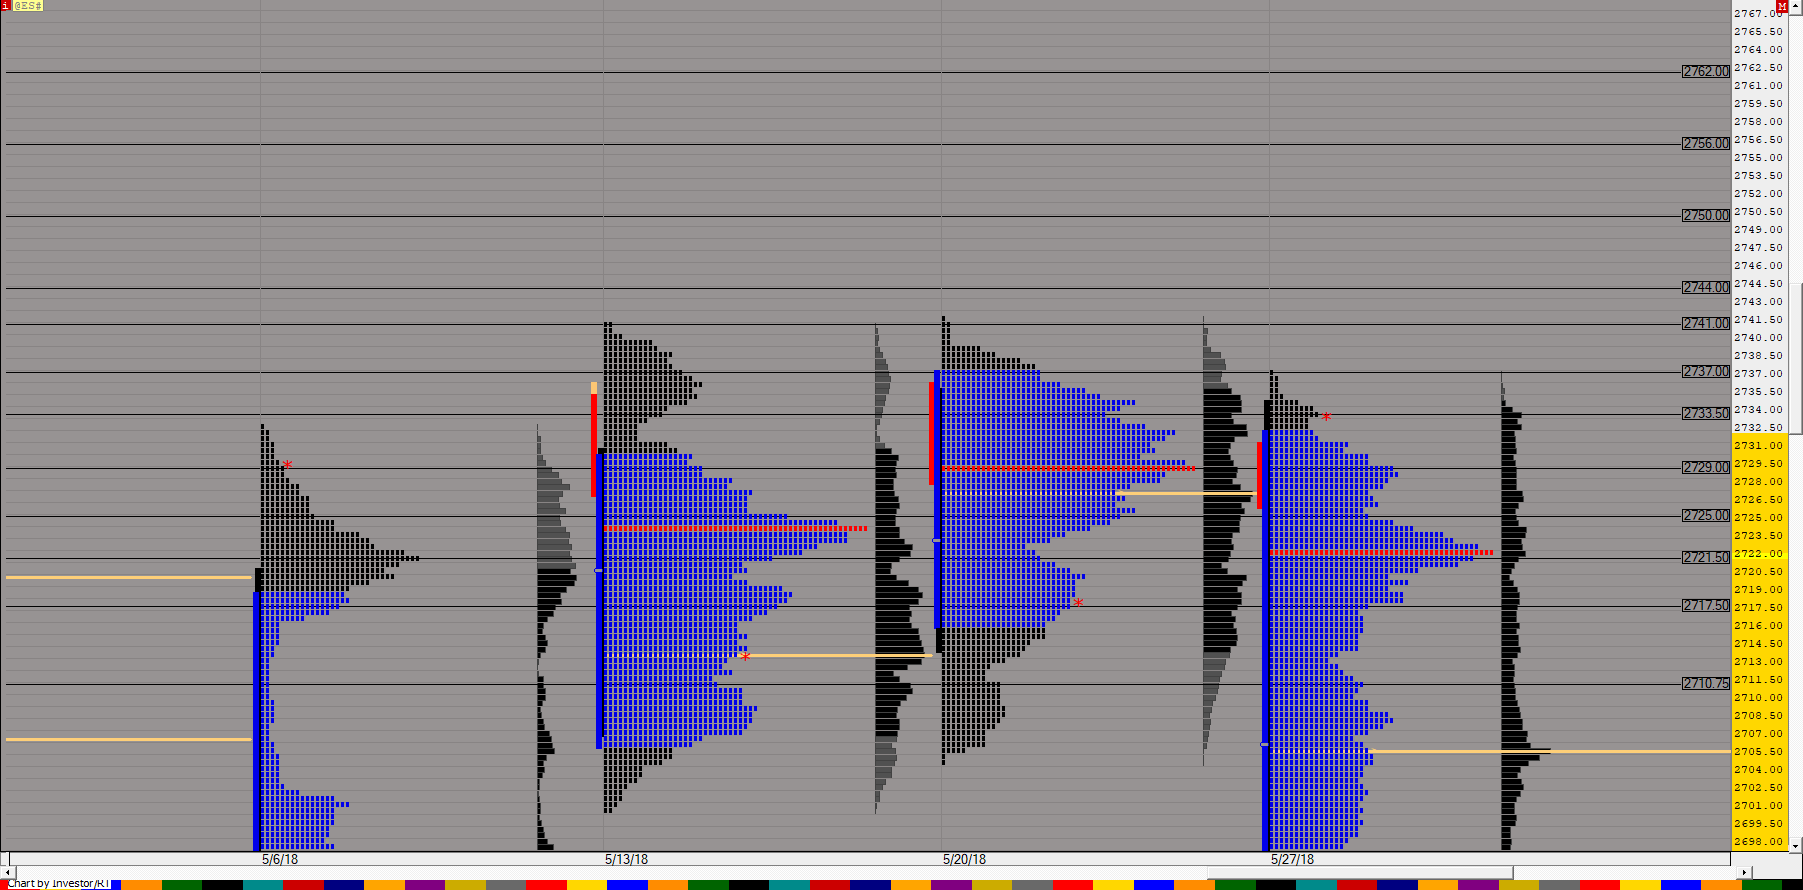
Market Profile June (@ES#) ES42 [totalcount]
7 years 6 months ago
This chart was uploaded by Investor/RT 13.3.3 showing symbol: @ES#. |
View |
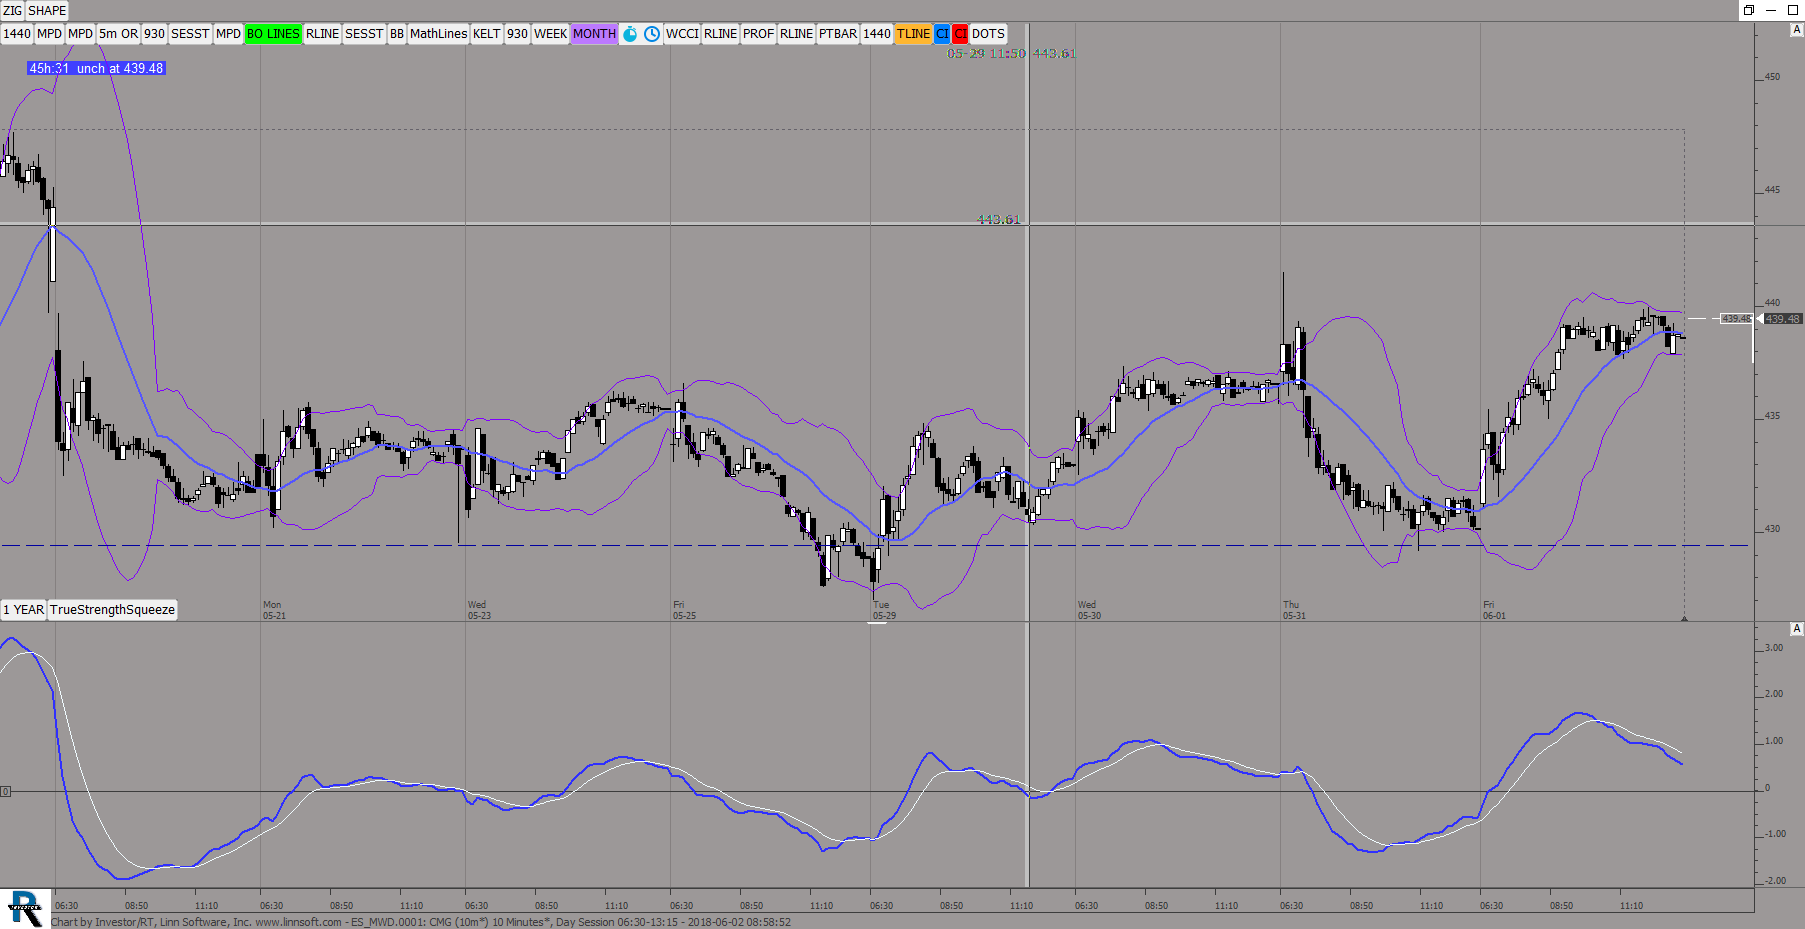 |
ES MWD (CMG) ES42 [totalcount]
7 years 6 months ago
This chart was uploaded by Investor/RT 13.3.3 showing symbol: CMG. |
View |
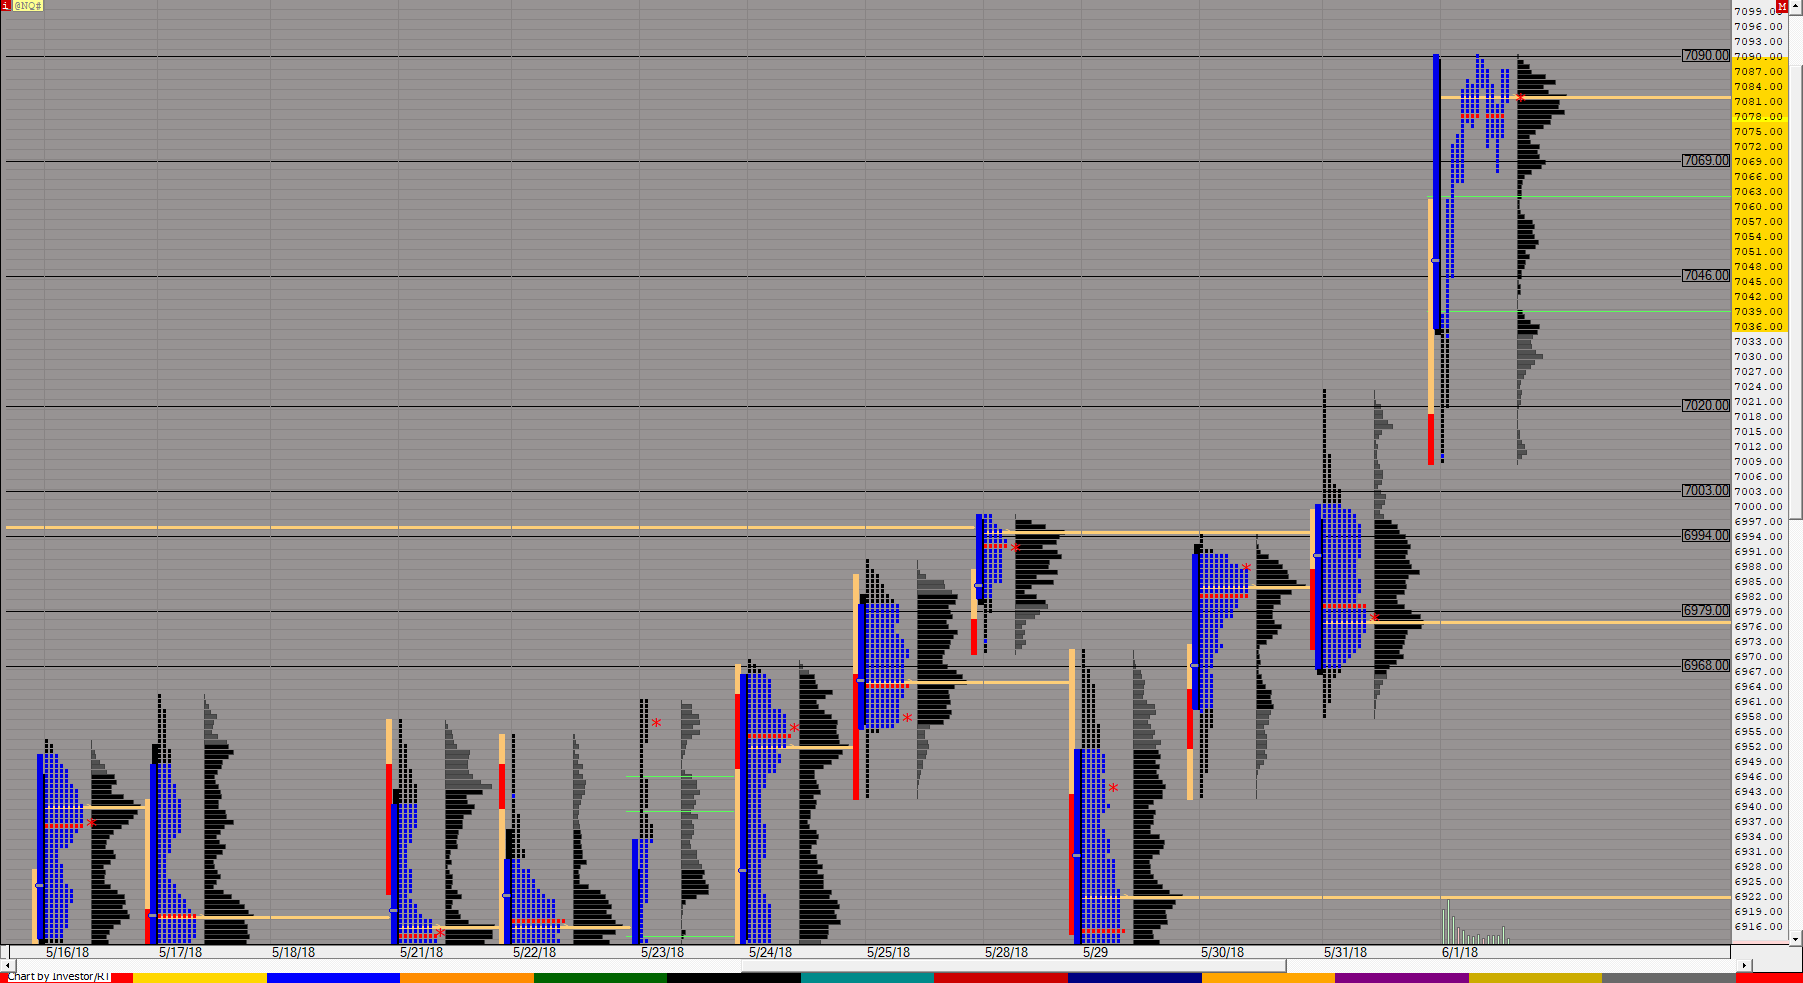 |
Market Profile NQ (@NQ#) ES42 [totalcount]
7 years 6 months ago
This chart was uploaded by Investor/RT 13.3.3 showing symbol: @NQ#. |
View |
 |
Market Profile Day Night (@ES#) ES42 [totalcount]
7 years 6 months ago
This chart was uploaded by Investor/RT 13.3.3 showing symbol: @ES#. |
View |
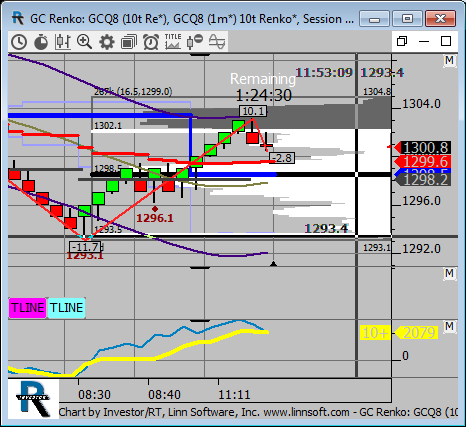 |
GC Renko (GCQ8) Quantum Leap [totalcount]
7 years 6 months ago
This chart was uploaded by Investor/RT 13.3.3 showing symbol: GCQ8. |
View |
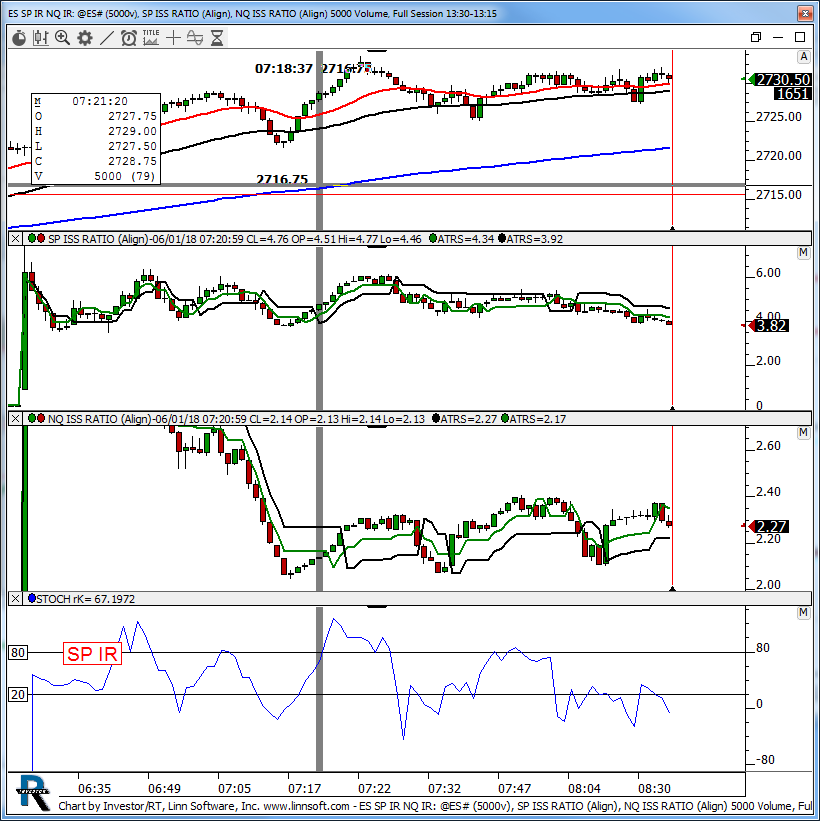 |
ES SP IR NQ IR (@ES#) kencassorla [totalcount]
7 years 6 months ago
ad's. This chart was uploaded by Investor/RT 13.3.3 showing symbol: @ES#. |
View |
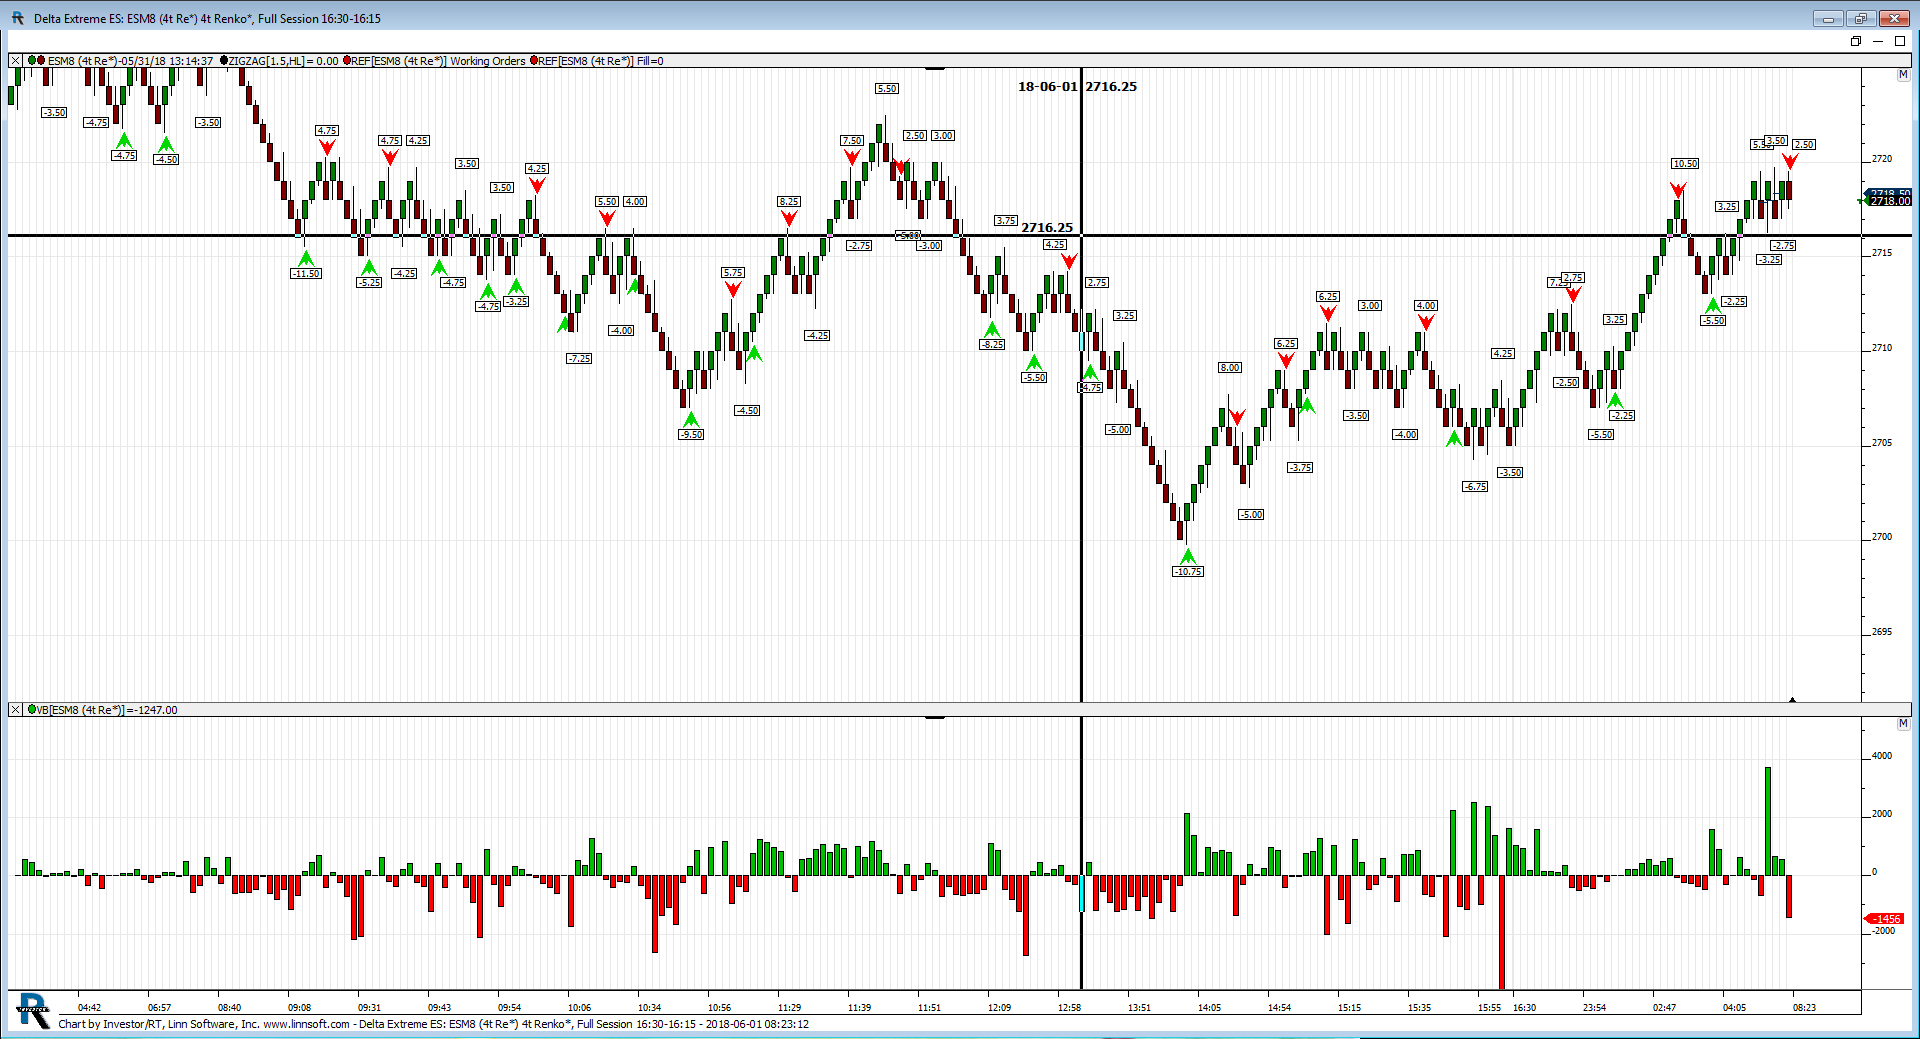 |
Delta Extreme ES (ESM8) Quantum Leap [totalcount]
7 years 6 months ago
This chart was uploaded by Investor/RT 13.3.3 showing symbol: ESM8. |
View |