 |
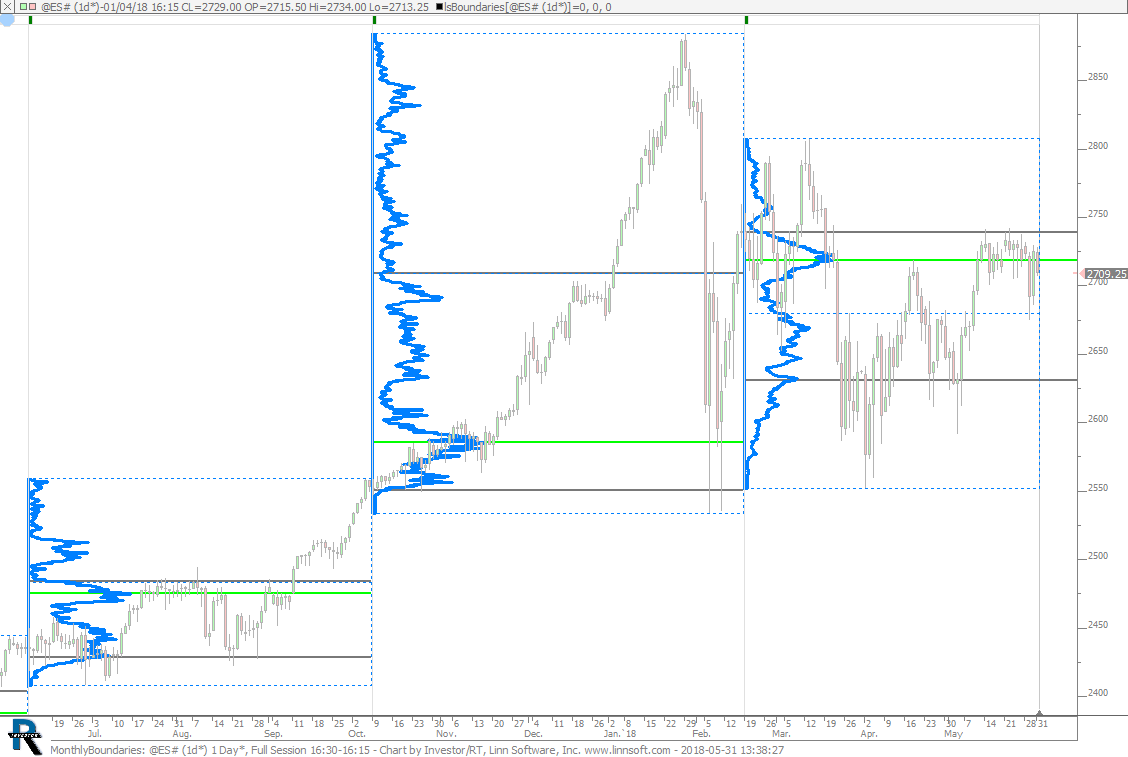
MonthlyBoundaries (@ES#) cpayne [totalcount]
7 years 6 months ago
Monthly Boundaries. This chart was uploaded by Investor/RT 13.3.4 showing symbol: @ES#. |
View |
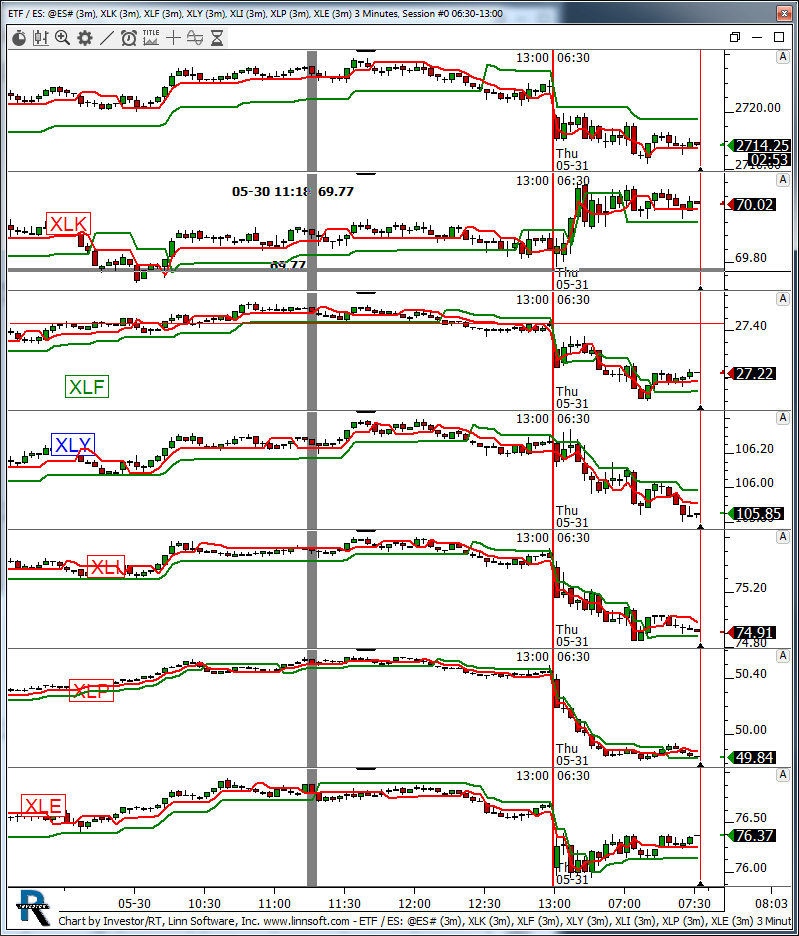 |
ETF ES (@ES#) kencassorla [totalcount]
7 years 6 months ago
etf's. This chart was uploaded by Investor/RT 13.3.3 showing symbol: @ES#. |
View |
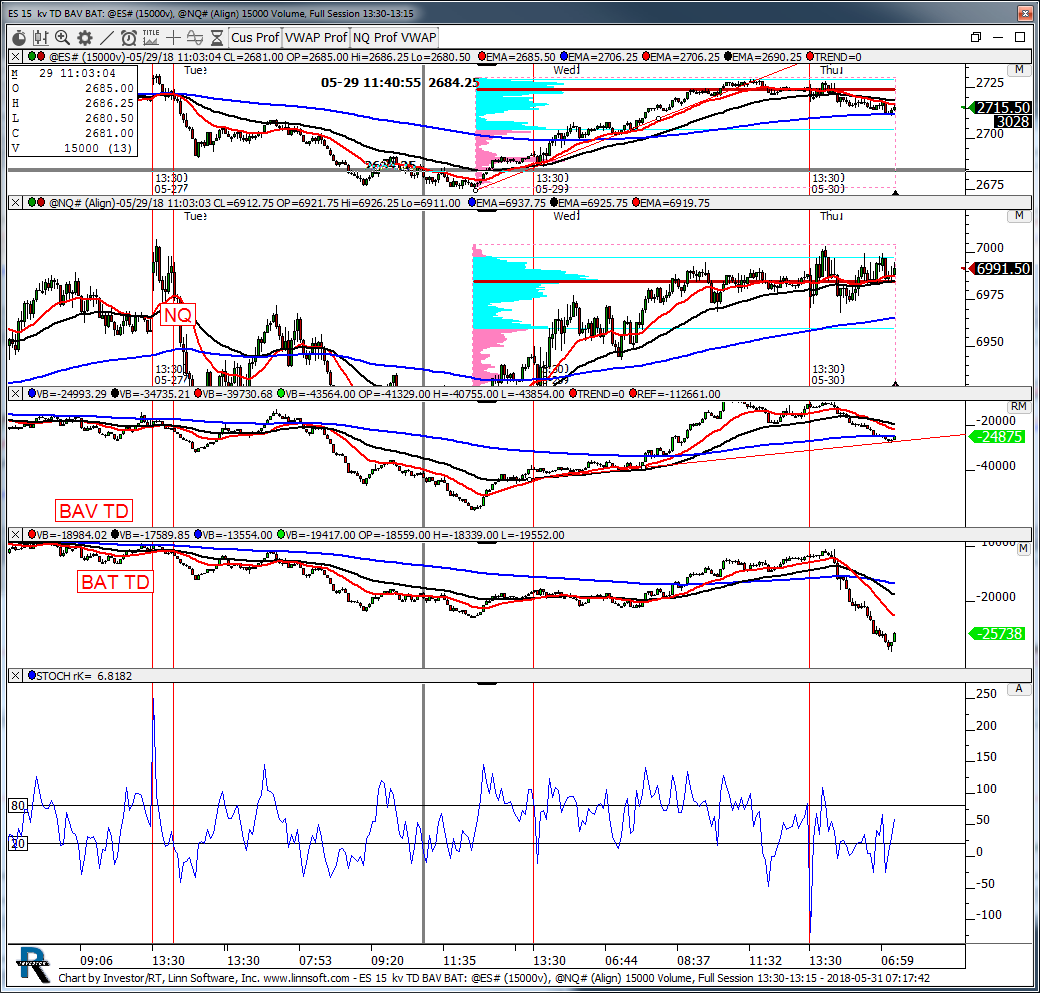 |
ES 15 kv TD BAV BAT (@ES#) kencassorla [totalcount]
7 years 6 months ago
15 kv ou resistance. This chart was uploaded by Investor/RT 13.3.3 showing symbol: @ES#. |
View |
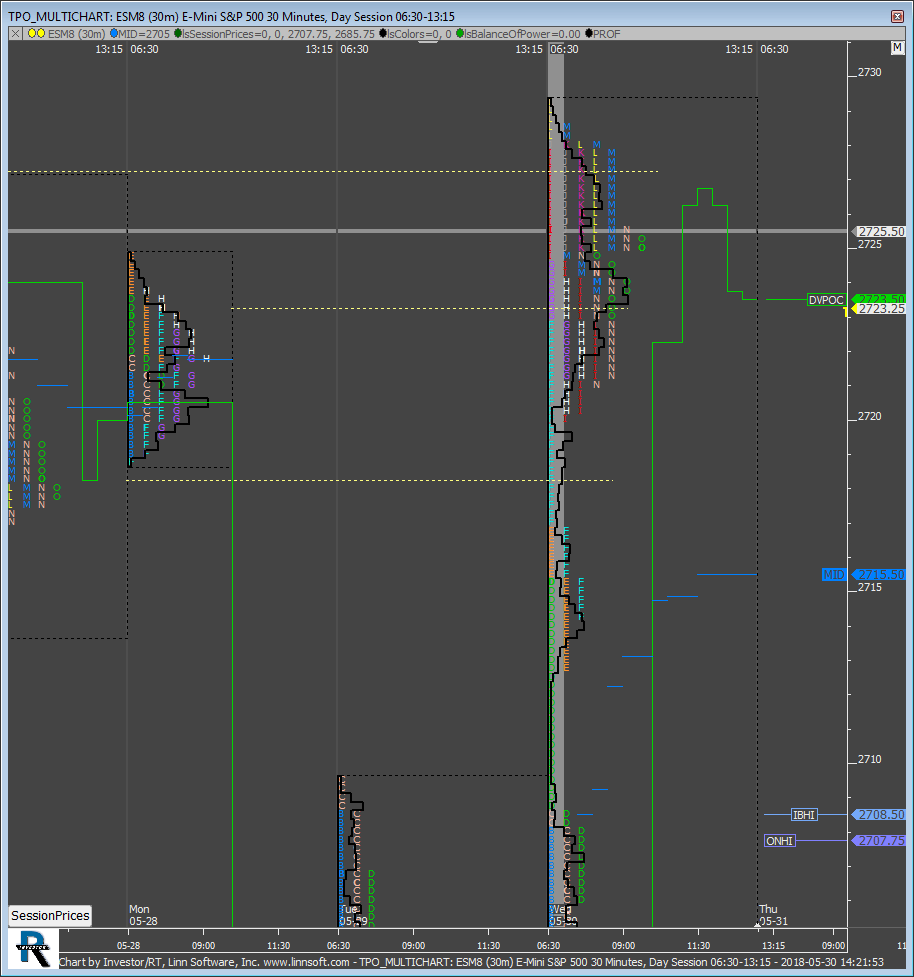 |
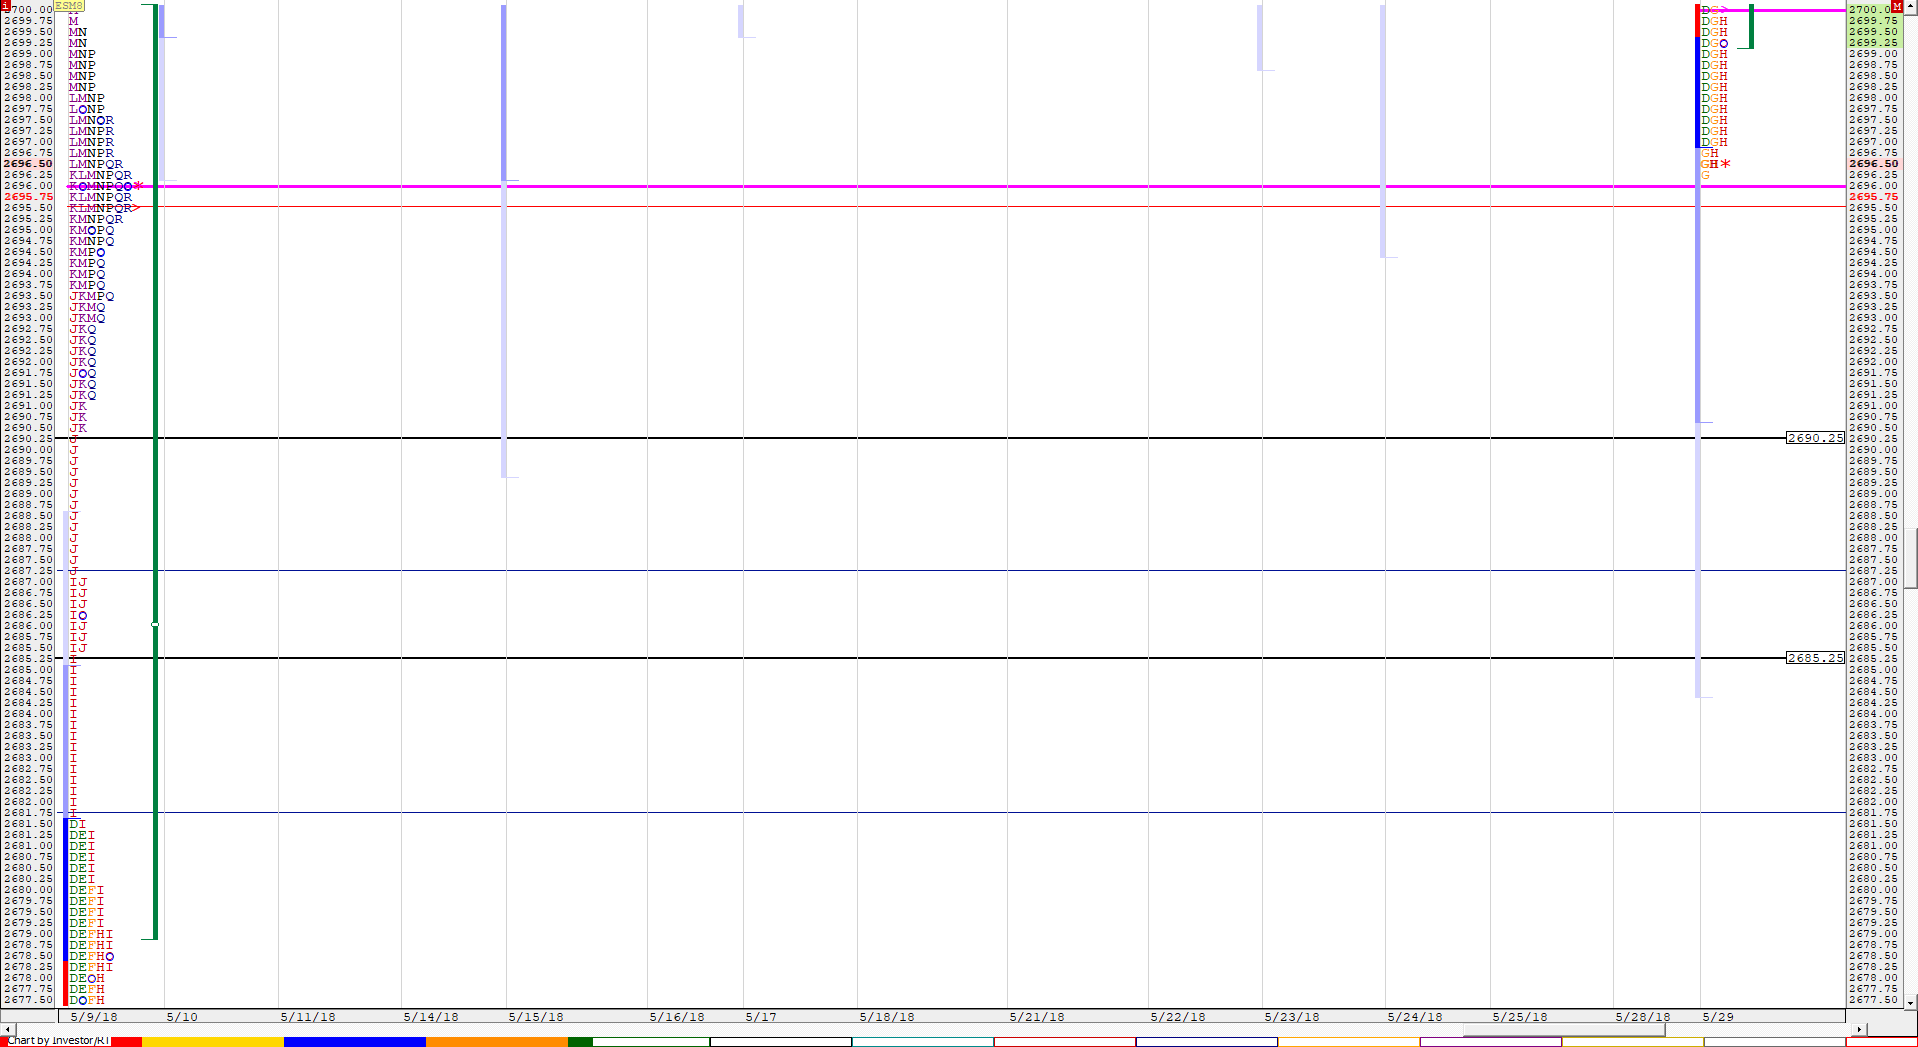
TPO MULTICHART (ESM8) MPTrader [totalcount]
7 years 6 months ago
This chart was uploaded by Investor/RT 13.3.1 showing symbol: ESM8. |
View |
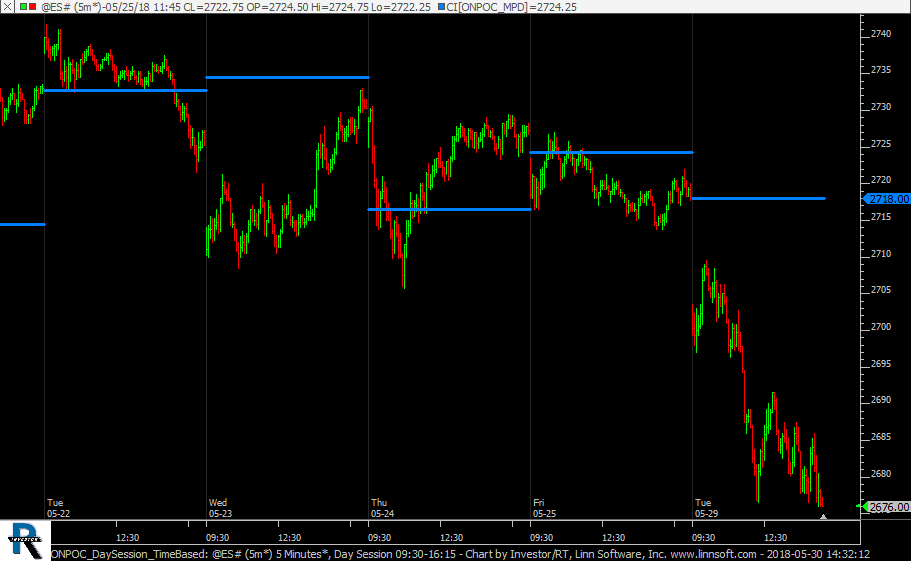 |
ONPOC DaySession TimeBased (@ES#) cpayne [totalcount]
7 years 6 months ago
Overnight time-based POC on day session chart. This chart was uploaded by Investor/RT 13.3.4 showing symbol: @ES#. |
View |
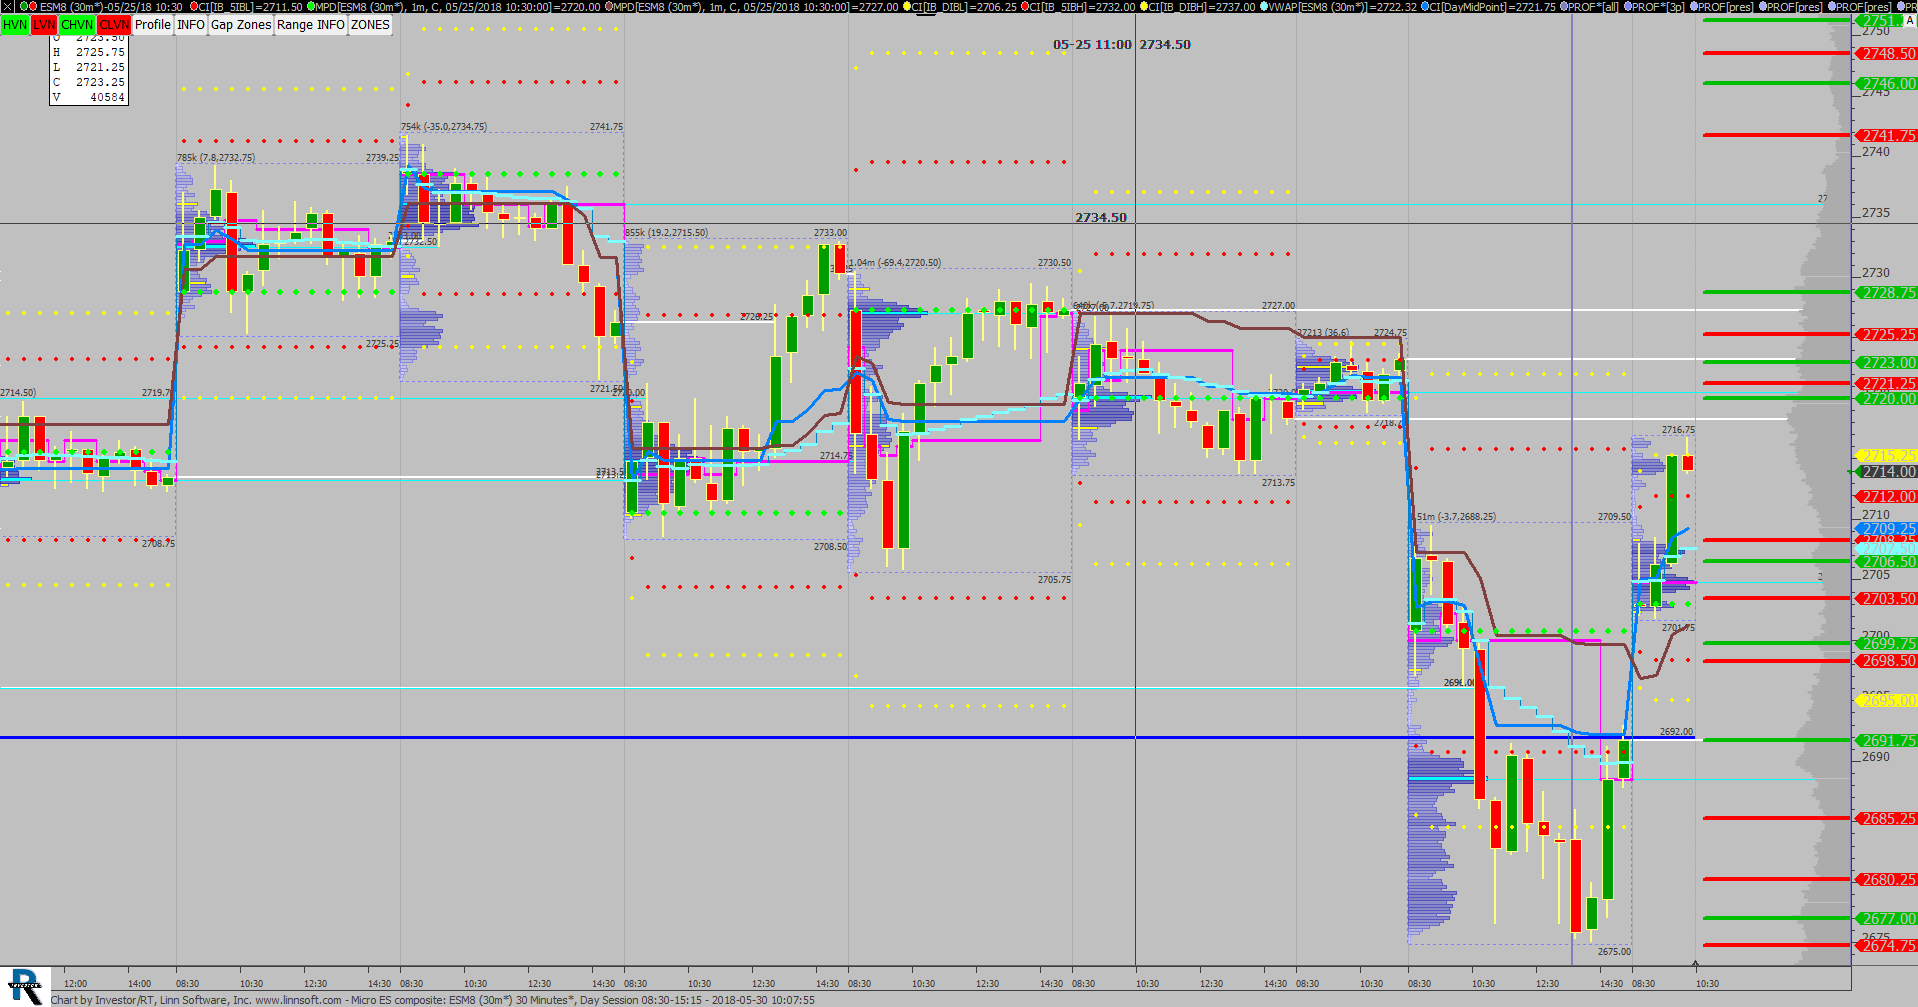 |
Micro ES composite (ESM8) scottz46 [totalcount]
7 years 6 months ago
This chart was uploaded by Investor/RT 13.3.3 showing symbol: ESM8. |
View |
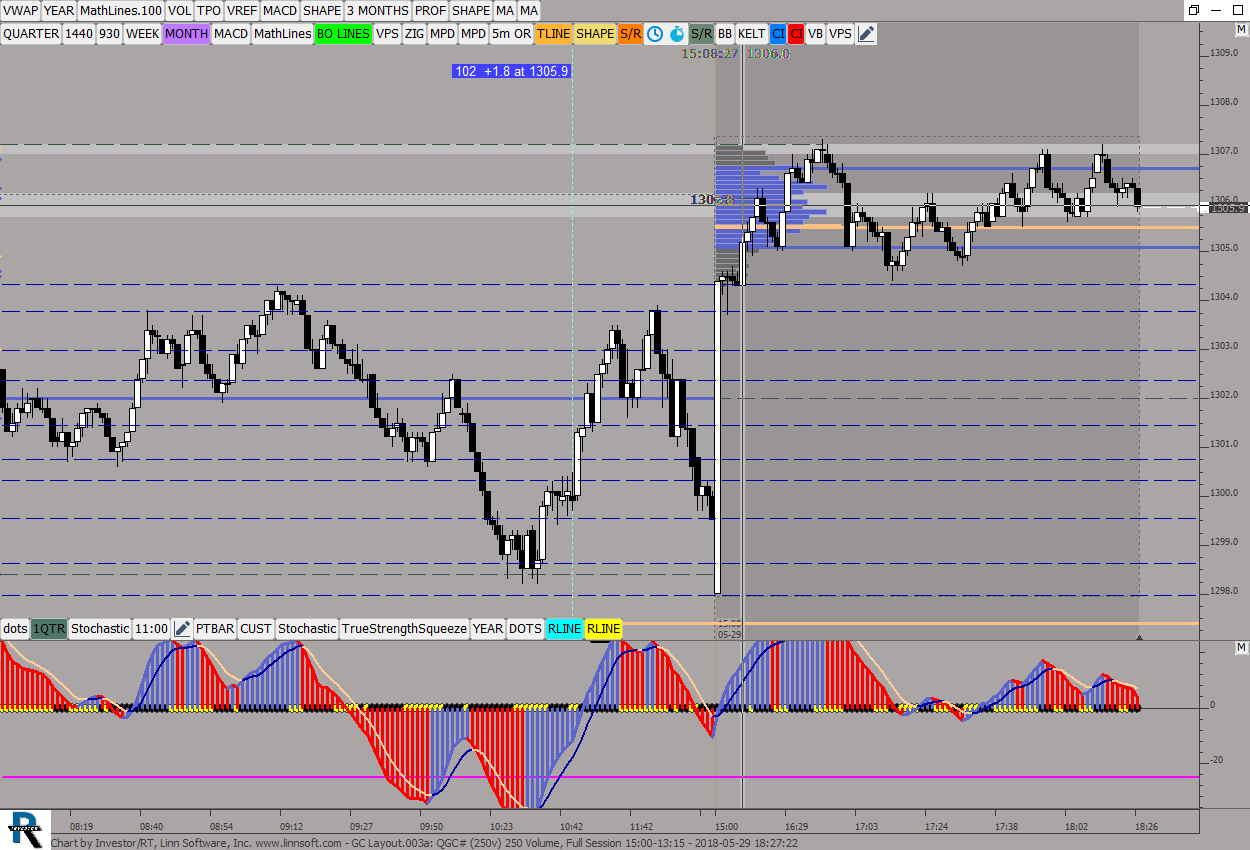 |
GC Layout003a (QGC#) ES42 [totalcount]
7 years 6 months ago
This chart was uploaded by Investor/RT 13.3.3 showing symbol: QGC#. |
View |
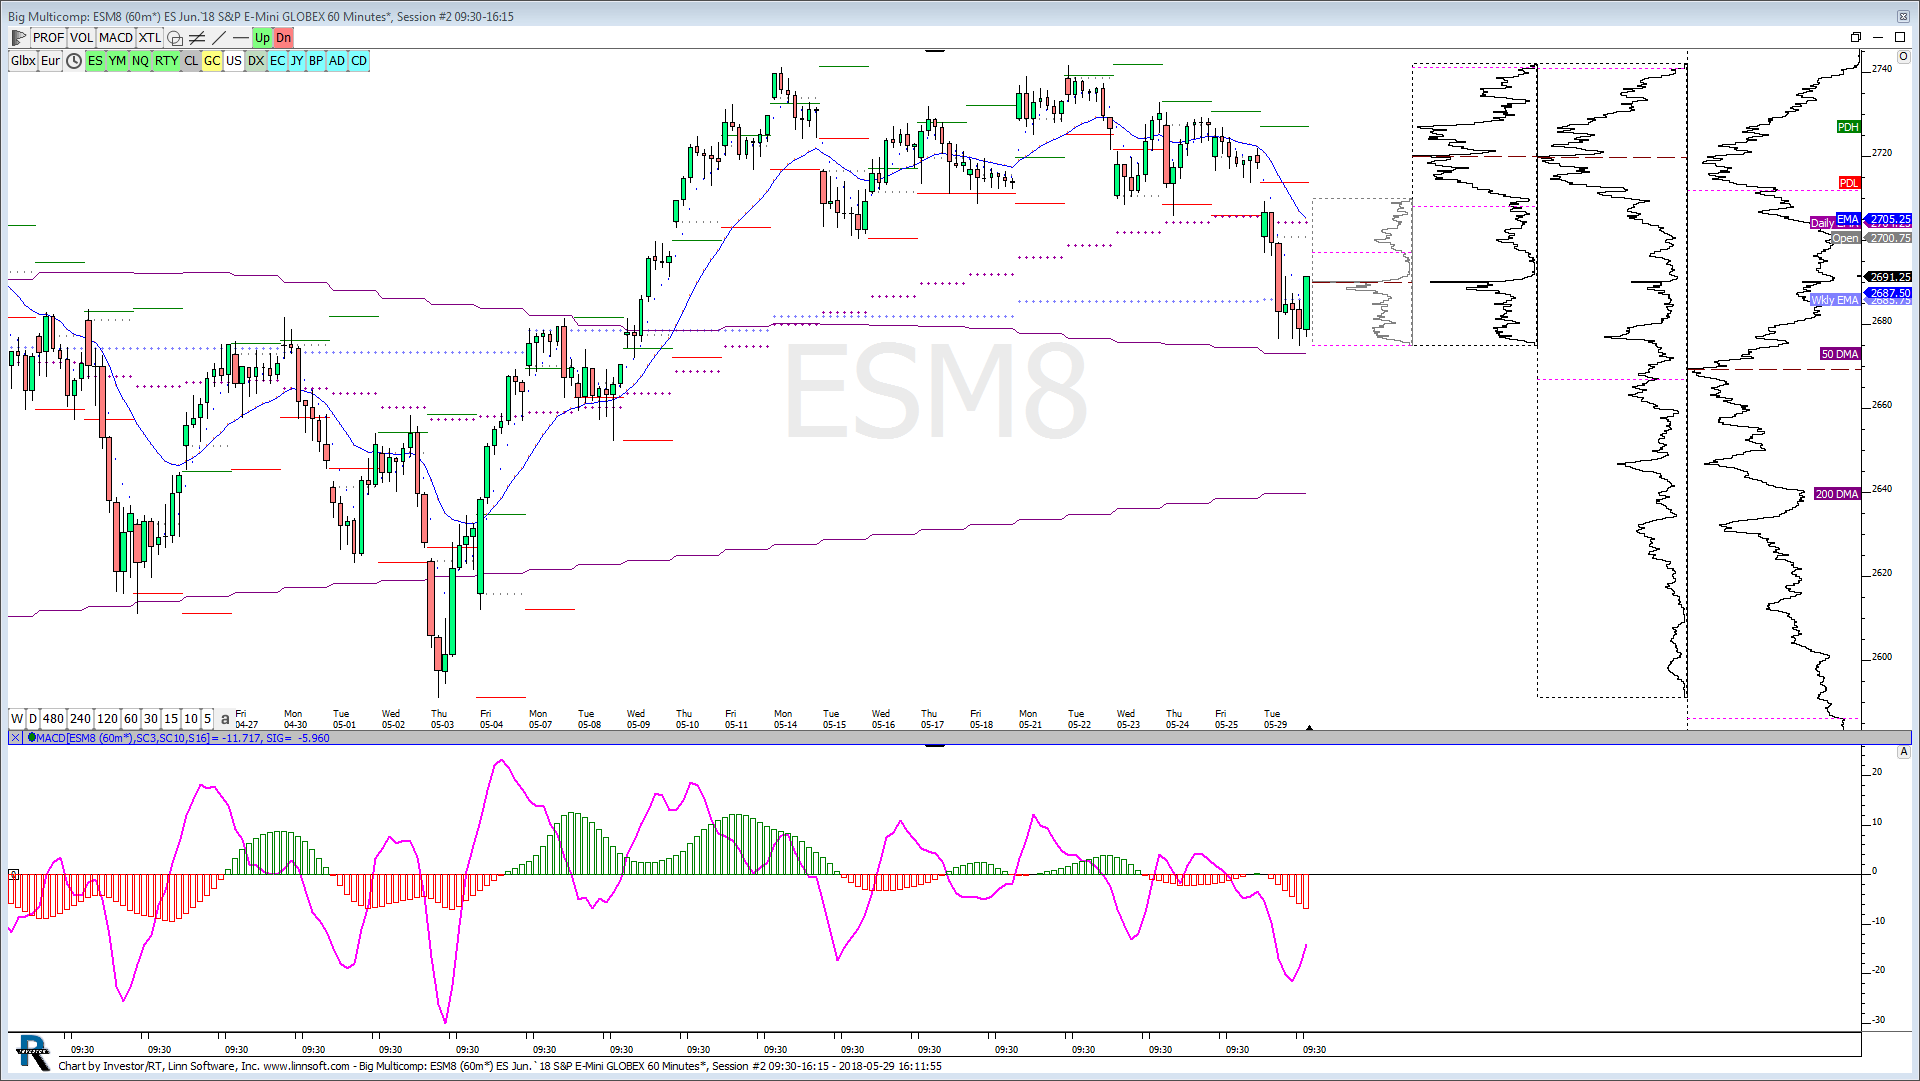 |
Big Multicomp (ESM8) carlosleon2005 [totalcount]
7 years 6 months ago
This chart was uploaded by Investor/RT 13.3.3 showing symbol: ESM8. |
View |
 |
ES TPO (ESM8) scottz46 [totalcount]
7 years 6 months ago
This chart was uploaded by Investor/RT 13.3.1 showing symbol: ESM8. |
View |
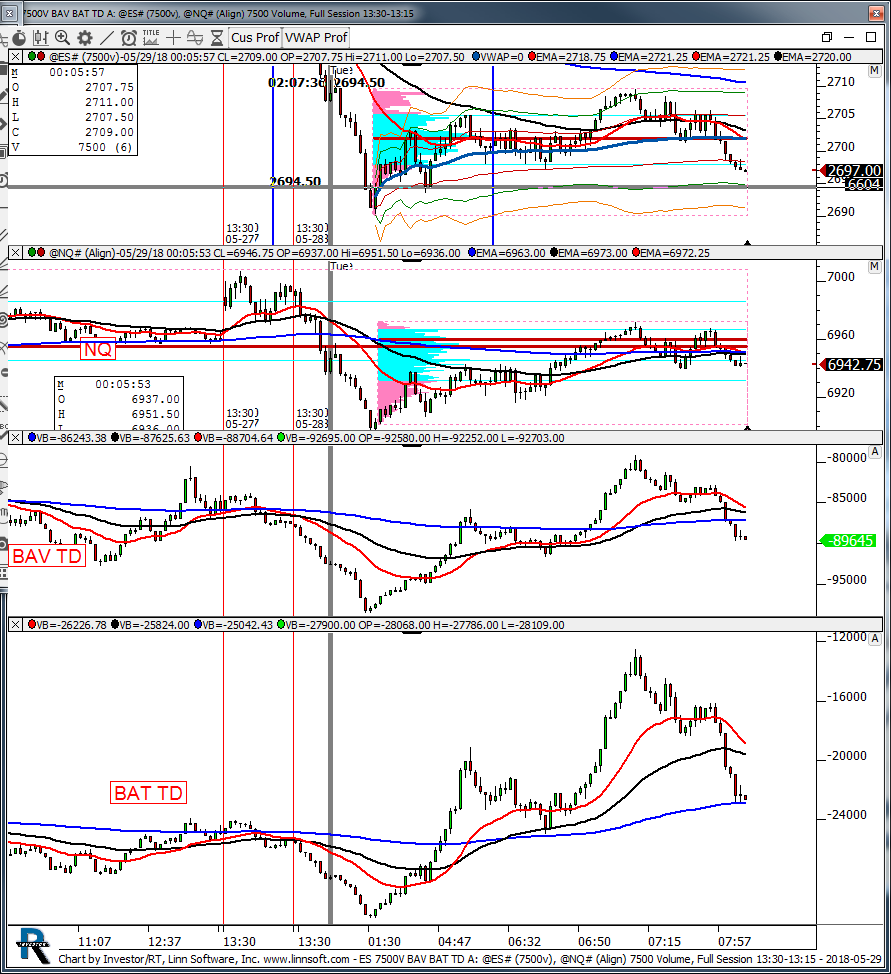 |
ES 7500V BAV BAT TD A (@ES#) kencassorla [totalcount]
7 years 6 months ago
7500v. This chart was uploaded by Investor/RT 13.3.3 showing symbol: @ES#. |
View |
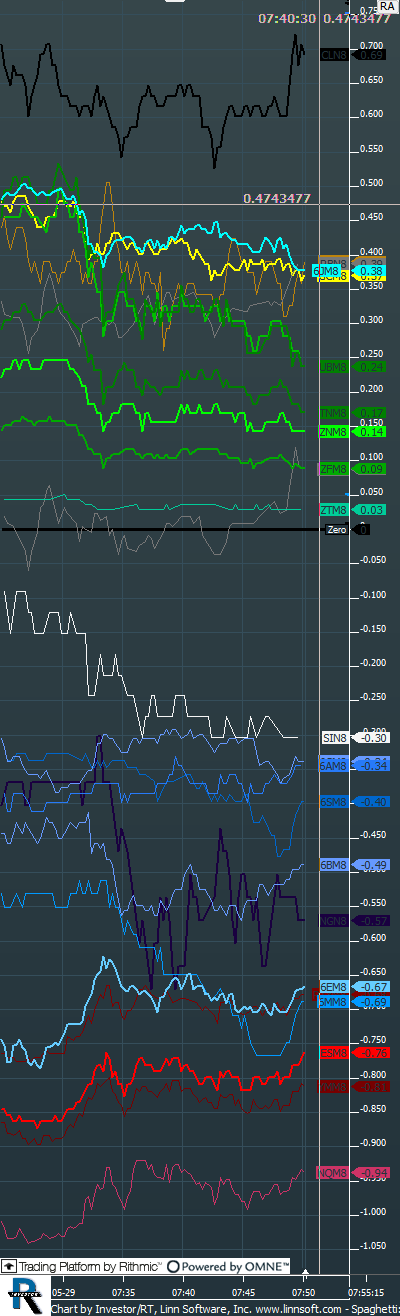 |
Spaghetti (6JM8) Dylan Cleary [totalcount]
7 years 6 months ago
This chart was uploaded by Investor/RT 13.3.3 showing symbol: 6JM8. |
View |
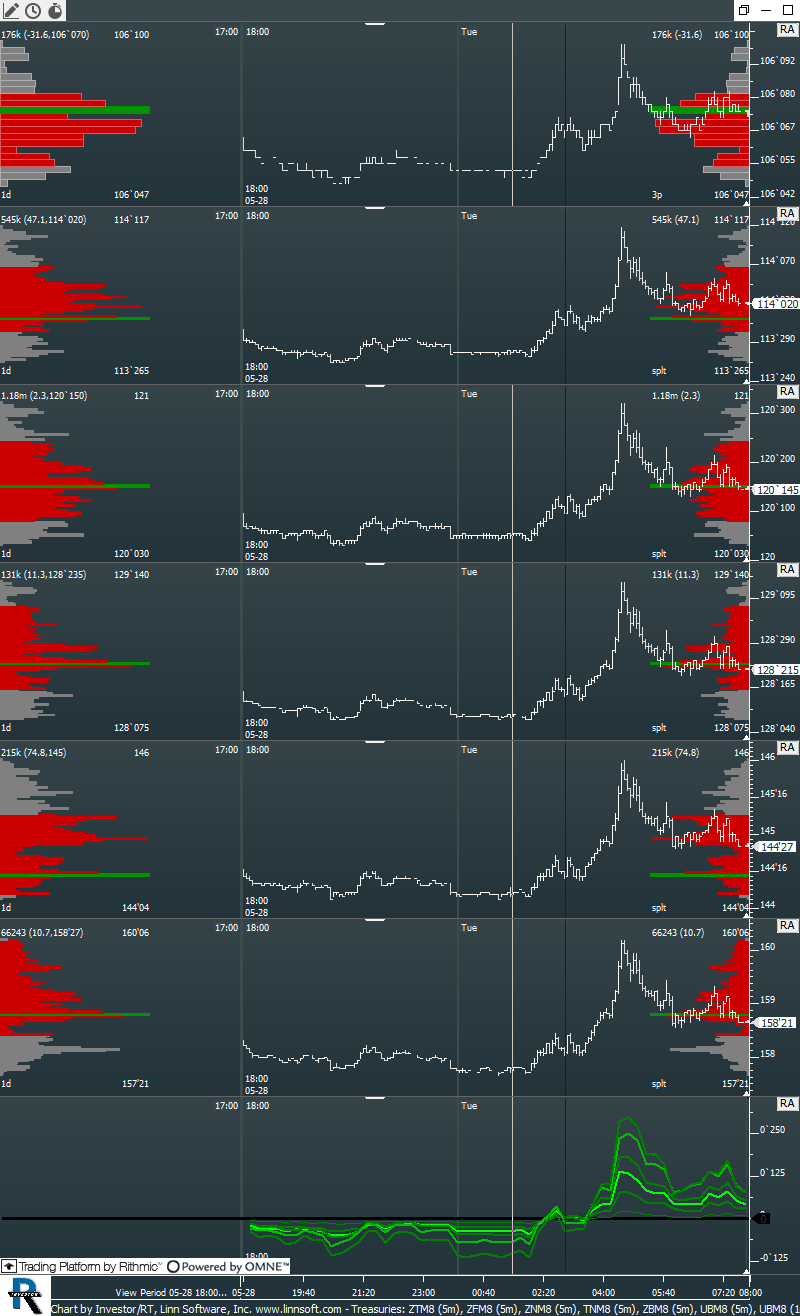 |
Treasuries (ZTM8) Dylan Cleary [totalcount]
7 years 6 months ago
This chart was uploaded by Investor/RT 13.3.3 showing symbol: ZTM8. |
View |
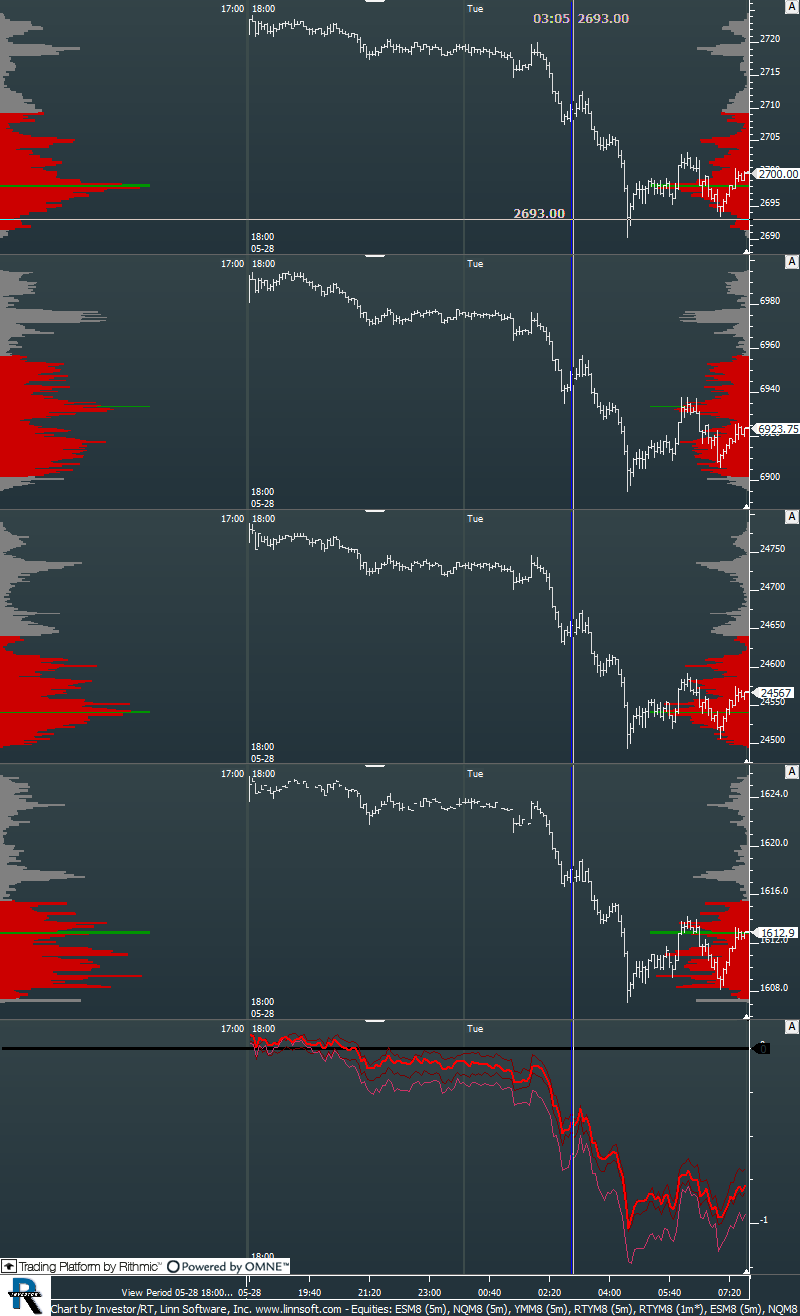 |
Equities (ESM8) Dylan Cleary [totalcount]
7 years 6 months ago
This chart was uploaded by Investor/RT 13.3.3 showing symbol: ESM8. |
View |
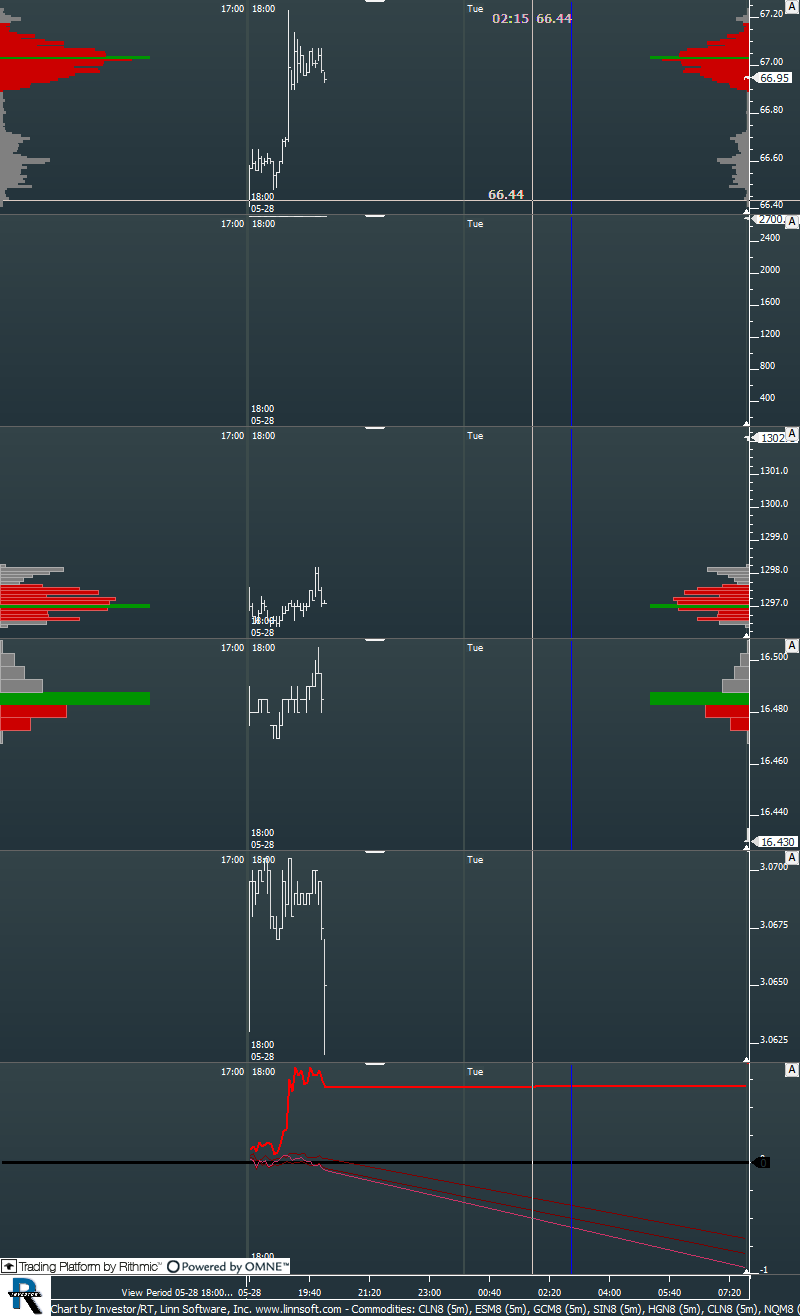 |
Commodities (CLN8) Dylan Cleary [totalcount]
7 years 6 months ago
This chart was uploaded by Investor/RT 13.3.3 showing symbol: CLN8. |
View |
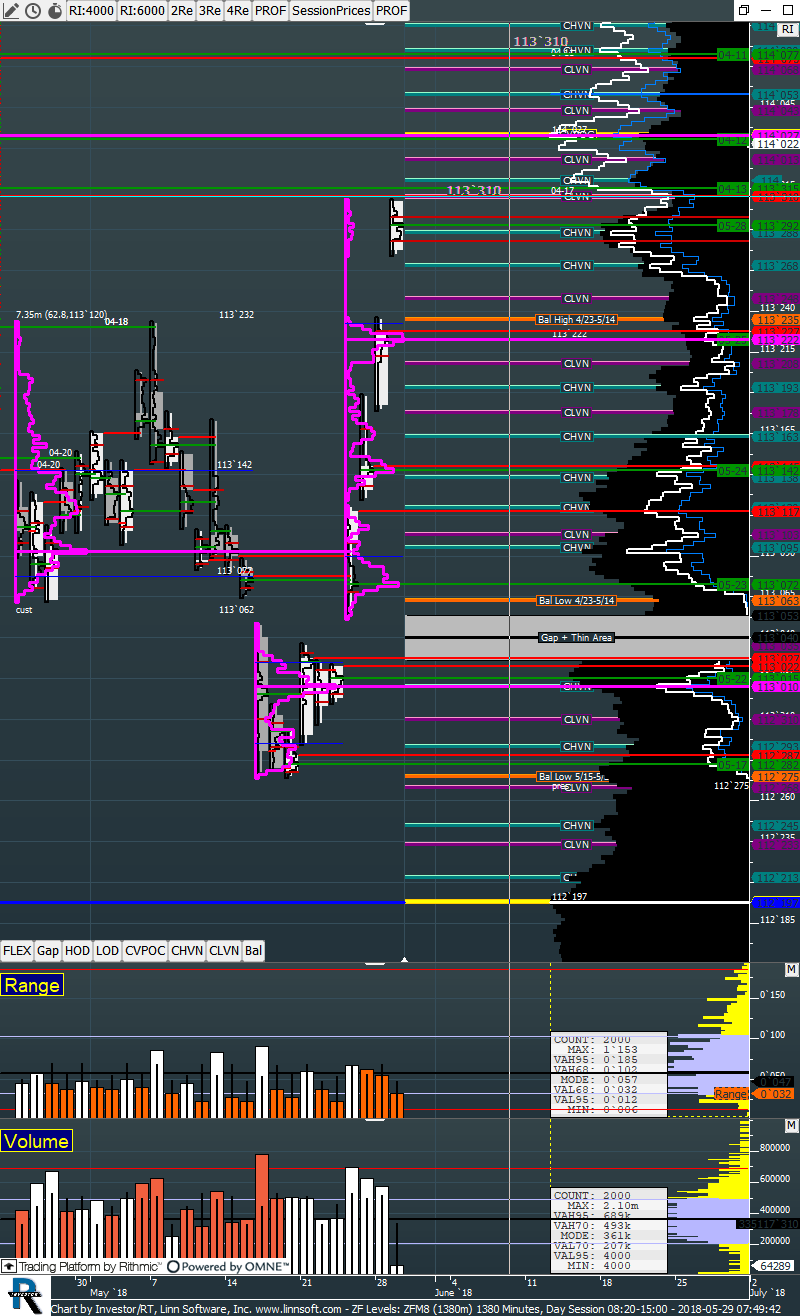 |
ZF Levels (ZFM8) Dylan Cleary [totalcount]
7 years 6 months ago
This chart was uploaded by Investor/RT 13.3.3 showing symbol: ZFM8. |
View |
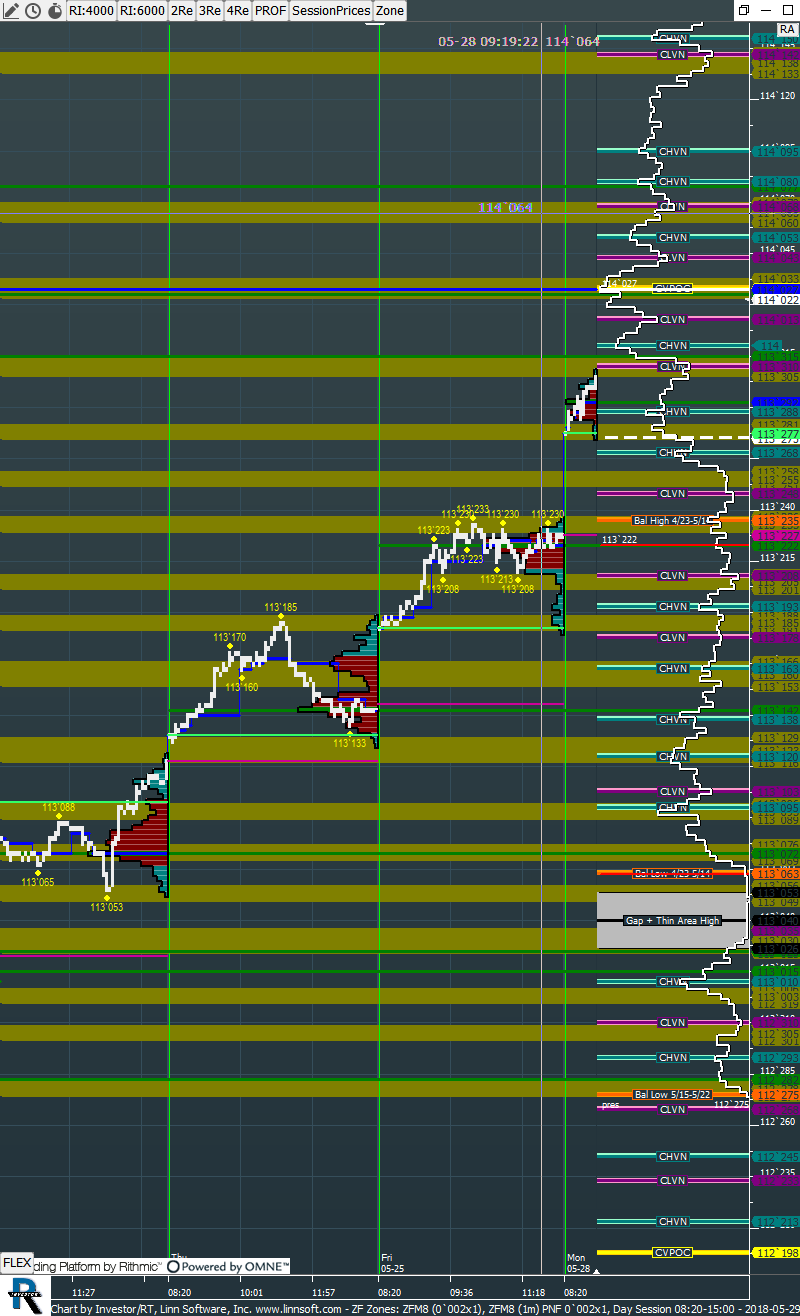 |
ZF Zones (ZFM8) Dylan Cleary [totalcount]
7 years 6 months ago
This chart was uploaded by Investor/RT 13.3.3 showing symbol: ZFM8. |
View |
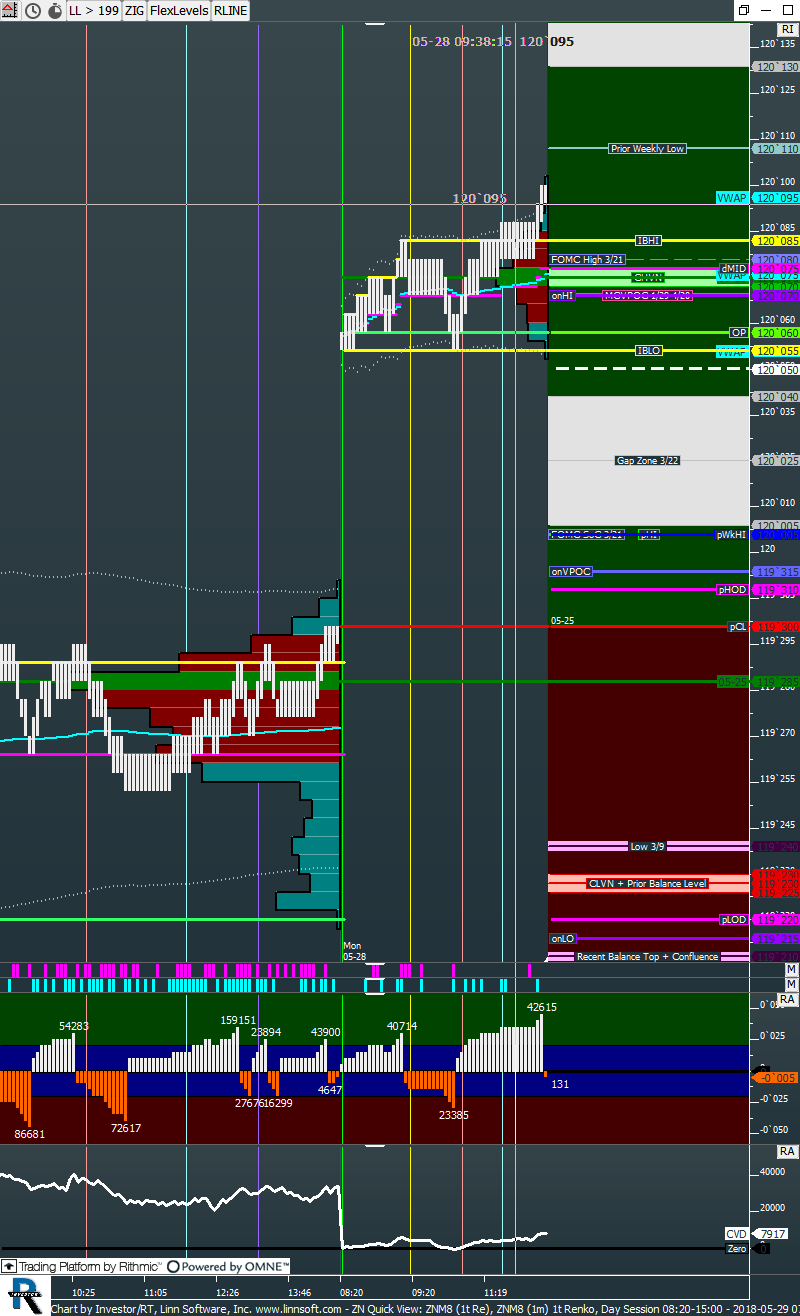 |
ZN Quick View (ZNM8) Dylan Cleary [totalcount]
7 years 6 months ago
This chart was uploaded by Investor/RT 13.3.3 showing symbol: ZNM8. |
View |
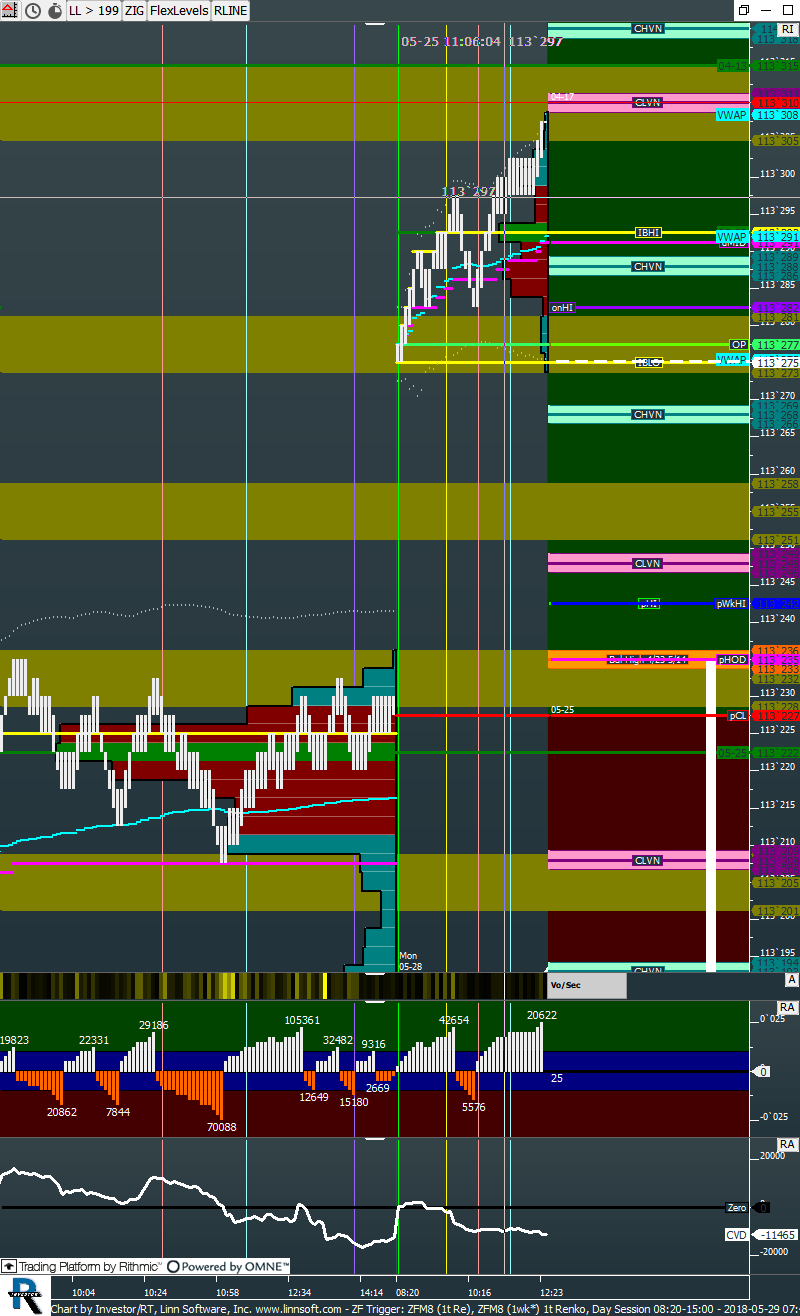 |
ZF Trigger (ZFM8) Dylan Cleary [totalcount]
7 years 6 months ago
This chart was uploaded by Investor/RT 13.3.3 showing symbol: ZFM8. |
View |
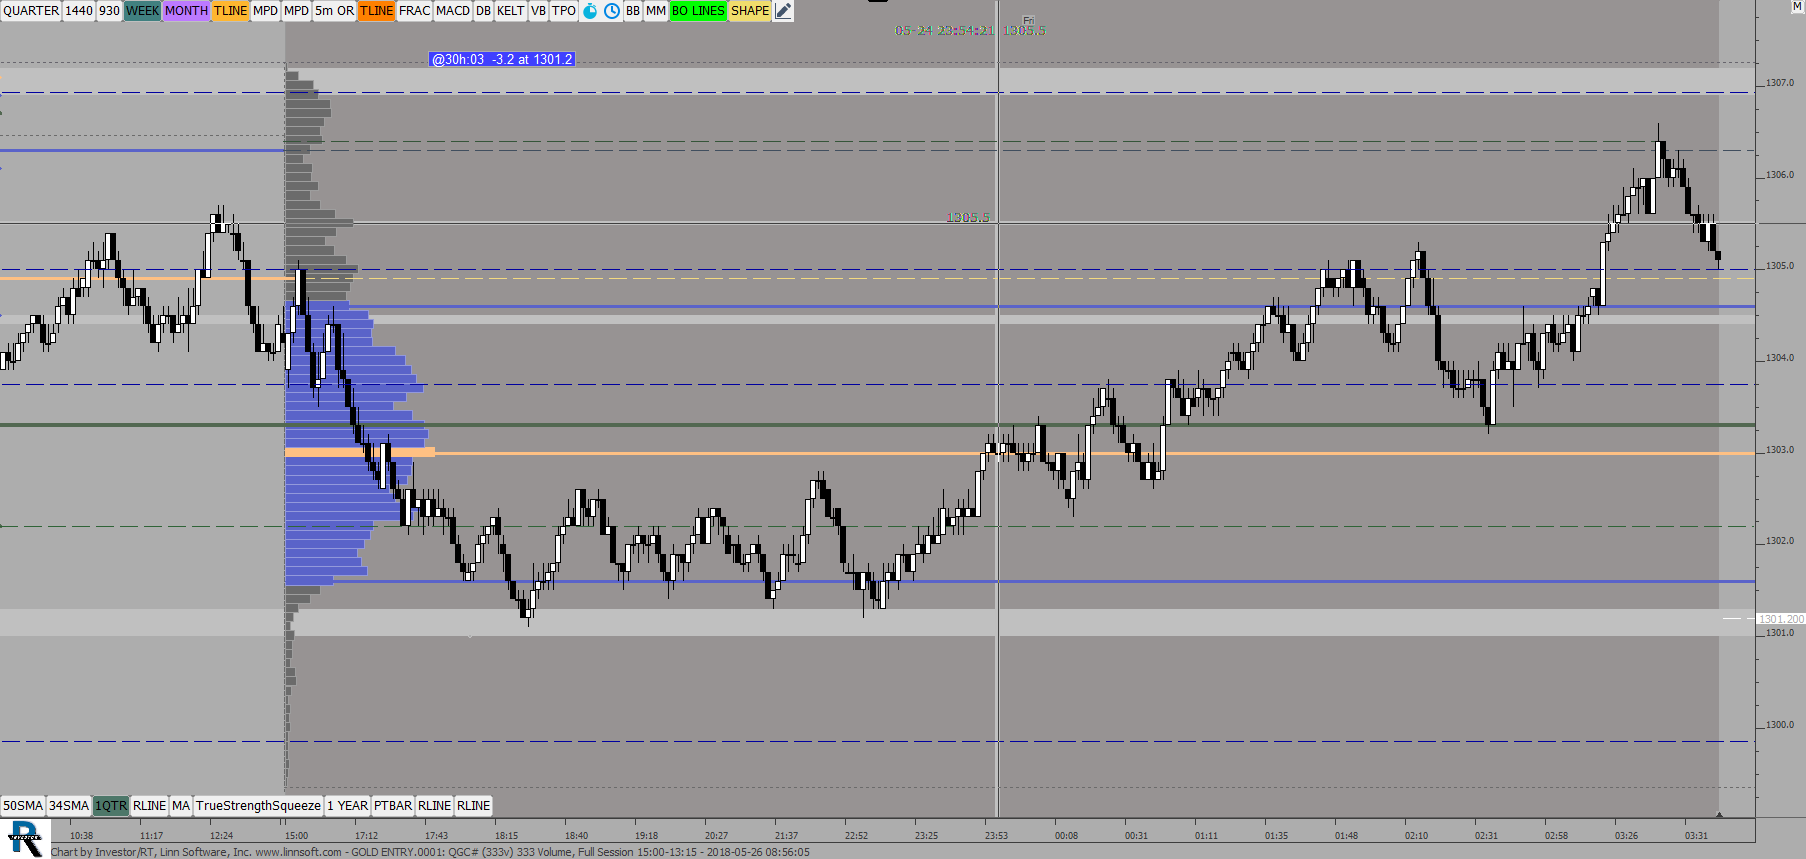 |
GOLD ENTRY (QGC#) ES42 [totalcount]
7 years 7 months ago
This chart was uploaded by Investor/RT 13.3.3 showing symbol: QGC#. |
View |
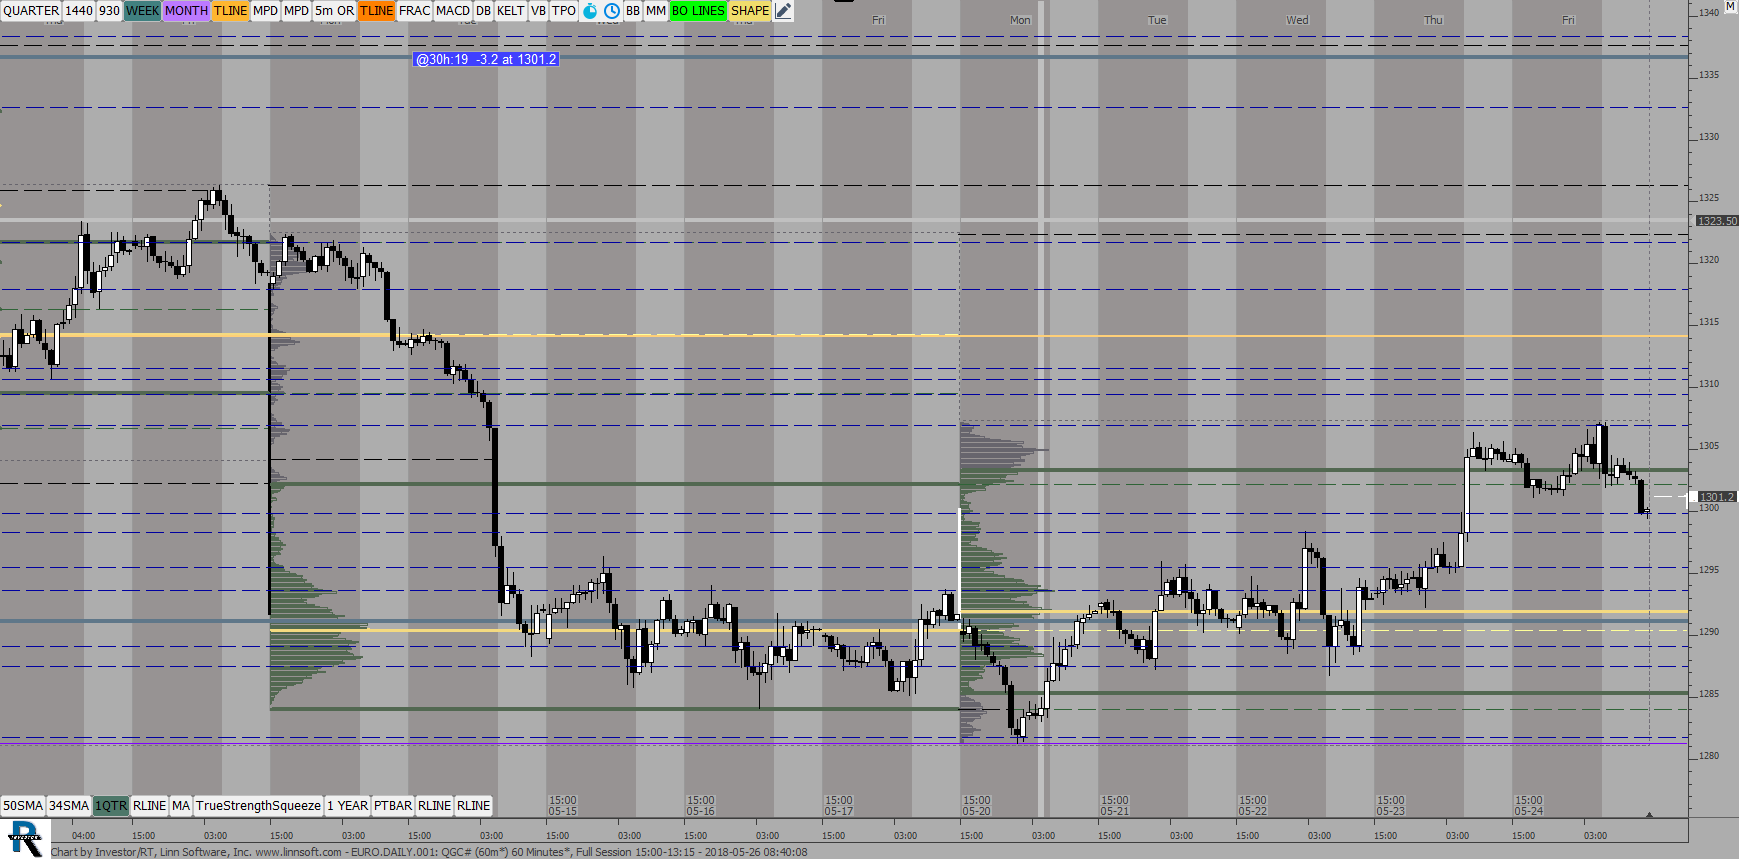 |
EURODAILY (QGC#) ES42 [totalcount]
7 years 7 months ago
This chart was uploaded by Investor/RT 13.3.3 showing symbol: QGC#. |
View |
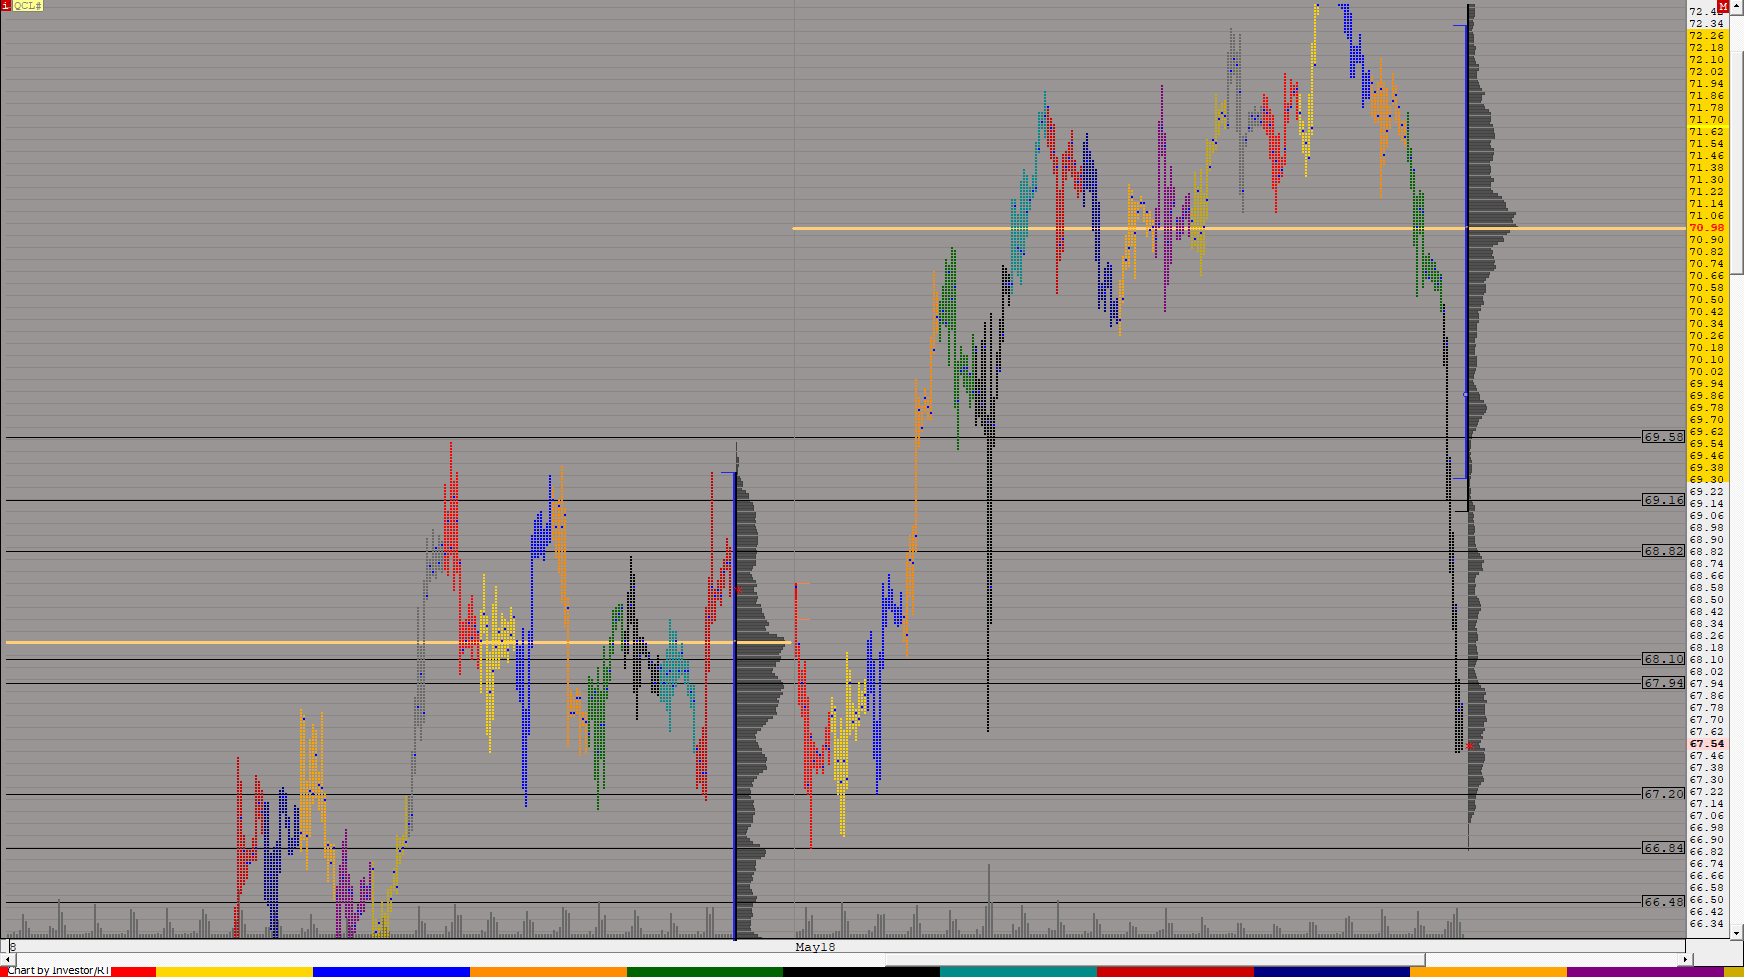 |
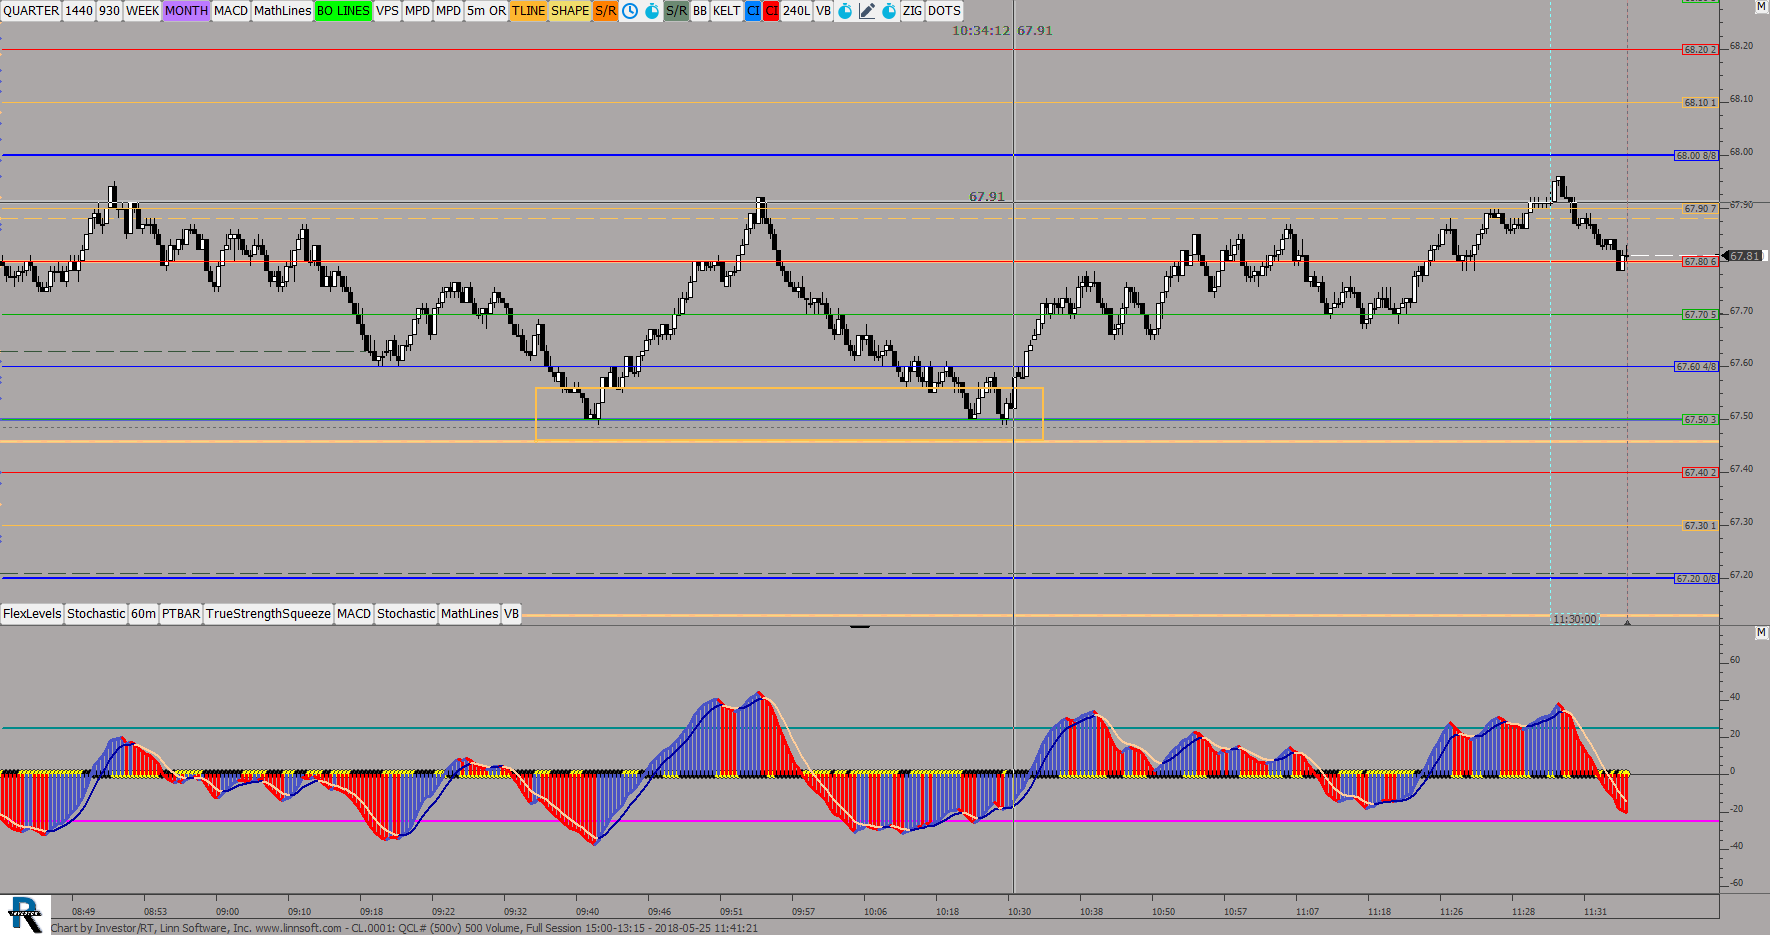
OIL Layout001f (QCL#) ES42 [totalcount]
7 years 7 months ago
This chart was uploaded by Investor/RT 13.3.3 showing symbol: QCL#. |
View |
 |
Market profileGlobexmonthly (@ES#) ES42 [totalcount]
7 years 7 months ago
This chart was uploaded by Investor/RT 13.3.3 showing symbol: @ES#. |
View |
 |
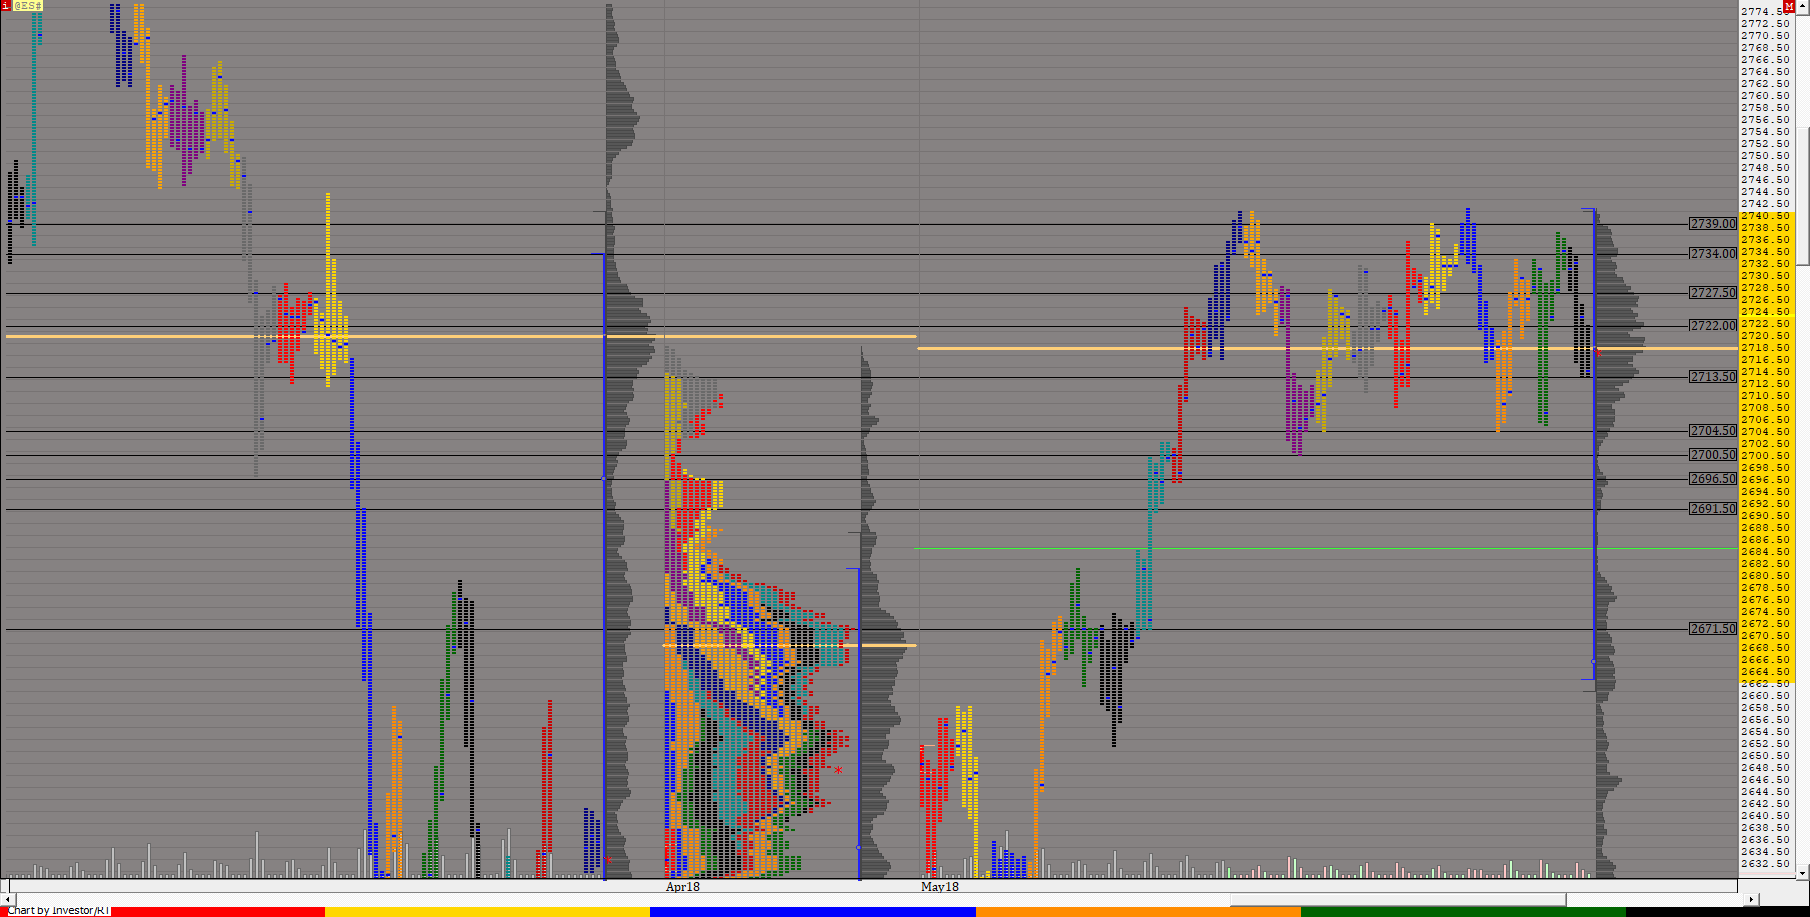
CL (QCL#) ES42 [totalcount]
7 years 7 months ago
This chart was uploaded by Investor/RT 13.3.3 showing symbol: QCL#. |
View |
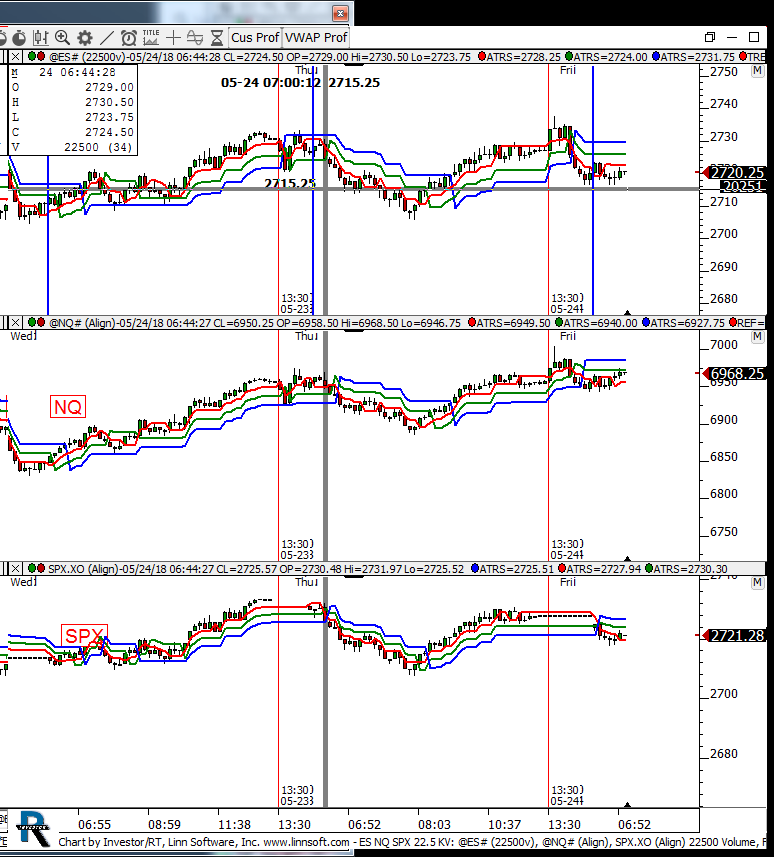 |
ES NQ SPX 225 KV (@ES#) kencassorla [totalcount]
7 years 7 months ago
atrs. This chart was uploaded by Investor/RT 13.3.3 showing symbol: @ES#. |
View |
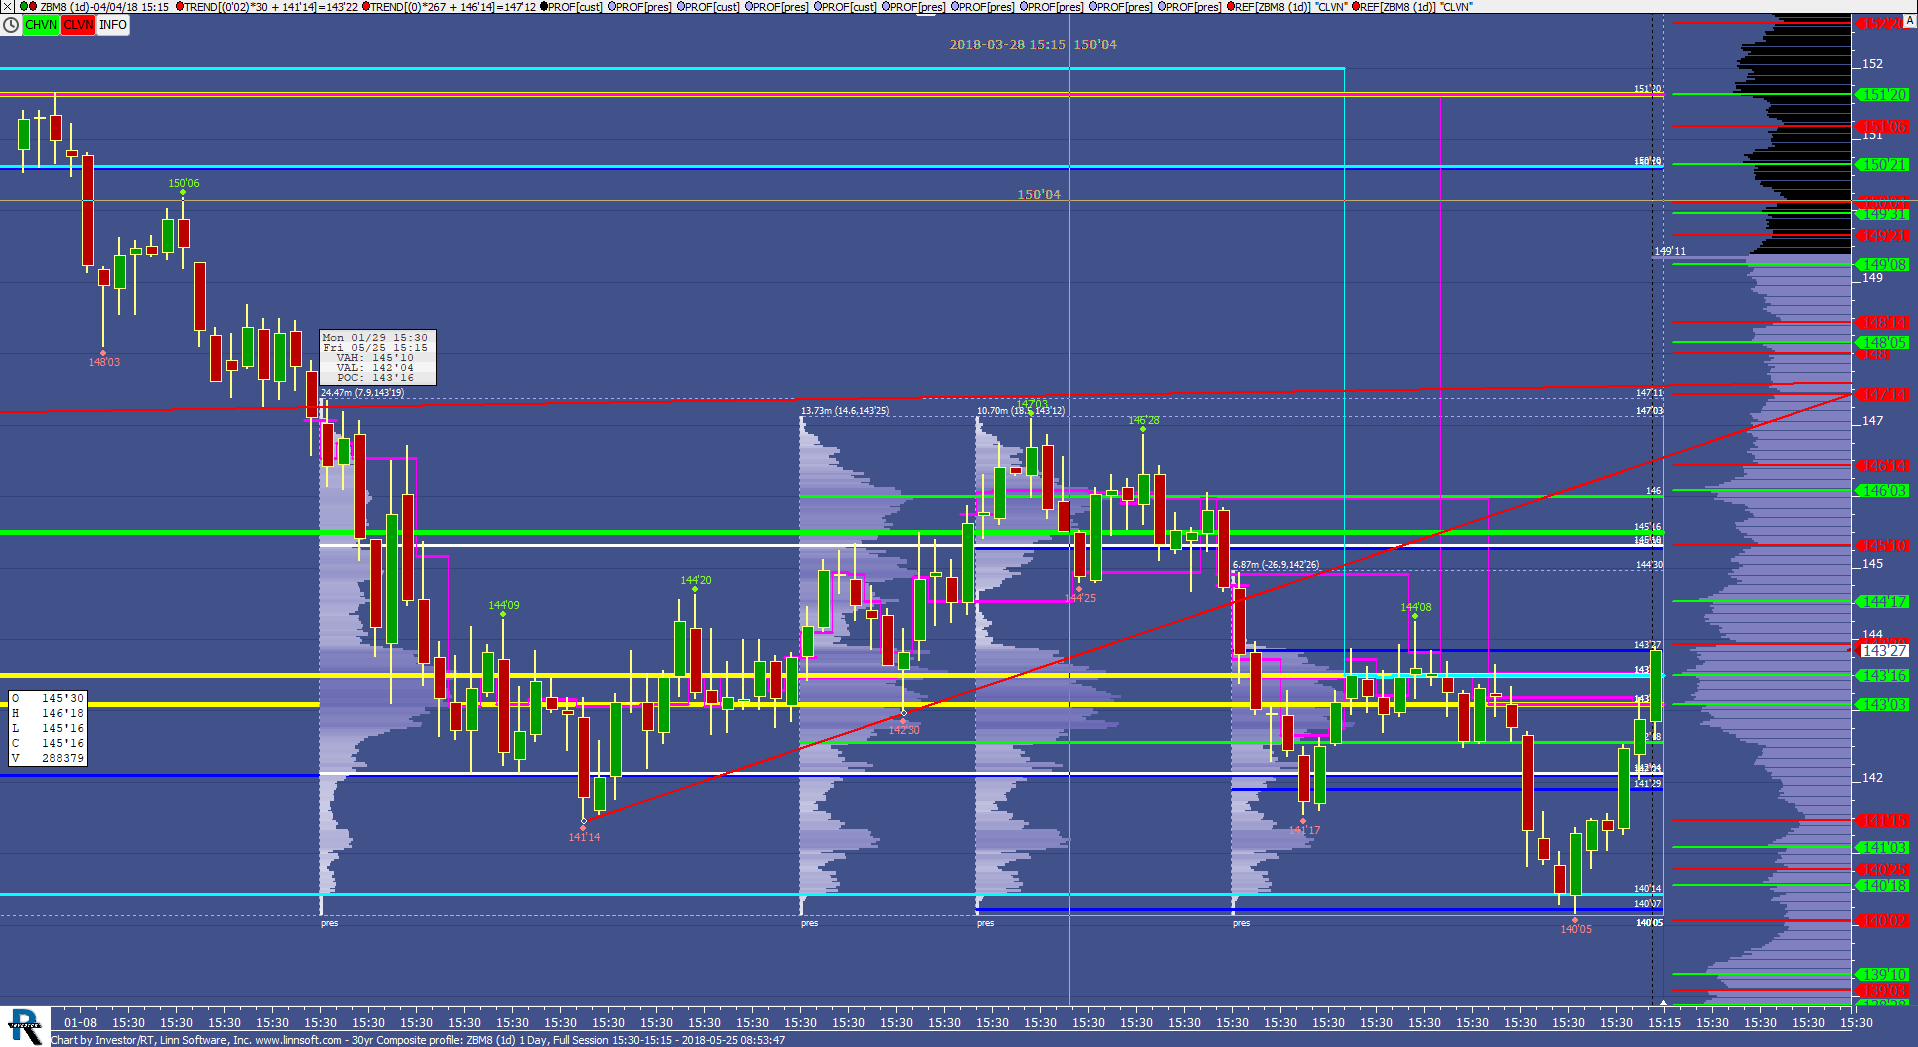 |
30yr Composite profile (ZBM8) scottz46 [totalcount]
7 years 7 months ago
This chart was uploaded by Investor/RT 13.3.3 showing symbol: ZBM8. |
View |