 |
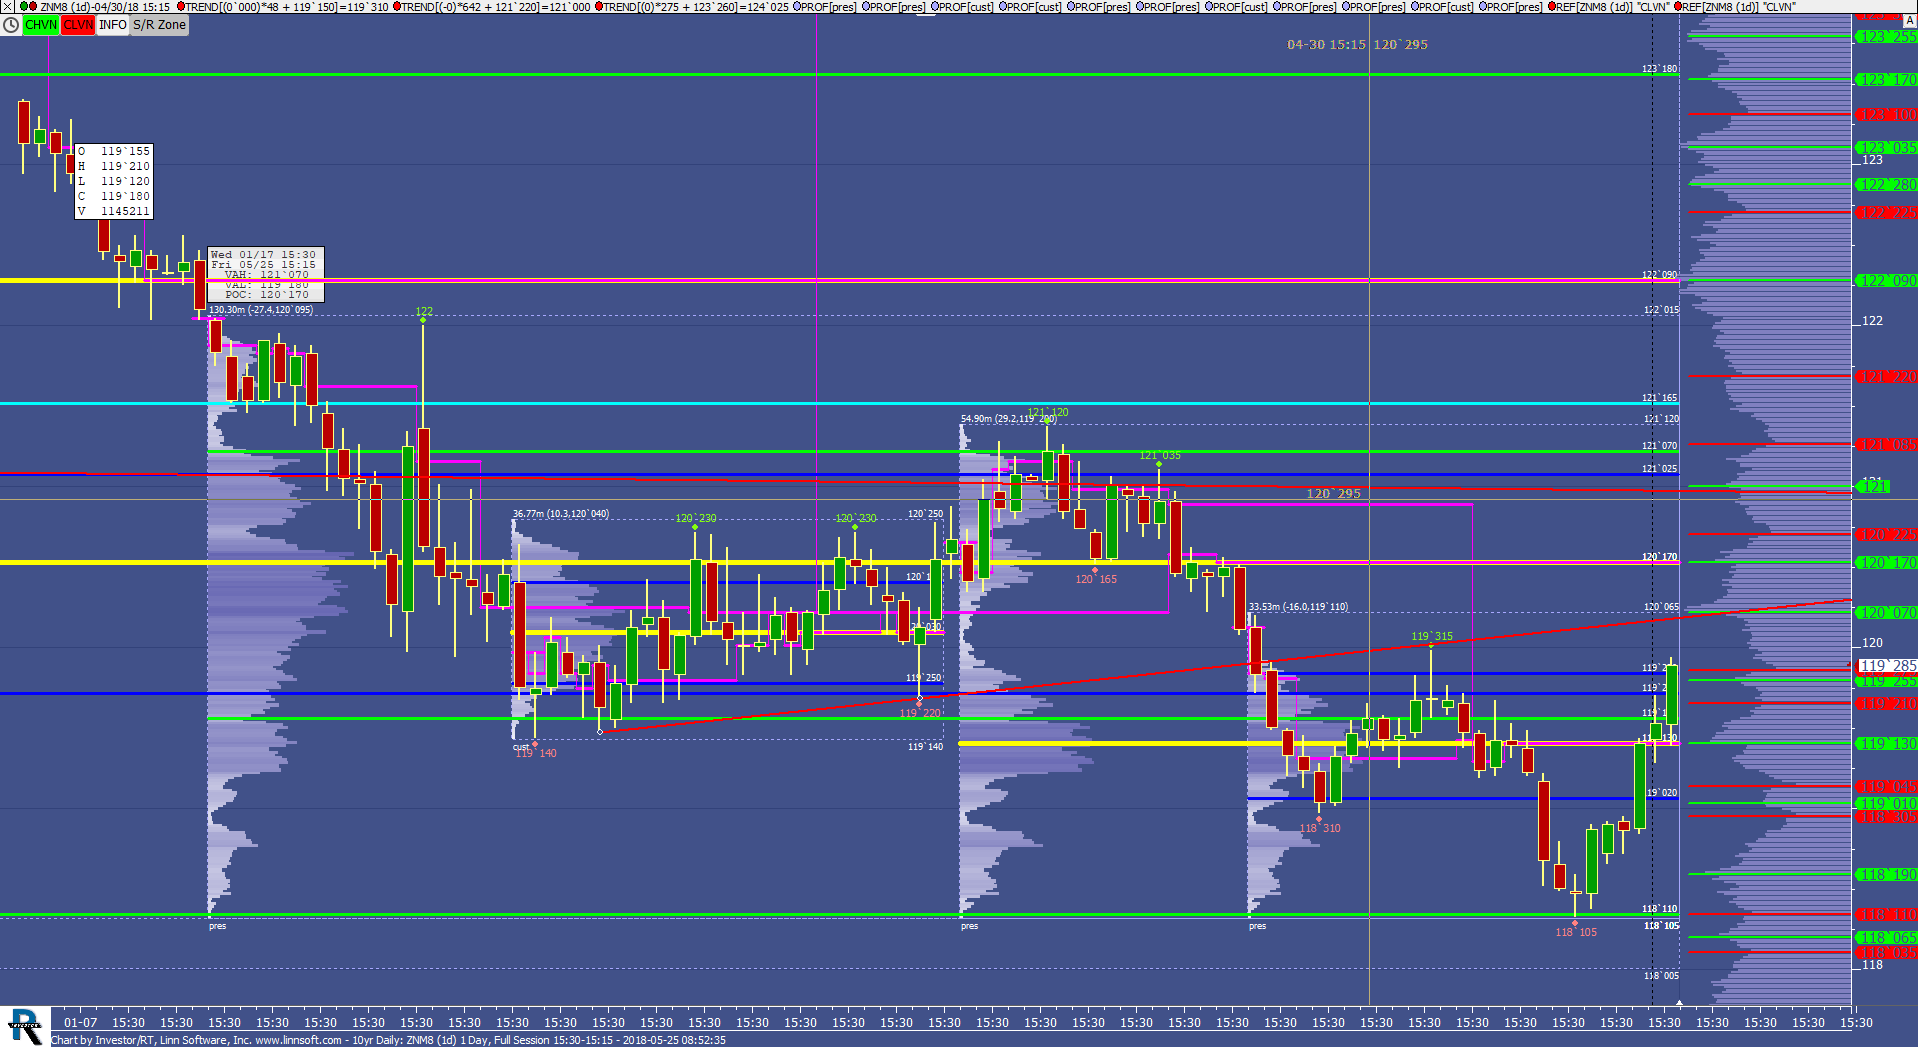
10yr Daily (ZNM8) scottz46 [totalcount]
7 years 7 months ago
This chart was uploaded by Investor/RT 13.3.3 showing symbol: ZNM8. |
View |
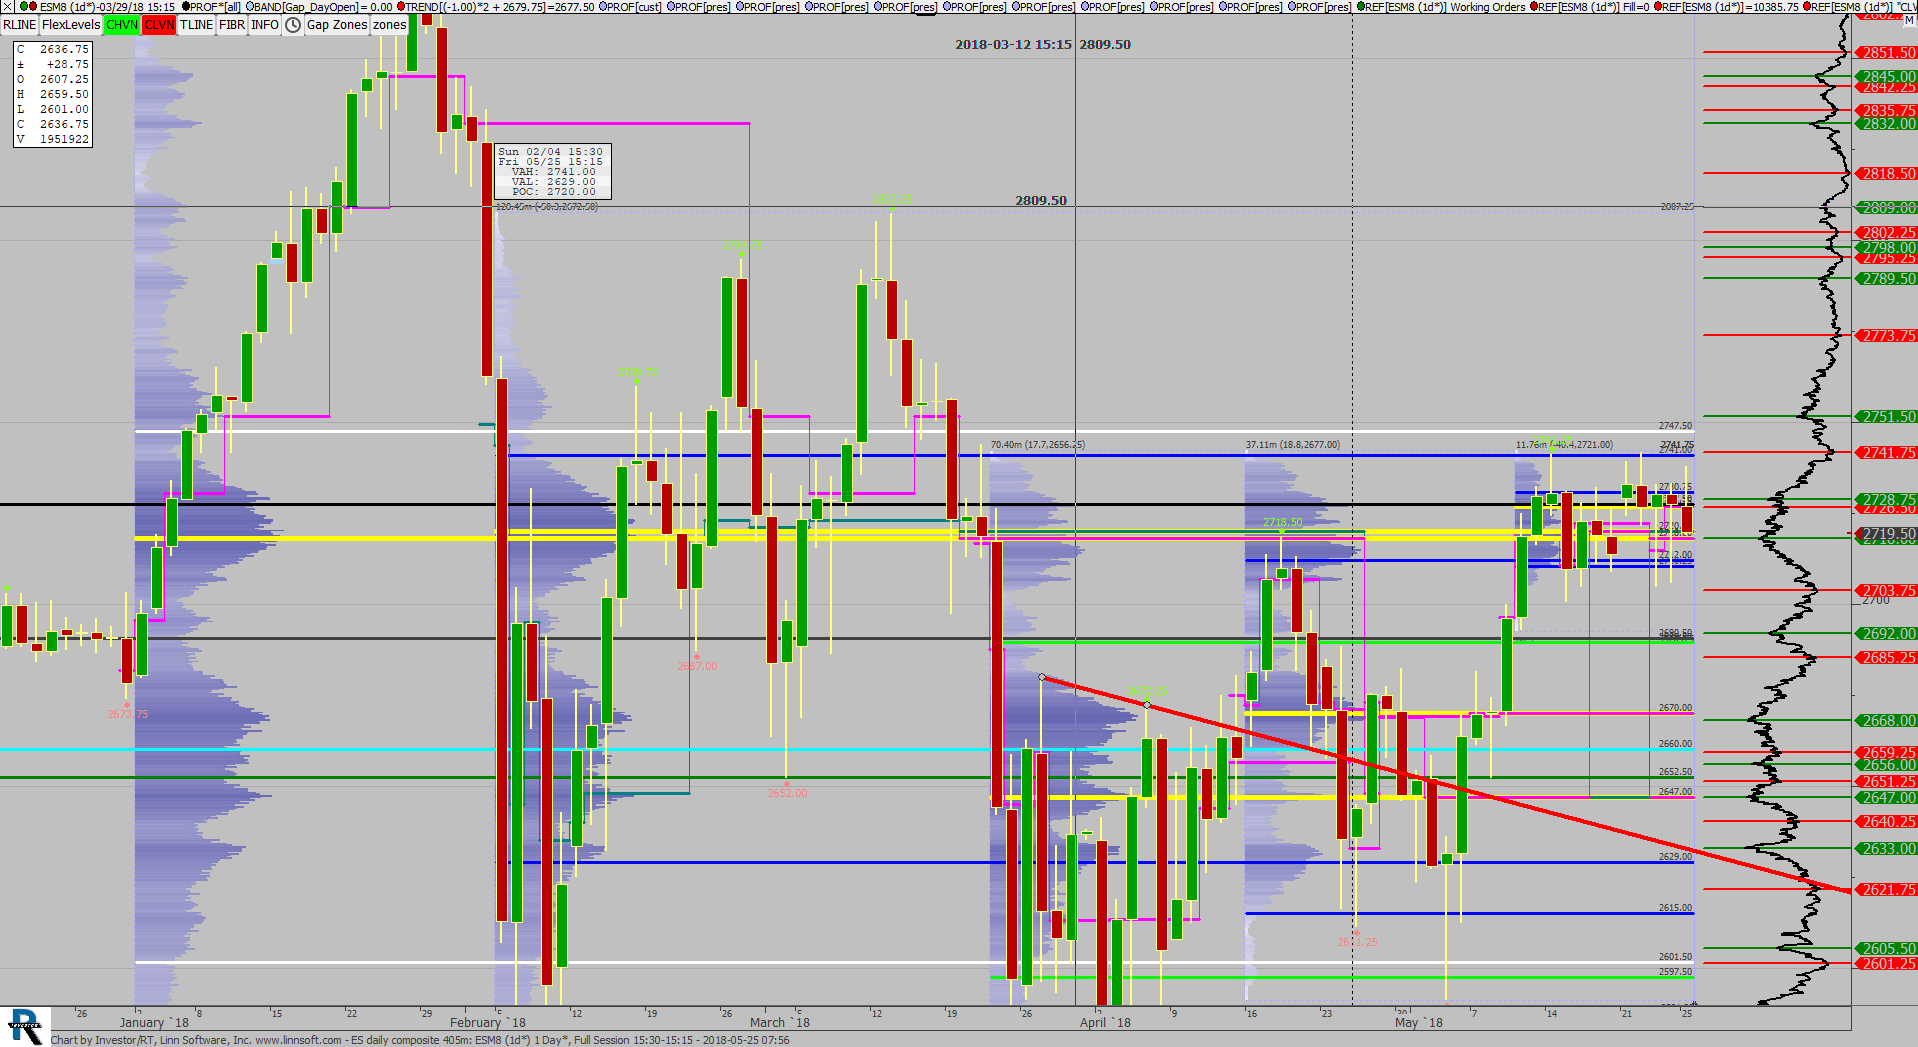 |
ES daily composite 405m (ESM8) scottz46 [totalcount]
7 years 7 months ago
This chart was uploaded by Investor/RT 13.3.3 showing symbol: ESM8. |
View |
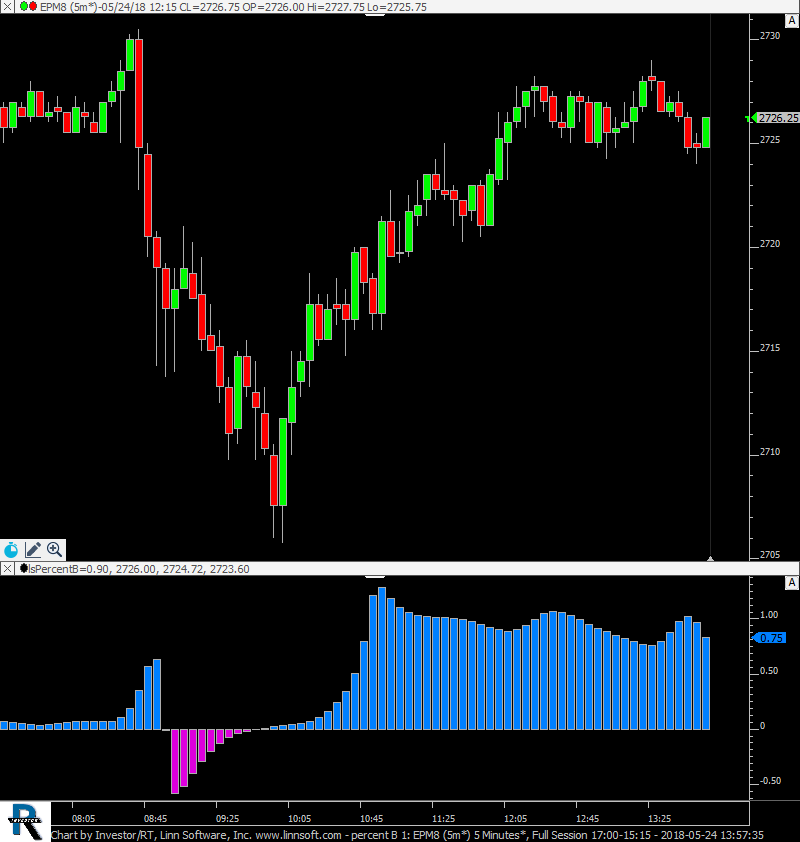 |
percent B 1 (EPM8) slv88 [totalcount]
7 years 7 months ago
ticket 29873 pecent b thanks chad. This chart was uploaded by Investor/RT 13.3.3 showing symbol: EPM8. |
View |
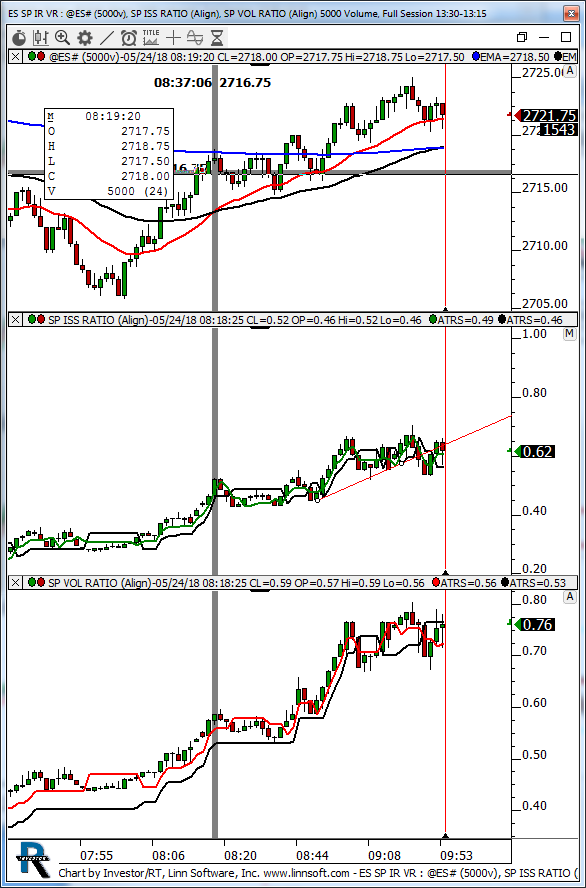 |
ES SP IR VR (@ES#) kencassorla [totalcount]
7 years 7 months ago
5 kv. This chart was uploaded by Investor/RT 13.3.3 showing symbol: @ES#. |
View |
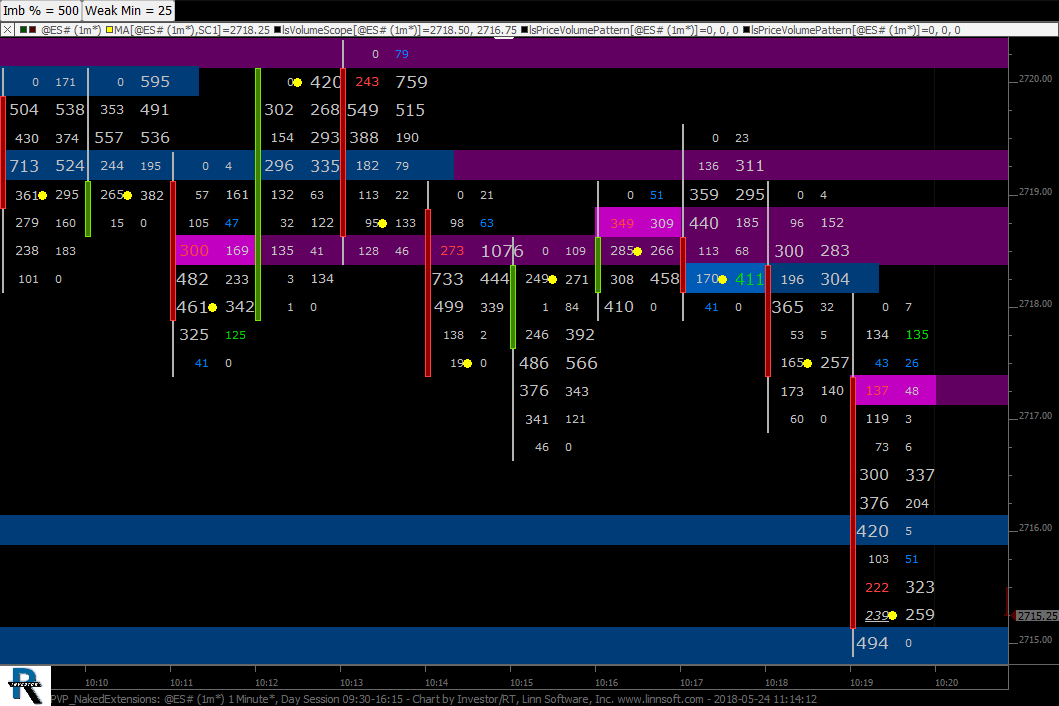 |
PVP NakedExtensions (@ES#) cpayne [totalcount]
7 years 7 months ago
PVP Naked Extensions. This chart was uploaded by Investor/RT 13.3.4 showing symbol: @ES#. |
View |
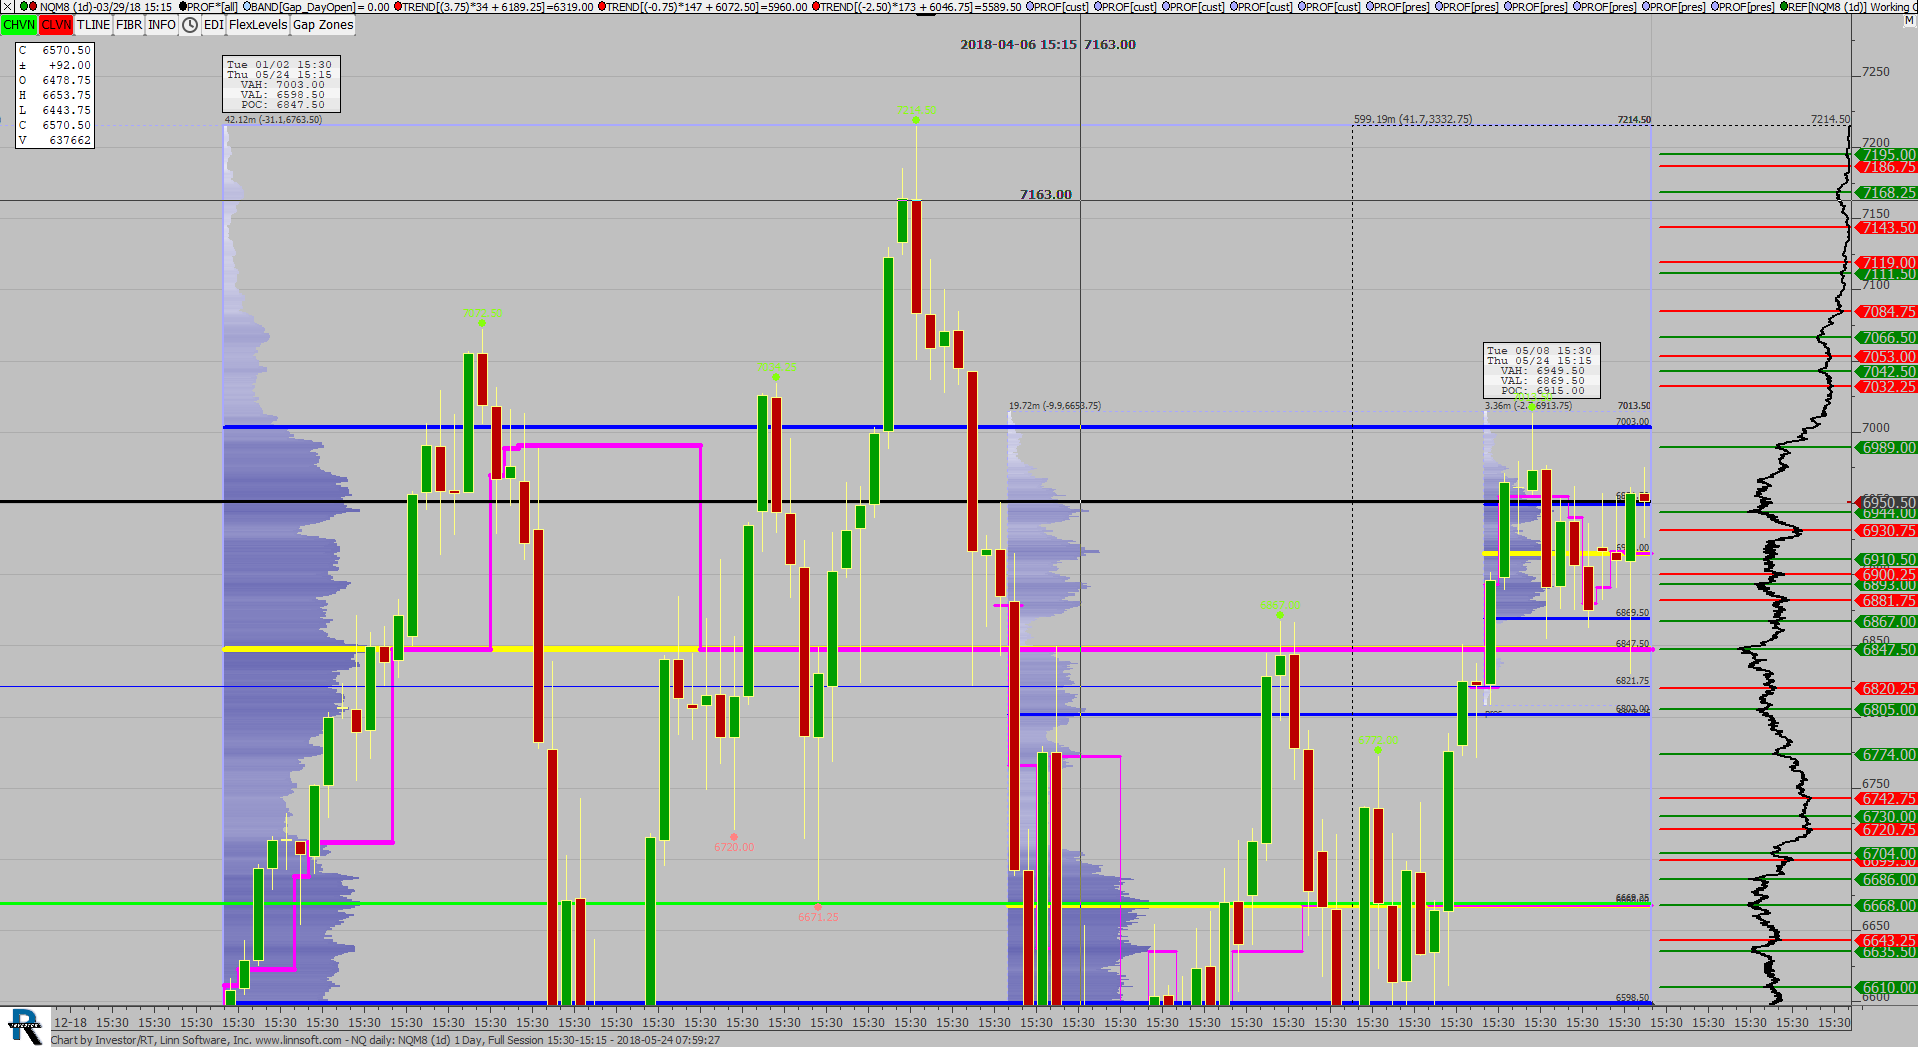 |
NQ daily (NQM8) scottz46 [totalcount]
7 years 7 months ago
This chart was uploaded by Investor/RT 13.3.1 showing symbol: NQM8. |
View |
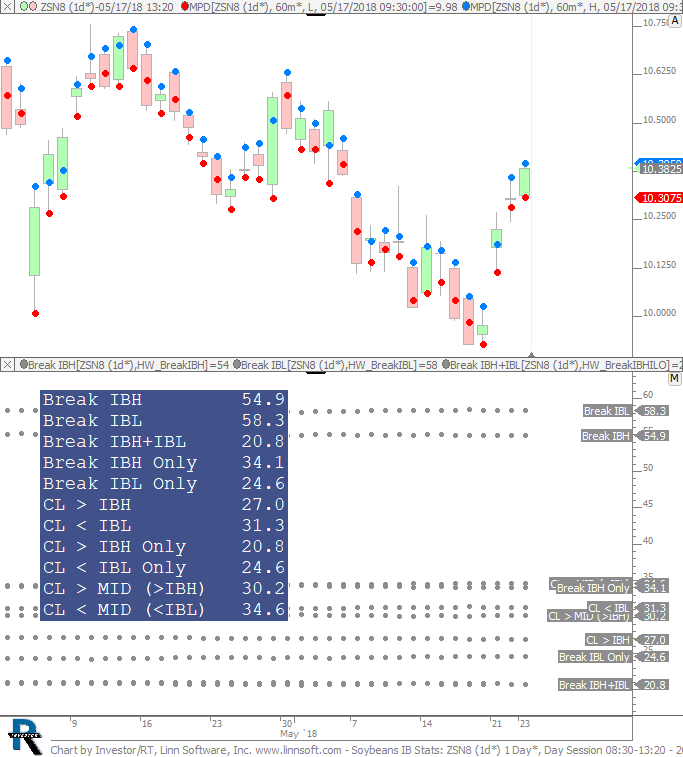 |
Soybeans IB Stats (ZSN8) scottz46 [totalcount]
7 years 7 months ago
This chart was uploaded by Investor/RT 13.3.3 showing symbol: ZSN8. |
View |
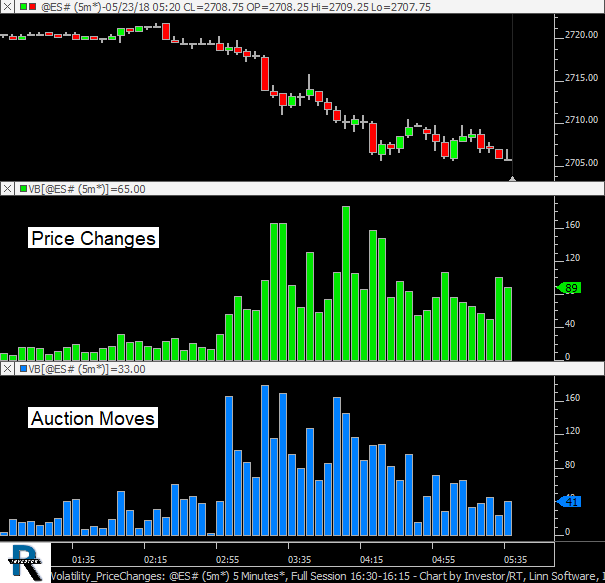 |
Volatility PriceChanges (@ES#) cpayne [totalcount]
7 years 7 months ago
Using VB for Volatility - Price Changes and Auction Moves (Bid Changes). This chart was uploaded by Investor/RT 13.3.4 showing symbol: @ES#. |
View |
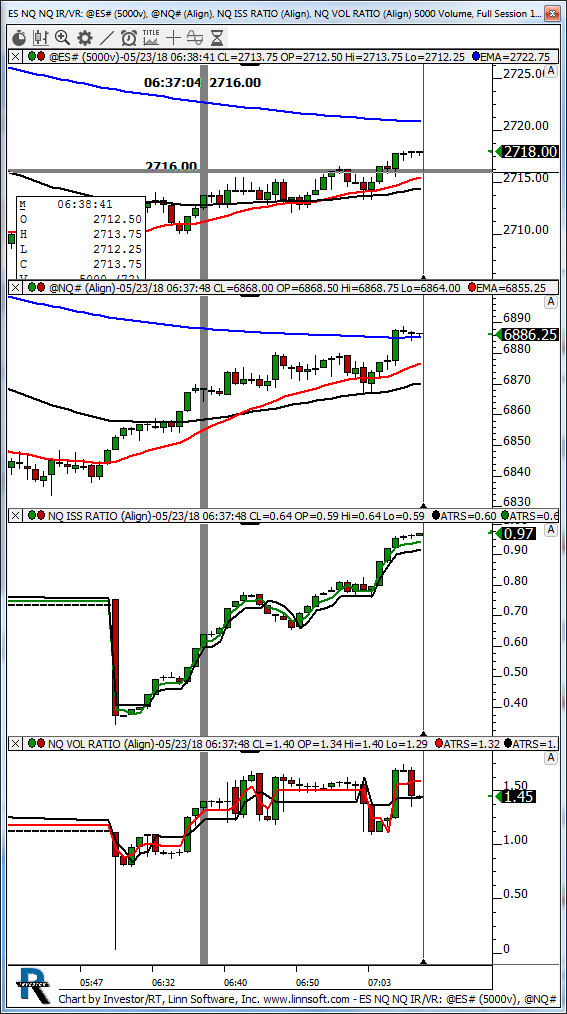 |
ES NQ NQ IR VR (@ES#) kencassorla [totalcount]
7 years 7 months ago
nq. This chart was uploaded by Investor/RT 13.3.3 showing symbol: @ES#. |
View |
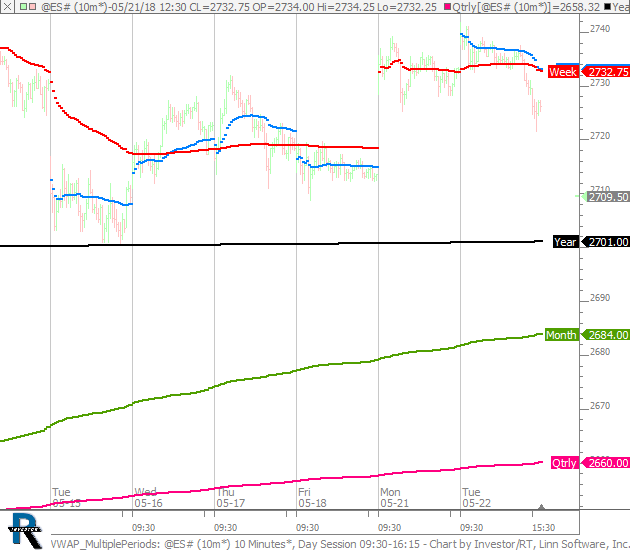 |
VWAP MultiplePeriods (@ES#) cpayne [totalcount]
7 years 7 months ago
VWAP - Multiple Durations. This chart was uploaded by Investor/RT 13.3.3 showing symbol: @ES#. |
View |
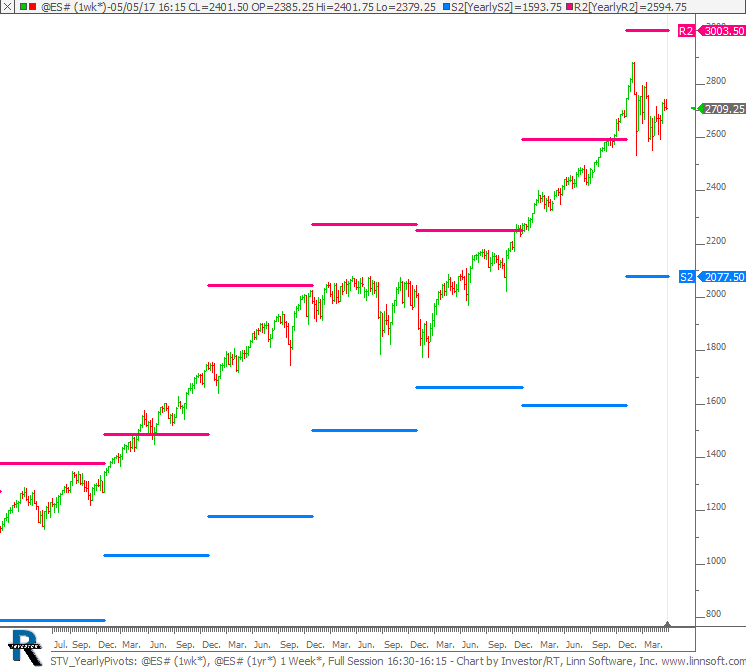 |
STV YearlyPivots (@ES#) cpayne [totalcount]
7 years 7 months ago
Yearly Pivots - S2 and R2. This chart was uploaded by Investor/RT 13.3.4 showing symbol: @ES#. |
View |
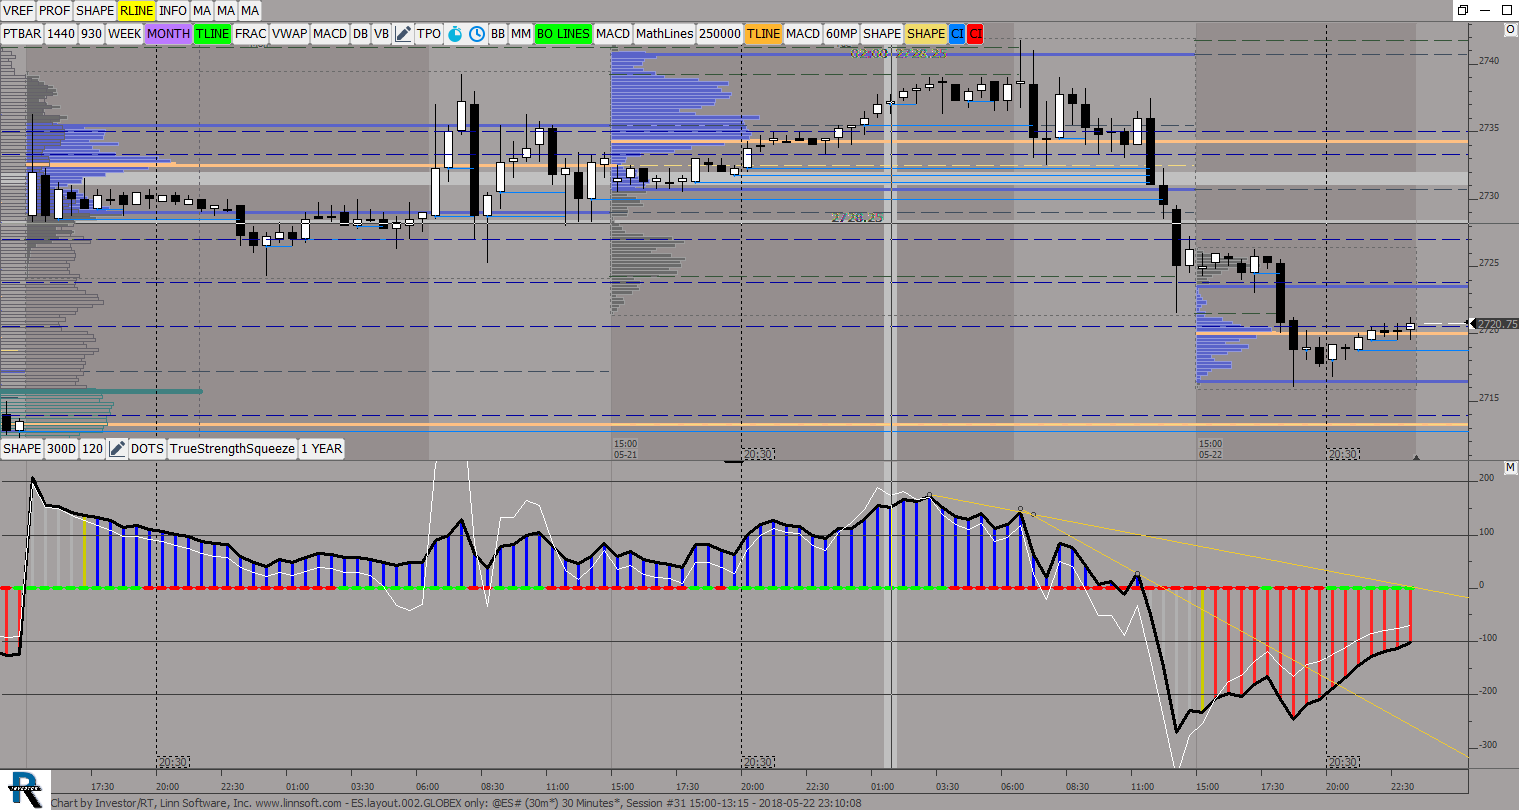 |
ESlayout002GLOBEX only (@ES#) ES42 [totalcount]
7 years 7 months ago
This chart was uploaded by Investor/RT 13.3.3 showing symbol: @ES#. |
View |
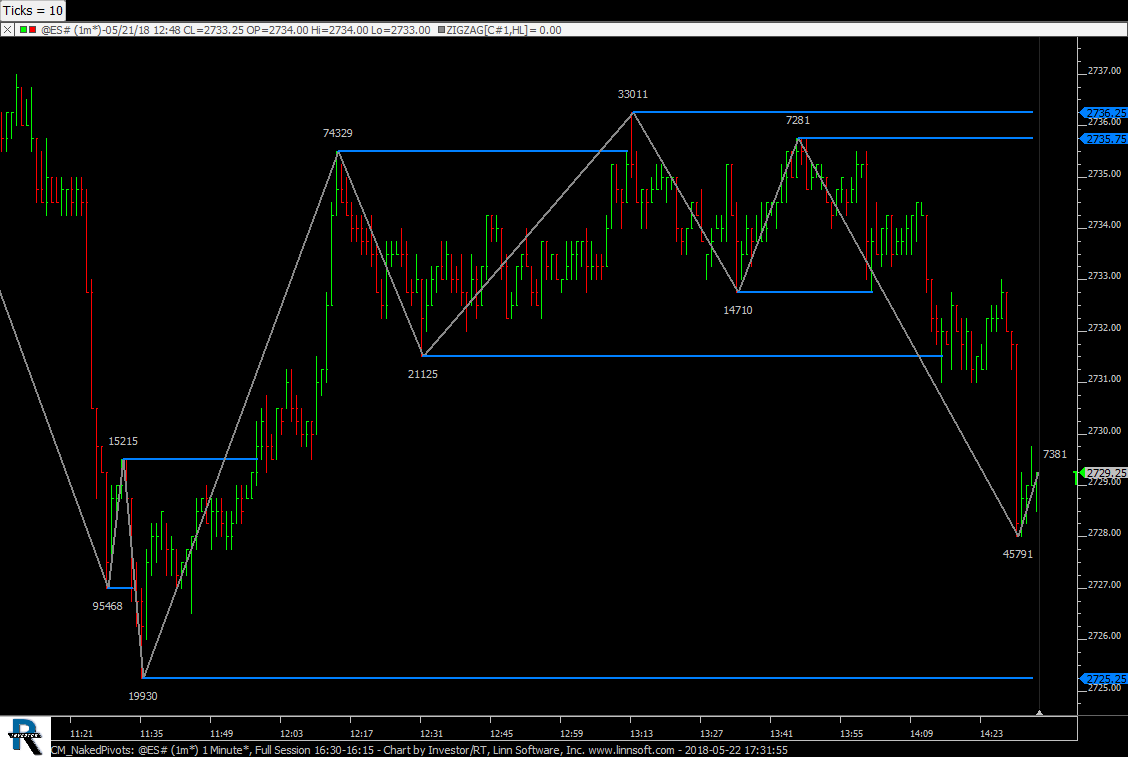 |
CM NakedPivots (@ES#) cpayne [totalcount]
7 years 7 months ago
Extending Pivots of Zig Zag. This chart was uploaded by Investor/RT 13.3.4 showing symbol: @ES#. |
View |
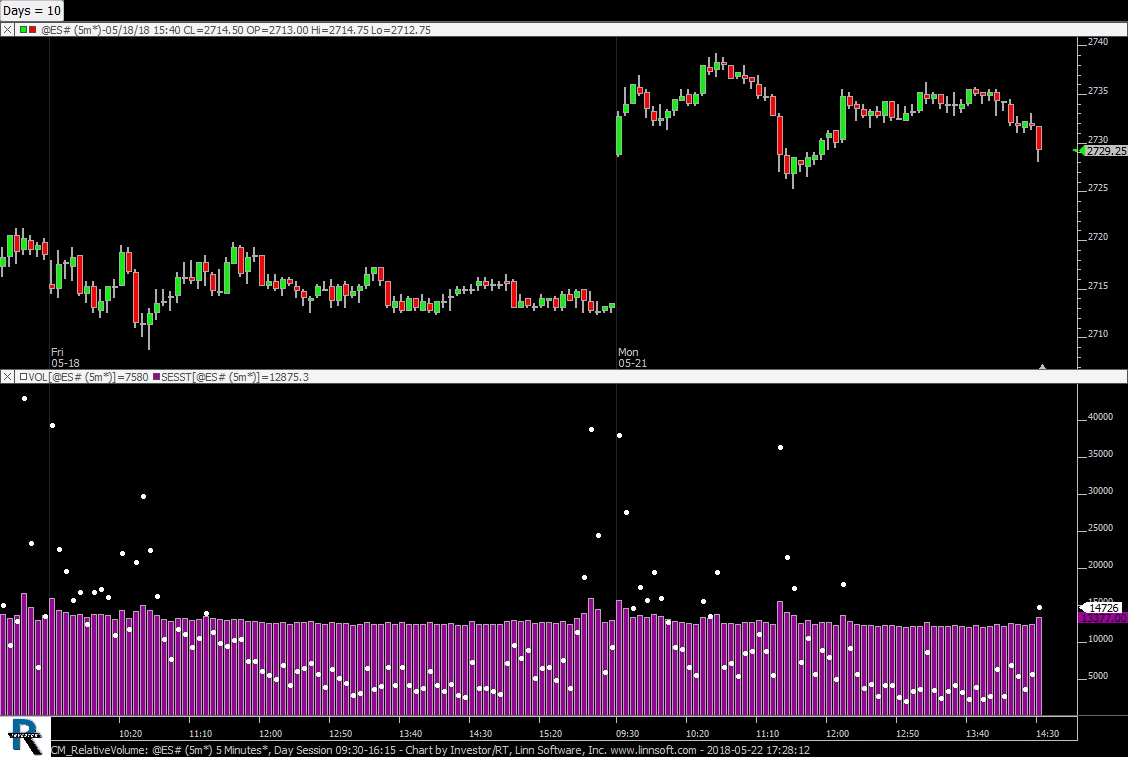 |
CM RelativeVolume (@ES#) cpayne [totalcount]
7 years 7 months ago
Volume vs Average Volume (10 days). This chart was uploaded by Investor/RT 13.3.4 showing symbol: @ES#. |
View |
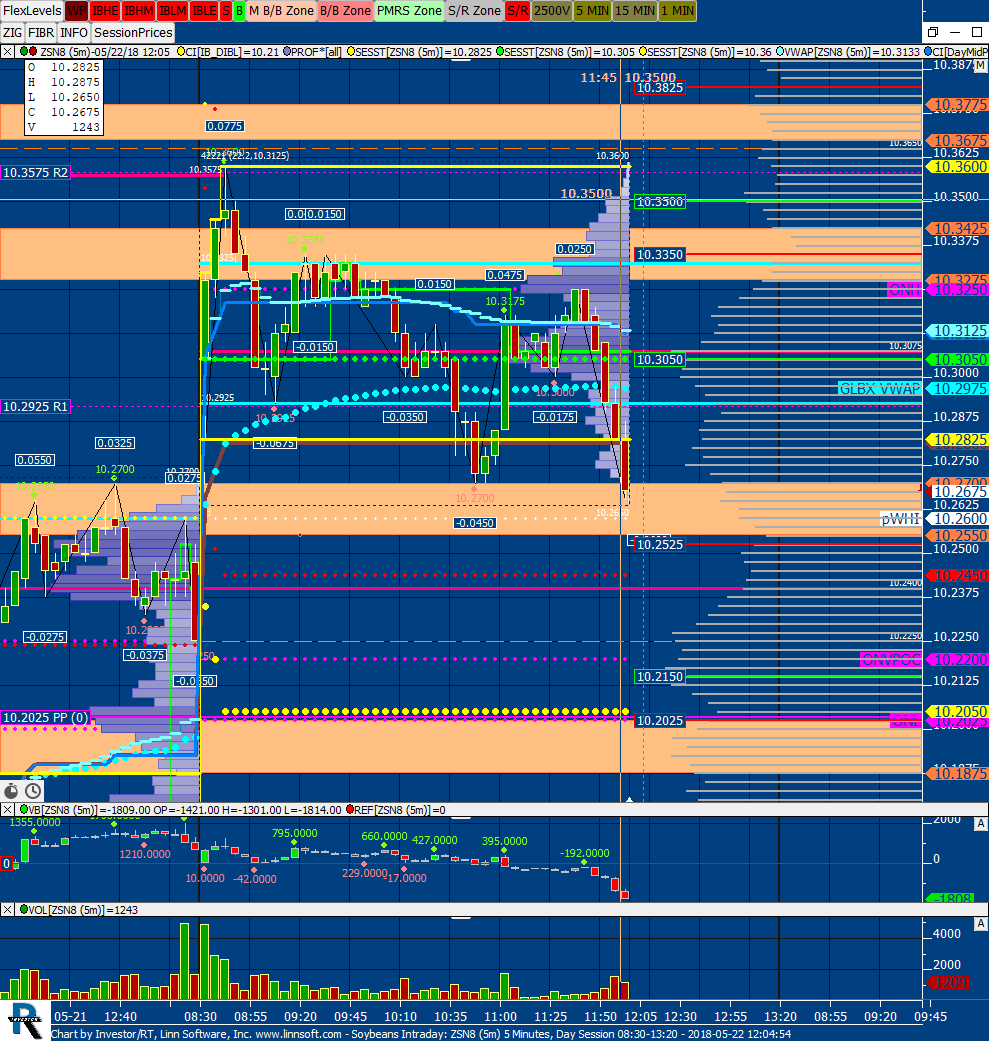 |
Soybeans Intraday (ZSN8) scottz46 [totalcount]
7 years 7 months ago
This chart was uploaded by Investor/RT 13.3.3 showing symbol: ZSN8. |
View |
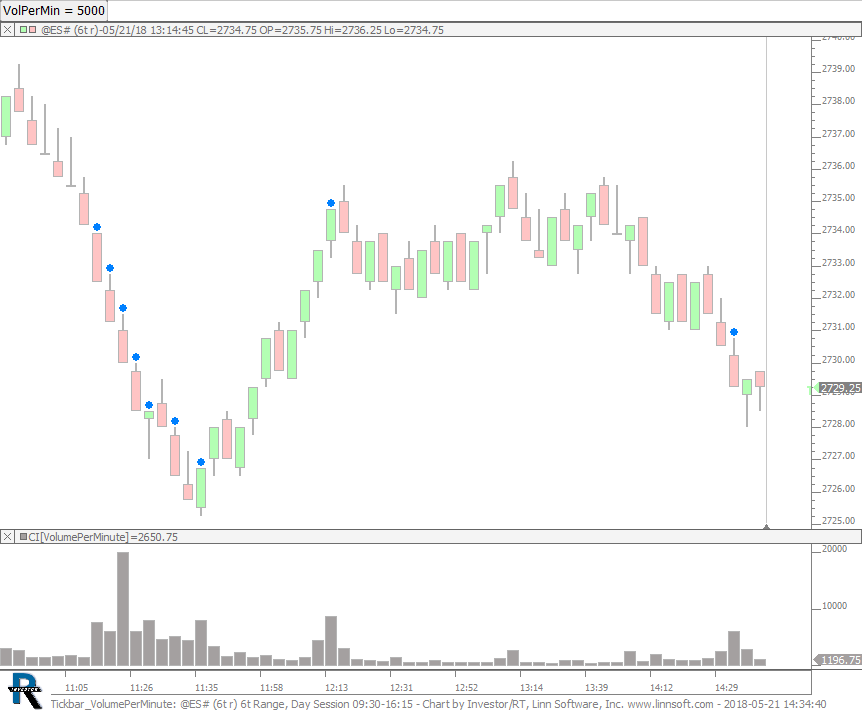 |
Tickbar VolumePerMinute (@ES#) cpayne [totalcount]
7 years 7 months ago
Volume Per Minute Alerts. This chart was uploaded by Investor/RT 13.3.4 showing symbol: @ES#. |
View |
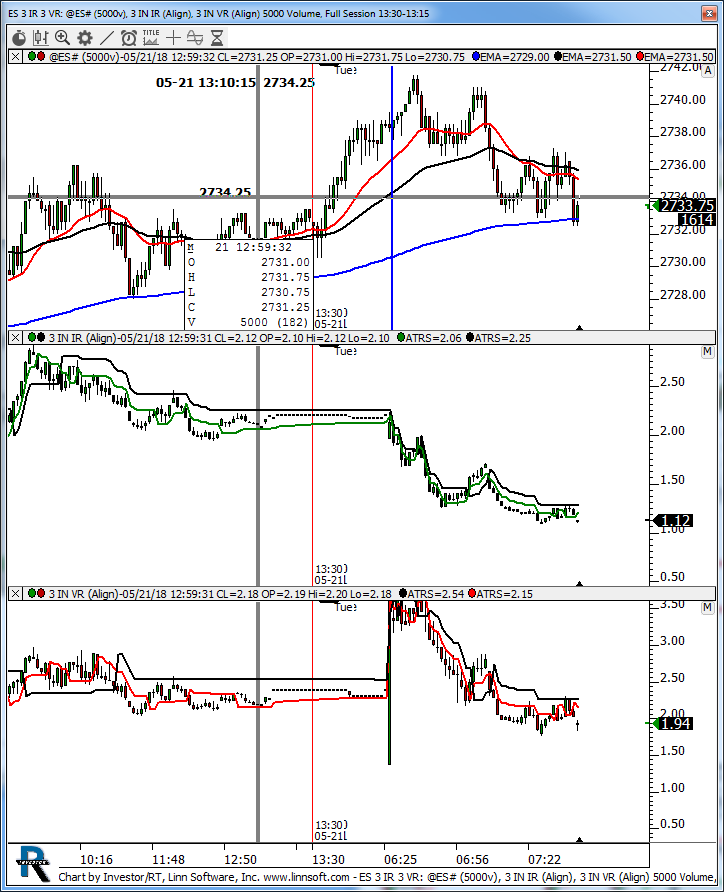 |
ES 3 IR 3 VR (@ES#) kencassorla [totalcount]
7 years 7 months ago
3 index ad's. This chart was uploaded by Investor/RT 13.3.3 showing symbol: @ES#. |
View |
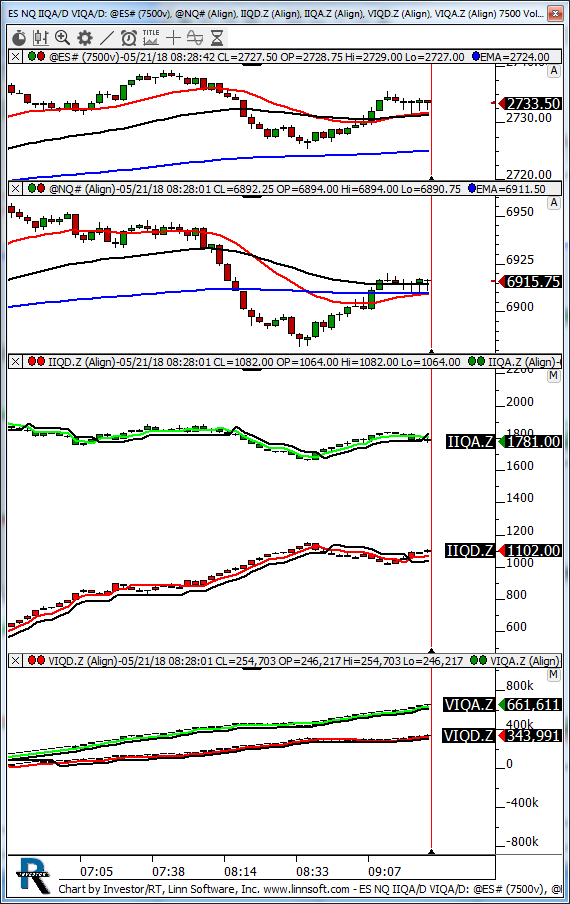 |
ES NQ IIQA D VIQA D (@ES#) kencassorla [totalcount]
7 years 7 months ago
7500v NQ. This chart was uploaded by Investor/RT 13.3.3 showing symbol: @ES#. |
View |
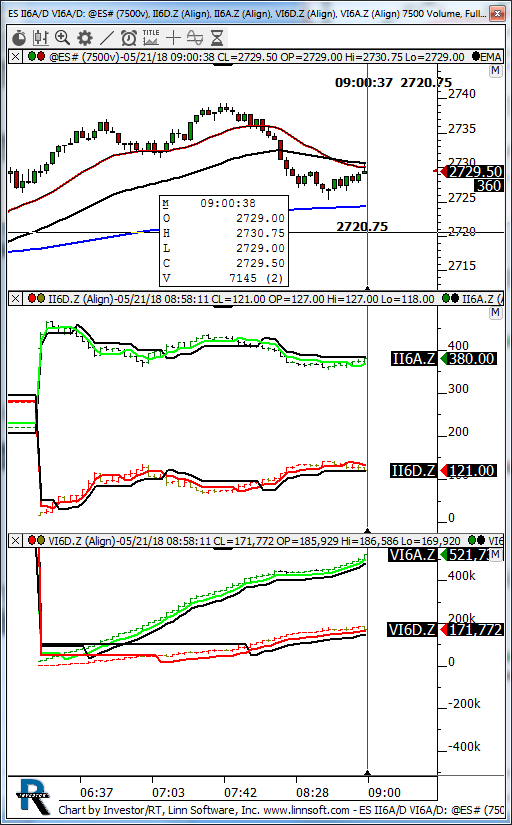 |
ES II6A D VI6A D (@ES#) kencassorla [totalcount]
7 years 7 months ago
ad's. This chart was uploaded by Investor/RT 13.3.3 showing symbol: @ES#. |
View |
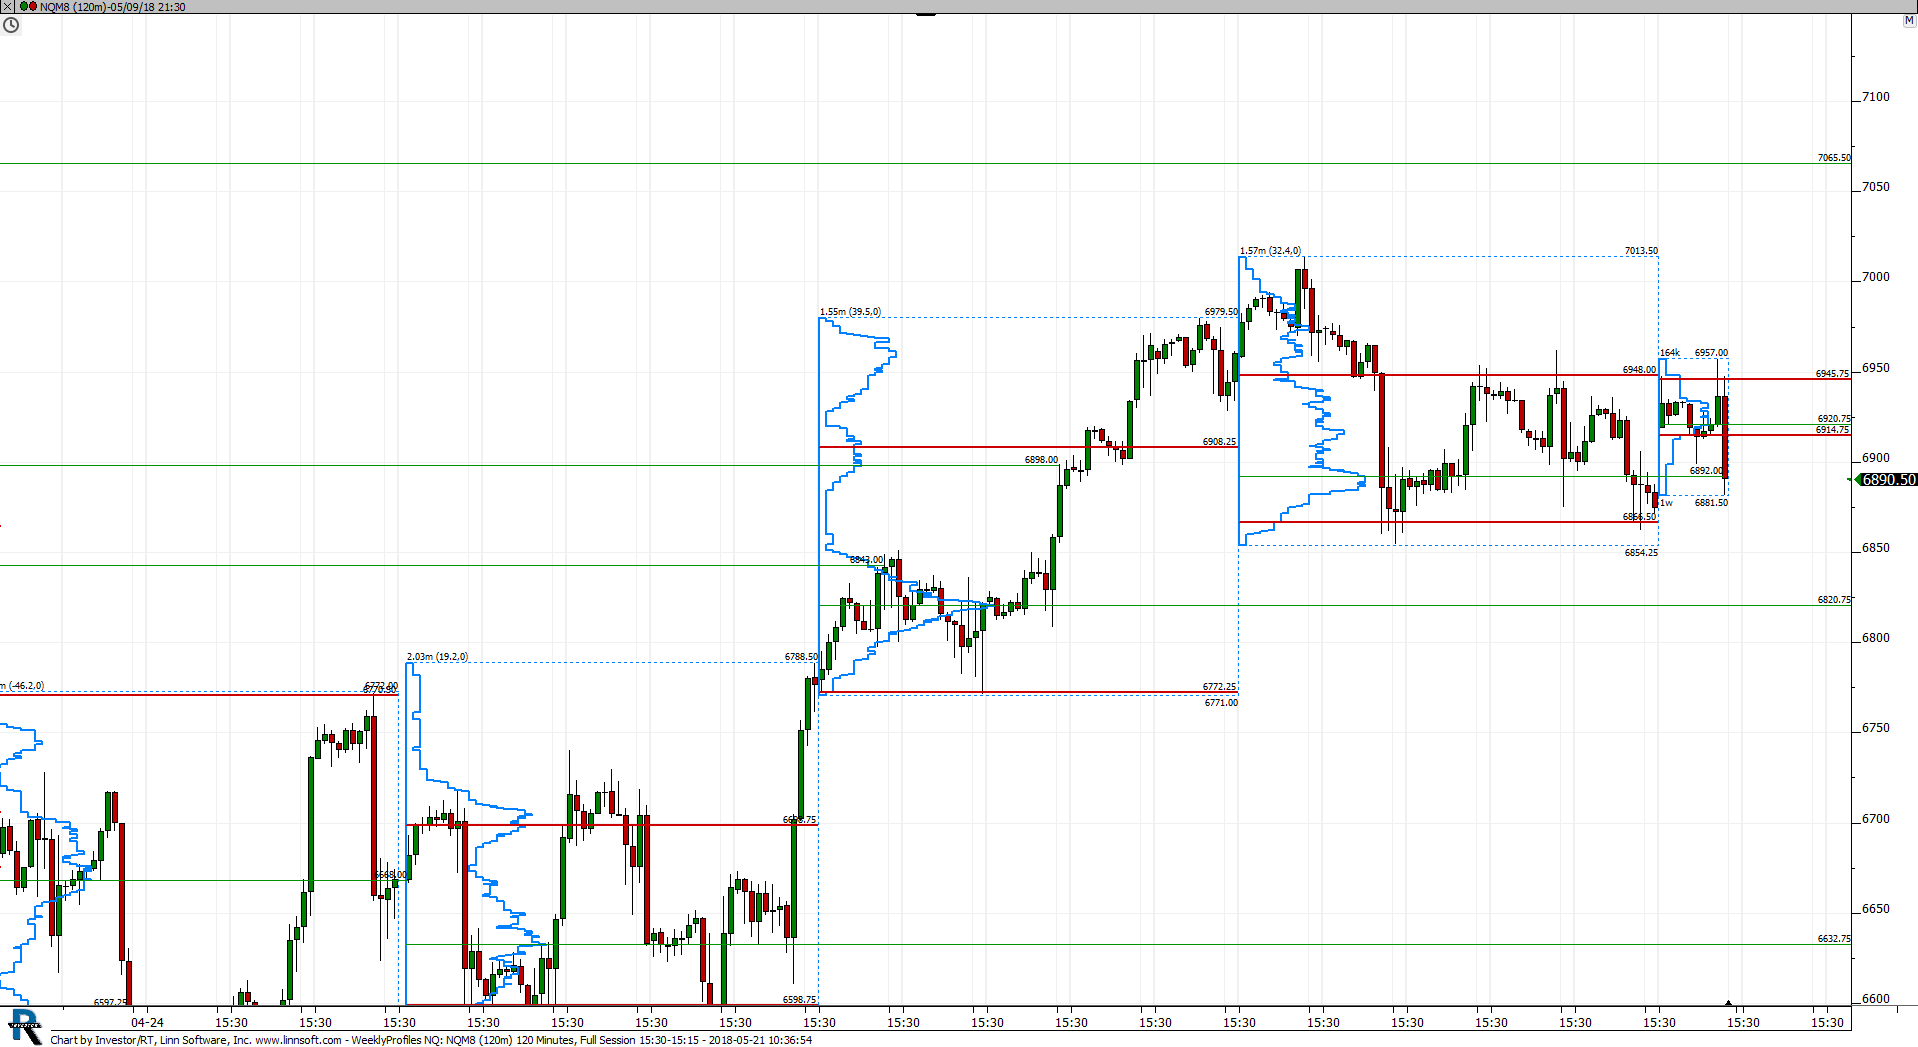 |
WeeklyProfiles NQ (NQM8) scottz46 [totalcount]
7 years 7 months ago
This chart was uploaded by Investor/RT 13.3.3 showing symbol: NQM8. |
View |
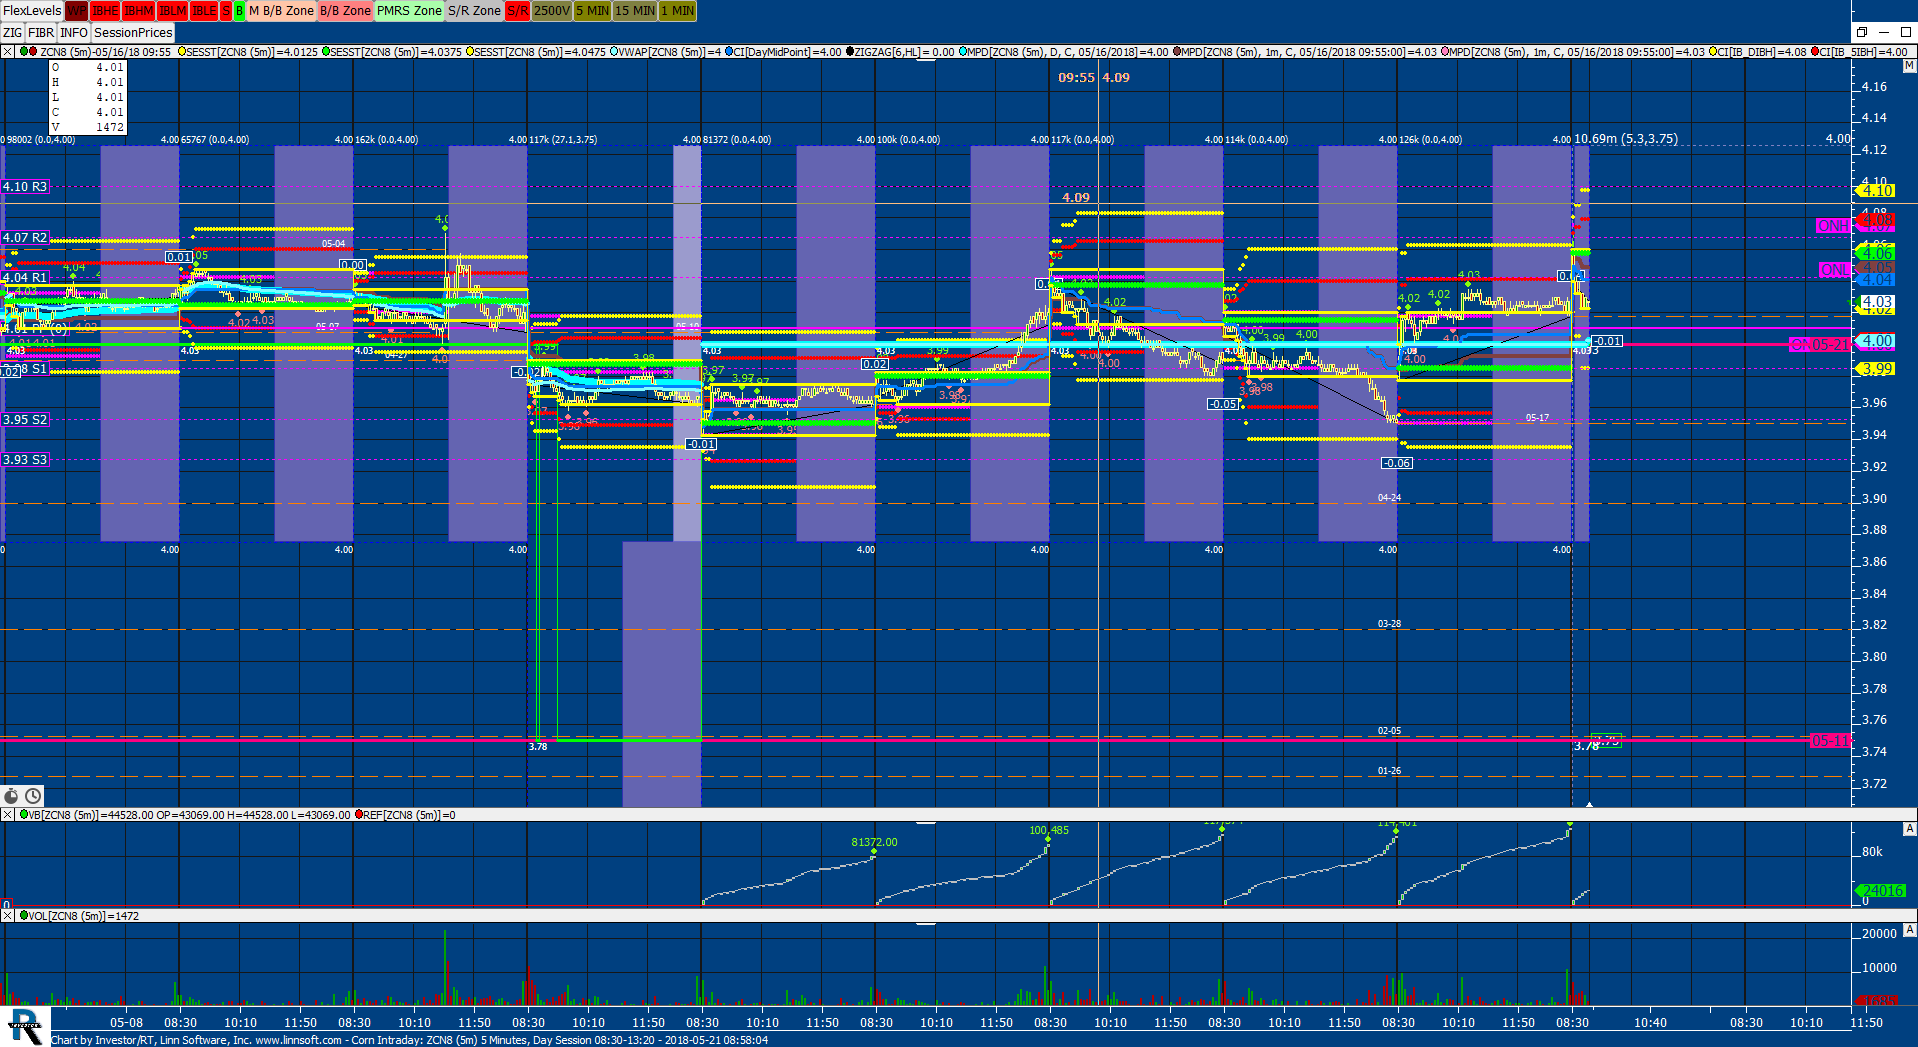 |
Corn Intraday (ZCN8) scottz46 [totalcount]
7 years 7 months ago
This chart was uploaded by Investor/RT 13.3.3 showing symbol: ZCN8. |
View |
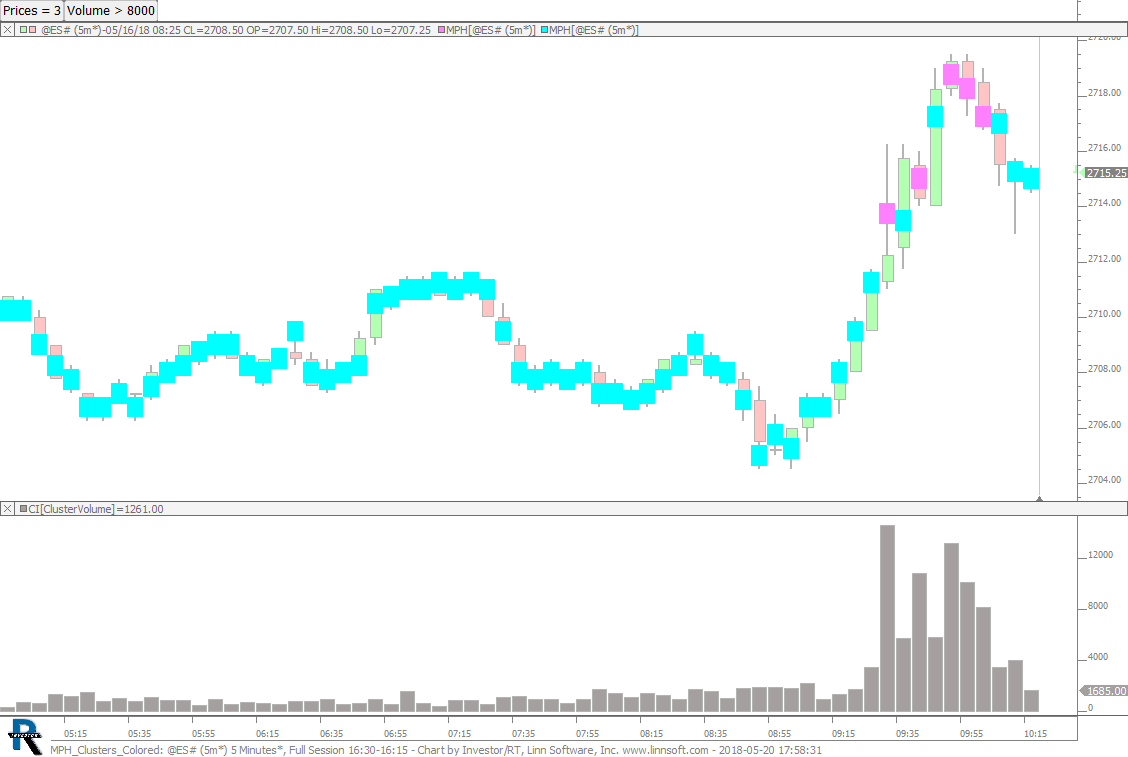 |
MPH Clusters Colored (@ES#) cpayne [totalcount]
7 years 7 months ago
Painting Volume Clusters. This chart was uploaded by Investor/RT 13.3.3 showing symbol: @ES#. |
View |
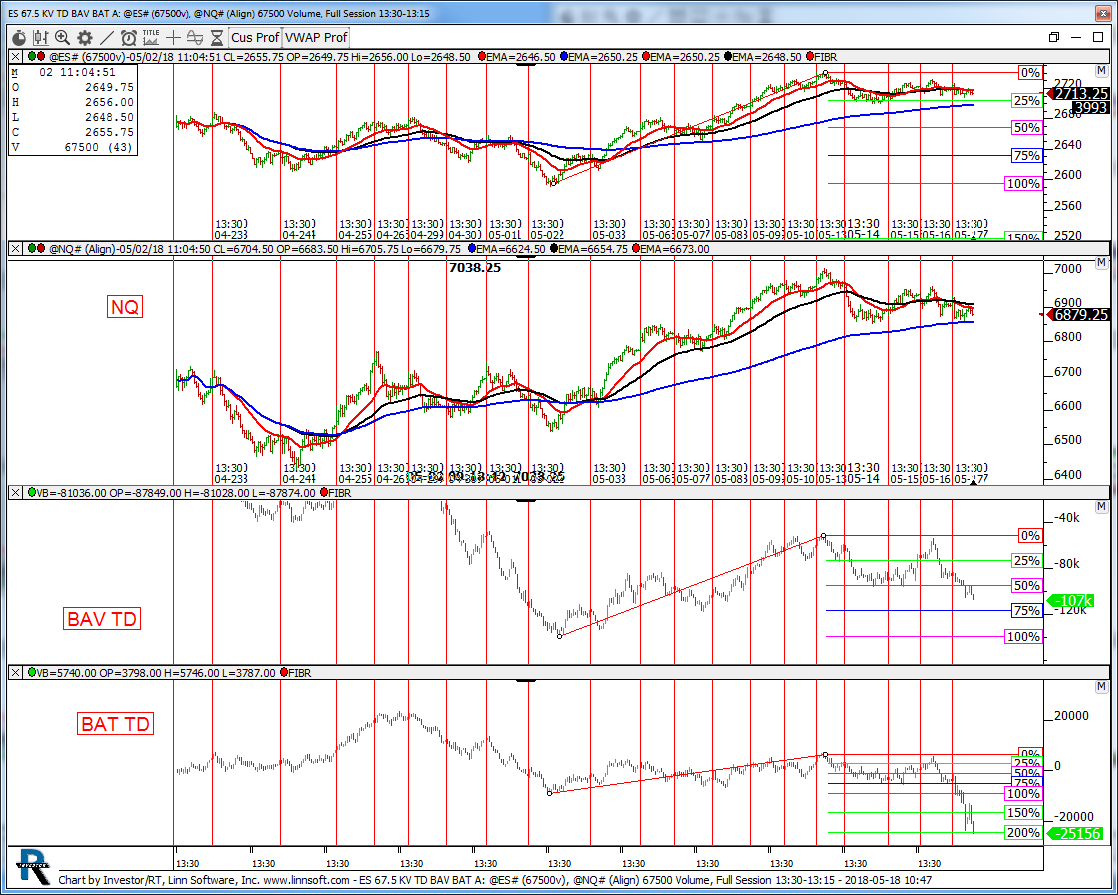 |
ES 675 KV TD BAV BAT A (@ES#) kencassorla [totalcount]
7 years 7 months ago
67.5 kv. This chart was uploaded by Investor/RT 13.3.3 showing symbol: @ES#. |
View |
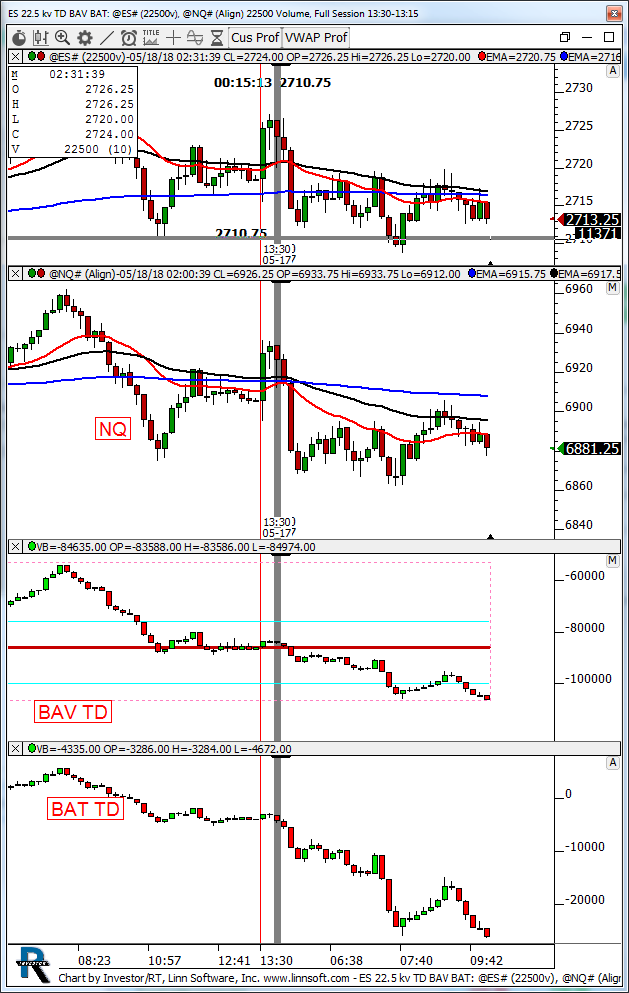 |
ES 225 kv TD BAV BAT (@ES#) kencassorla [totalcount]
7 years 7 months ago
22.5 kv. This chart was uploaded by Investor/RT 13.3.3 showing symbol: @ES#. |
View |
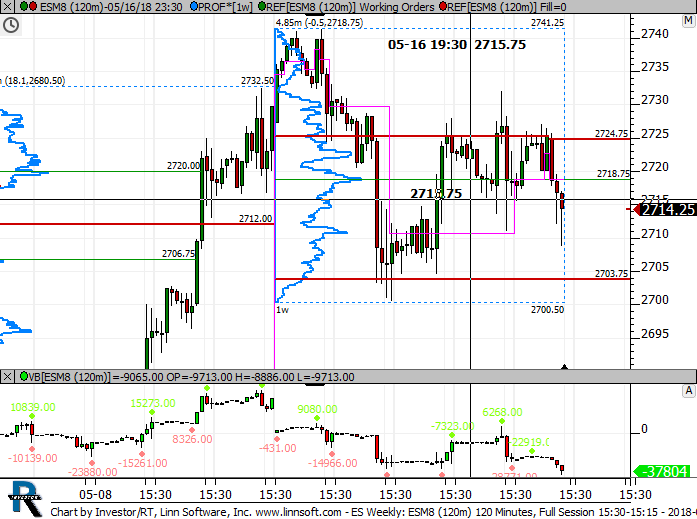 |
ES Weekly (ESM8) scottz46 [totalcount]
7 years 7 months ago
This chart was uploaded by Investor/RT 13.3.1 showing symbol: ESM8. |
View |