 |
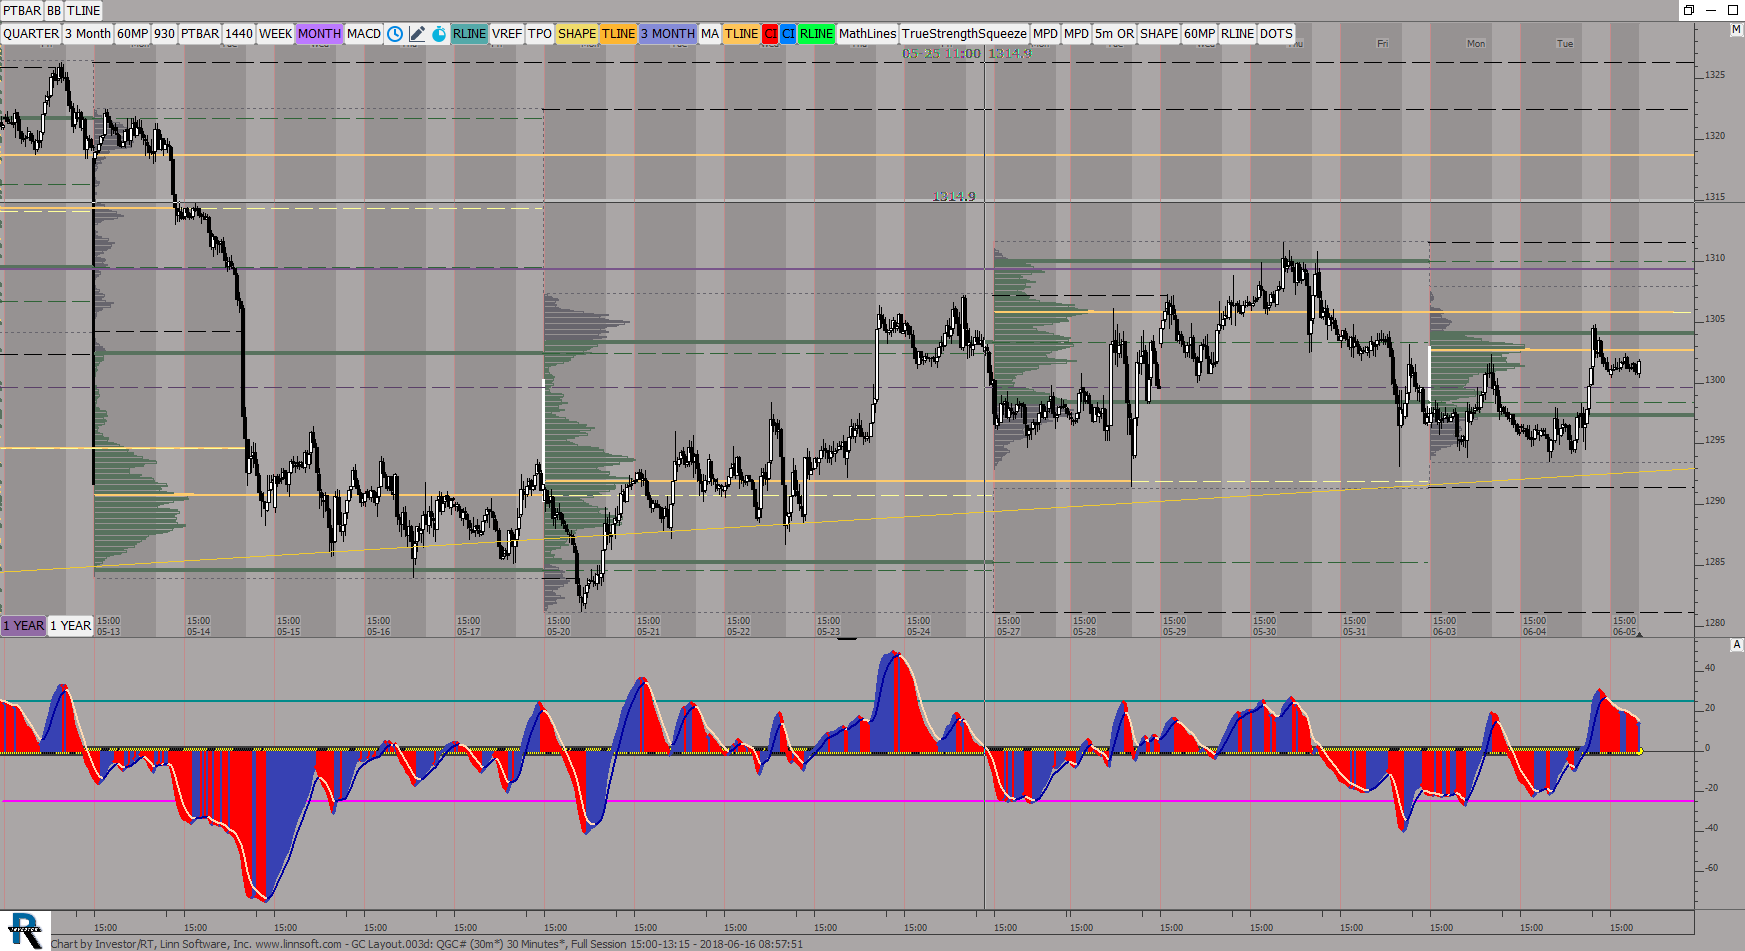
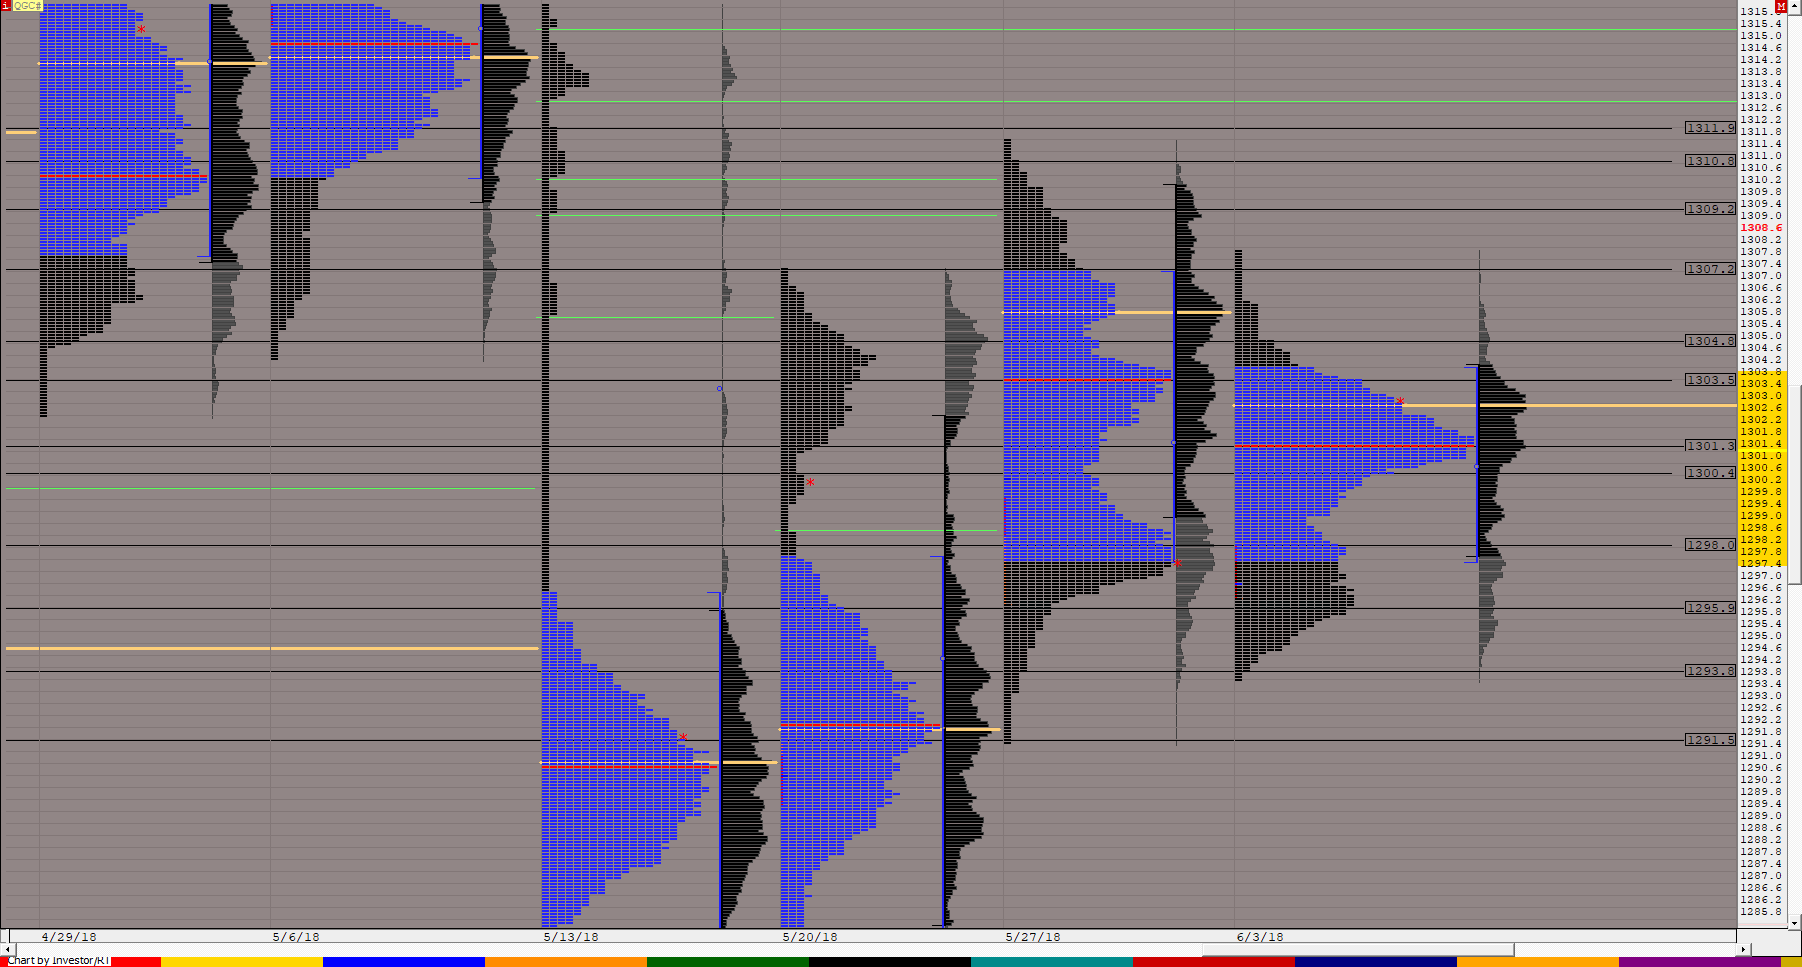
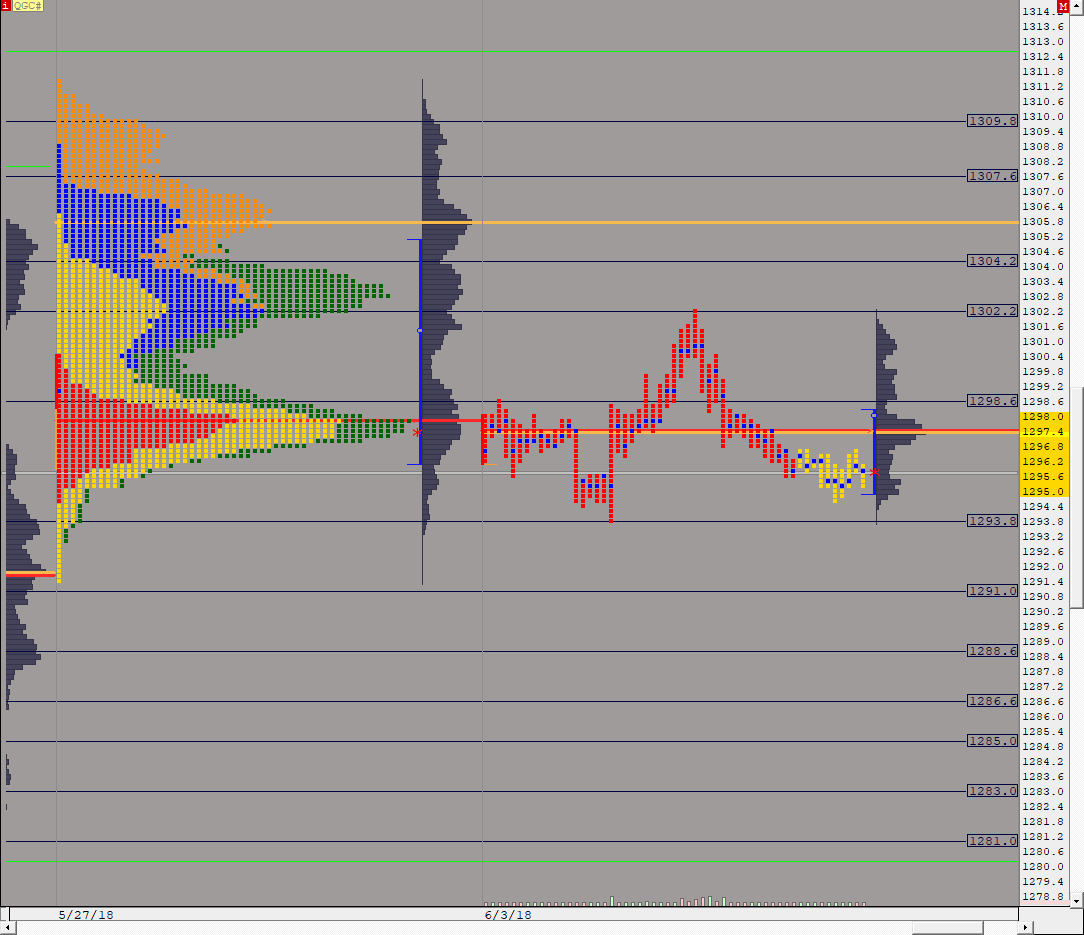
GC Layout003d (QGC#) ES42 [totalcount]
8 years 1 month ago
This chart was uploaded by Investor/RT 13.3.3 showing symbol: QGC#. |
View |
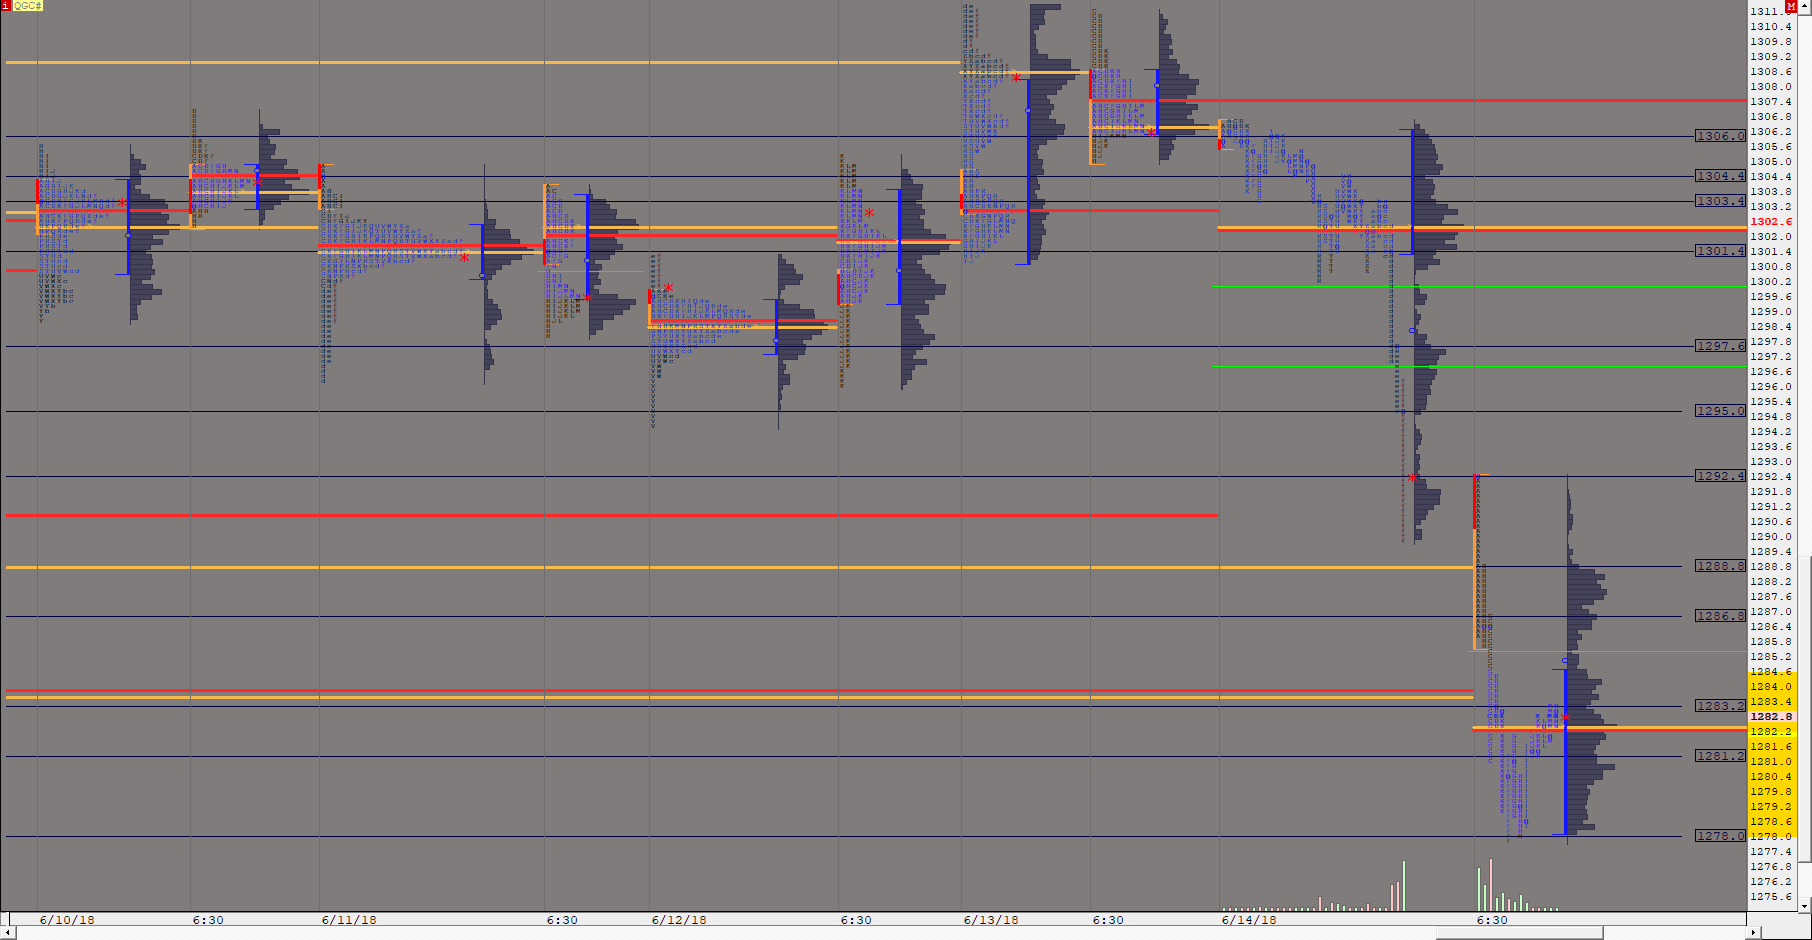 |
GC Layout003c (QGC#) ES42 [totalcount]
8 years 1 month ago
This chart was uploaded by Investor/RT 13.3.4 showing symbol: QGC#. |
View |
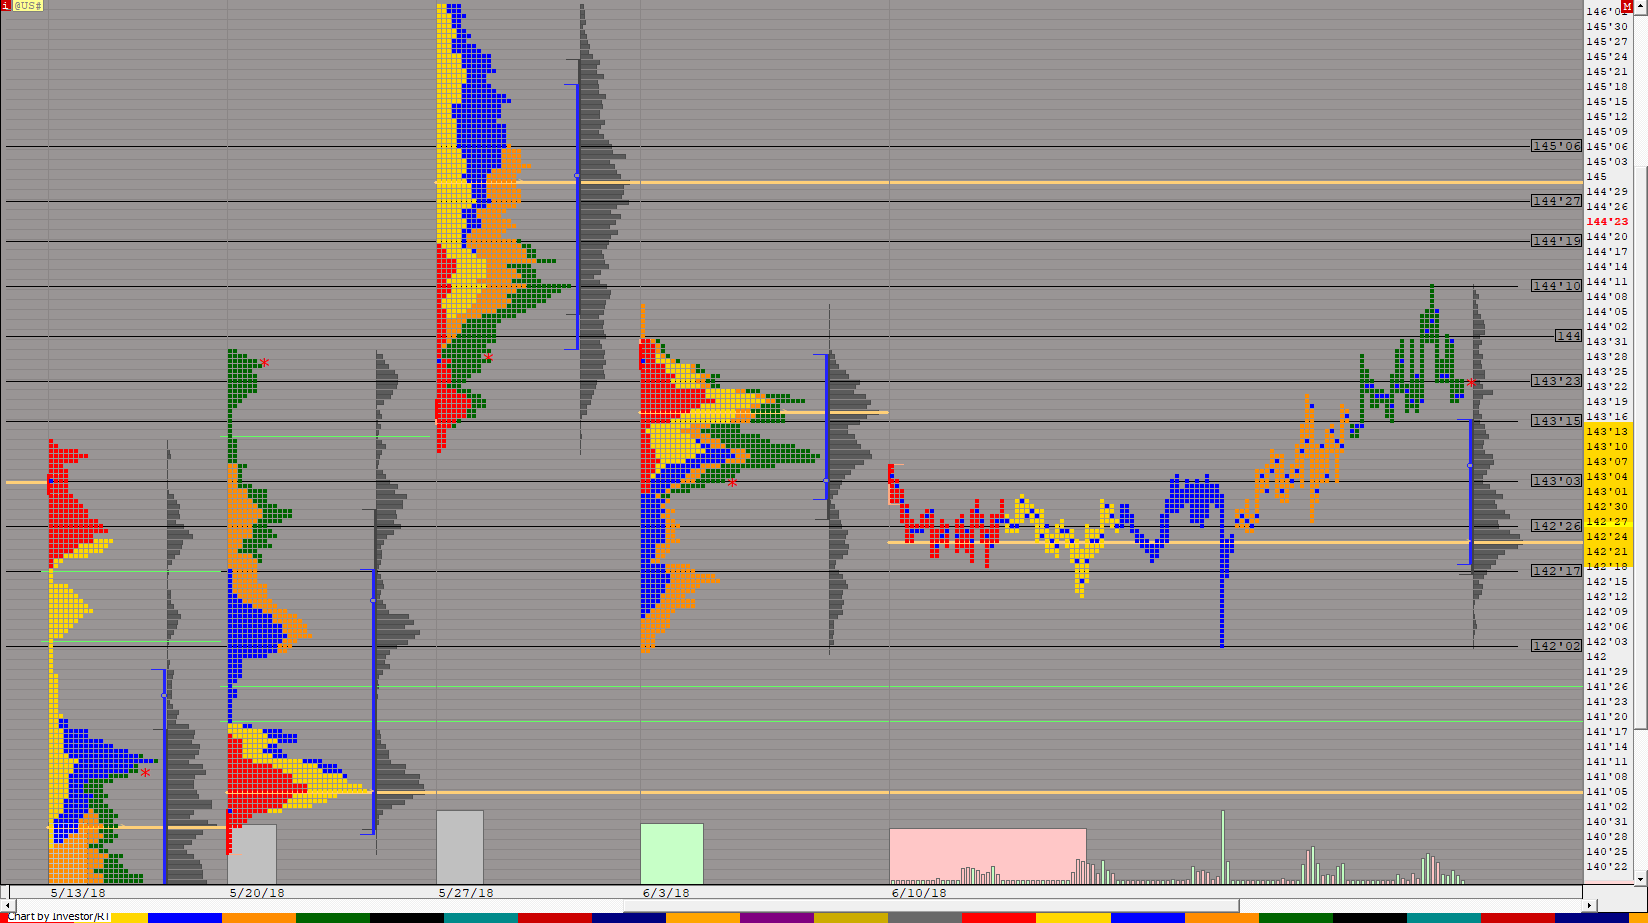 |
MPBONDS GLOBEX WEEKLY (@US#) ES42 [totalcount]
8 years 1 month ago
This chart was uploaded by Investor/RT 13.3.4 showing symbol: @US#. |
View |
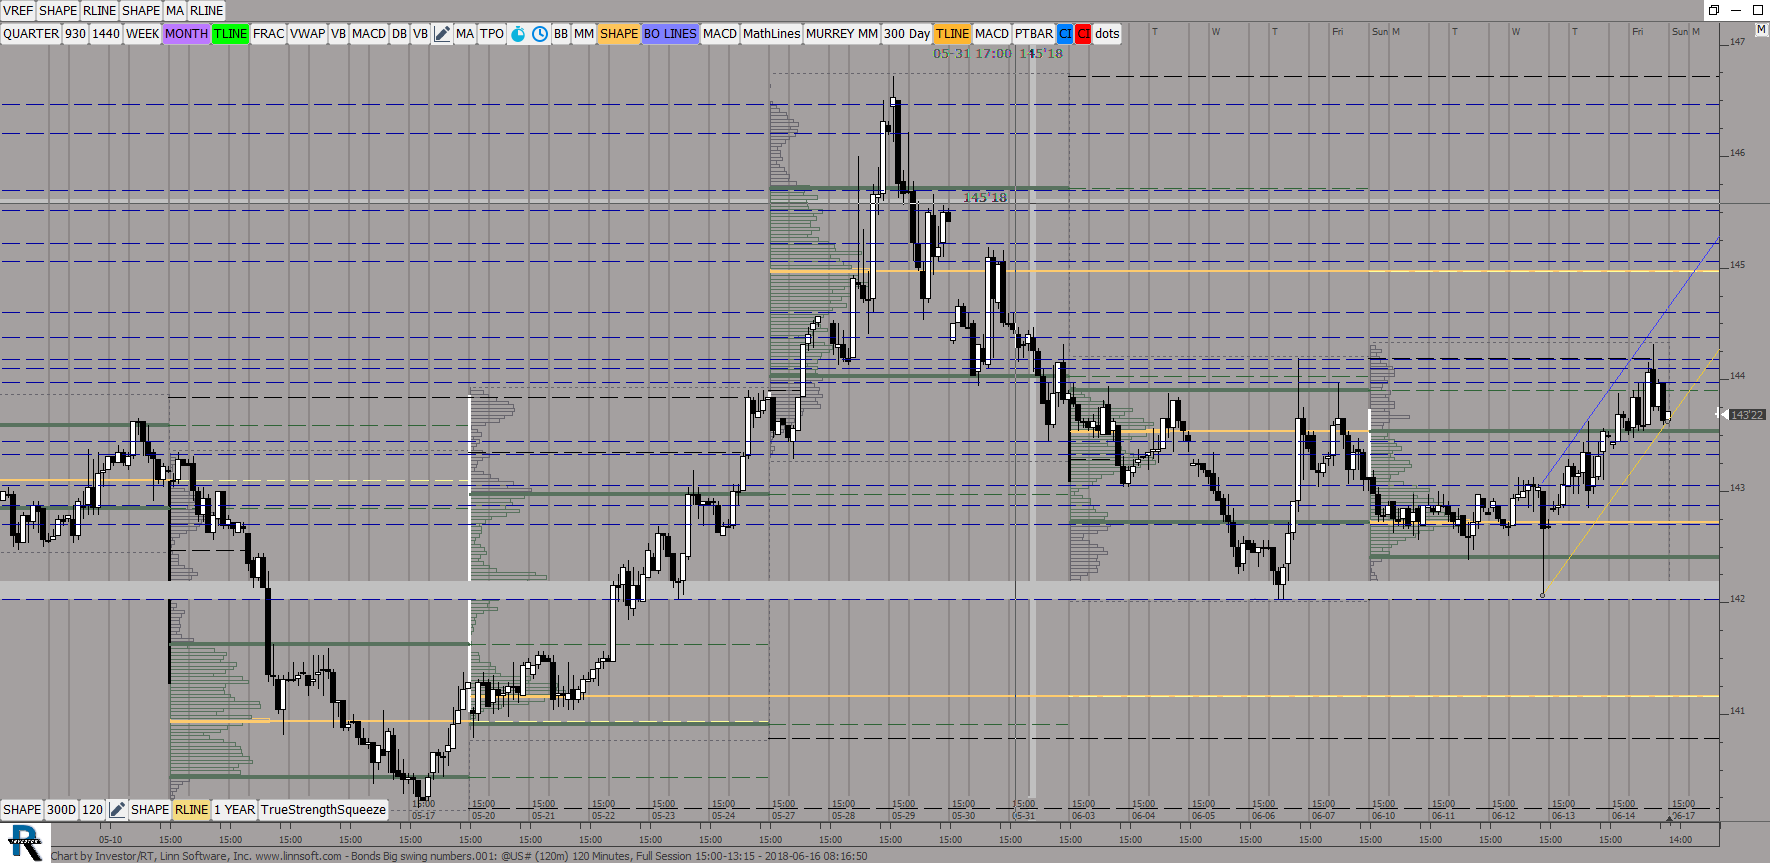 |
Bonds Big swing numbers (@US#) ES42 [totalcount]
8 years 1 month ago
This chart was uploaded by Investor/RT 13.3.4 showing symbol: @US#. |
View |
 |
OIL Layout001b (QCL#) ES42 [totalcount]
8 years 1 month ago
This chart was uploaded by Investor/RT 13.3.3 showing symbol: QCL#. |
View |
 |
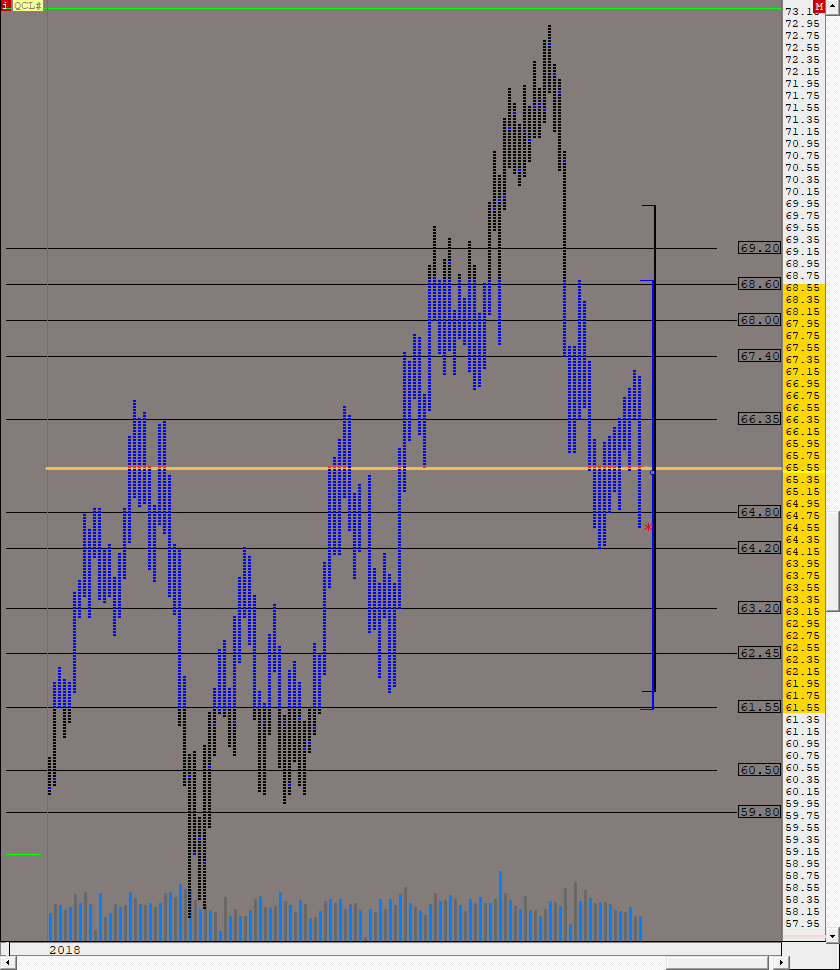
Oil Layout001a (QCL#) ES42 [totalcount]
8 years 1 month ago
This chart was uploaded by Investor/RT 13.3.3 showing symbol: QCL#. |
View |
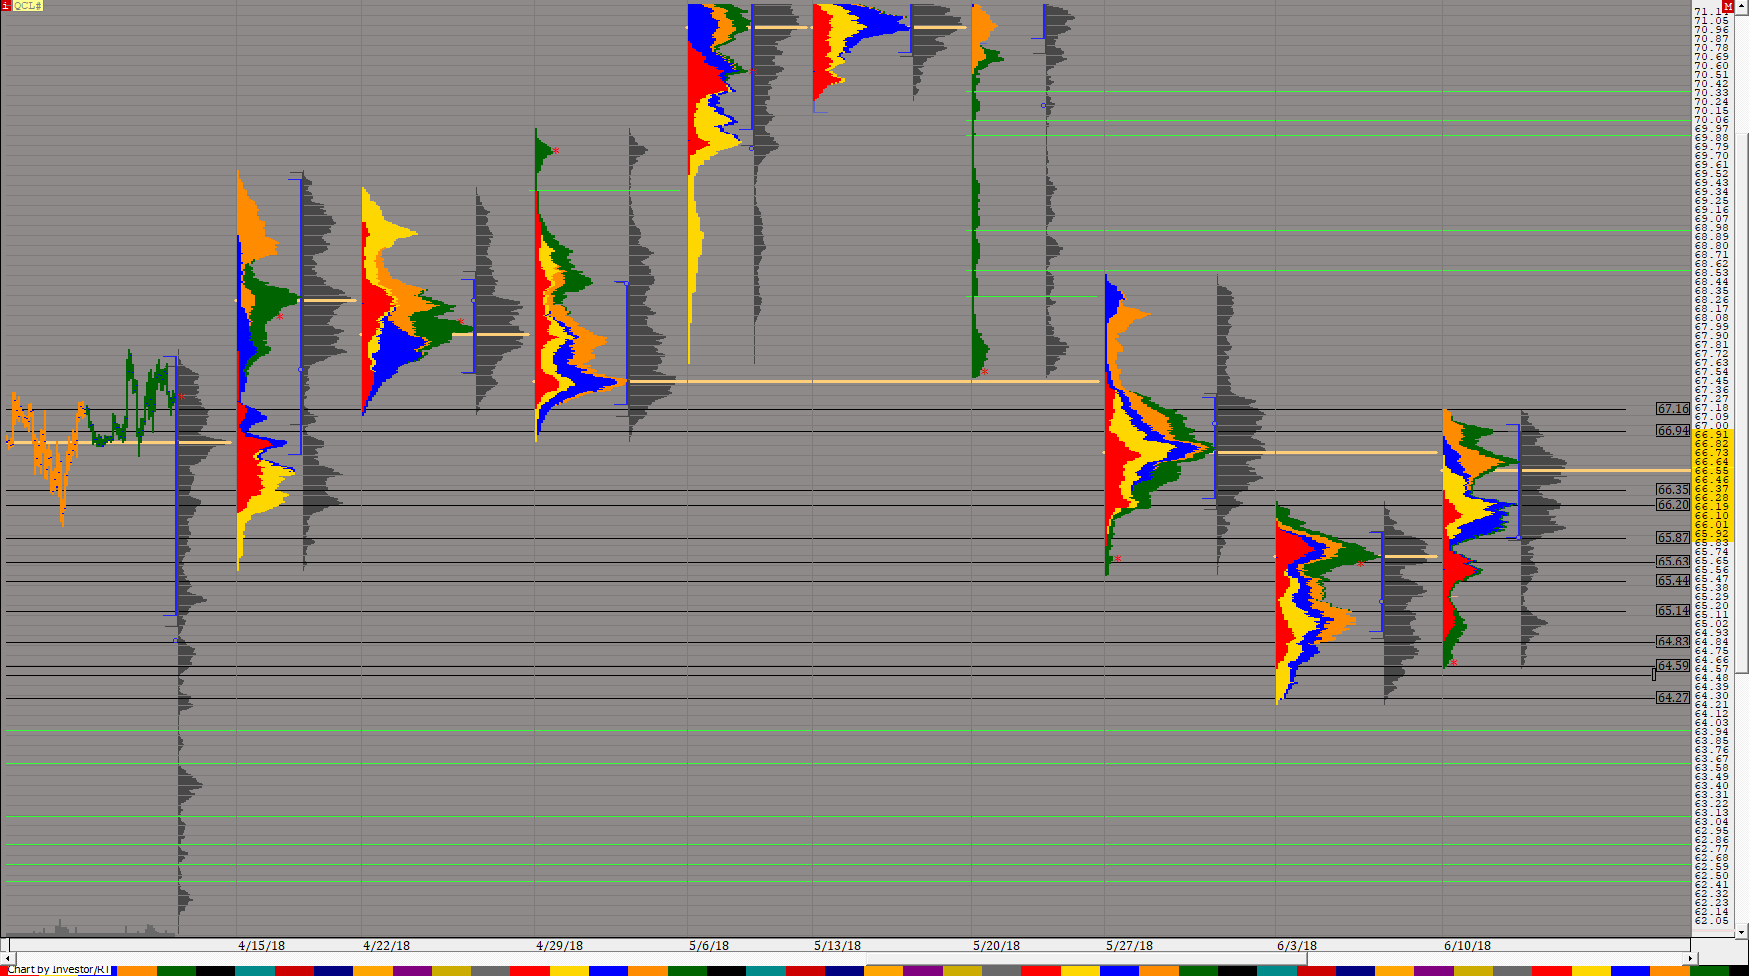 |
Market profileGlobexmonthly (QCL#) ES42 [totalcount]
8 years 1 month ago
This chart was uploaded by Investor/RT 13.3.4 showing symbol: QCL#. |
View |
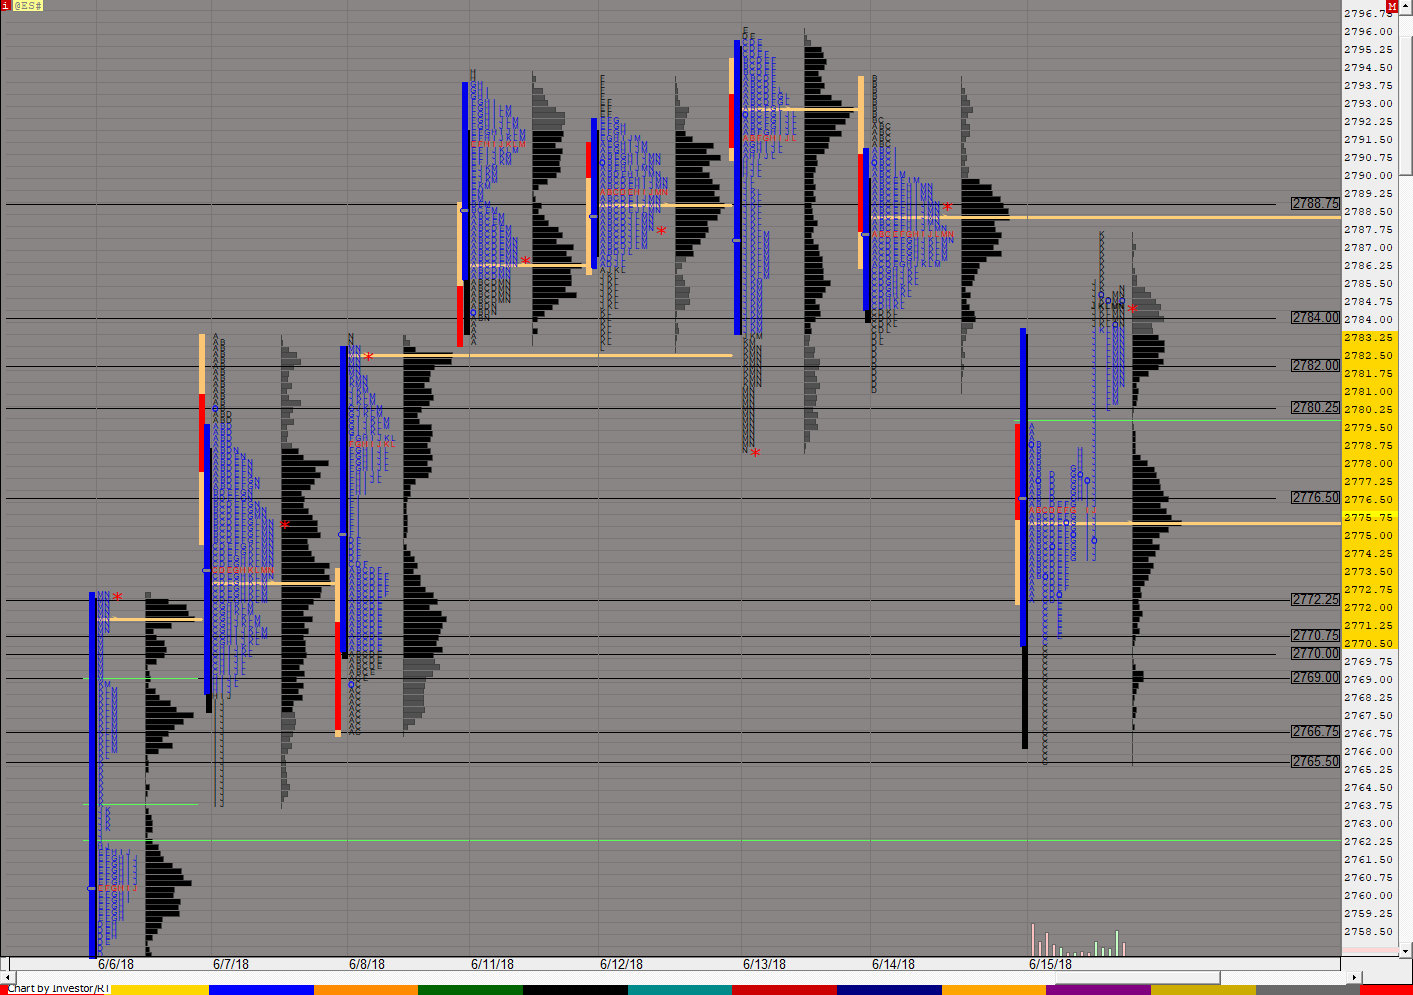 |
Market Profile 24 hour (@ES#) ES42 [totalcount]
8 years 1 month ago
This chart was uploaded by Investor/RT 13.3.4 showing symbol: @ES#. |
View |
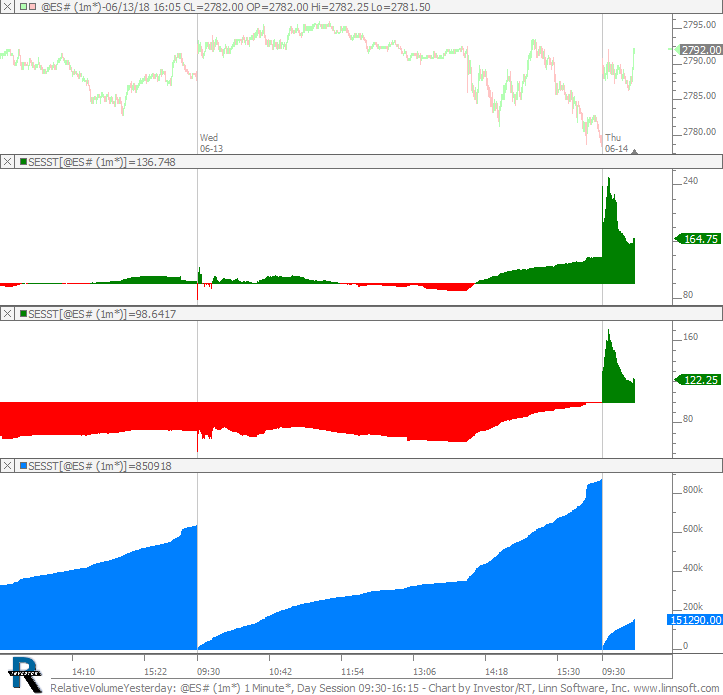 |
RelativeVolumeYesterday (@ES#) cpayne [totalcount]
8 years 1 month ago
Relative Volume (at time of day) vs Yesterday and vs 20 day average. This chart was uploaded by Investor/RT 13.3.5 showing symbol: @ES#. |
View |
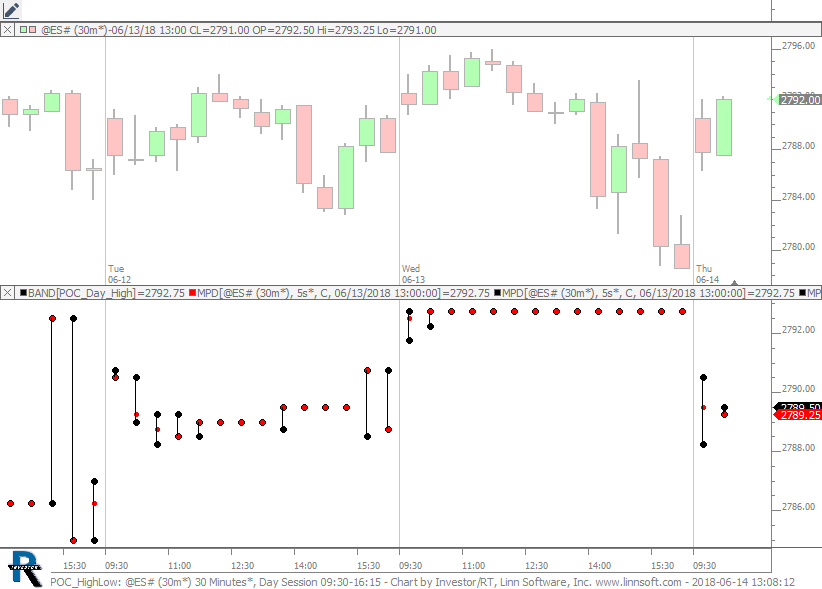 |
POC HighLow (@ES#) cpayne [totalcount]
8 years 1 month ago
This chart was uploaded by Investor/RT 13.3.5 showing symbol: @ES#. |
View |
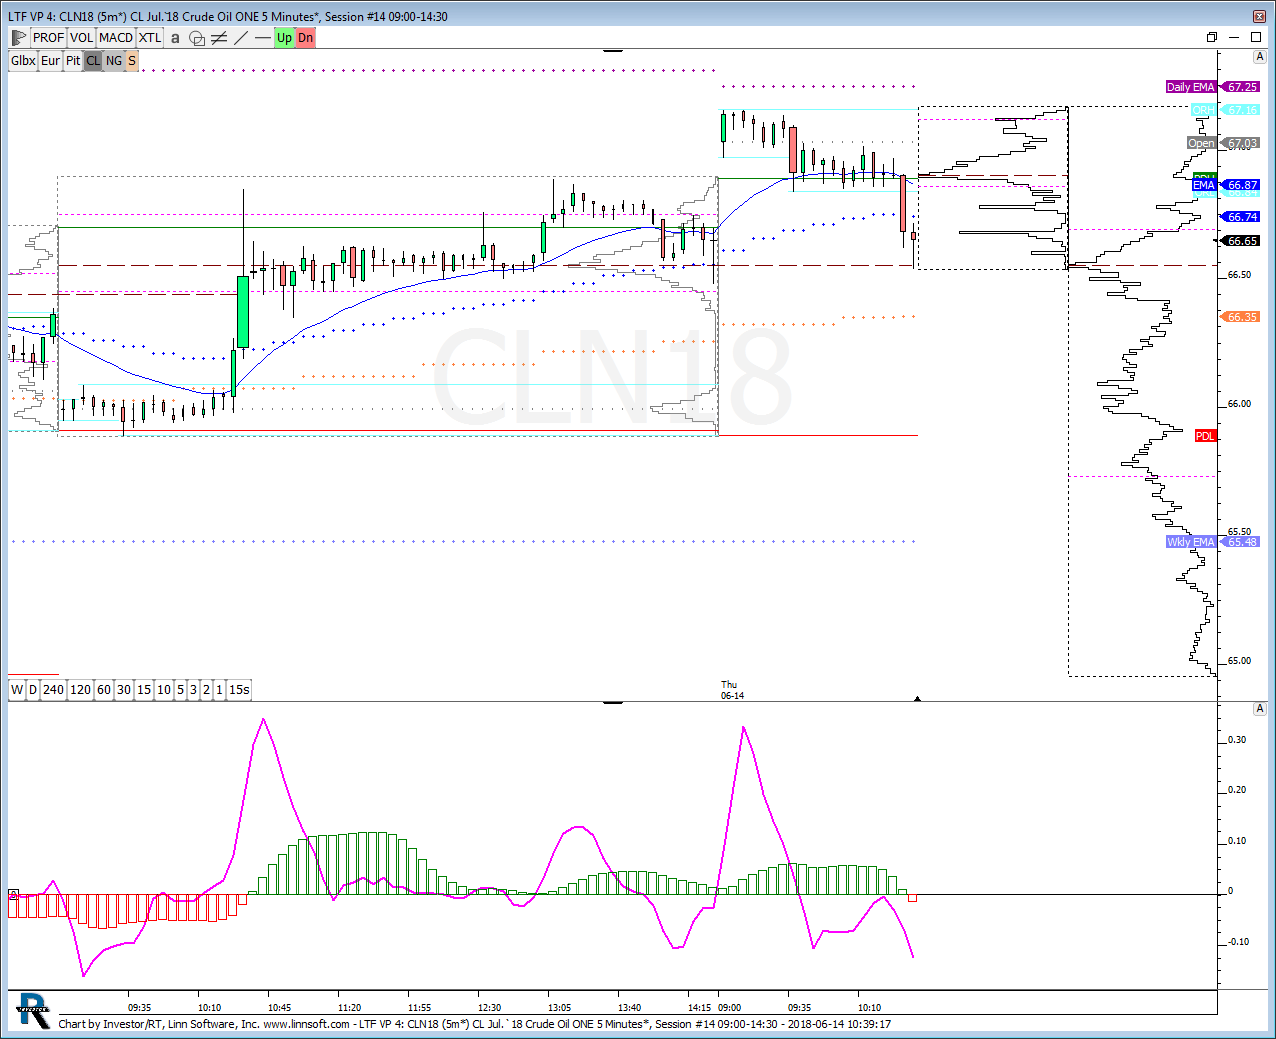 |
LTF VP (CLN18) carlosleon2005 [totalcount]
8 years 1 month ago
This chart was uploaded by Investor/RT 13.3.4 showing symbol: CLN18. |
View |
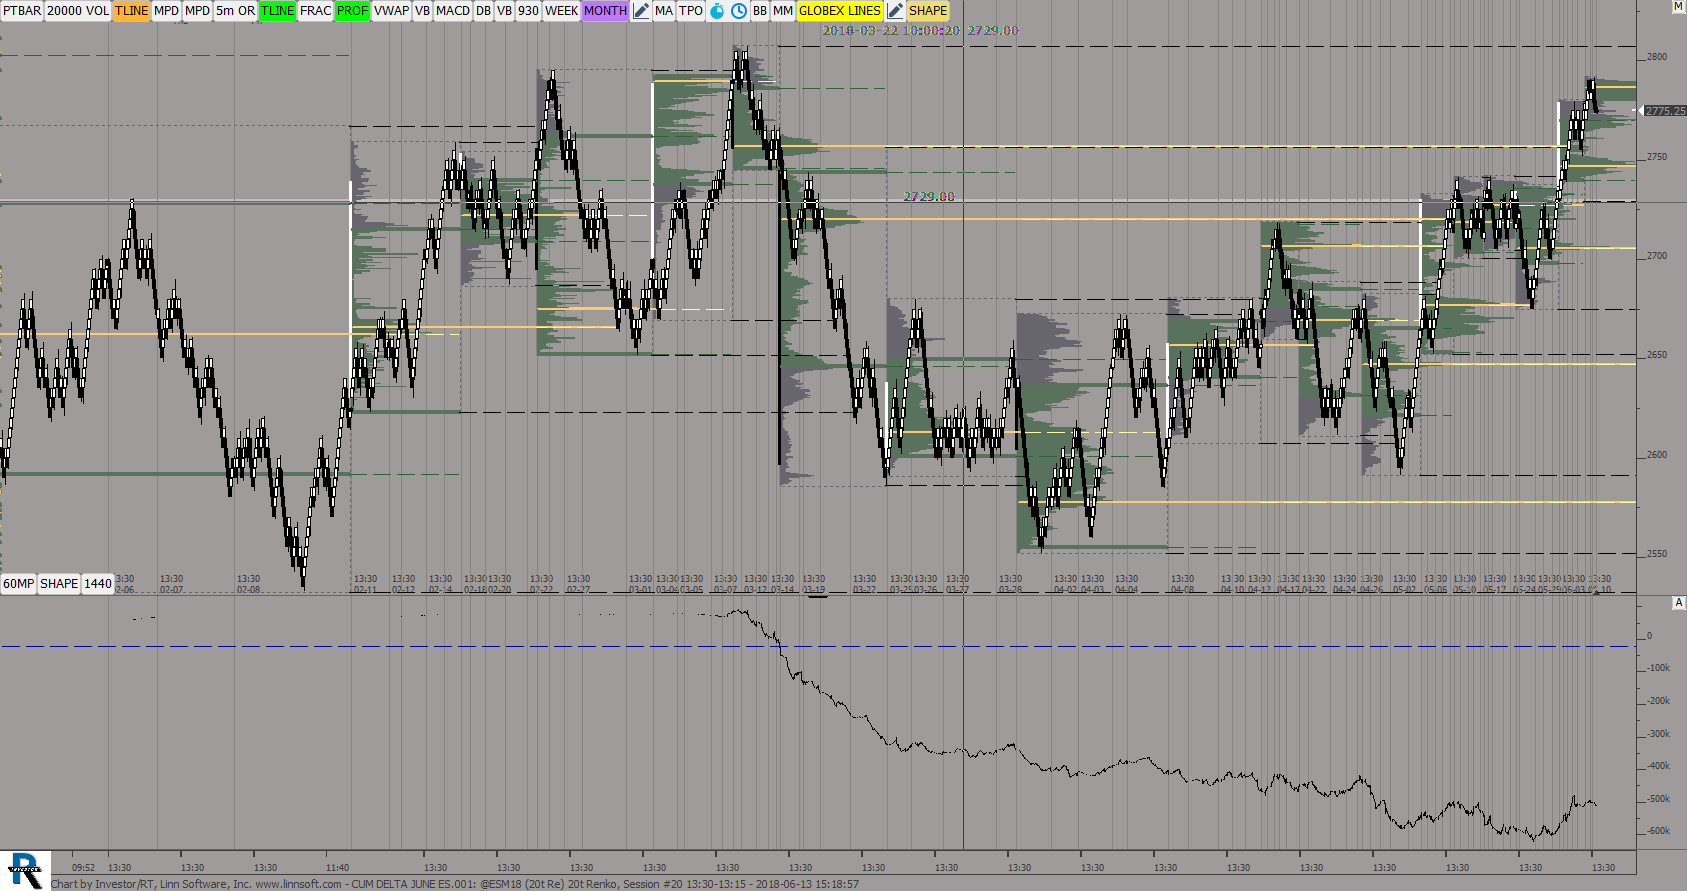 |
CUM DELTA JUNE ES (@ESM18) ES42 [totalcount]
8 years 1 month ago
This chart was uploaded by Investor/RT 13.3.3 showing symbol: @ESM18. |
View |
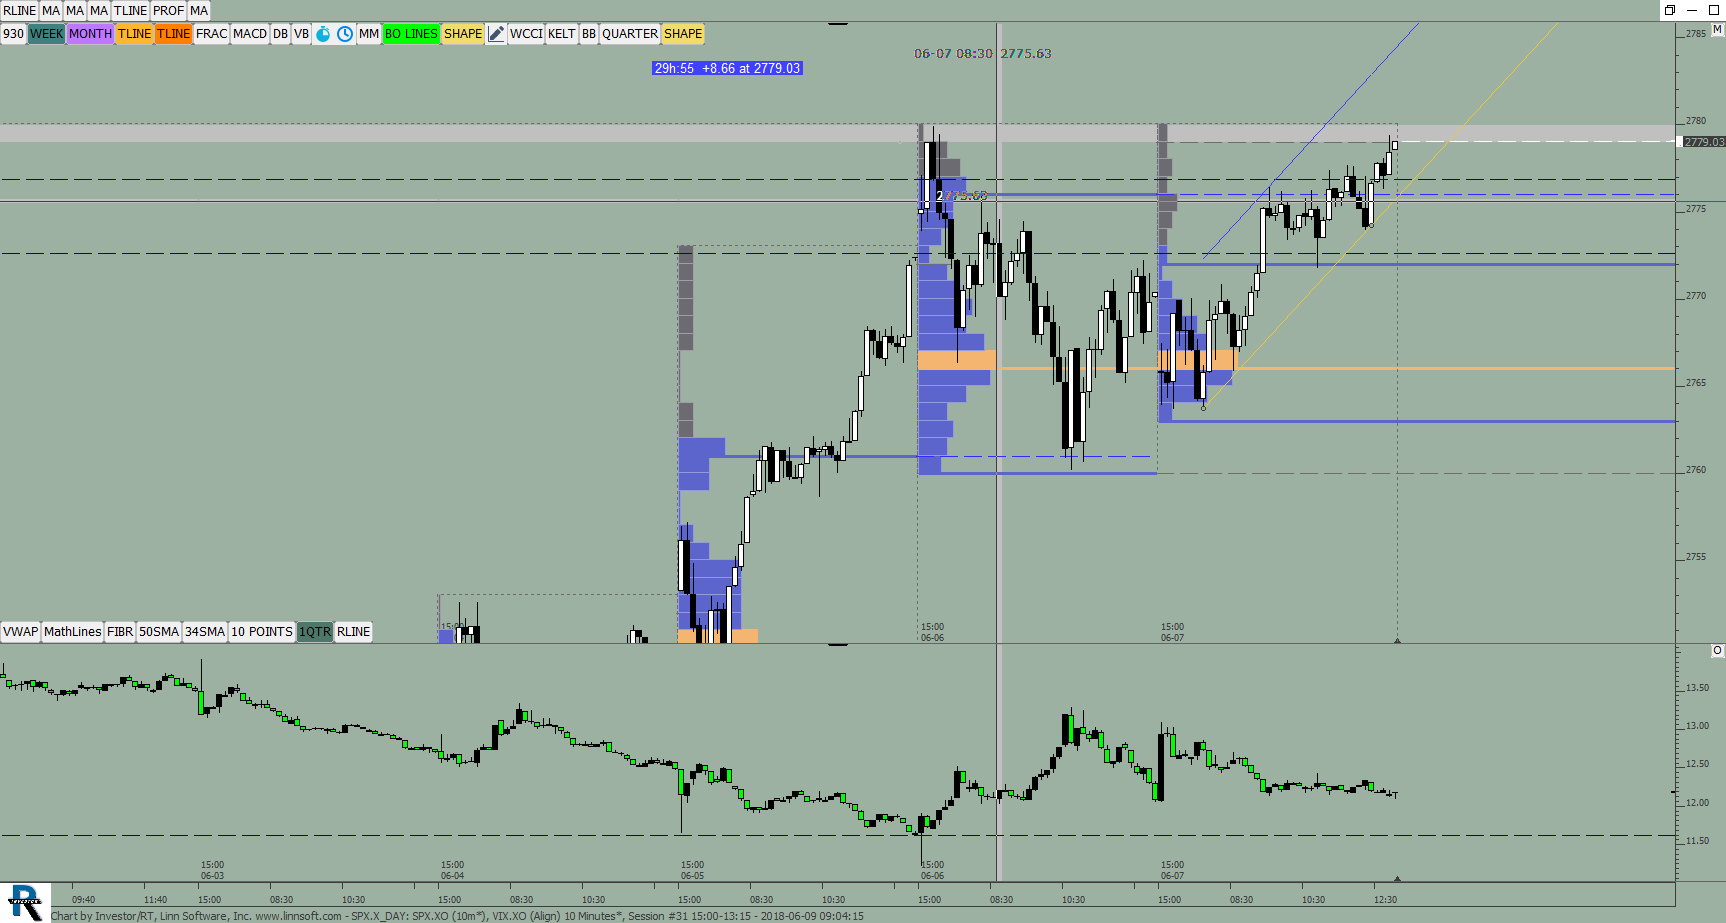 |
SPXX DAY (SPX.XO) ES42 [totalcount]
8 years 1 month ago
This chart was uploaded by Investor/RT 13.3.3 showing symbol: SPX.XO. |
View |
 |
GC Layout003f (QGC#) ES42 [totalcount]
8 years 1 month ago
This chart was uploaded by Investor/RT 13.3.3 showing symbol: QGC#. |
View |
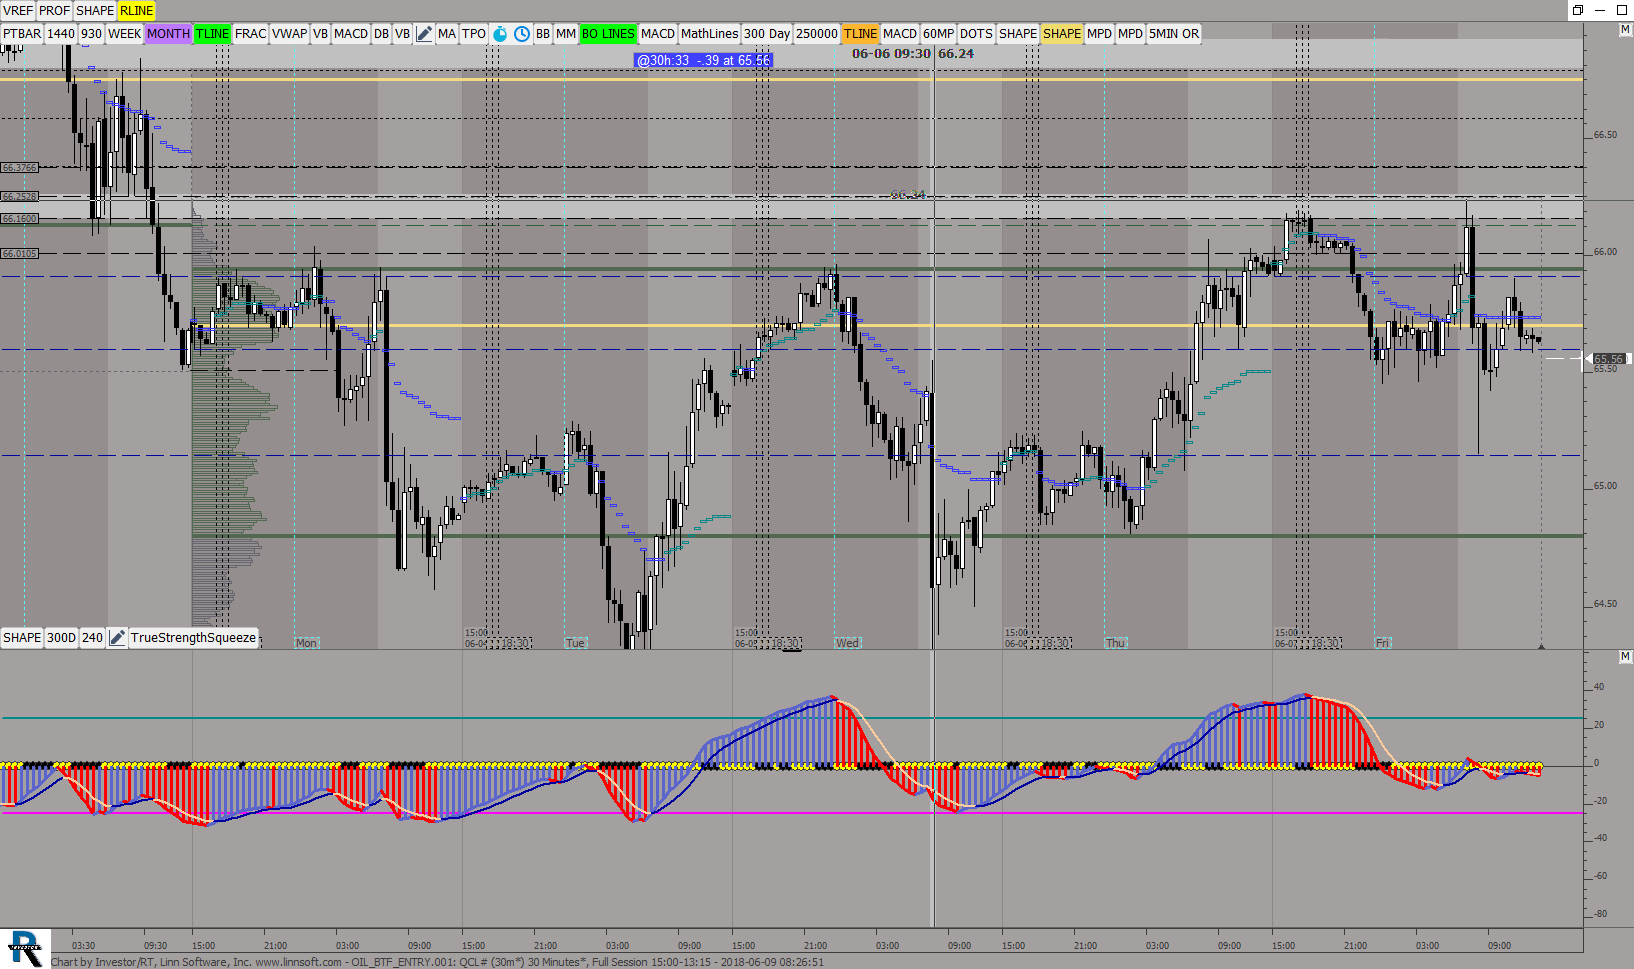 |
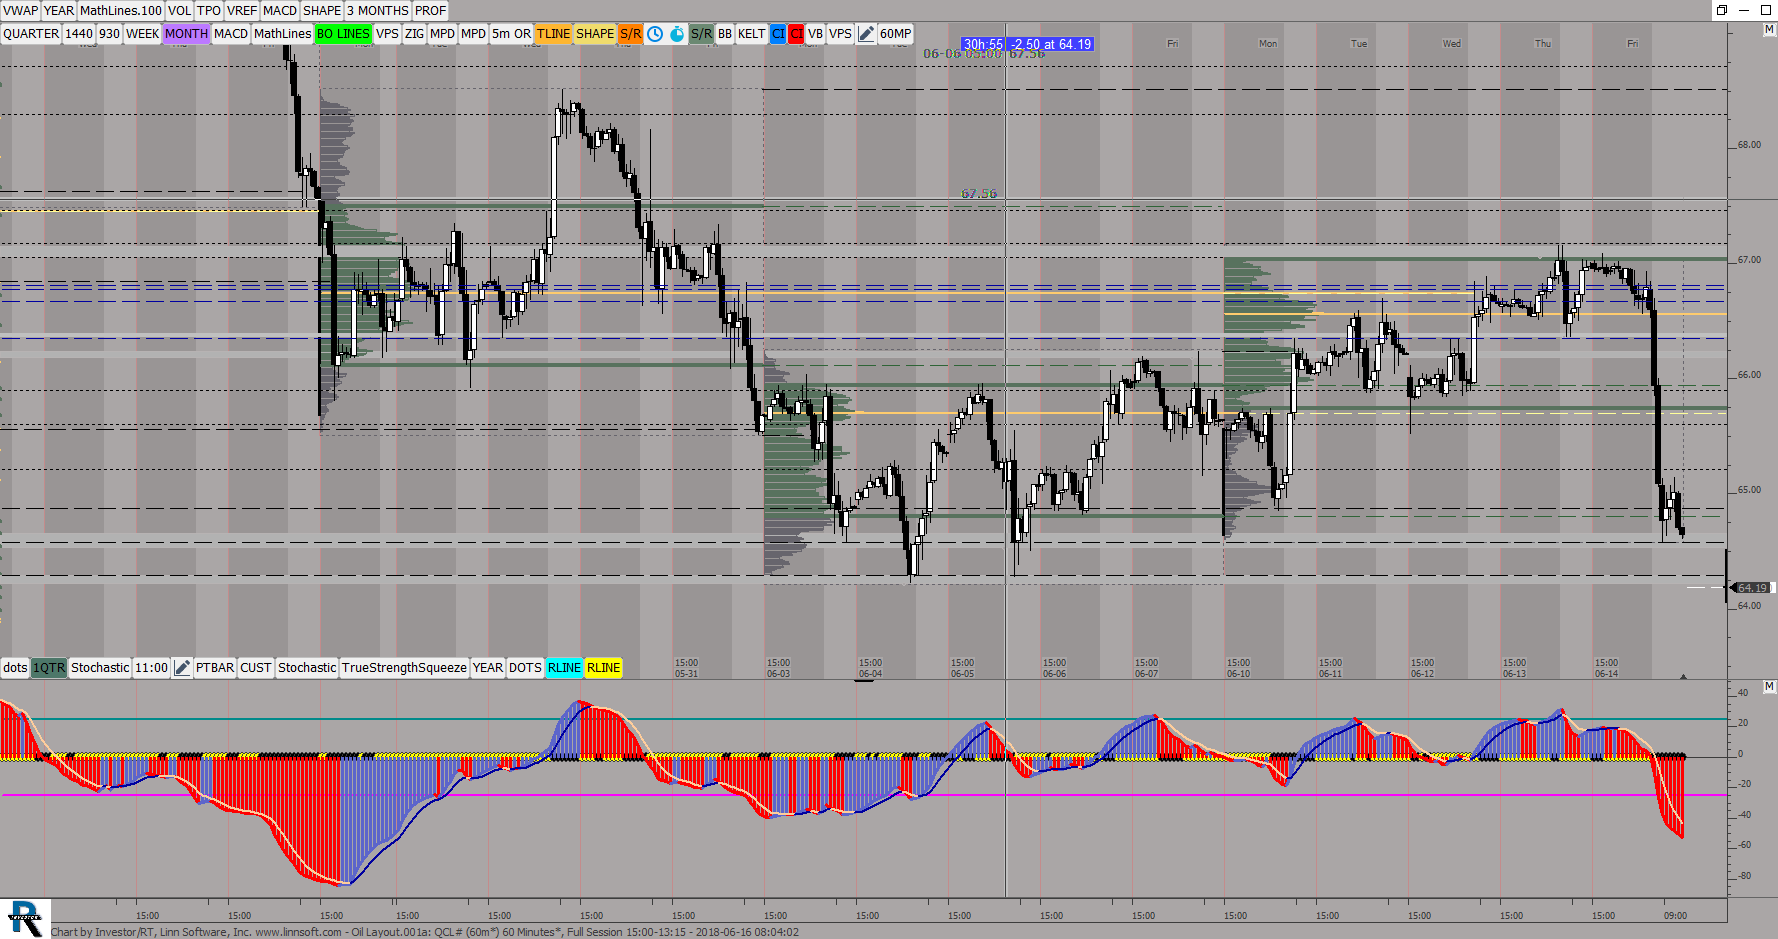
OIL BTF ENTRY (QCL#) ES42 [totalcount]
8 years 1 month ago
This chart was uploaded by Investor/RT 13.3.3 showing symbol: QCL#. |
View |
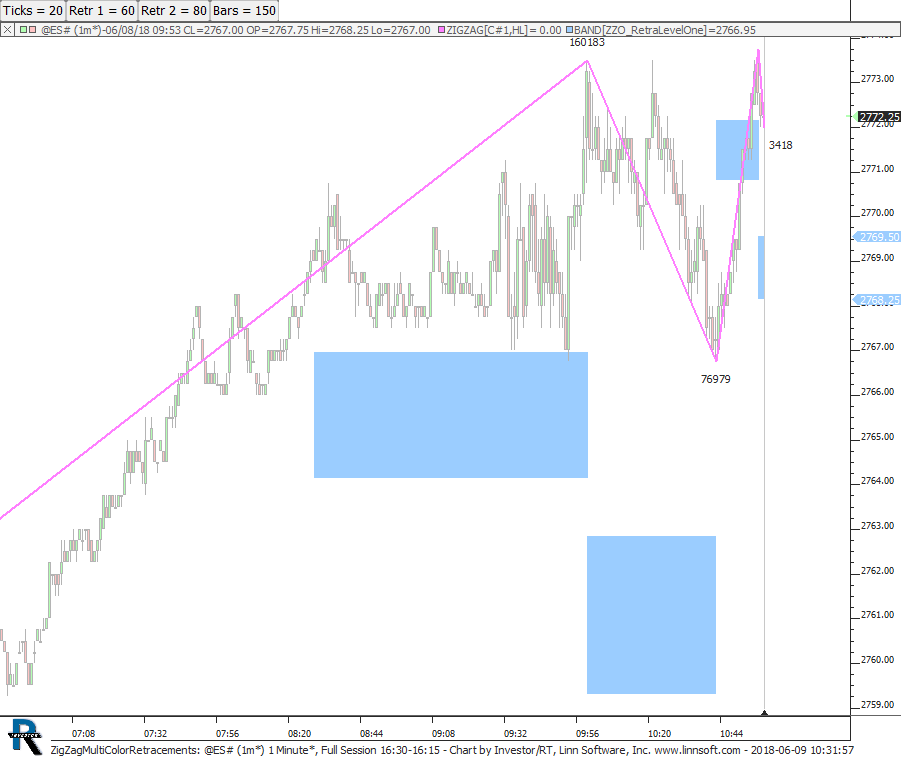 |
ZigZagMultiColorRetracements (@ES#) cpayne [totalcount]
8 years 1 month ago
This chart was uploaded by Investor/RT 13.3.3 showing symbol: @ES#. |
View |
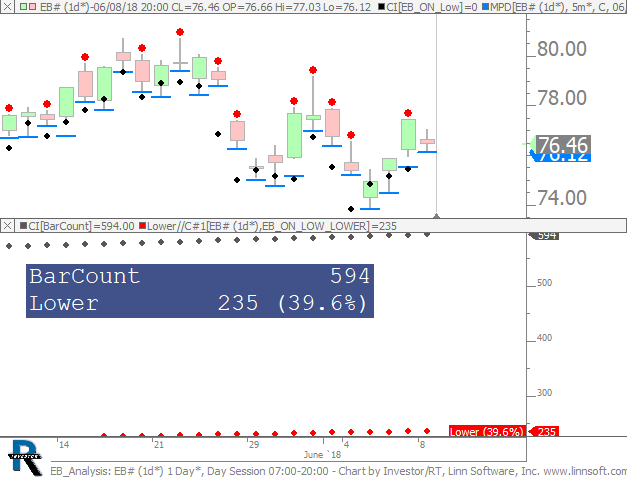 |
EB Analysis (EB#) cpayne [totalcount]
8 years 1 month ago
Analysis of IB Overnight Lows. This chart was uploaded by Investor/RT 13.3.4 showing symbol: EB#. |
View |
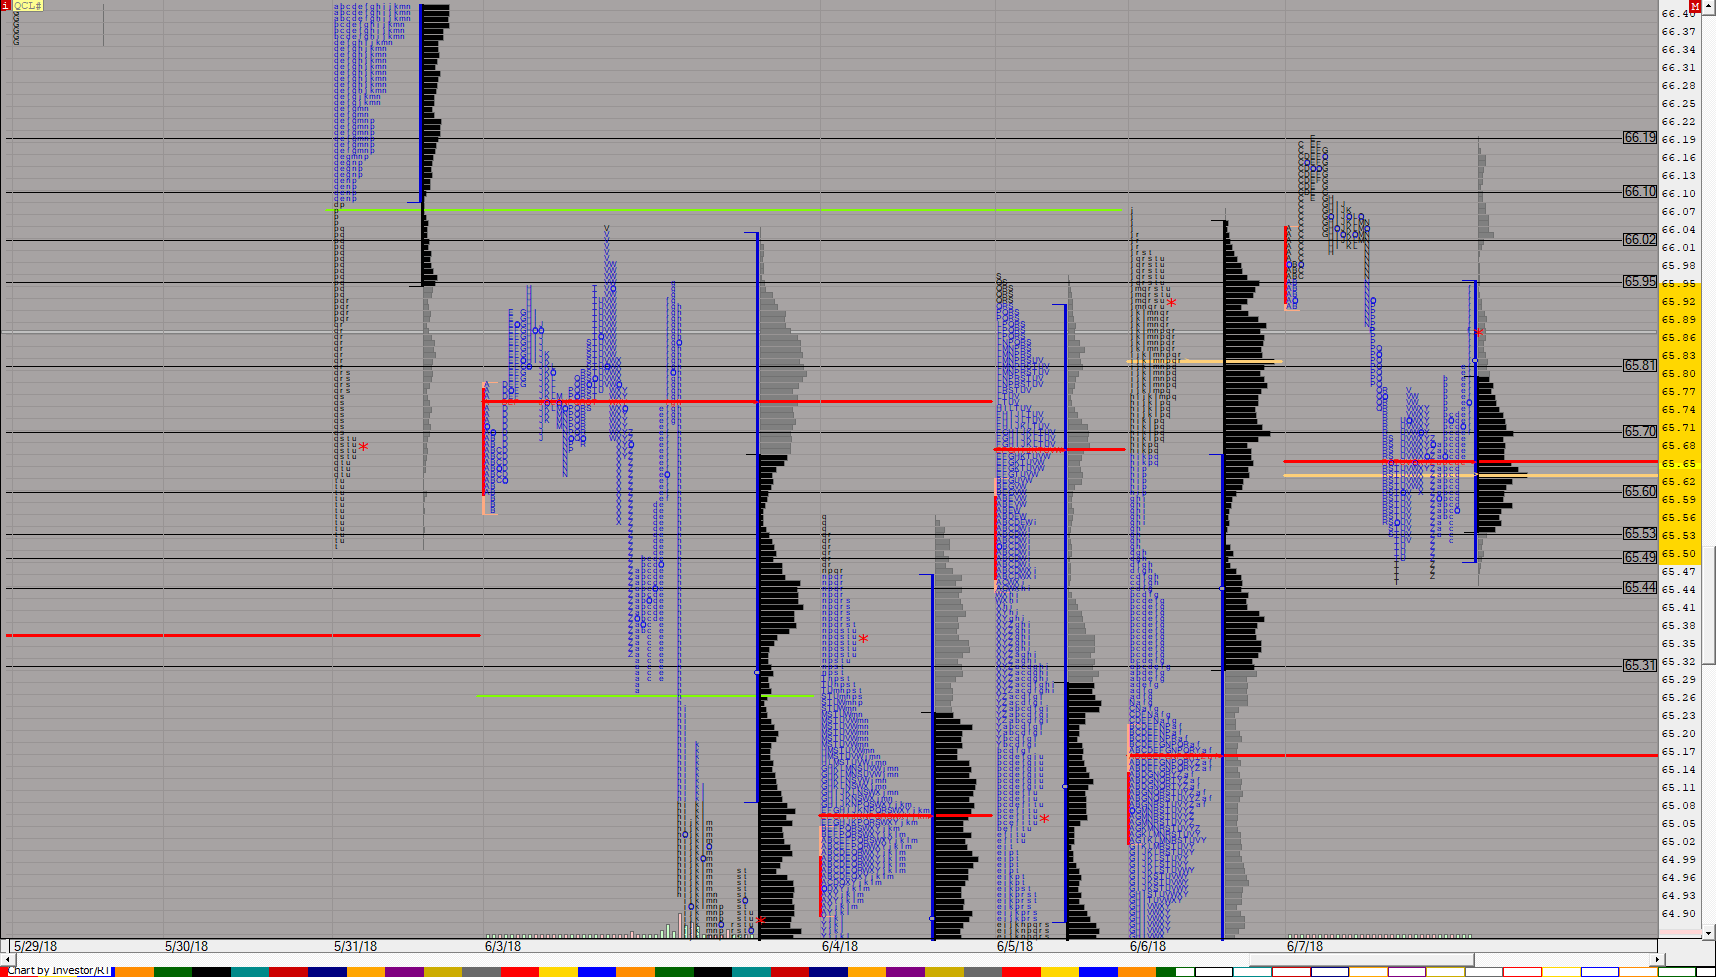 |
MP CL (QCL#) ES42 [totalcount]
8 years 1 month ago
This chart was uploaded by Investor/RT 13.3.3 showing symbol: QCL#. |
View |
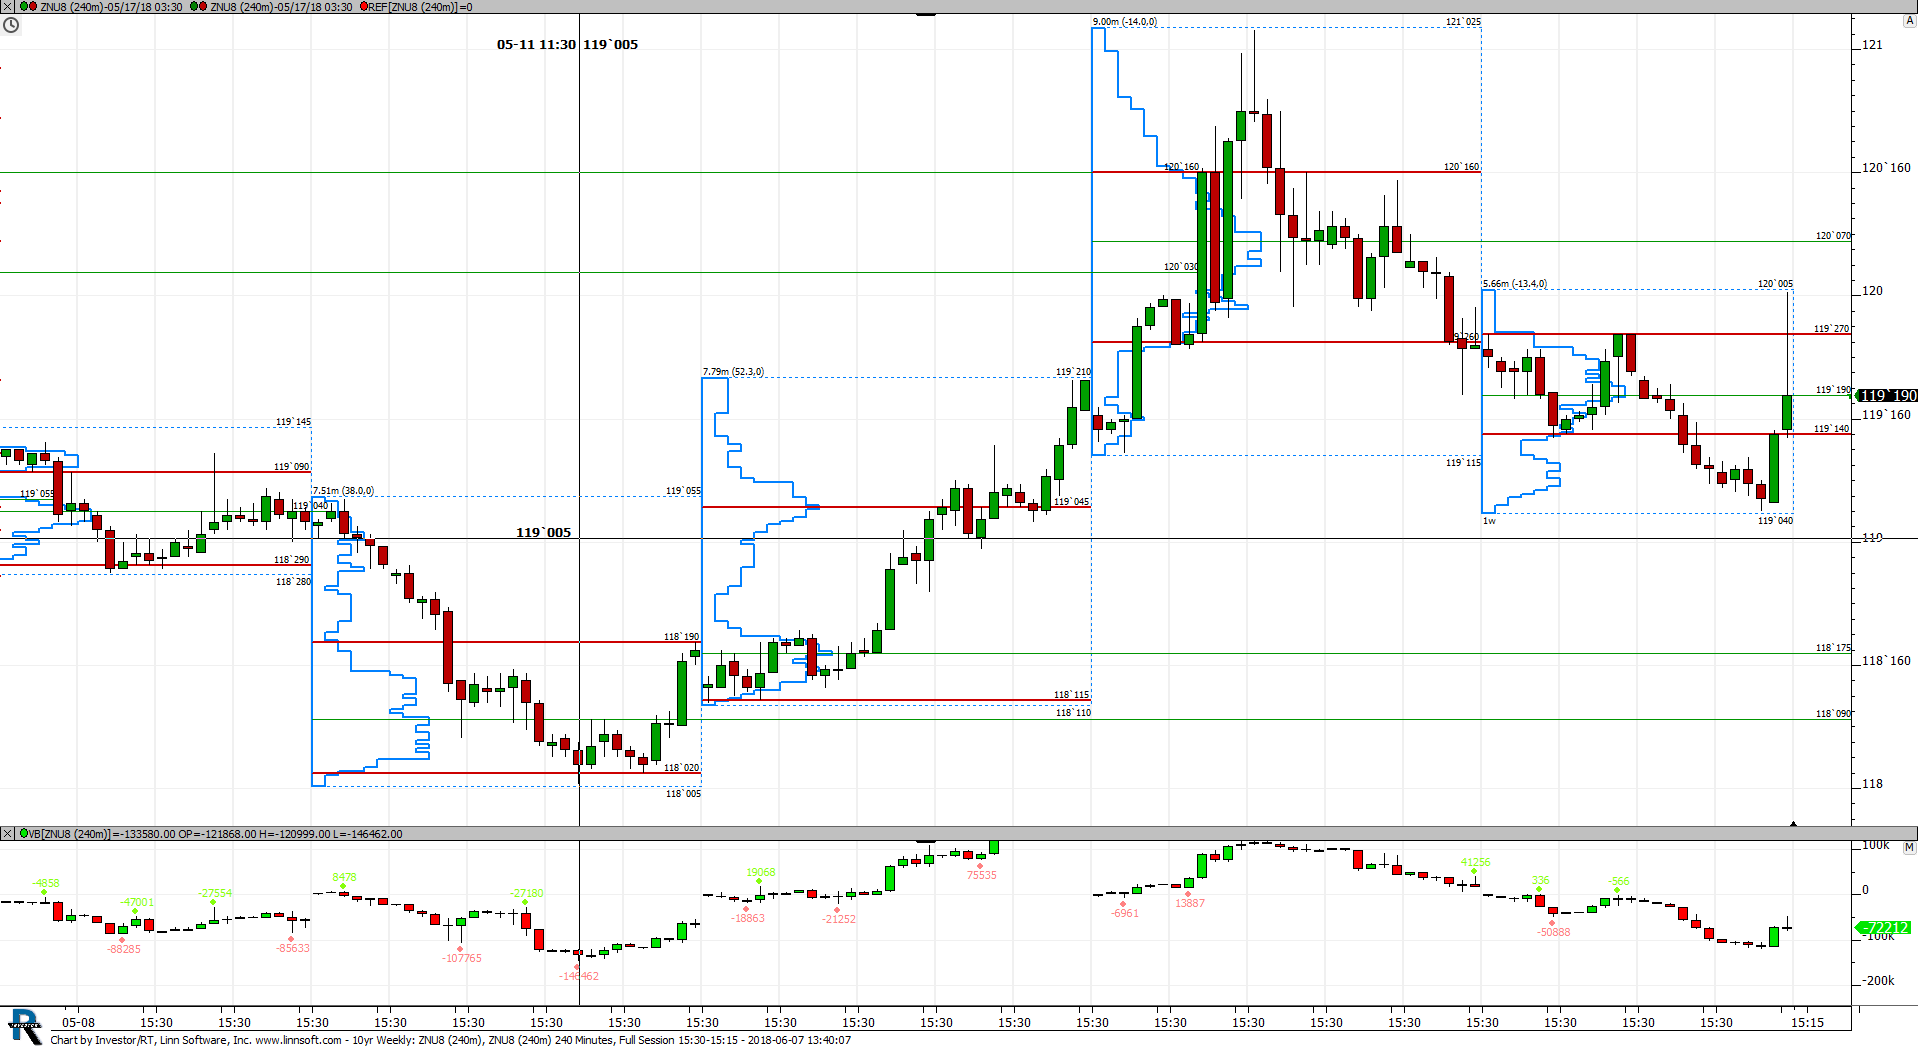 |
10yr Weekly (ZNU8) scottz46 [totalcount]
8 years 1 month ago
This chart was uploaded by Investor/RT 13.3.3 showing symbol: ZNU8. |
View |
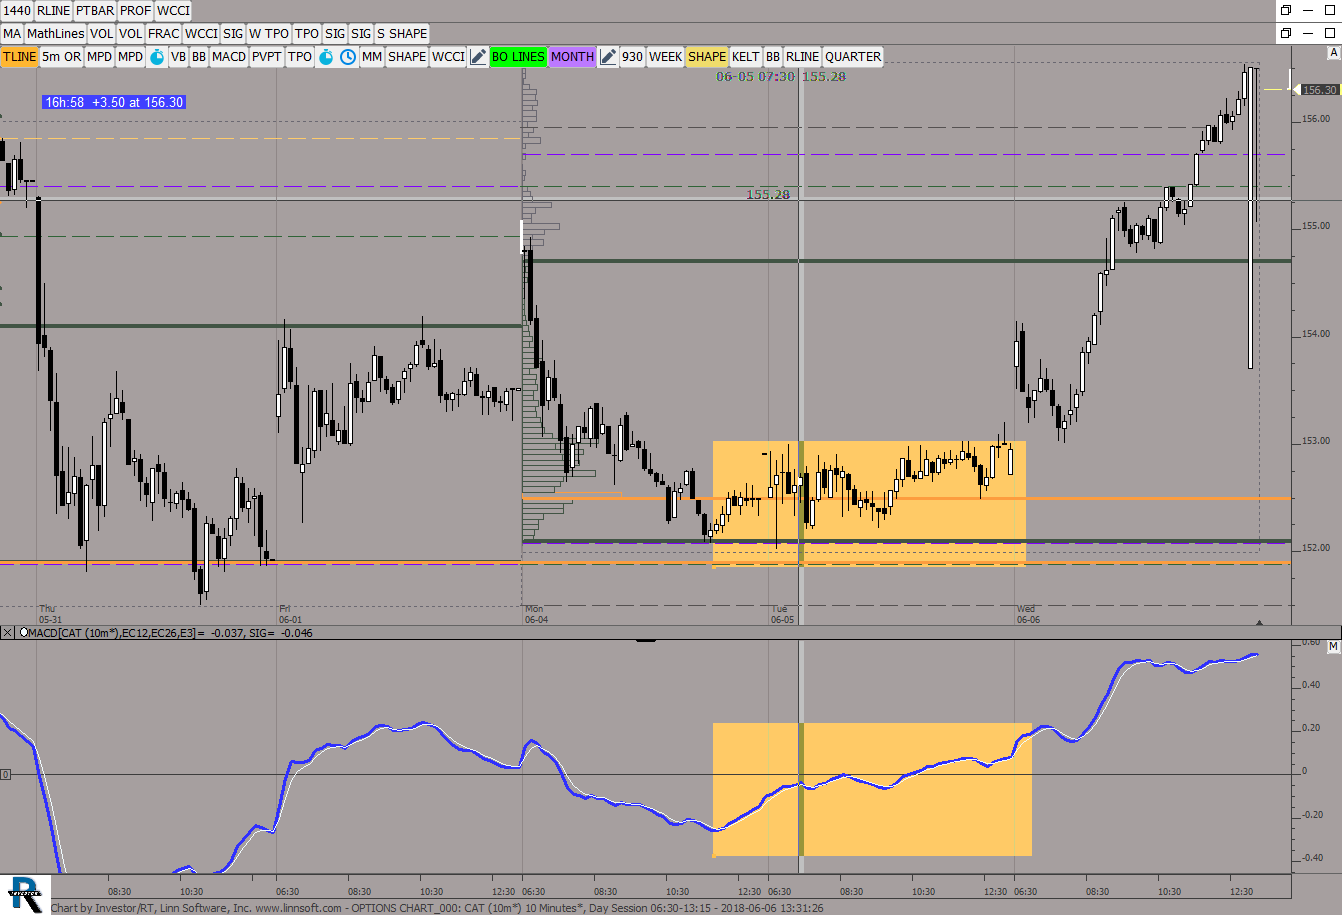 |
OPTIONS CHART (CAT) ES42 [totalcount]
8 years 1 month ago
This chart was uploaded by Investor/RT 13.3.3 showing symbol: CAT. |
View |
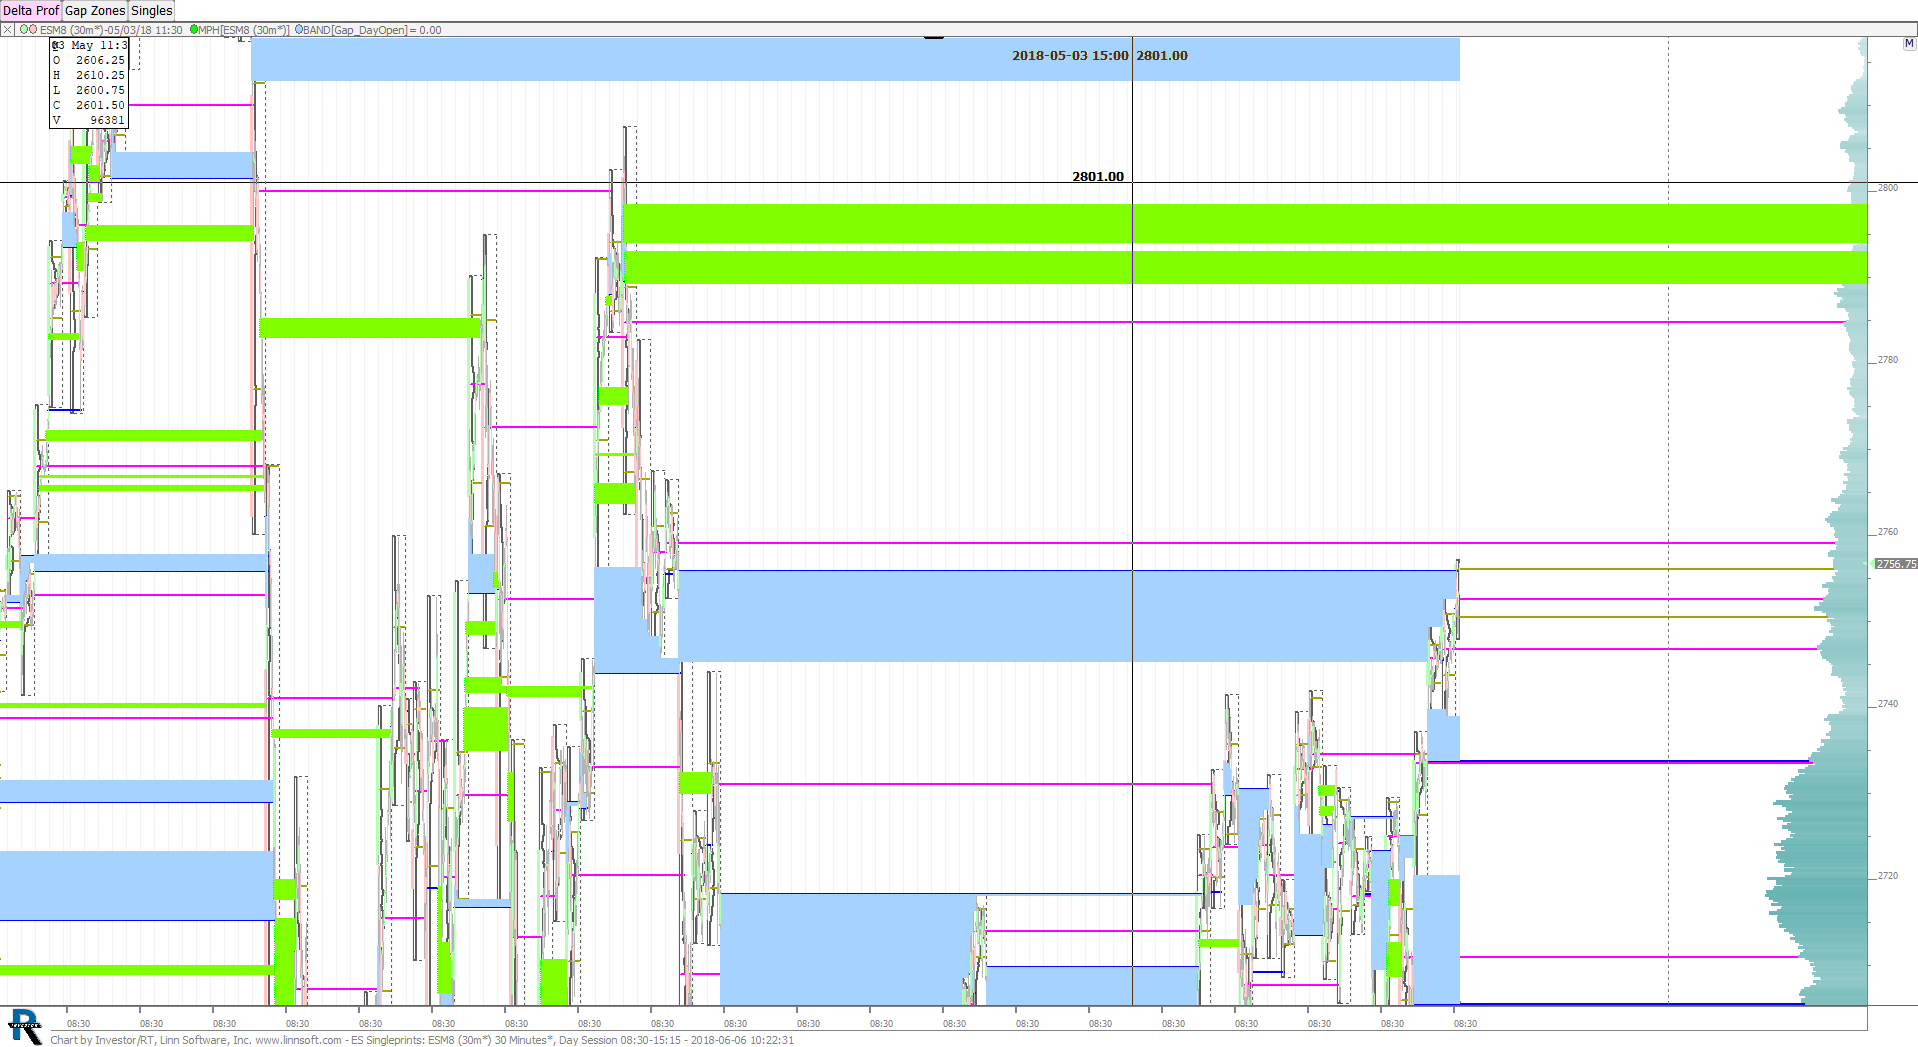 |
ES Singleprints (ESM8) scottz46 [totalcount]
8 years 1 month ago
This chart was uploaded by Investor/RT 13.3.3 showing symbol: ESM8. |
View |
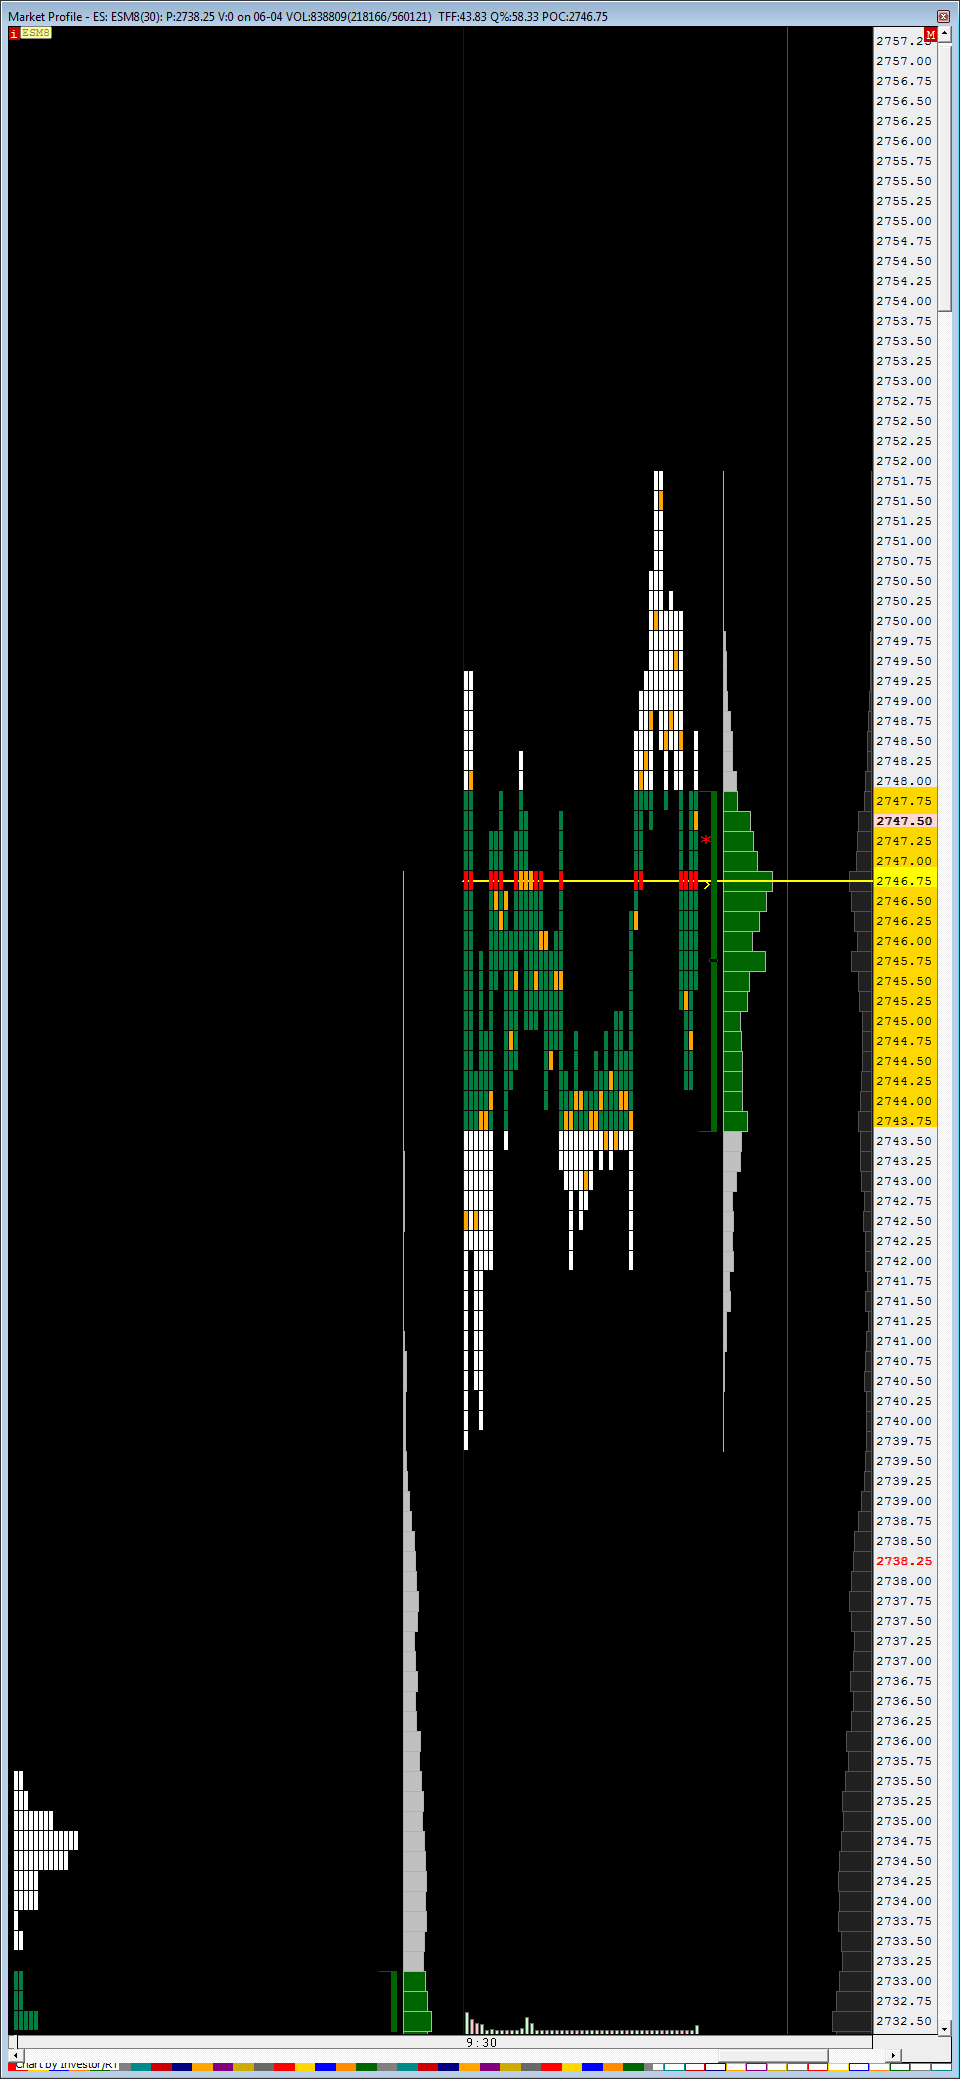 |
Market Profile ES (ESM8) carlosleon2005 [totalcount]
8 years 1 month ago
This chart was uploaded by Investor/RT 13.3.3 showing symbol: ESM8. |
View |
 |
MP GLOBEX GOLD (QGC#) ES42 [totalcount]
8 years 1 month ago
This chart was uploaded by Investor/RT 13.3.3 showing symbol: QGC#. |
View |
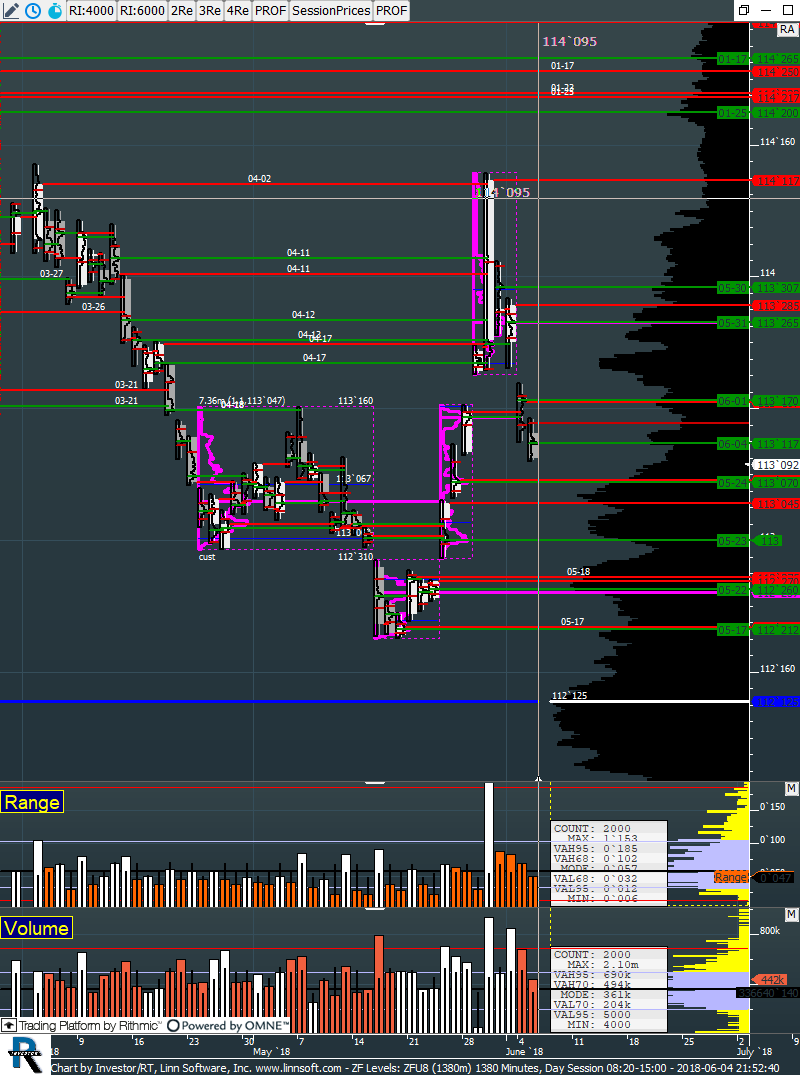 |
ZF Levels (ZFU8) Dylan Cleary [totalcount]
8 years 1 month ago
This chart was uploaded by Investor/RT 13.3.3 showing symbol: ZFU8. |
View |
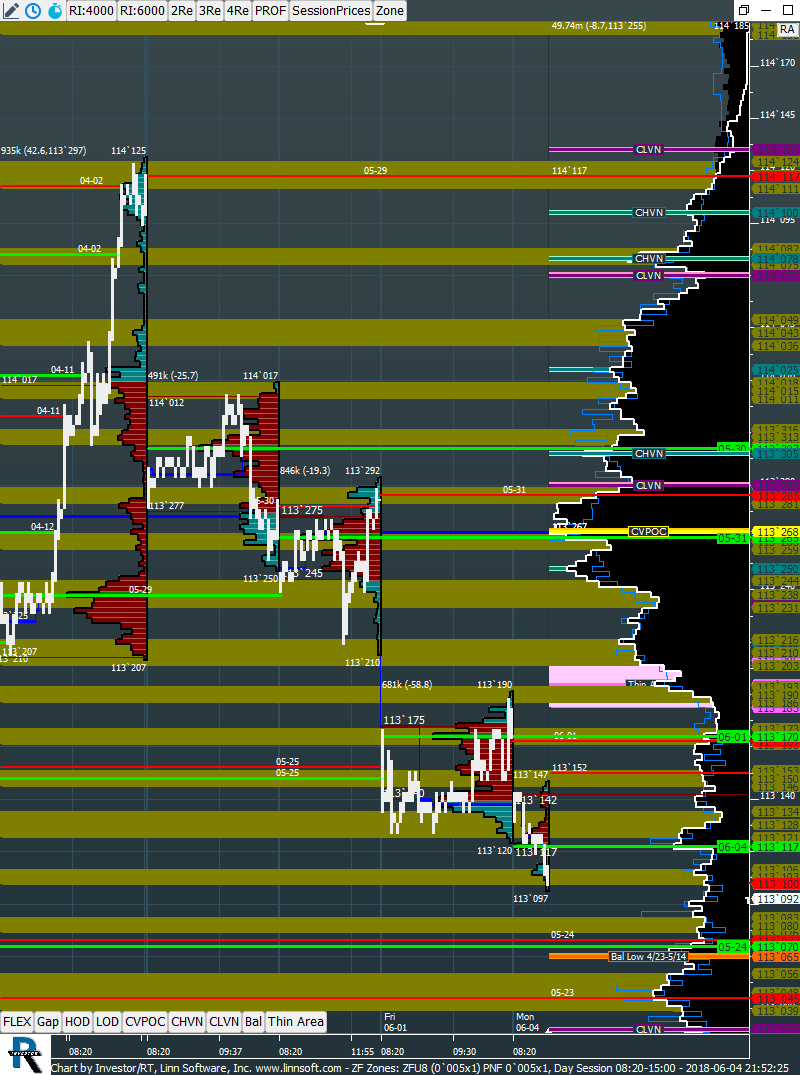 |
ZF Zones (ZFU8) Dylan Cleary [totalcount]
8 years 1 month ago
This chart was uploaded by Investor/RT 13.3.3 showing symbol: ZFU8. |
View |