 |
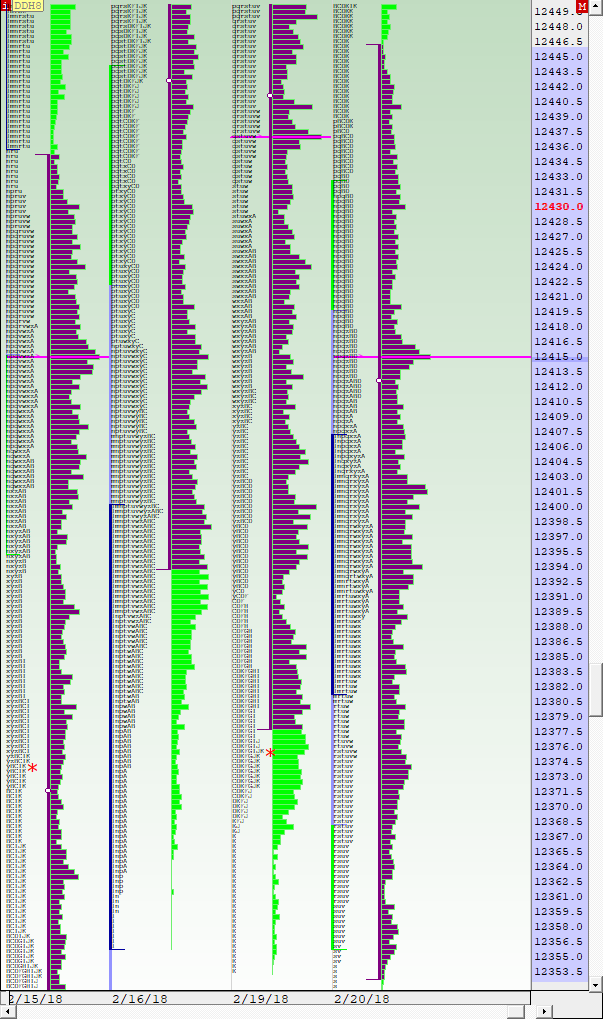
DaxMPDav (DDH8) dacix [totalcount]
7 years 10 months ago
This chart was uploaded by Investor/RT 13.2.4 showing symbol: DDH8. |
View |
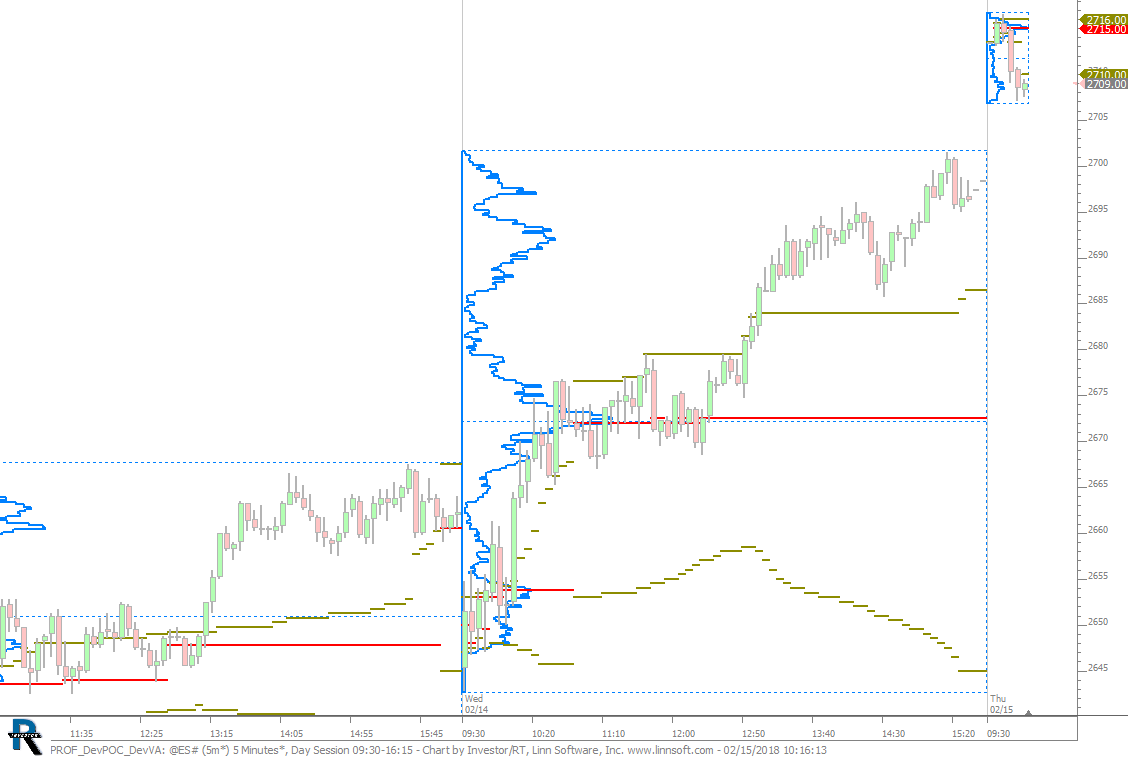 |
PROF DevPOC DevVA (@ES#) cpayne [totalcount]
7 years 10 months ago
Profile Indicator - Developing VA and POC. This chart was uploaded by Investor/RT 13.2.4 showing symbol: @ES#. |
View |
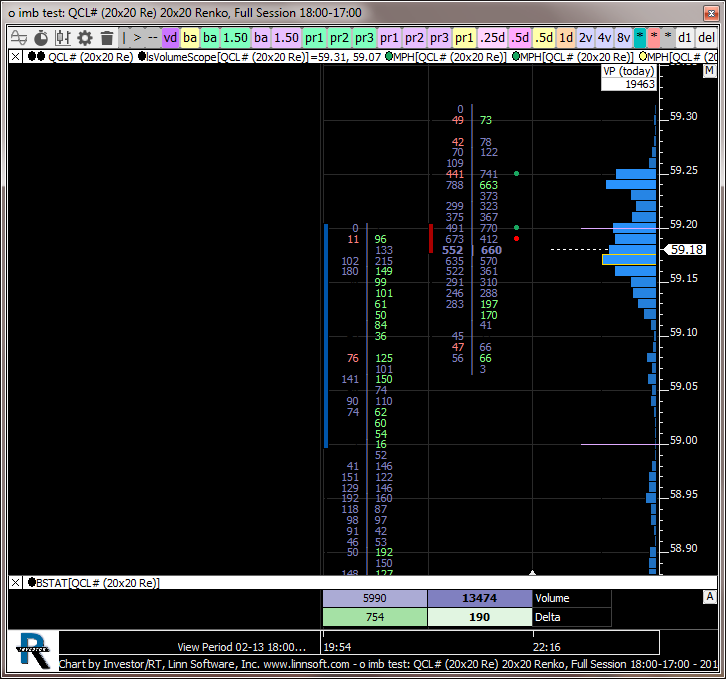 |
o imb test (QCL#) John Alwill [totalcount]
7 years 10 months ago
John Alwill. 02/13,2018. This chart was uploaded by Investor/RT 13.2.3 showing symbol: QCL#. |
View |
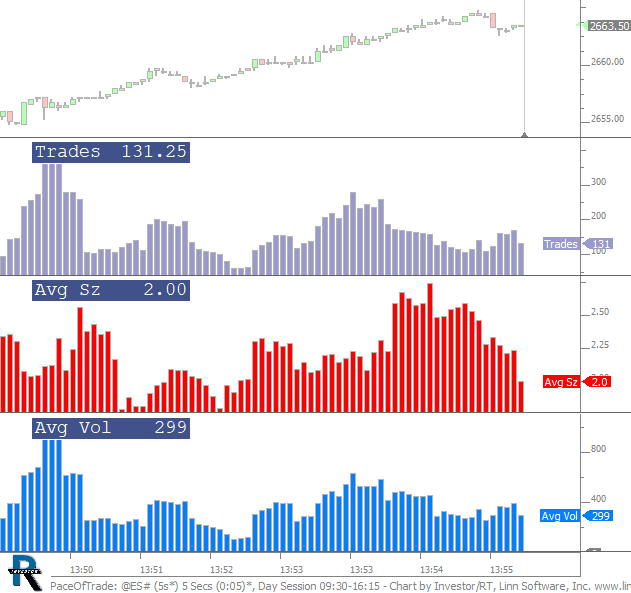 |
PaceOfTrade (@ES#) cpayne [totalcount]
7 years 10 months ago
Pace of Trade. Number of Trades, Volume, and Average Size of last 30 seconds (6 5-sec bars). Trades (purple), Avg Size (red) and Avg Volume (blue). |
View |
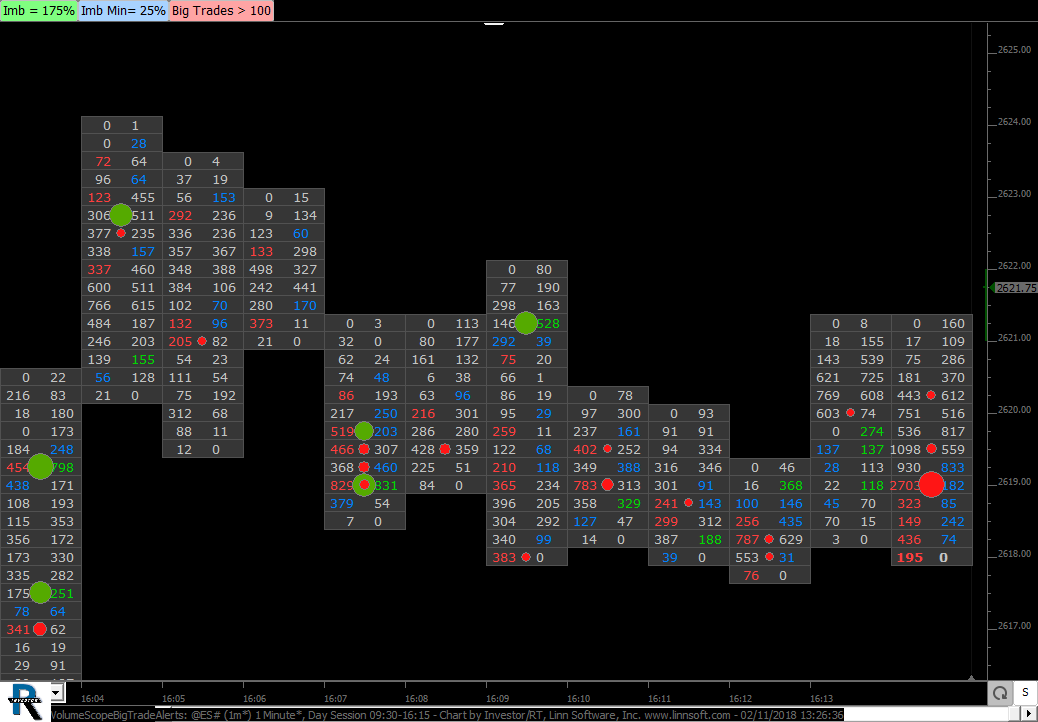 |
VolumeScopeBigTradeAlerts (@ES#) cpayne [totalcount]
7 years 10 months ago
Trade Dots alerts to large trades (> 100). Use button at top to control the sizes (red button). Separate alerts for buy trades (ask) vs sell trades (bid) with 2 instances of Trade Dots. |
View |
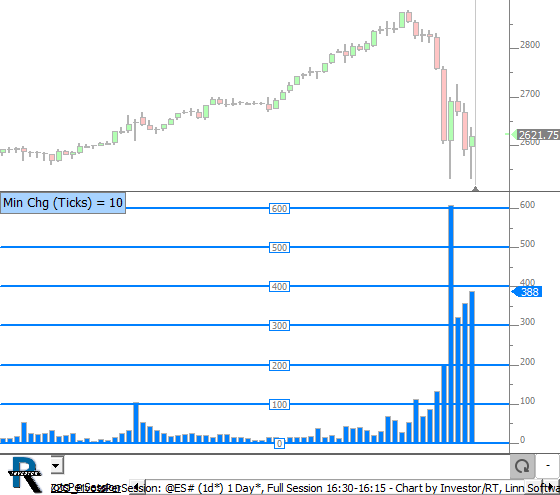 |
ZZO PivotsPerSession (@ES#) cpayne [totalcount]
7 years 10 months ago
Chart counts the number of moves (zig zag legs) within each session by using MPD on ZZO. Use blue button at top to control the minimum size of moves (in ticks). |
View |
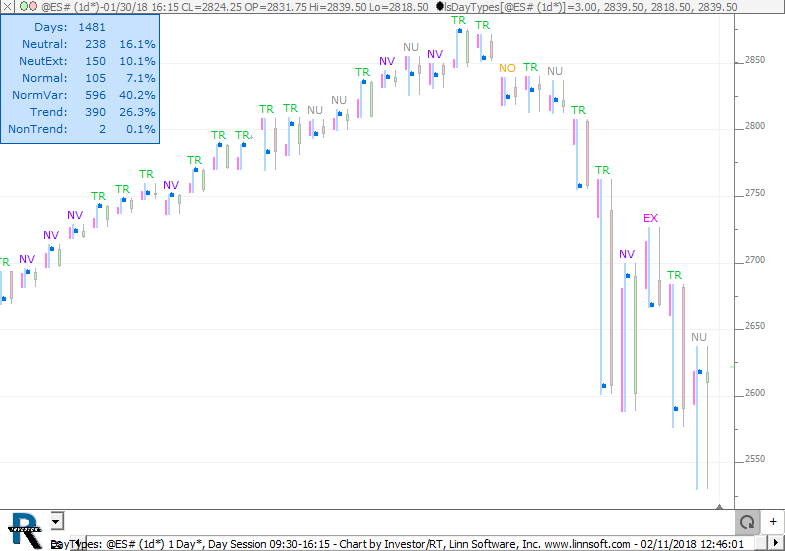 |
DayTypes (@ES#) cpayne [totalcount]
7 years 10 months ago
This chart was uploaded by Investor/RT 13.2.2 showing symbol: @ES#. |
View |
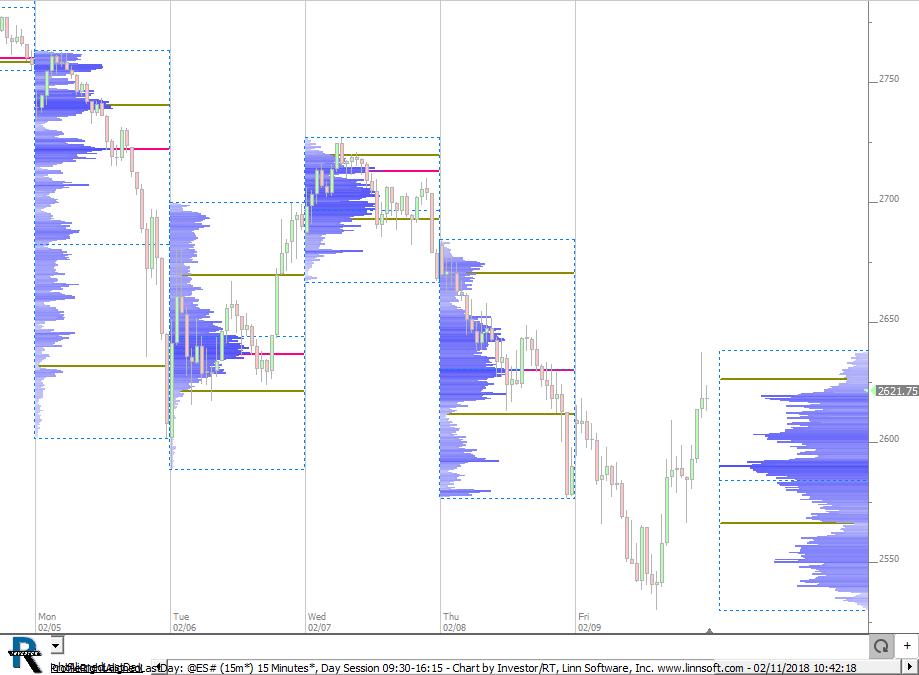 |
ProfileRightAlignedLastDay (@ES#) cpayne [totalcount]
7 years 10 months ago
Profile Indicator - Last Profile in margin. This chart was uploaded by Investor/RT 13.2.2 showing symbol: @ES#. |
View |
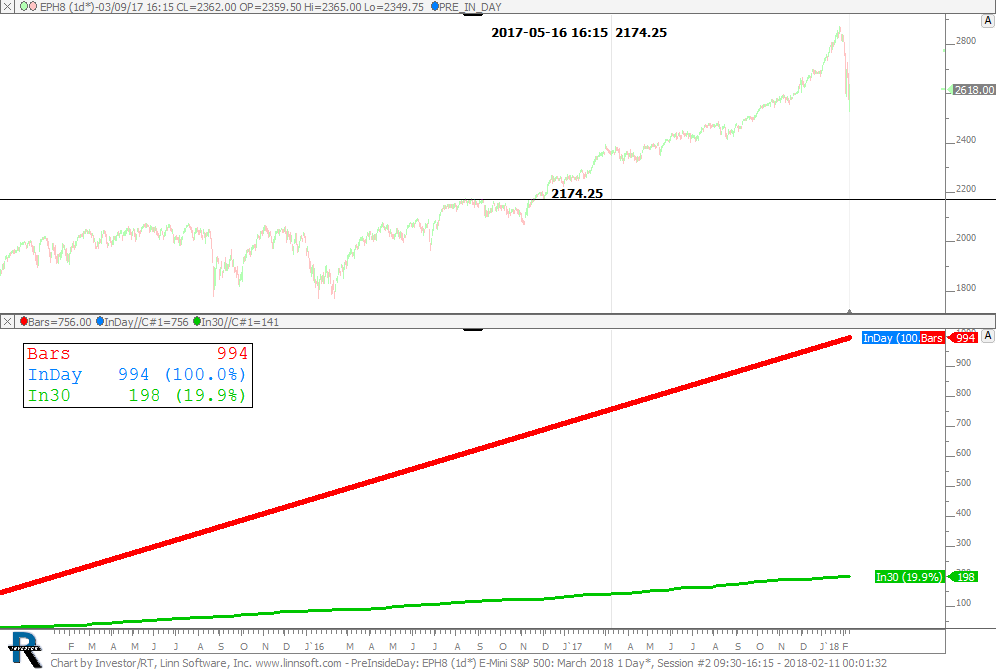 |
PreInsideDay (EPH8) PVLFD [totalcount]
7 years 10 months ago
This chart was uploaded by Investor/RT 13.2.3 showing symbol: EPH8. |
View |
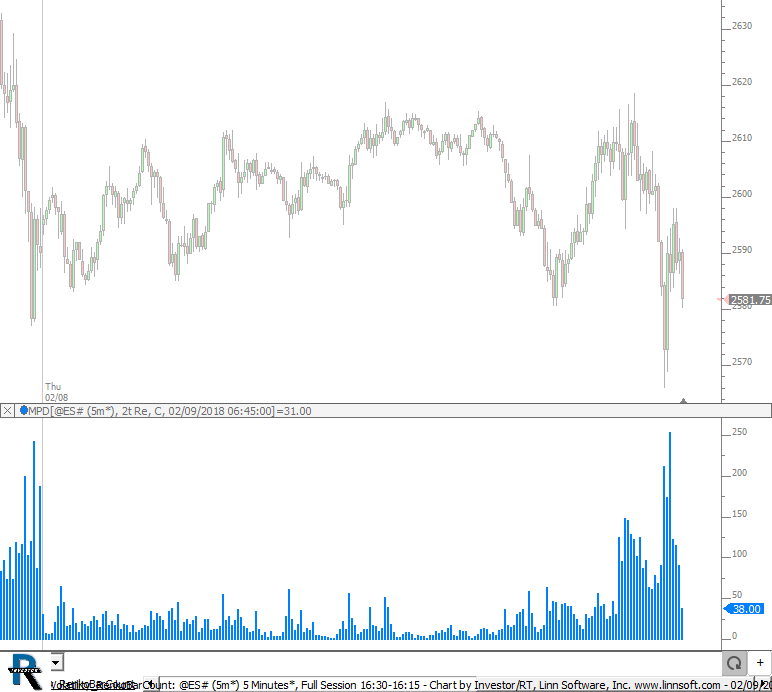 |
Volatility RenkoBarCount (@ES#) cpayne [totalcount]
7 years 10 months ago
Number of 2t Renko Bars inside each bar - measure of volatility. This chart was uploaded by Investor/RT 13.2.2 showing symbol: @ES#. |
View |
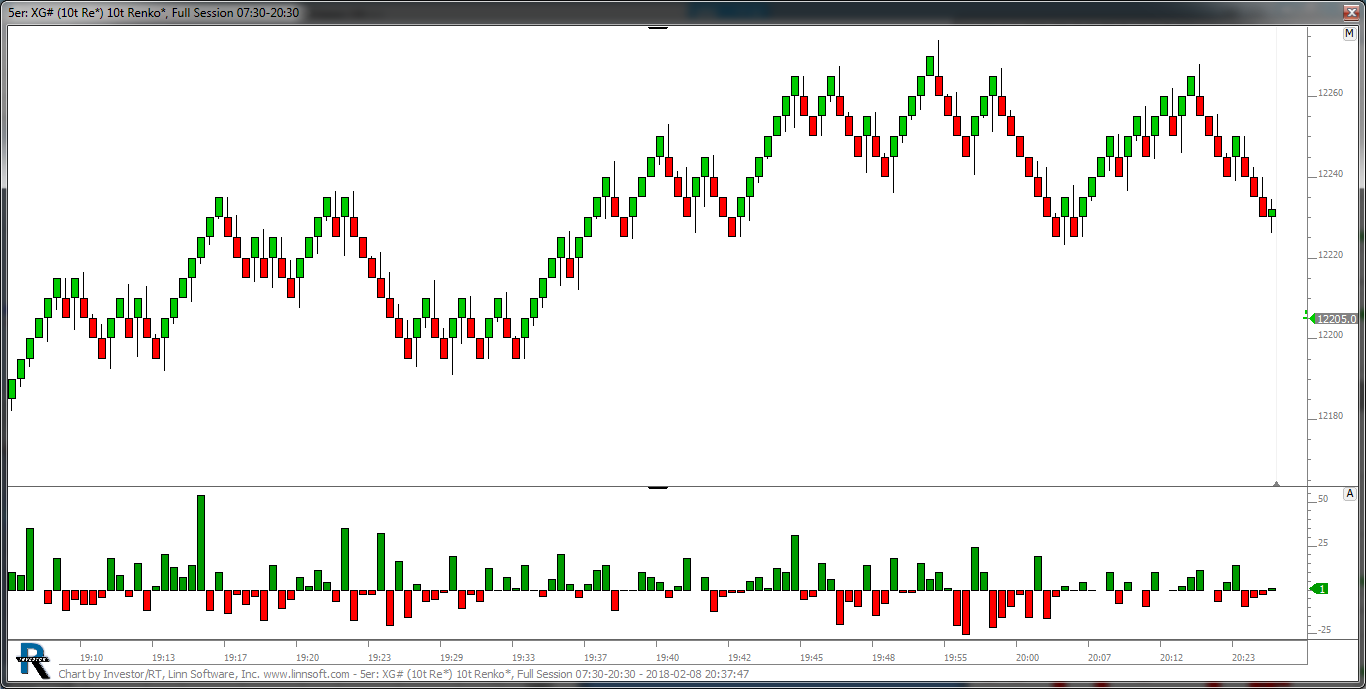 |
5er (XG#) Ariello [totalcount]
7 years 10 months ago
This chart was uploaded by Investor/RT 13.2.2 showing symbol: XG#. |
View |
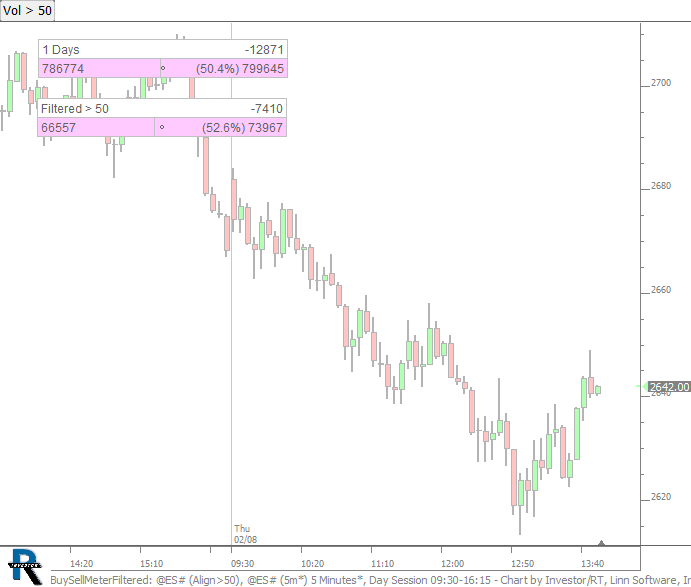 |
BuySellMeterFiltered (@ES#) cpayne [totalcount]
7 years 10 months ago
Buy Sell Meter with all volume, and filtered volume. This chart was uploaded by Investor/RT 13.2.2 showing symbol: @ES#. |
View |
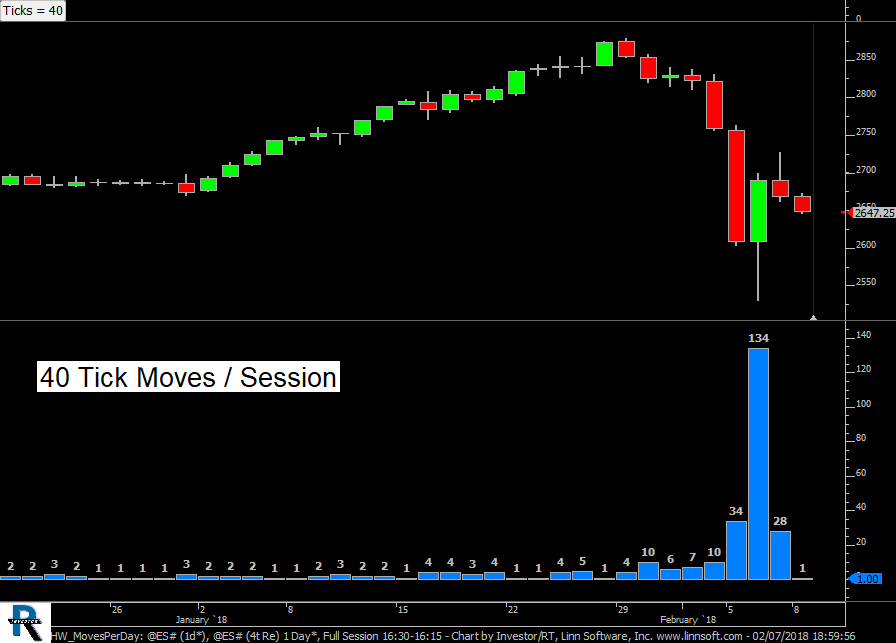 |
HW MovesPerDay (@ES#) cpayne [totalcount]
7 years 10 months ago
Chart counts the number of moves per session. Use button at top to control the number of ticks per counted move. |
View |
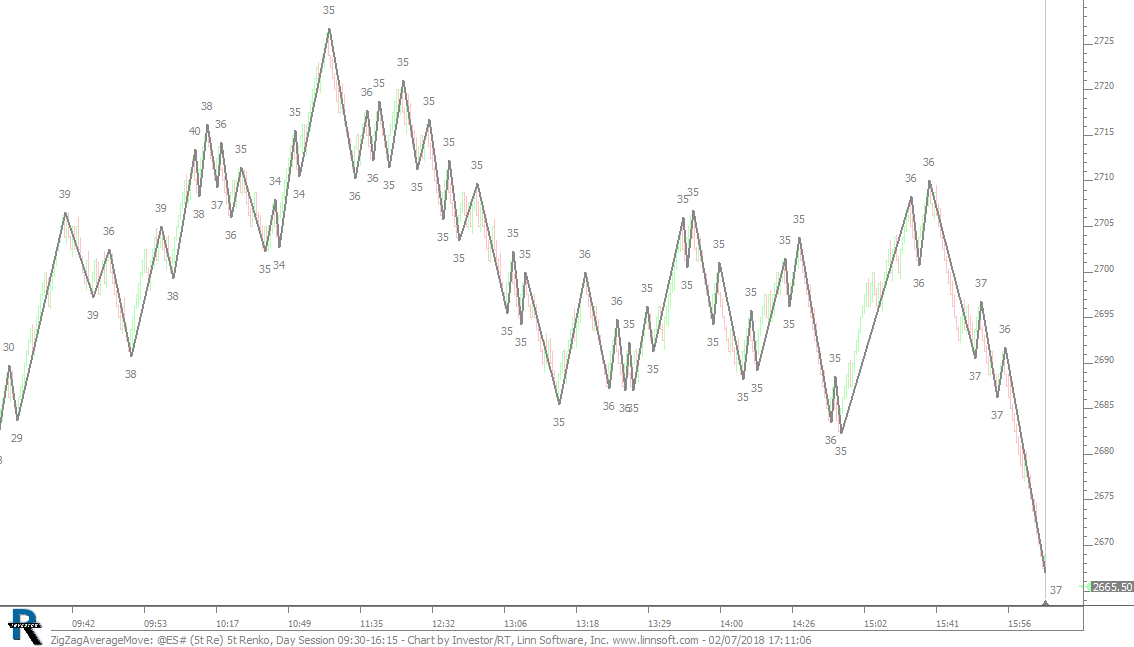 |
ZigZagAverageMove (@ES#) cpayne [totalcount]
7 years 10 months ago
Zig Zag Average Session Move. This chart was uploaded by Investor/RT 13.2.2 showing symbol: @ES#. |
View |
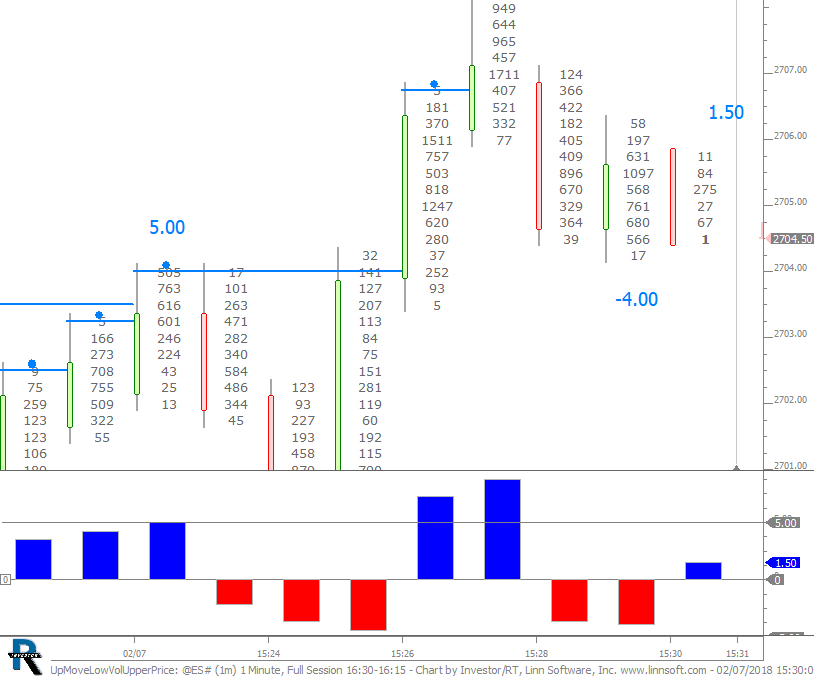 |
UpMoveLowVolUpperPrice (@ES#) cpayne [totalcount]
7 years 10 months ago
Up Move - Low Volume at Extreme Price. This chart was uploaded by Investor/RT 13.2.2 showing symbol: @ES#. |
View |
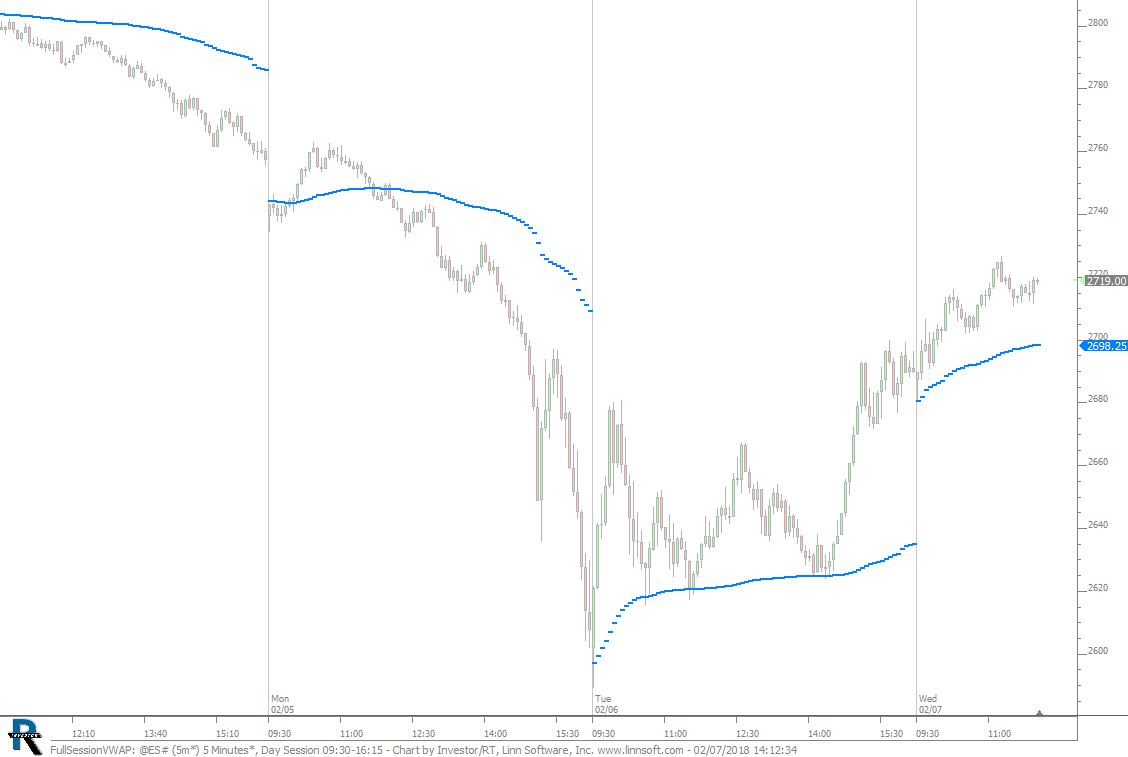 |
FullSessionVWAP (@ES#) cpayne [totalcount]
7 years 10 months ago
Full Session VWAP on Day Sessino Chart. This chart was uploaded by Investor/RT 13.2.2 showing symbol: @ES#. |
View |
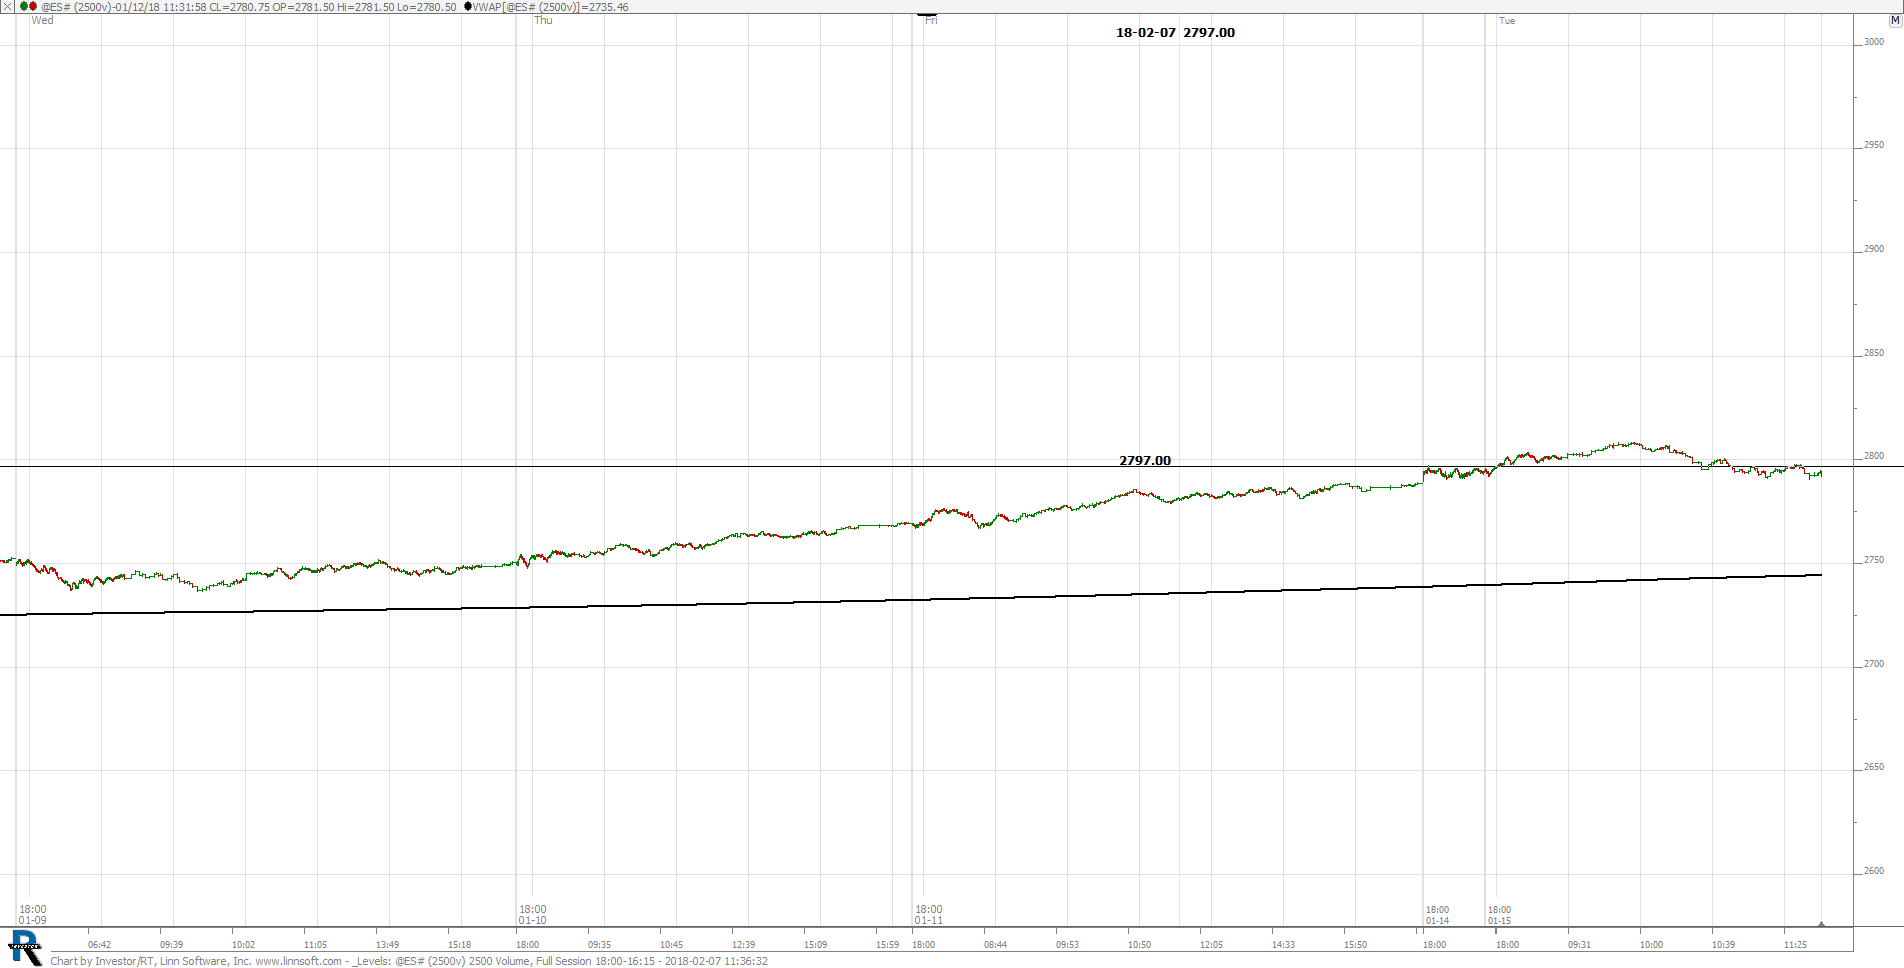 |
Levels (@ES#) scooke [totalcount]
7 years 10 months ago
This chart was uploaded by Investor/RT 13.2.2 showing symbol: @ES#. |
View |
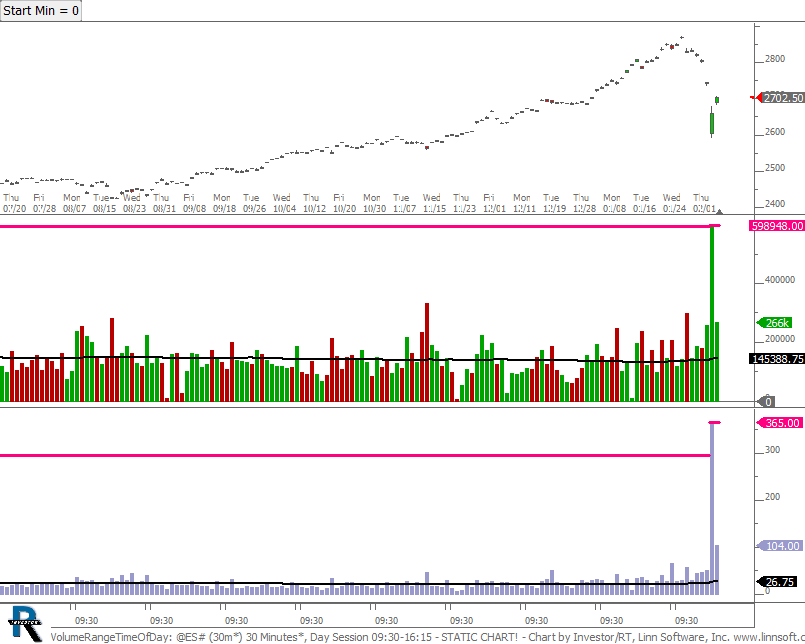 |
VolumeRangeTimeOfDay (@ES#) cpayne [totalcount]
7 years 10 months ago
Volume And Range for 30 Minute Period of Session - Use Button at Top to control offset into session. For instance, Start Min = 30 gives 30 minutes into session to 60 minutes into session. |
View |
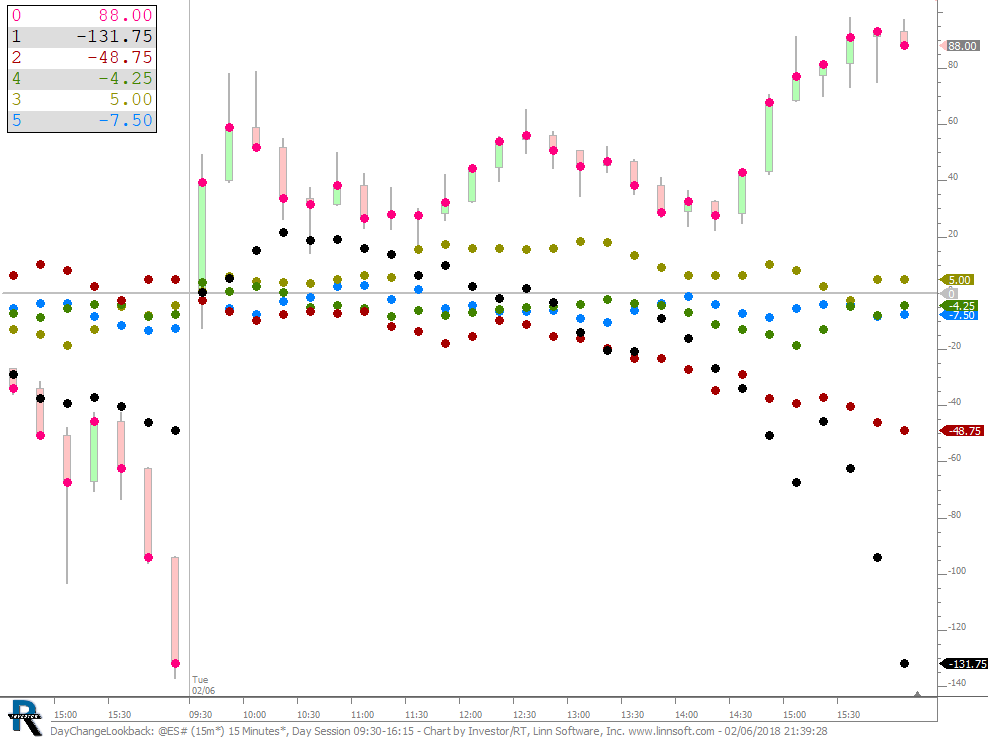 |
DayChangeLookback (@ES#) cpayne [totalcount]
7 years 10 months ago
Day Change Chart eliminates overnight move and compares moves from session open. |
View |
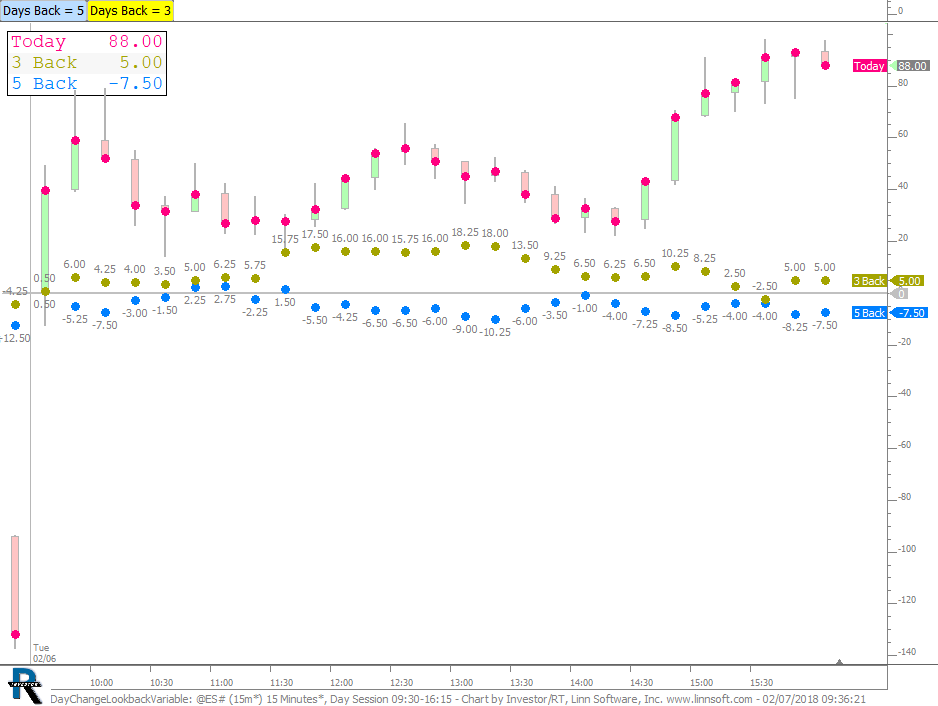 |
DayChangeLookbackVariable (@ES#) cpayne [totalcount]
7 years 10 months ago
Day Change Lookback - Compare today's Day Change price movement from open with that of any past days. Use the buttons at top to control the number of days back (2 overlays). |
View |
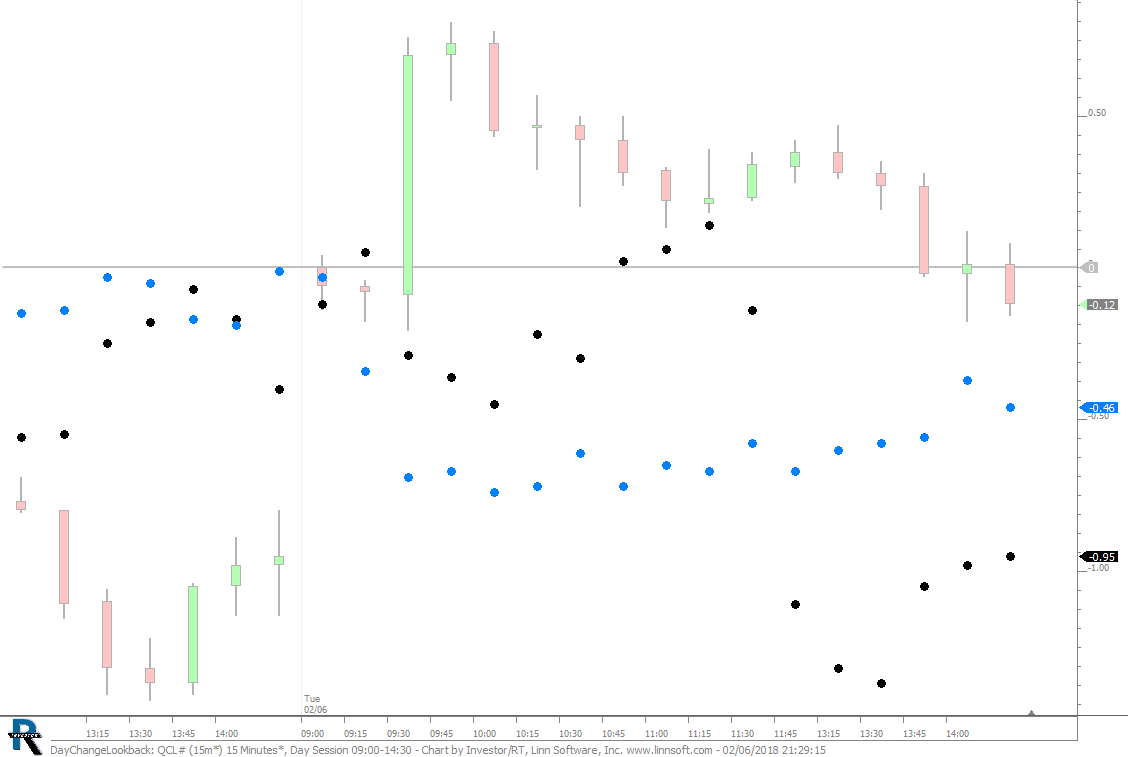 |
DayChangeLookback (QCL#) cpayne [totalcount]
7 years 10 months ago
Day Change Lookback - Black = Yesterday. Blue = Last Week. This chart was uploaded by Investor/RT 13.2.2 showing symbol: QCL#. |
View |
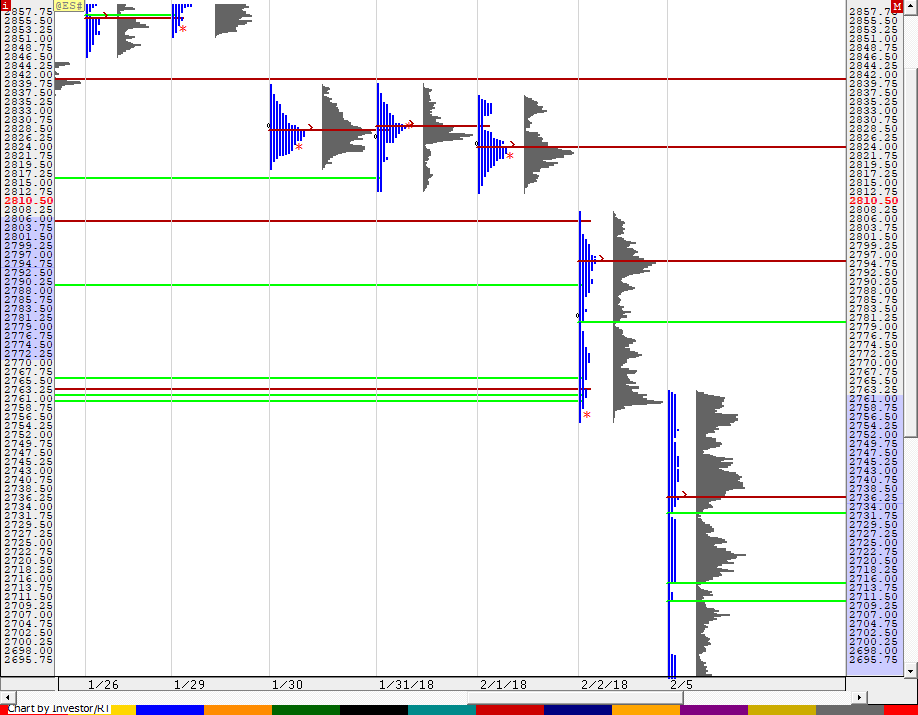 |
ES RTH MANT (@ES#) cpayne [totalcount]
7 years 10 months ago
ES Day Session TPO Profile Chart. This chart was uploaded by Investor/RT 13.2.2 showing symbol: @ES#. |
View |
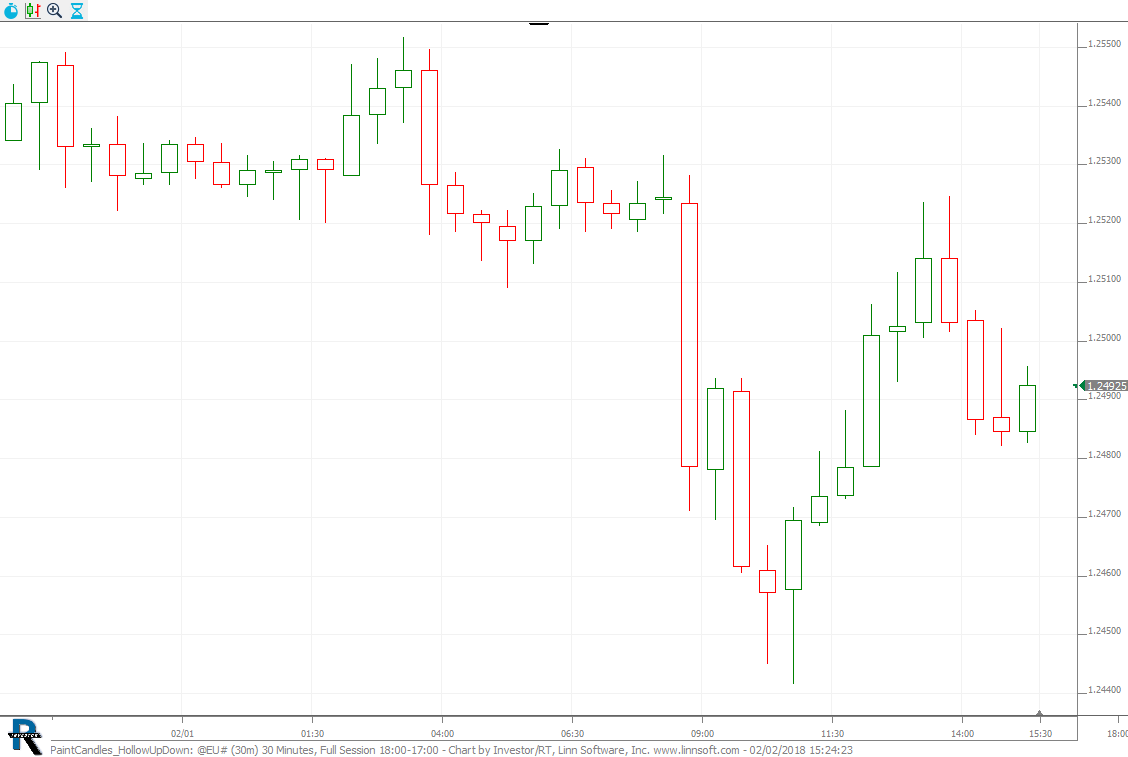 |
PaintCandles HollowUpDown (@EU#) cpayne [totalcount]
7 years 10 months ago
Paint Candles - Hollow Up and Down Candles. This chart was uploaded by Investor/RT 13.2.2 showing symbol: @EU#. |
View |
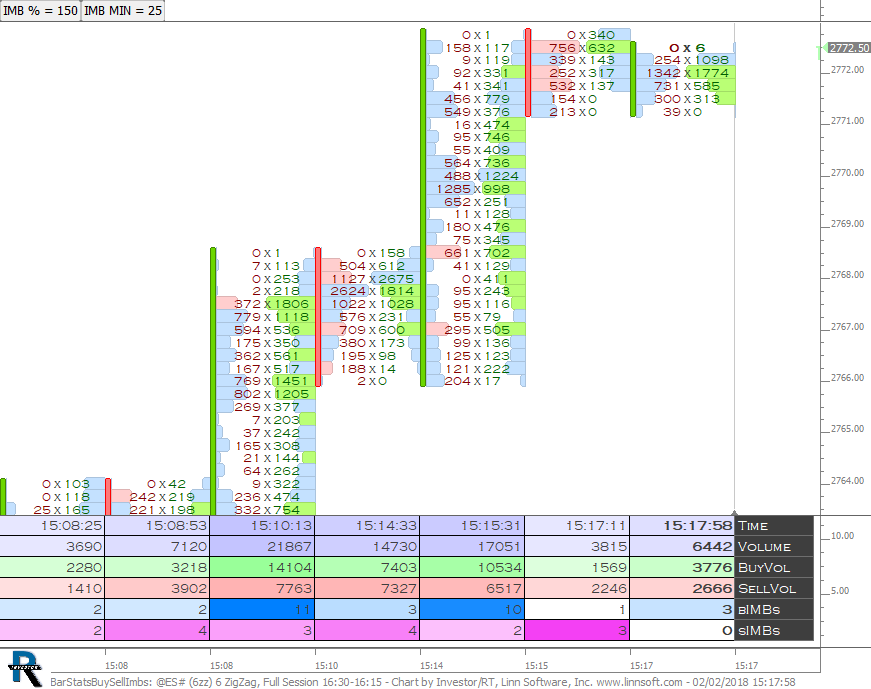 |
BarStatsBuySellImbs (@ES#) cpayne [totalcount]
7 years 10 months ago
Buy and Sell Volume Imbalance Counts as Text in Bar Statistics. This chart was uploaded by Investor/RT 13.2.1 showing symbol: @ES#. |
View |
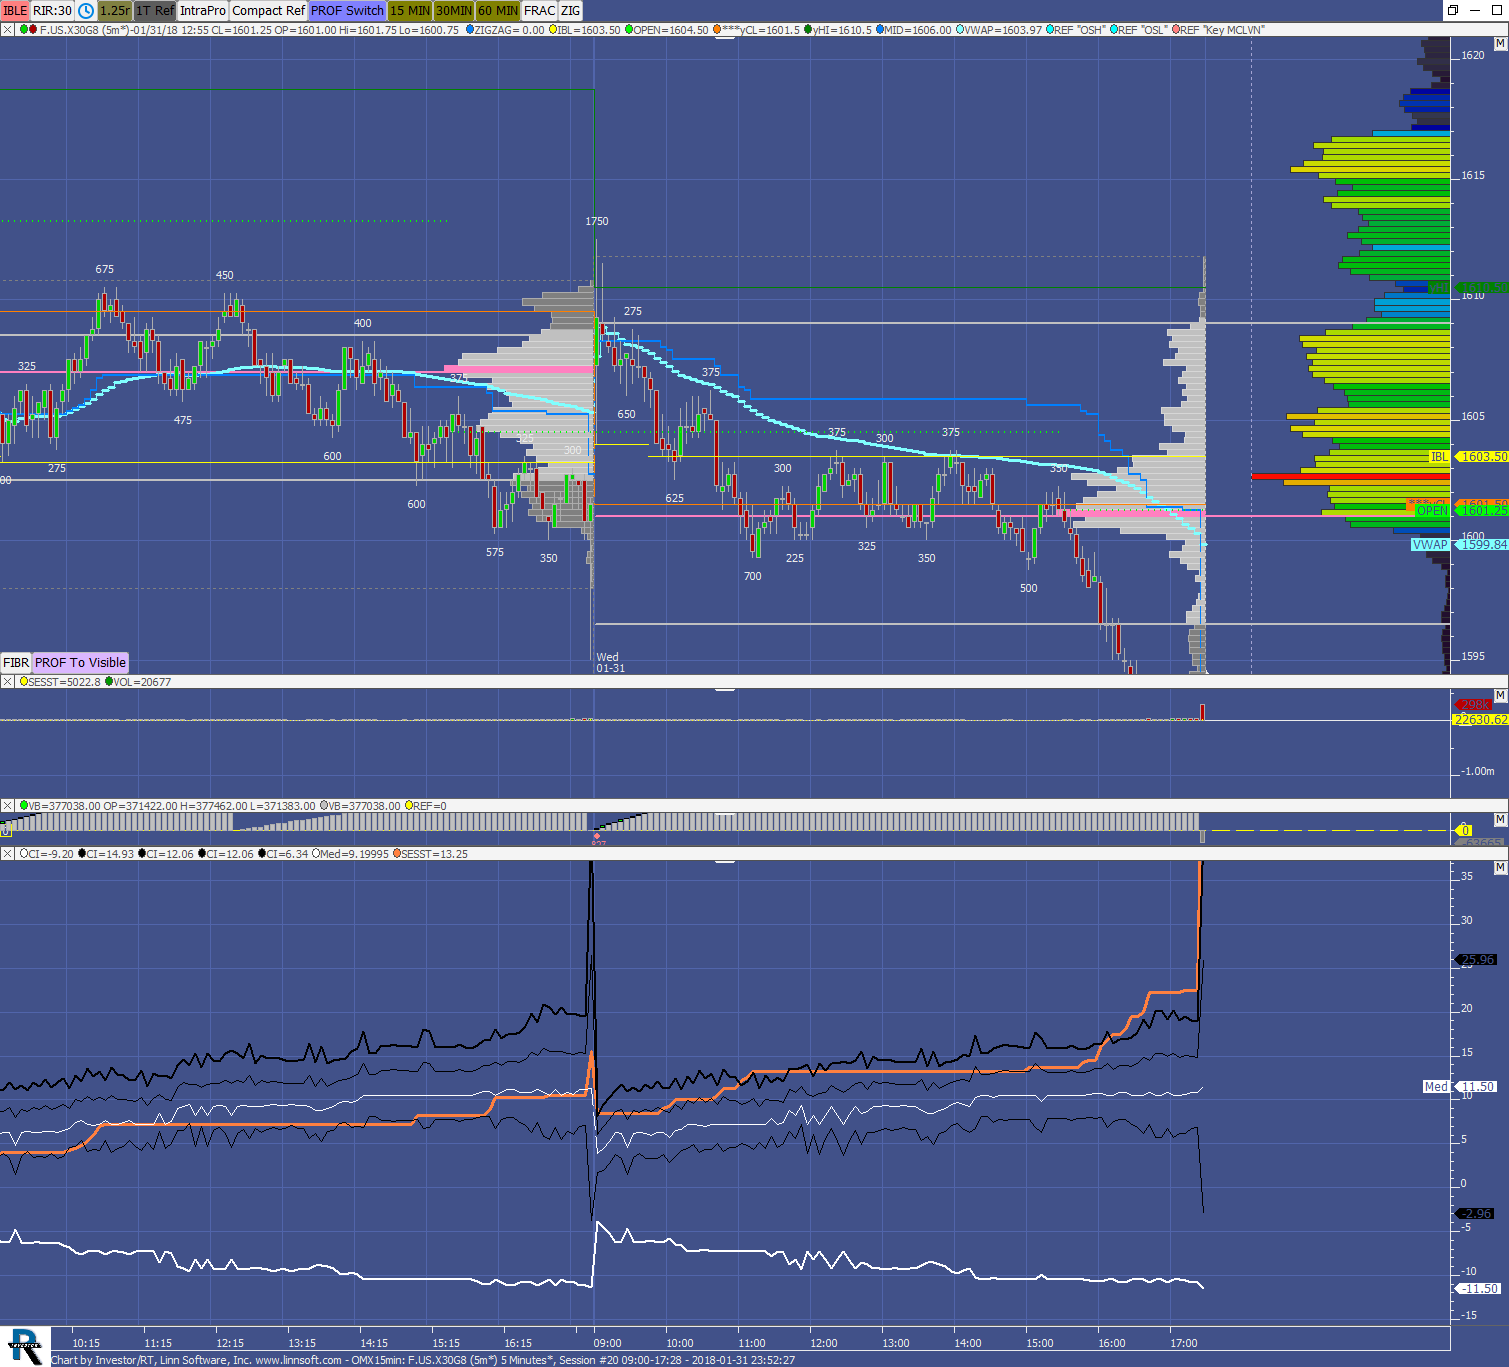 |
OMX15min (F.US.X30G8) benjaminlarsson [totalcount]
7 years 10 months ago
Range vs normaldist. This chart was uploaded by Investor/RT 13.2.2 showing symbol: F.US.X30G8. |
View |