 |
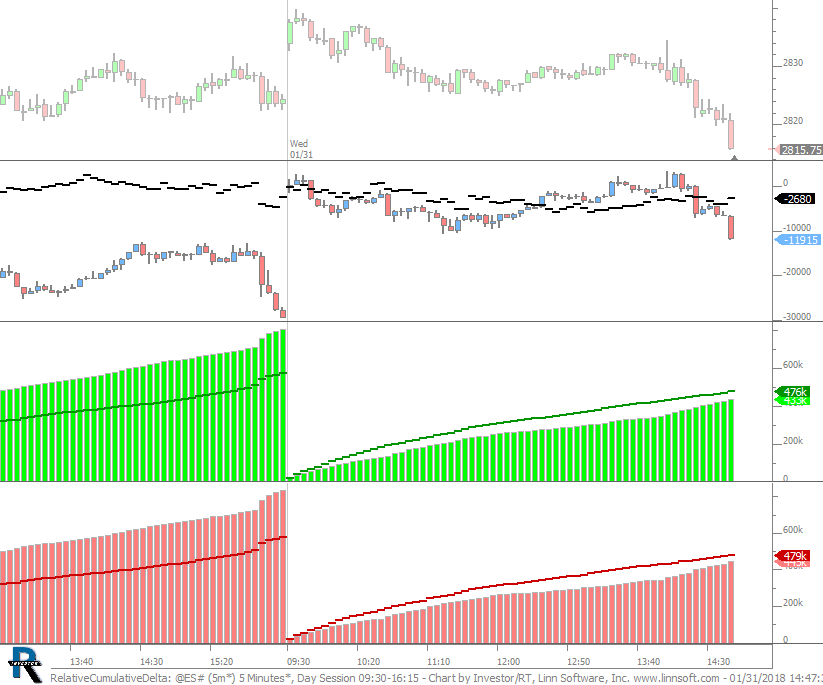
RelativeCumulativeDelta (@ES#) cpayne [totalcount]
7 years 10 months ago
Relative Cumulative Delta. This chart was uploaded by Investor/RT 13.2.1 showing symbol: @ES#. |
View |
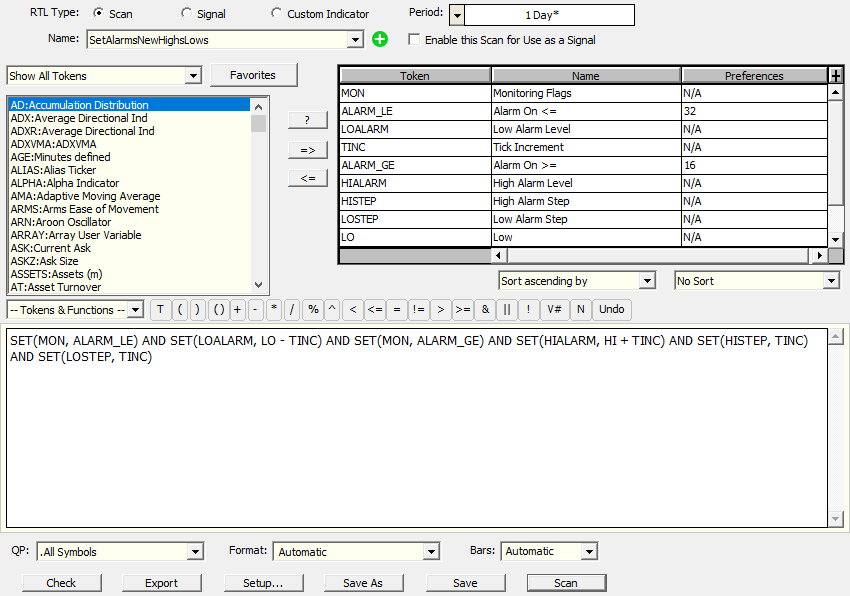 |
SetAlarmsNewHighsLows cpayne [totalcount]
7 years 10 months ago
Scan turns alarms on for new high and low of day. This chart was uploaded by Investor/RT 13.2.1. |
View |
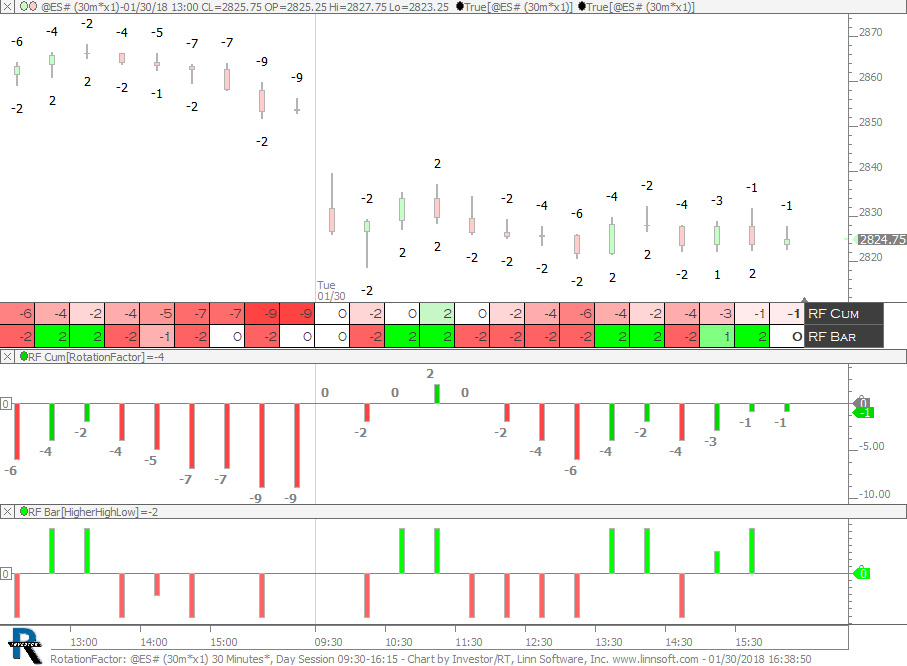 |
RotationFactor (@ES#) cpayne [totalcount]
7 years 10 months ago
Rotation Factor as Text - Per Bar and Cumulative for Session. This chart was uploaded by Investor/RT 13.2.2 showing symbol: @ES#. |
View |
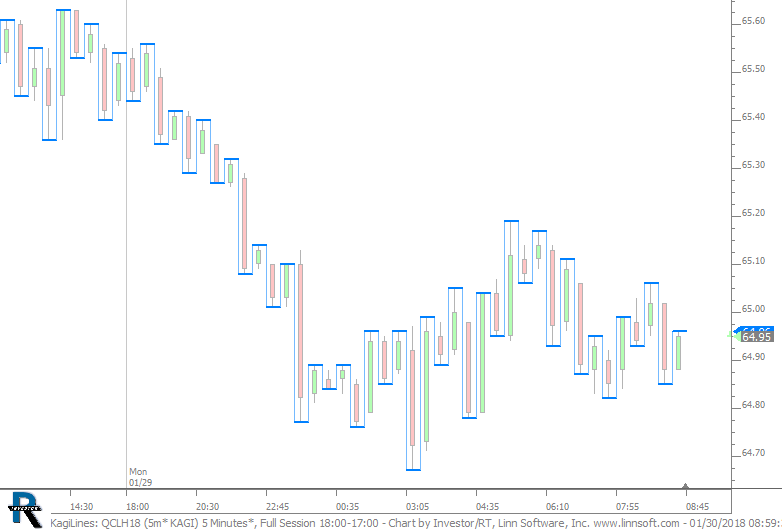 |
KagiLines (QCLH18) cpayne [totalcount]
7 years 10 months ago
Kagi Lines. This chart was uploaded by Investor/RT 13.2.1 showing symbol: QCLH18. |
View |
 |
BarStatsCustomData (@ES#) cpayne [totalcount]
7 years 10 months ago
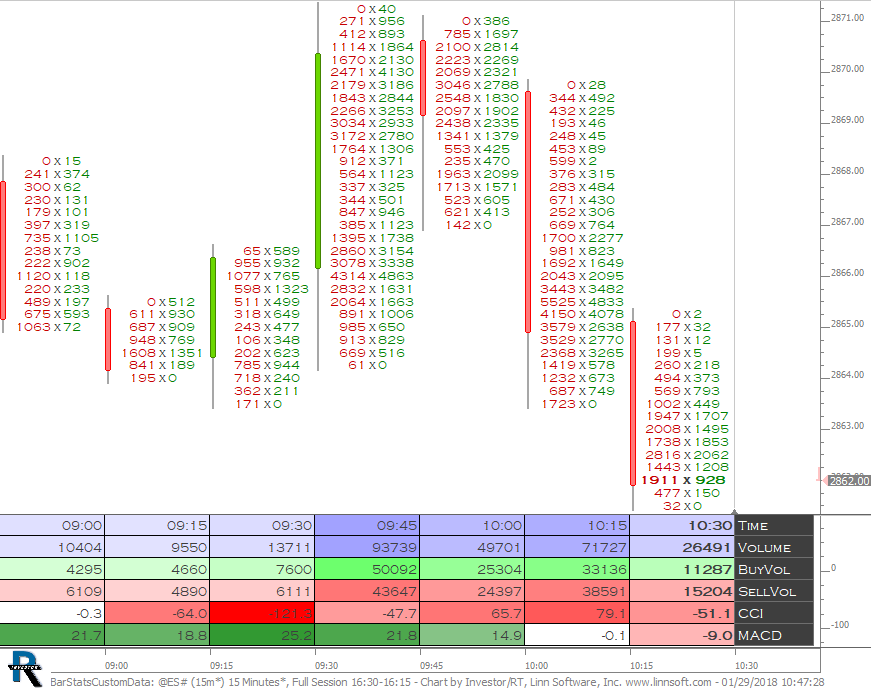
Bar Statistics with Custom Data. This chart was uploaded by Investor/RT 13.2.1 showing symbol: @ES#. |
View |
 |
RelVolComparison (@ES#) cpayne [totalcount]
7 years 10 months ago
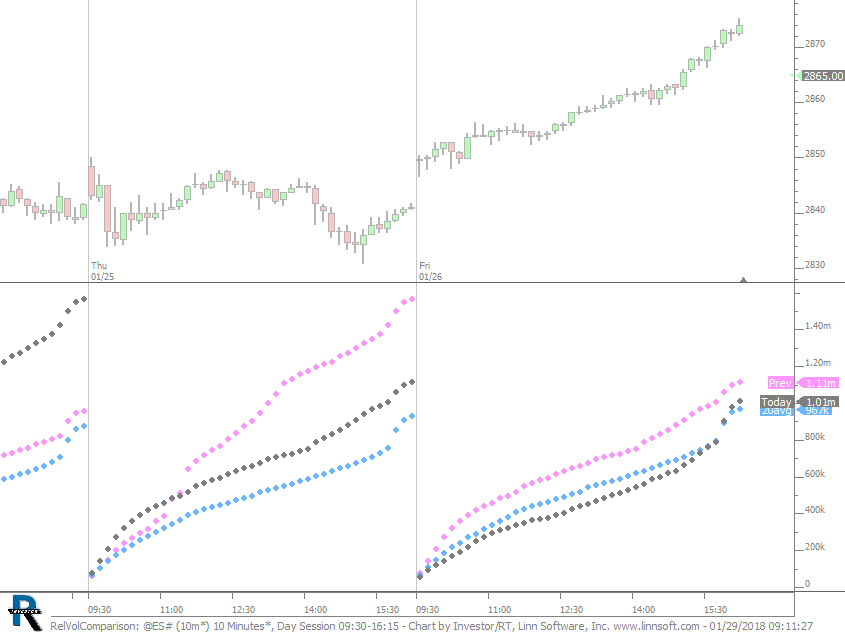
Compares todays cumulative volume with previous day and 20 day average. This chart was uploaded by Investor/RT 13.2.1 showing symbol: @ES#. |
View |
 |
RenkoDeltaDivergence (@ES#) cpayne [totalcount]
7 years 10 months ago
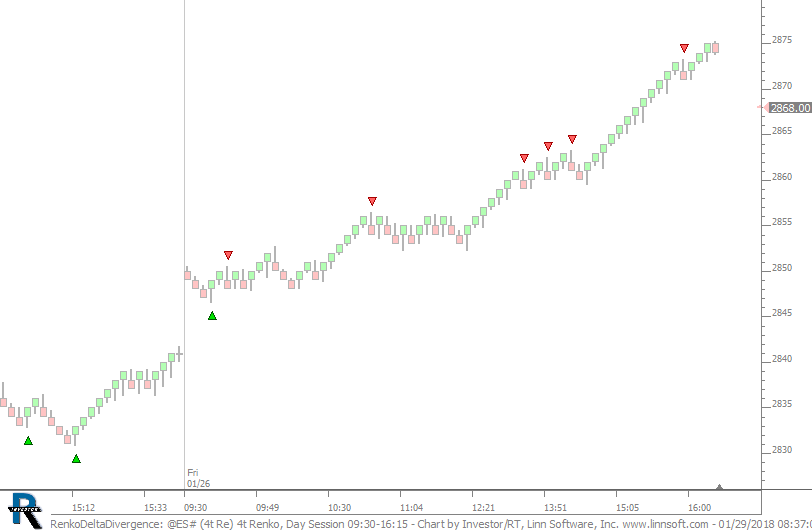
Divergence. Positive Delta on Lows. Negative Delta on Highs. This chart was uploaded by Investor/RT 13.1.5 showing symbol: @ES#. |
View |
 |
VPOC Conditional (@ES#) cpayne [totalcount]
7 years 10 months ago
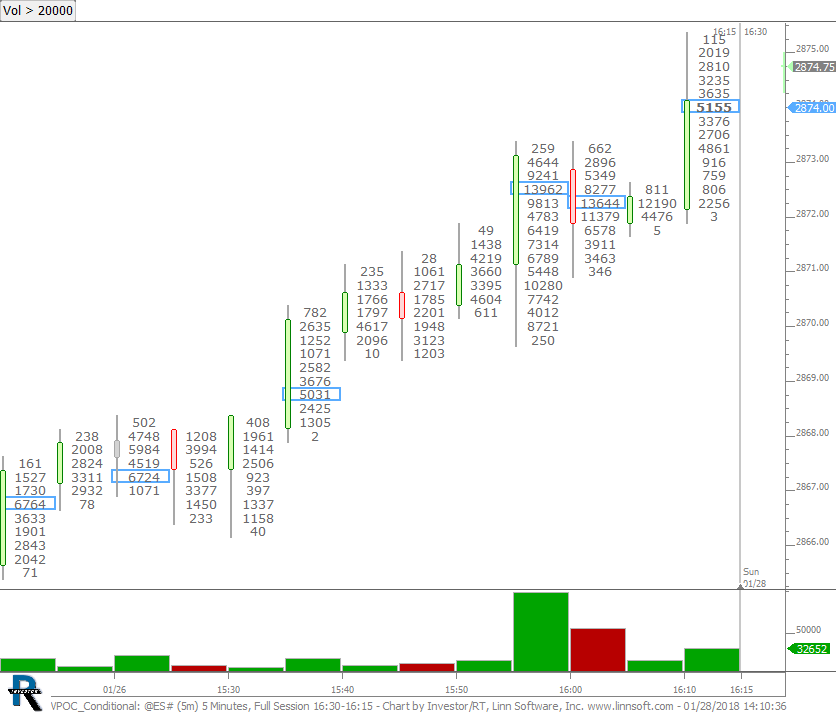
VPOC highlighted conditionally on volume. This chart was uploaded by Investor/RT 13.2.1 showing symbol: @ES#. |
View |
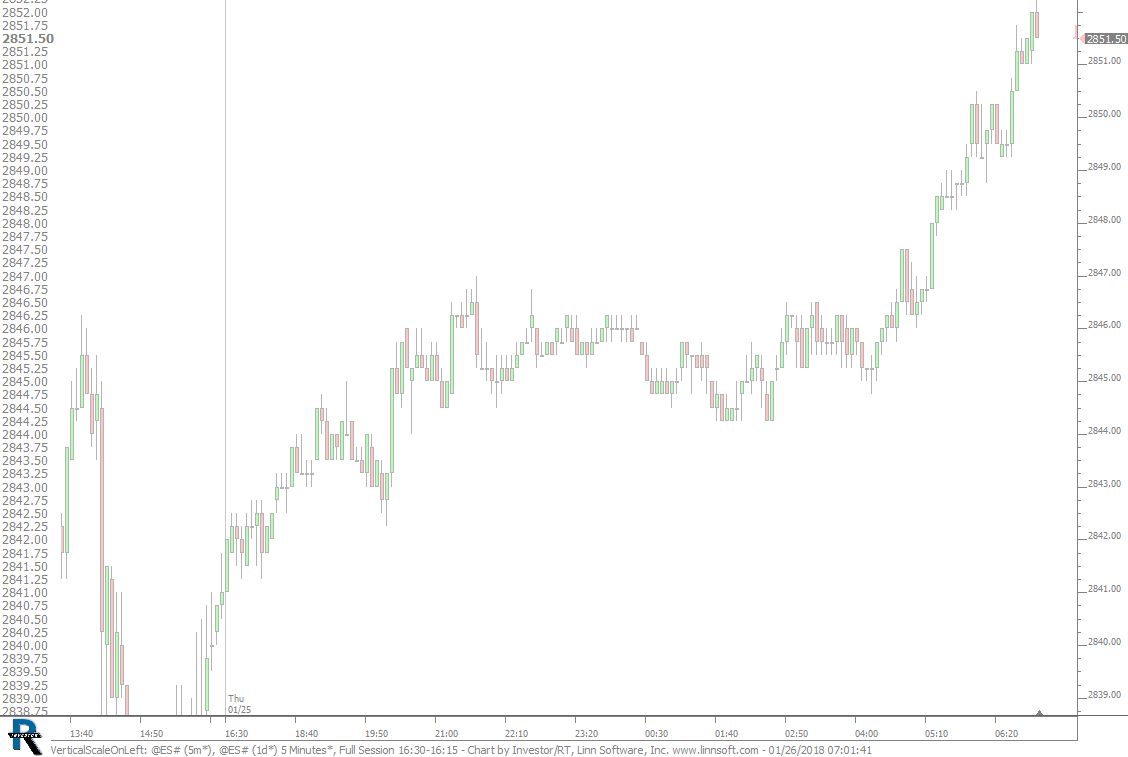 |
VerticalScaleOnLeft (@ES#) cpayne [totalcount]
7 years 11 months ago
Vertical Scale On Left. This chart was uploaded by Investor/RT 13.1.5 showing symbol: @ES#. |
View |
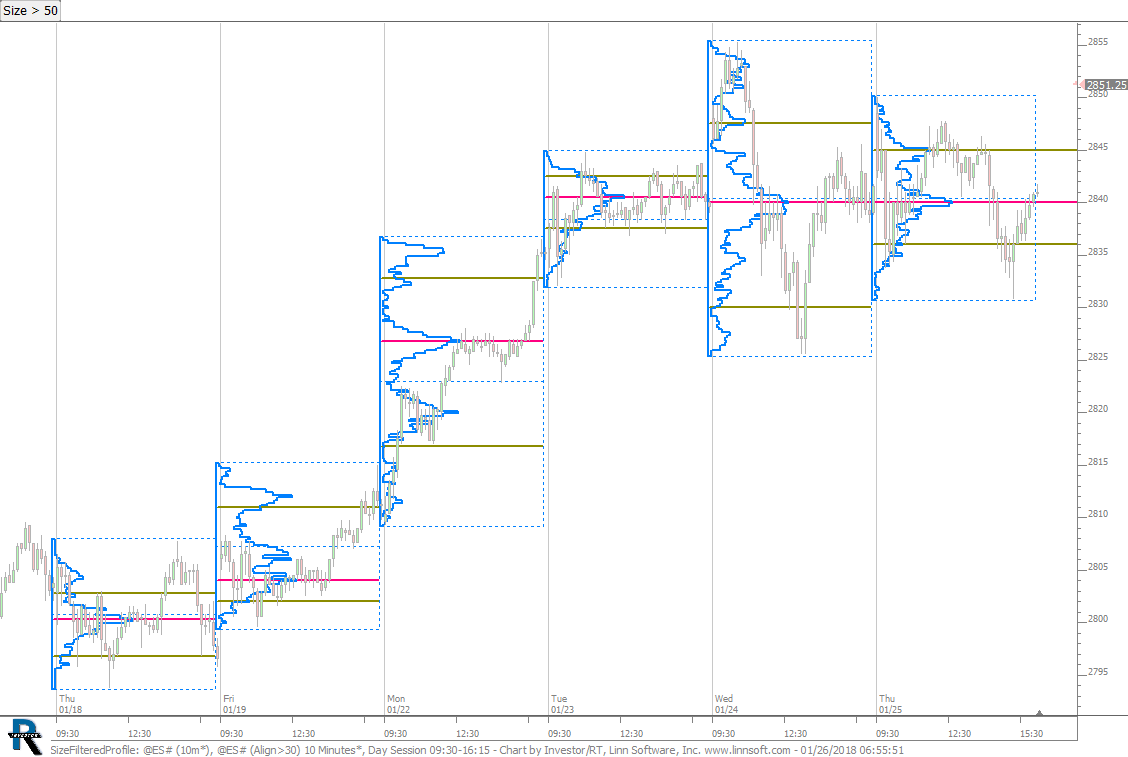 |
SizeFilteredProfile (@ES#) cpayne [totalcount]
7 years 11 months ago
Size Filtered Profiles. This chart was uploaded by Investor/RT 13.1.5 showing symbol: @ES#. |
View |
|
|
KepplerVolumeTracker (@ES#) cpayne [totalcount]
7 years 11 months ago
Keppler Volume Tracker (KVT) in the Multiple Price Highlighter (MPH) Indicator. This chart was uploaded by Investor/RT 13.1.5 showing symbol: @ES#. |
View |
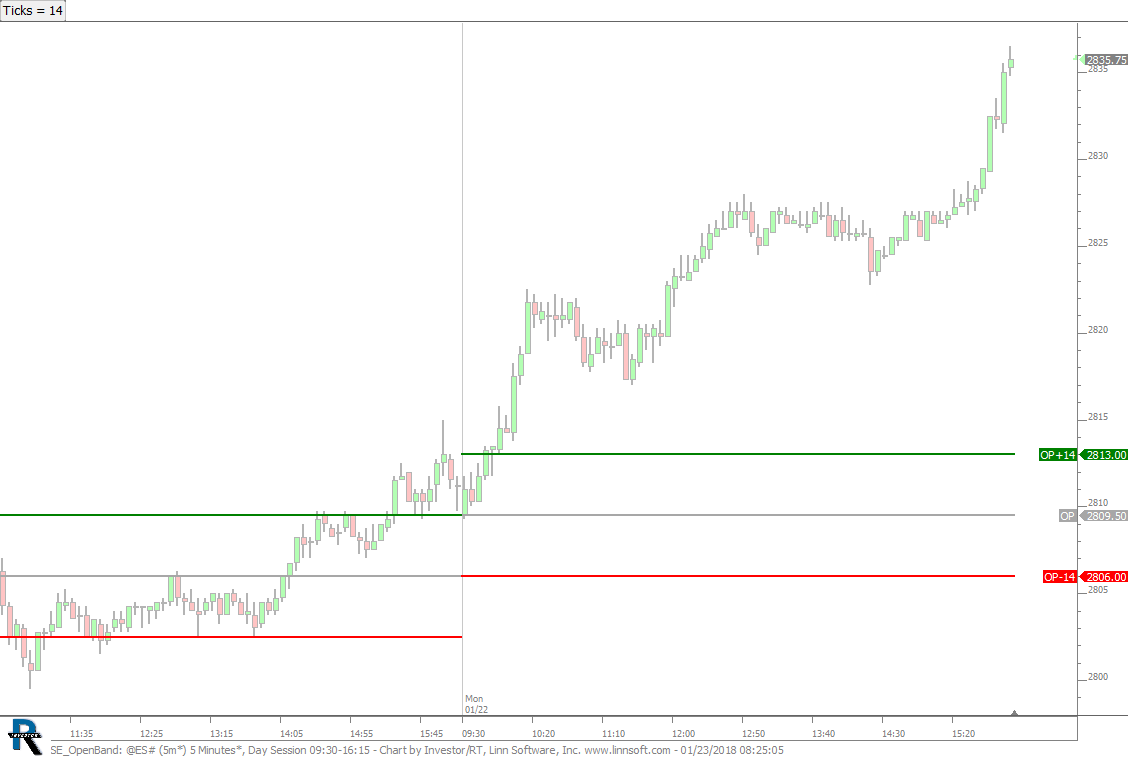 |
SE OpenBand (@ES#) cpayne [totalcount]
7 years 11 months ago
Bands from Open Price - Distance of Bands is in tick increments and controlled by button at top (V29). This chart was uploaded by Investor/RT 13.1.5 showing symbol: @ES#. |
View |
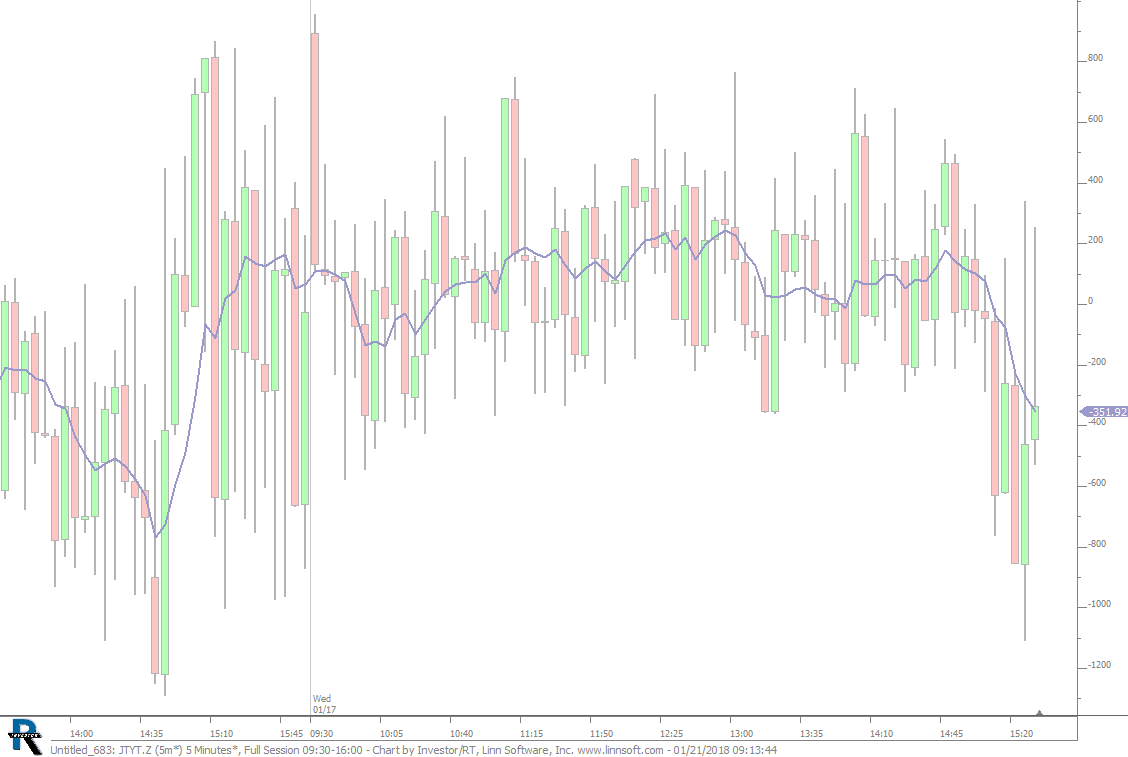 |
Untitled 683 (JTYT.Z) cpayne [totalcount]
7 years 11 months ago
Candles Painted based on Delta using PaintCandles RTX Indicator. This chart was uploaded by Investor/RT 13.1.5 showing symbol: JTYT.Z. |
View |
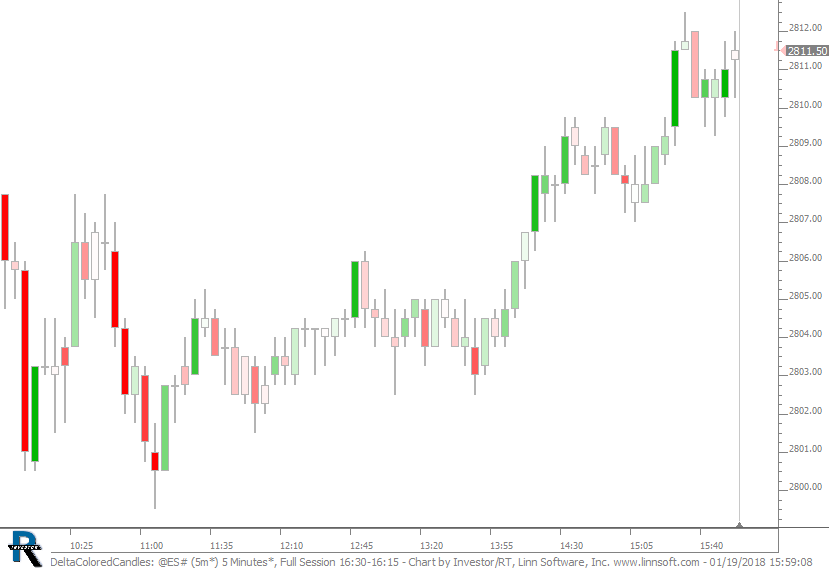 |
DeltaColoredCandles (@ES#) cpayne [totalcount]
7 years 11 months ago
Candles Painted based on Delta using PaintCandles RTX Indicator. This chart was uploaded by Investor/RT 13.1.5 showing symbol: @ES#. |
View |
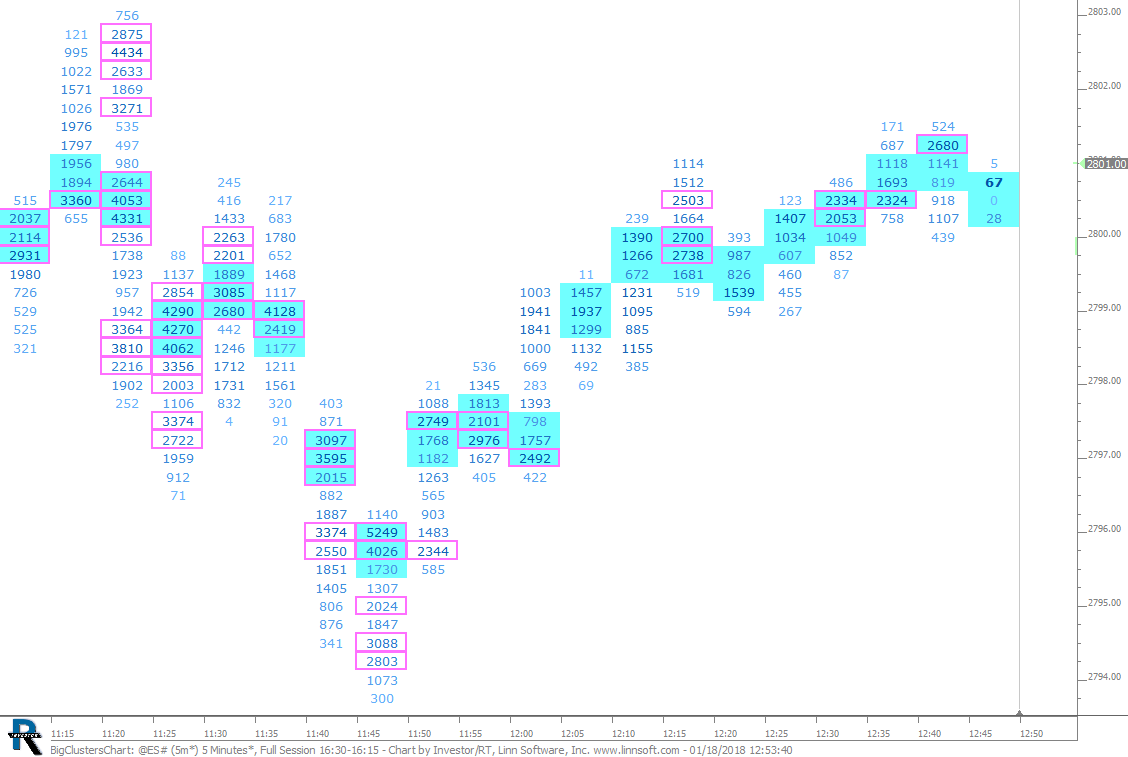 |
BigClustersChart (@ES#) cpayne [totalcount]
7 years 11 months ago
This chart was uploaded by Investor/RT 13.1.5 showing symbol: @ES#. |
View |
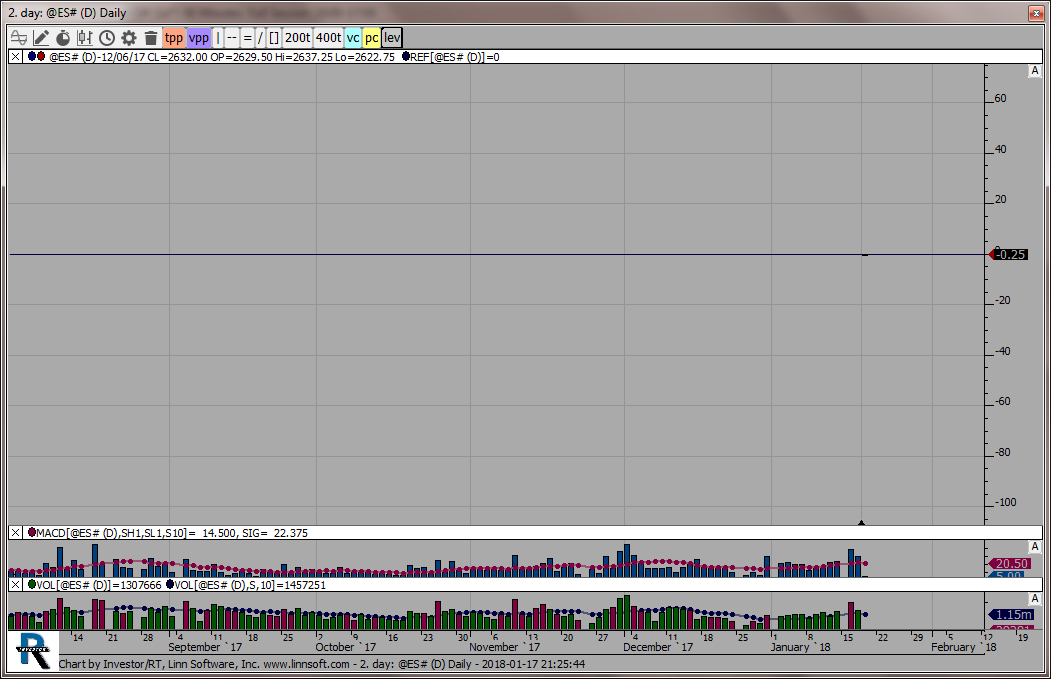 |
2 day (@ES#) John Alwill [totalcount]
7 years 11 months ago
day change chart on daily ES chart. This chart was uploaded by Investor/RT 13.1.5 showing symbol: @ES#. |
View |
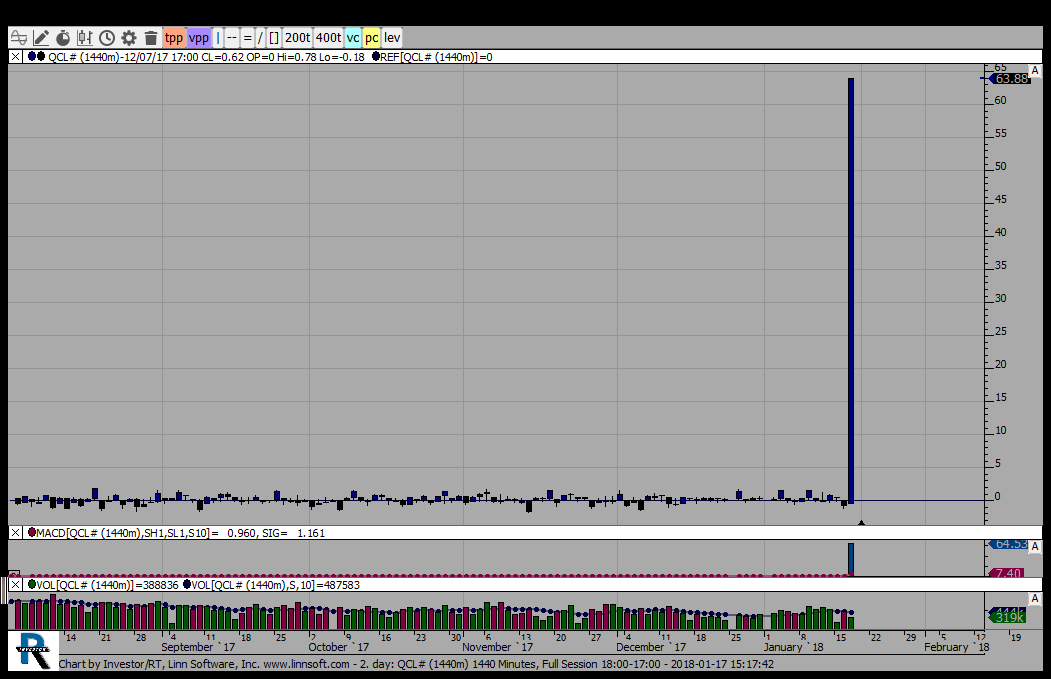 |
2 day (QCL#) John Alwill [totalcount]
7 years 11 months ago
day change chart on daily chart. This chart was uploaded by Investor/RT 13.1.5 showing symbol: QCL#. |
View |
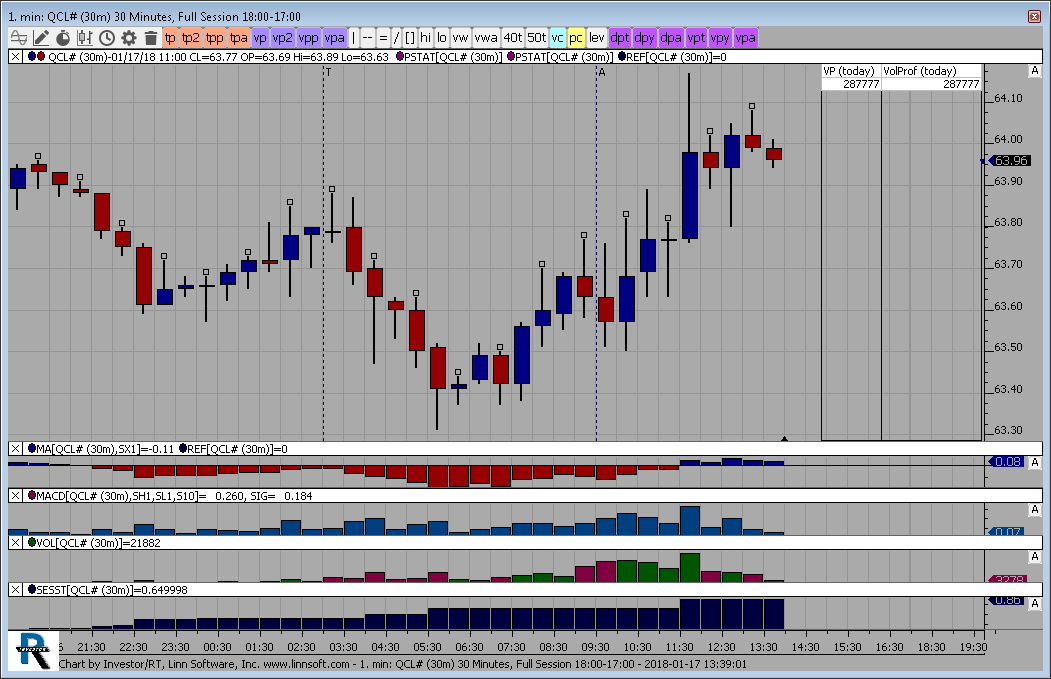 |
1 min (QCL#) John Alwill [totalcount]
7 years 11 months ago
This chart was uploaded by Investor/RT 13.1.5 showing symbol: QCL#. |
View |
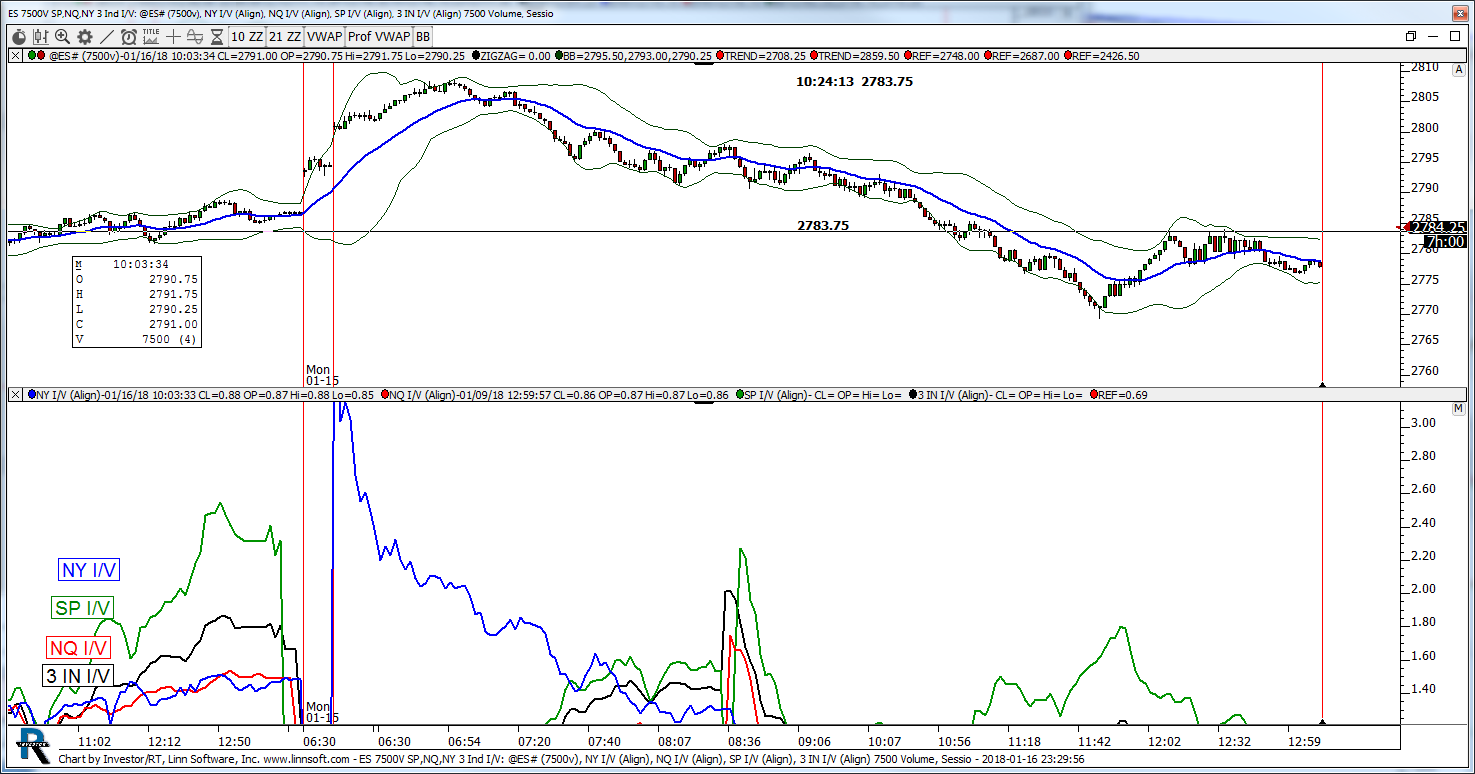 |
ES 7500V SPNQNY 3 Ind I V (@ES#) kencassorla [totalcount]
7 years 11 months ago
ES 7500. This chart was uploaded by Investor/RT 13.1.5 showing symbol: @ES#. |
View |
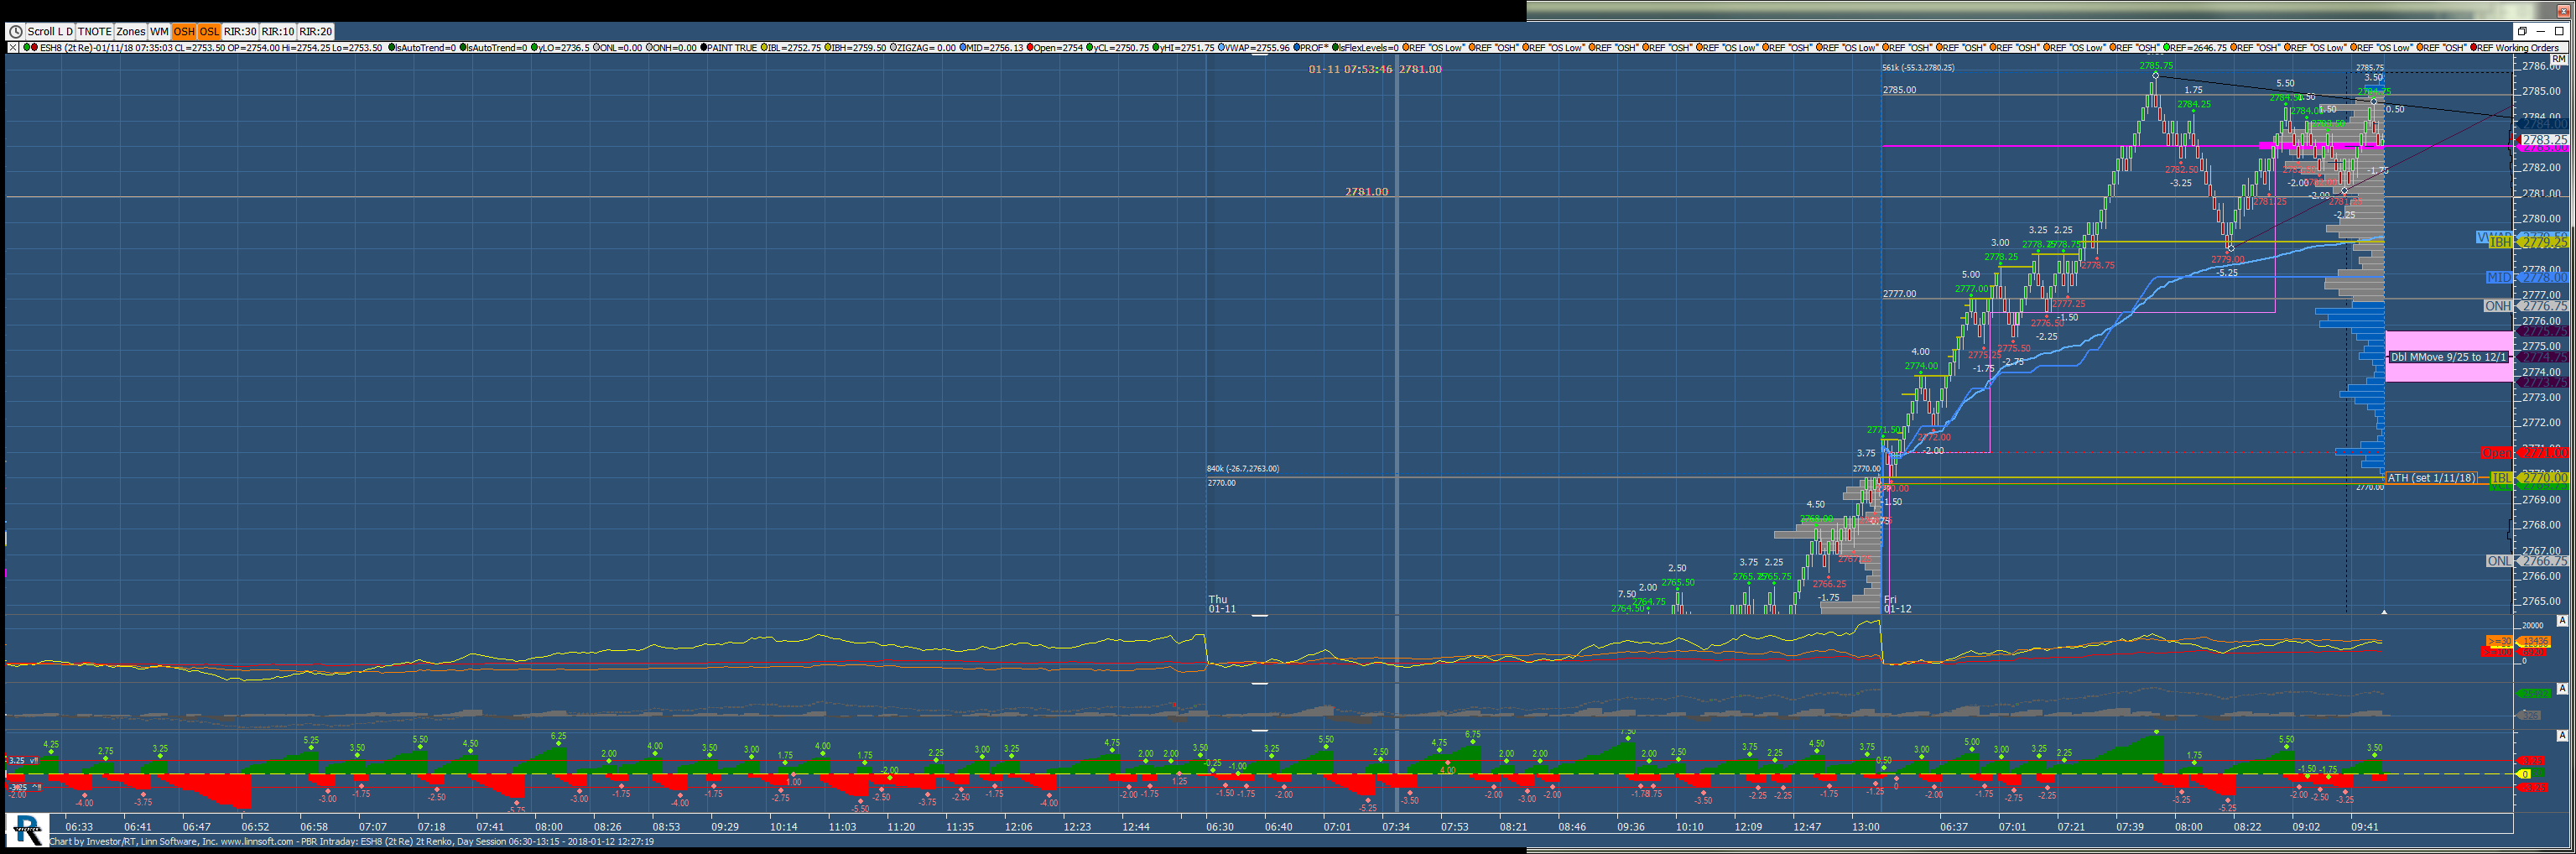 |
PBR Intraday (ESH8) PRabay [totalcount]
7 years 11 months ago
To Chad From Paul Rabay. This chart was uploaded by Investor/RT 13.1.5 showing symbol: ESH8. |
View |
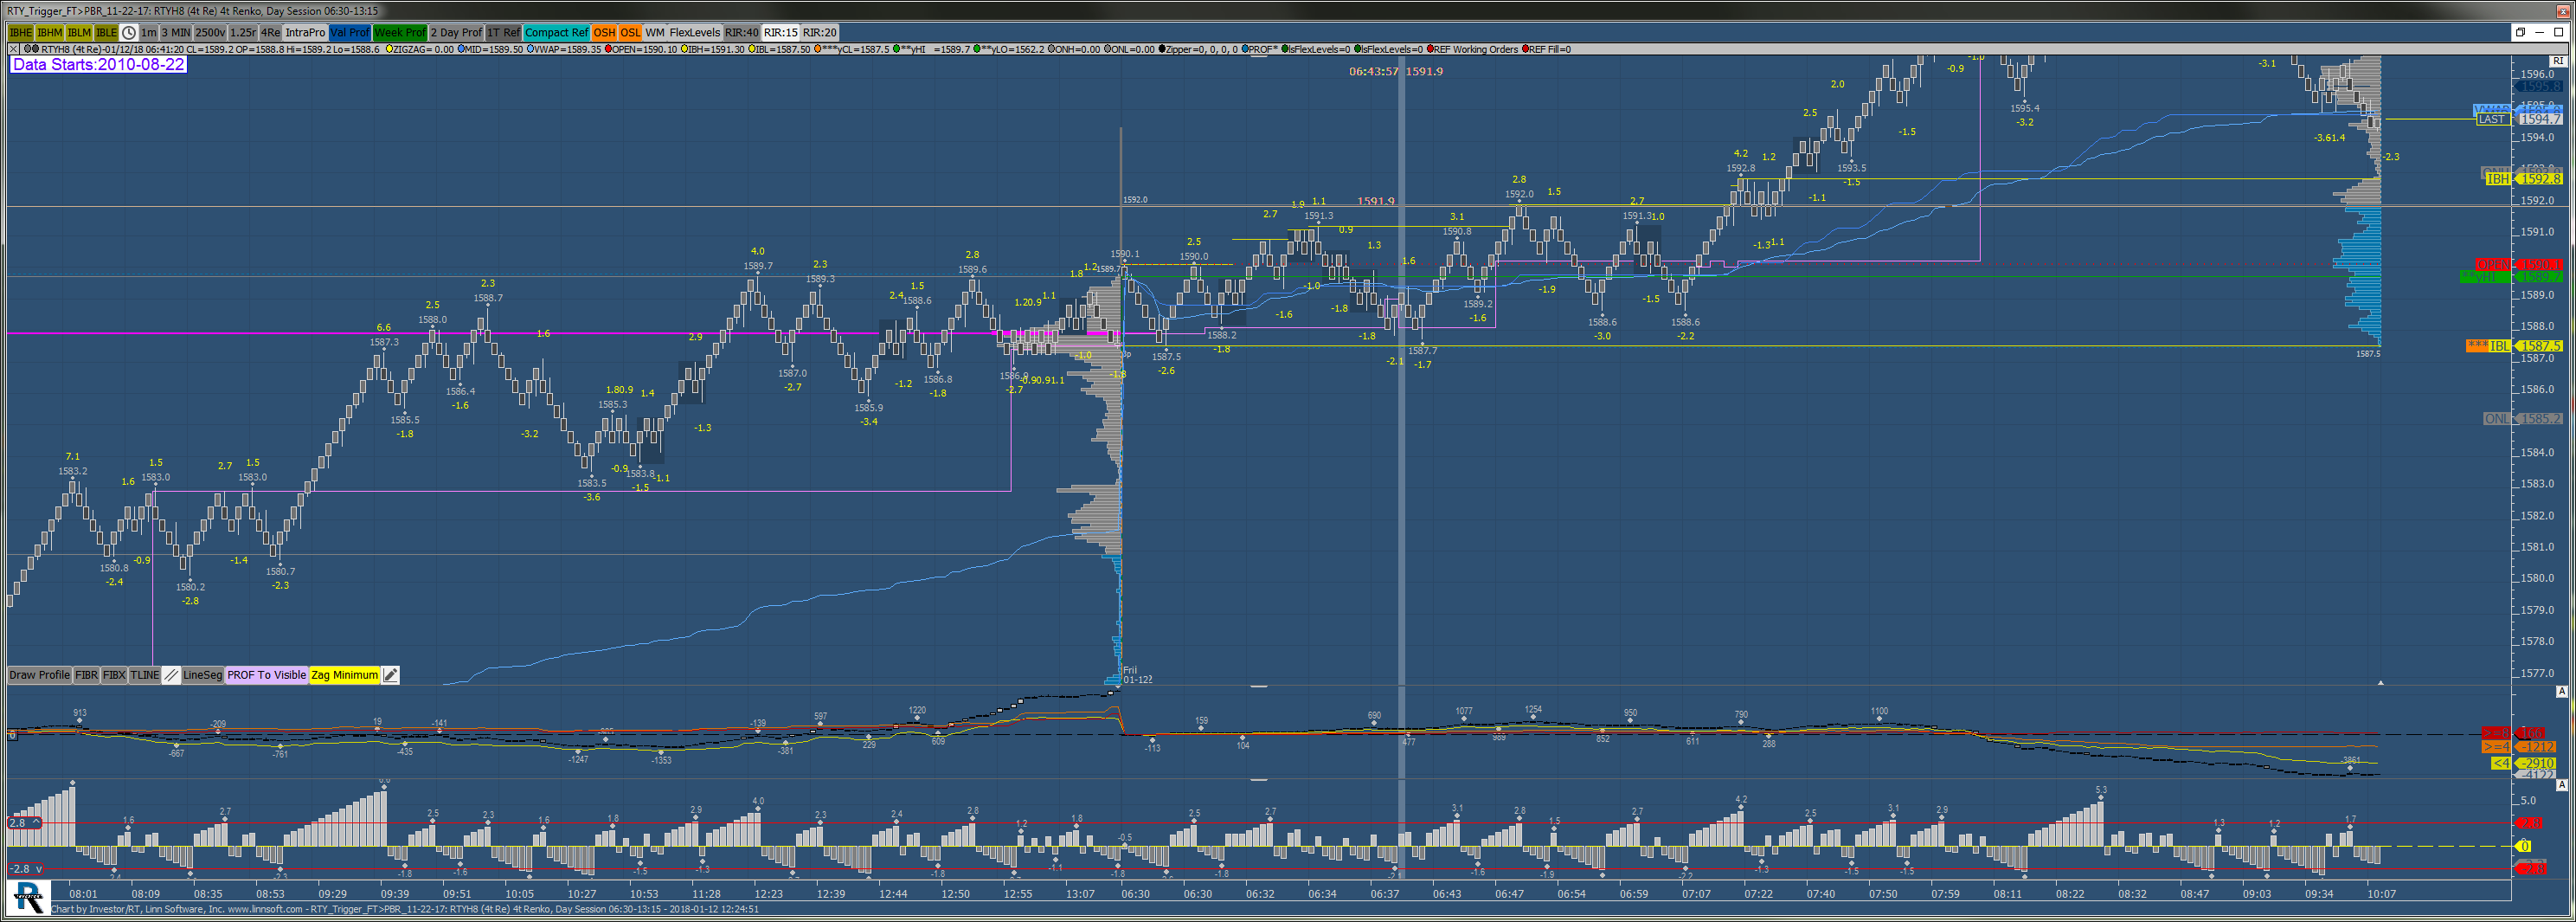 |
RTY Trigger FTPBR 11 22 17 (RTYH8) PRabay [totalcount]
7 years 11 months ago
To Chad From Paul Rabay. This chart was uploaded by Investor/RT 13.1.5 showing symbol: RTYH8. |
View |
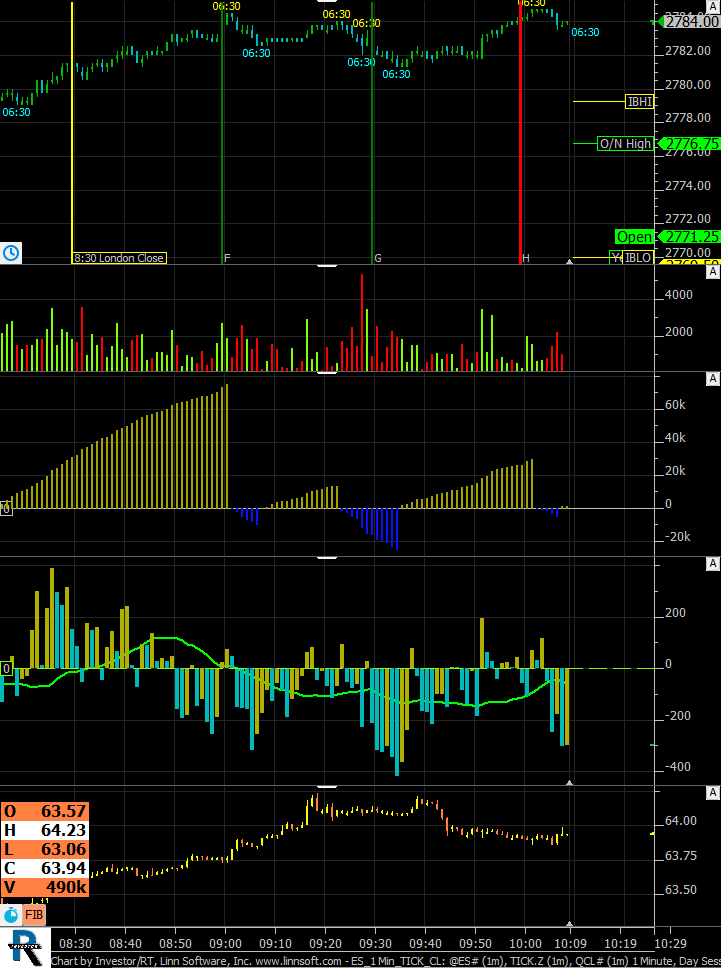 |
ES 1 Min TICK CL (@ES#) ashamess [totalcount]
7 years 11 months ago
Chad: here is another error that showed up iafter the last updates. |
View |
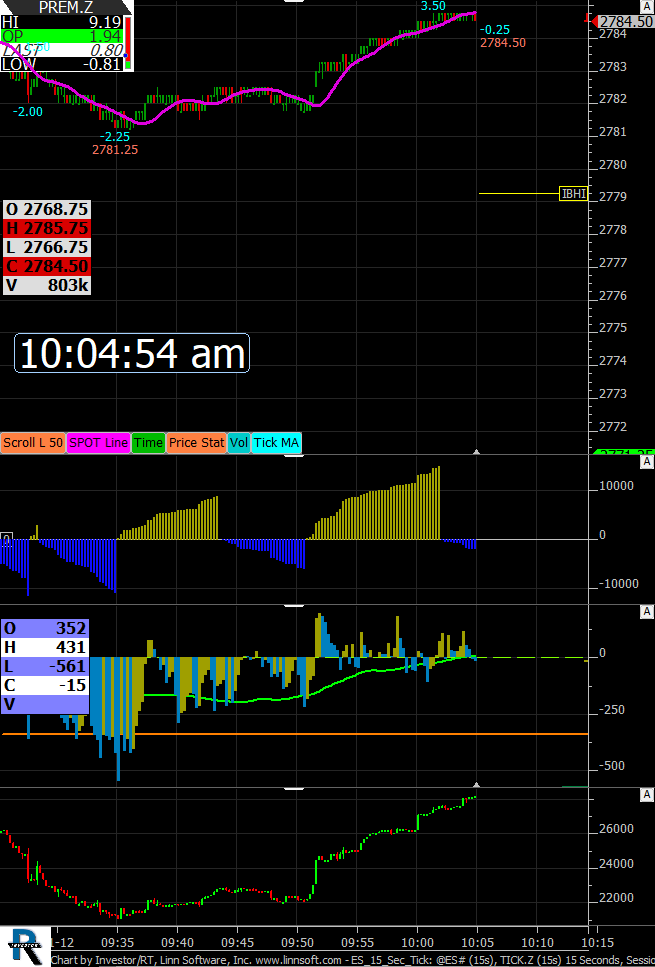 |
ES 15 Sec Tick (@ES#) ashamess [totalcount]
7 years 11 months ago
Chad : here is that chart, Shawn asked about the price scale set-up, so you can check it. I've not changed the chart, use the auto settings. |
View |
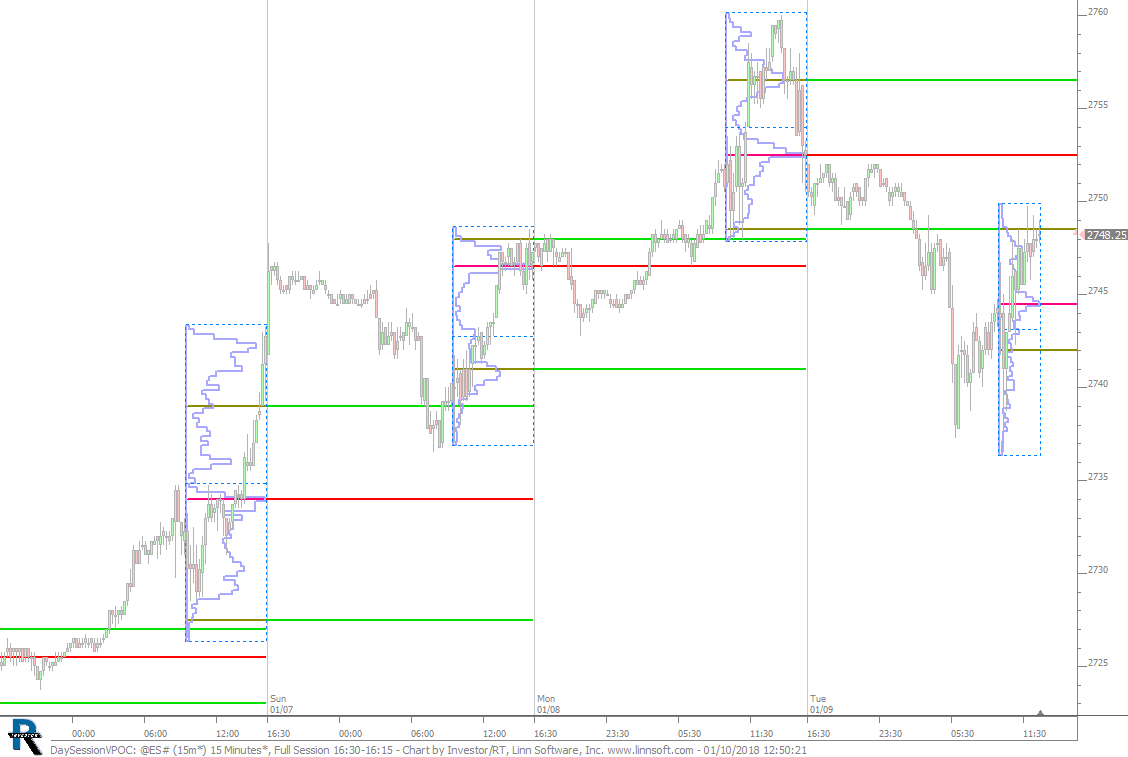 |
DaySessionVPOC (@ES#) cpayne [totalcount]
7 years 11 months ago
Day Session VPOC. This chart was uploaded by Investor/RT 13.1.4 showing symbol: @ES#. |
View |
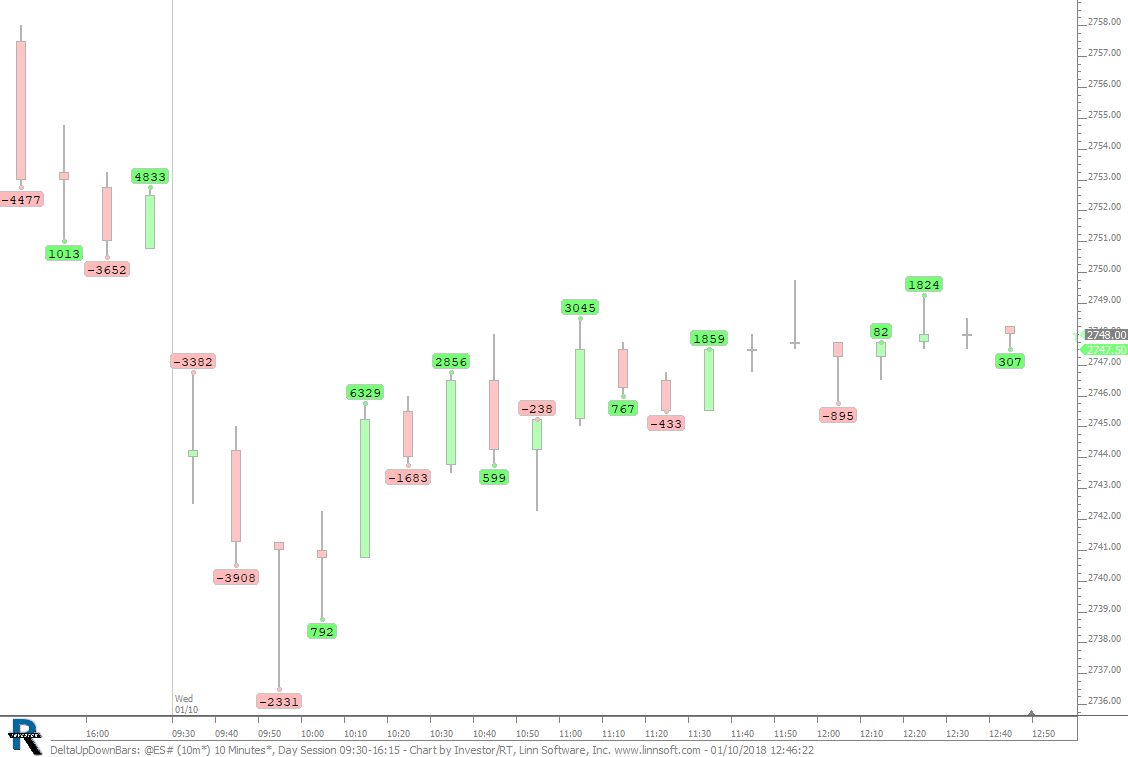 |
DeltaUpDownBars (@ES#) cpayne [totalcount]
7 years 11 months ago
Delta of Up and Down Bars Labeled. This chart was uploaded by Investor/RT 13.1.4 showing symbol: @ES#. |
View |