 |
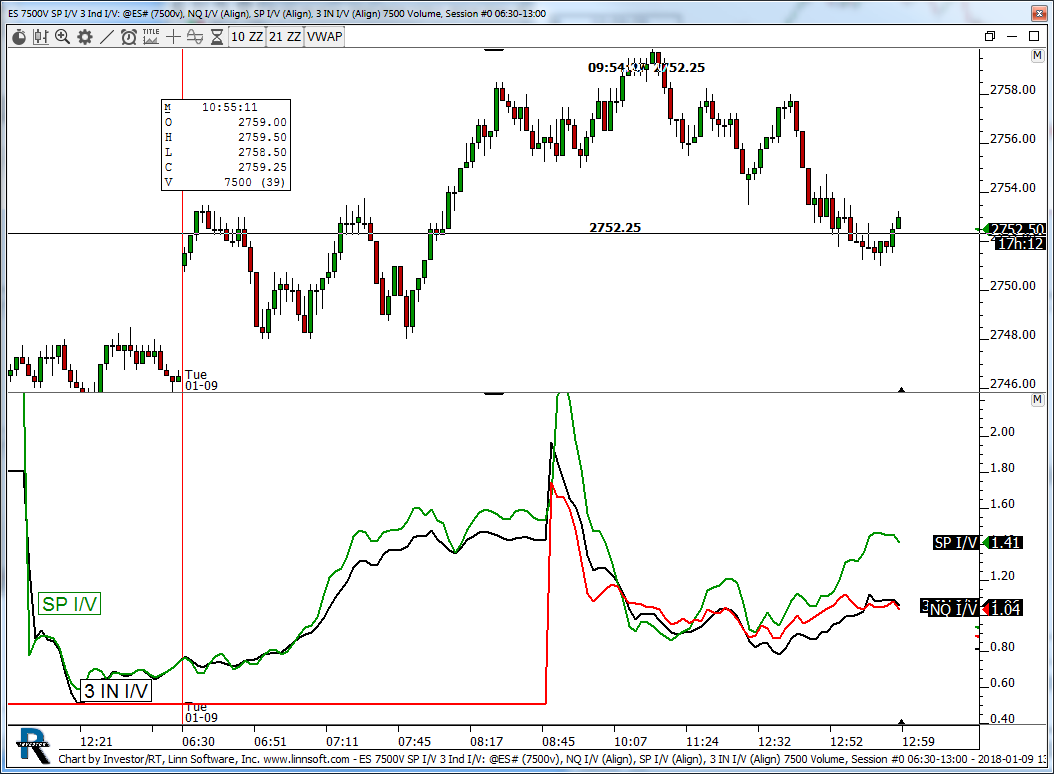
ES 7500V SP I V 3 Ind I V (@ES#) kencassorla [totalcount]
7 years 11 months ago
ES 7500. This chart was uploaded by Investor/RT 13.1.4 showing symbol: @ES#. |
View |
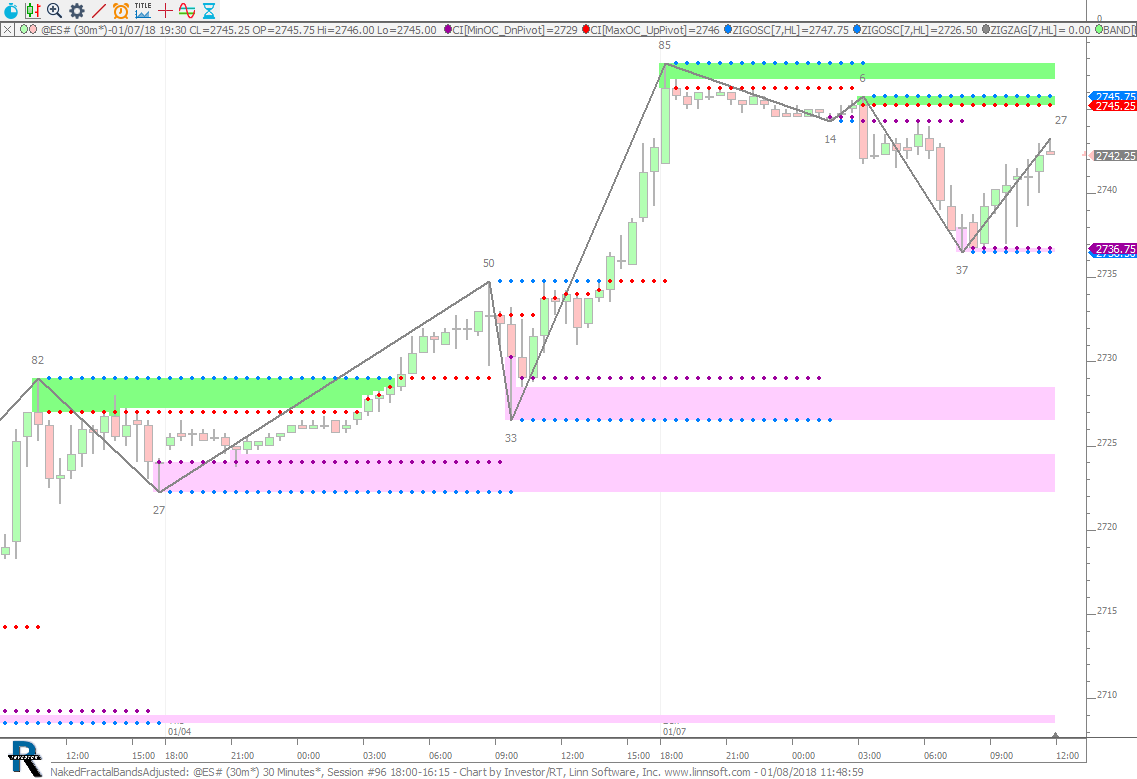 |
NakedFractalBandsAdjusted (@ES#) cpayne [totalcount]
7 years 11 months ago
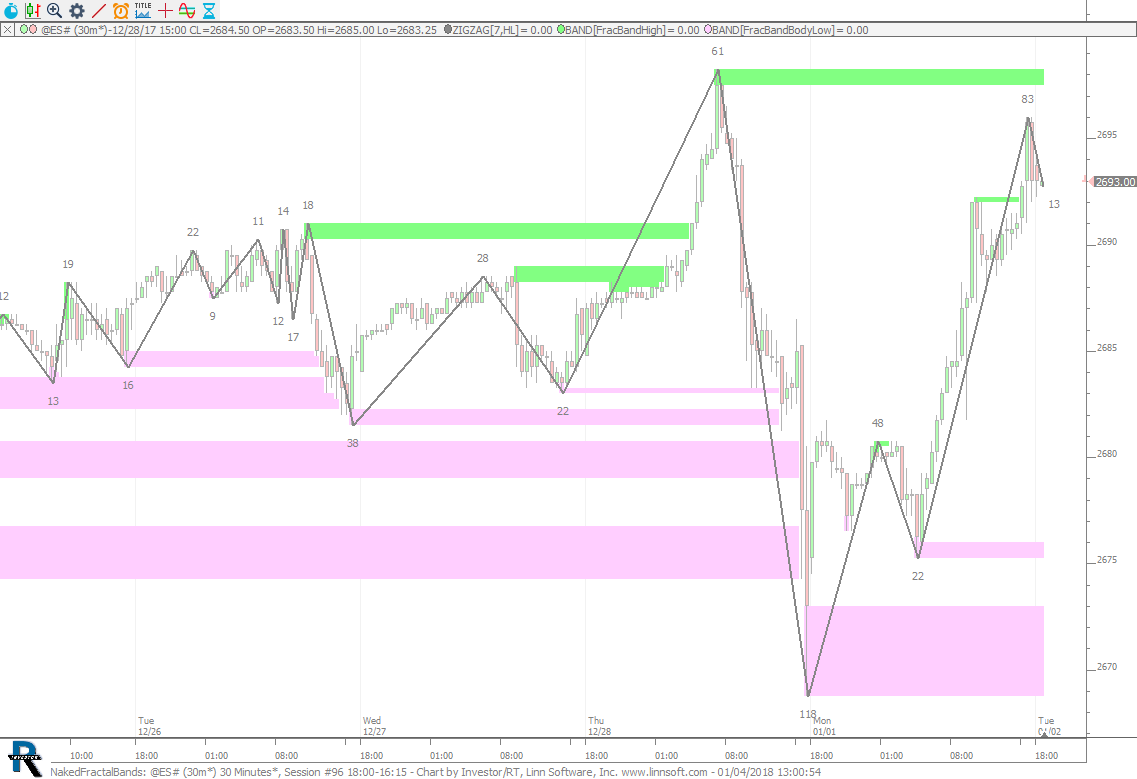
Naked Fractal Bands via Custom Indicators. This chart was uploaded by Investor/RT 13.1.4 showing symbol: @ES#. |
View |
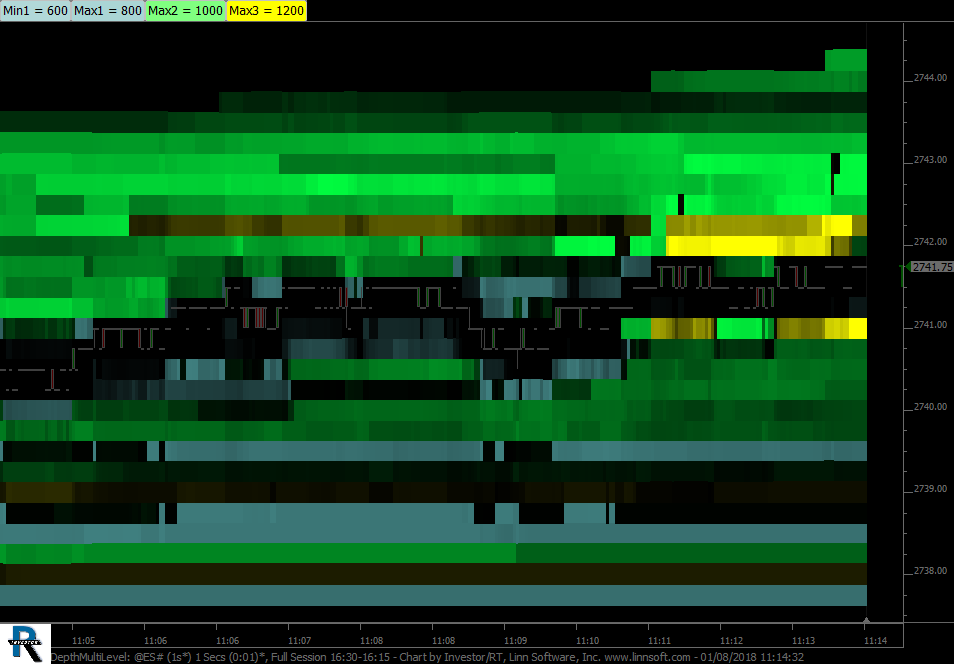 |
DepthMultiLevel (@ES#) cpayne [totalcount]
7 years 11 months ago
Trail of Intentions with 3 levels (turquoise / green / yellow) controlled by the buttons at top. This chart was uploaded by Investor/RT 13.1.4 showing symbol: @ES#. |
View |
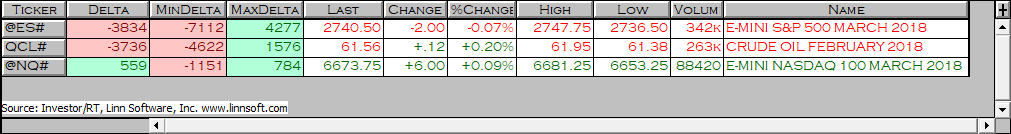 |
Delta Dashboard cpayne [totalcount]
7 years 11 months ago
Delta Dashboard Quotepage. This chart was uploaded by Investor/RT 13.1.4. |
View |
 |
NakedFractalBands (@ES#) cpayne [totalcount]
7 years 11 months ago
Naked Fractal Bands. This chart was uploaded by Investor/RT 13.1.1 showing symbol: @ES#. |
View |
 |
10sDomHeatMap (@ES#) jayski51369 [totalcount]
7 years 11 months ago
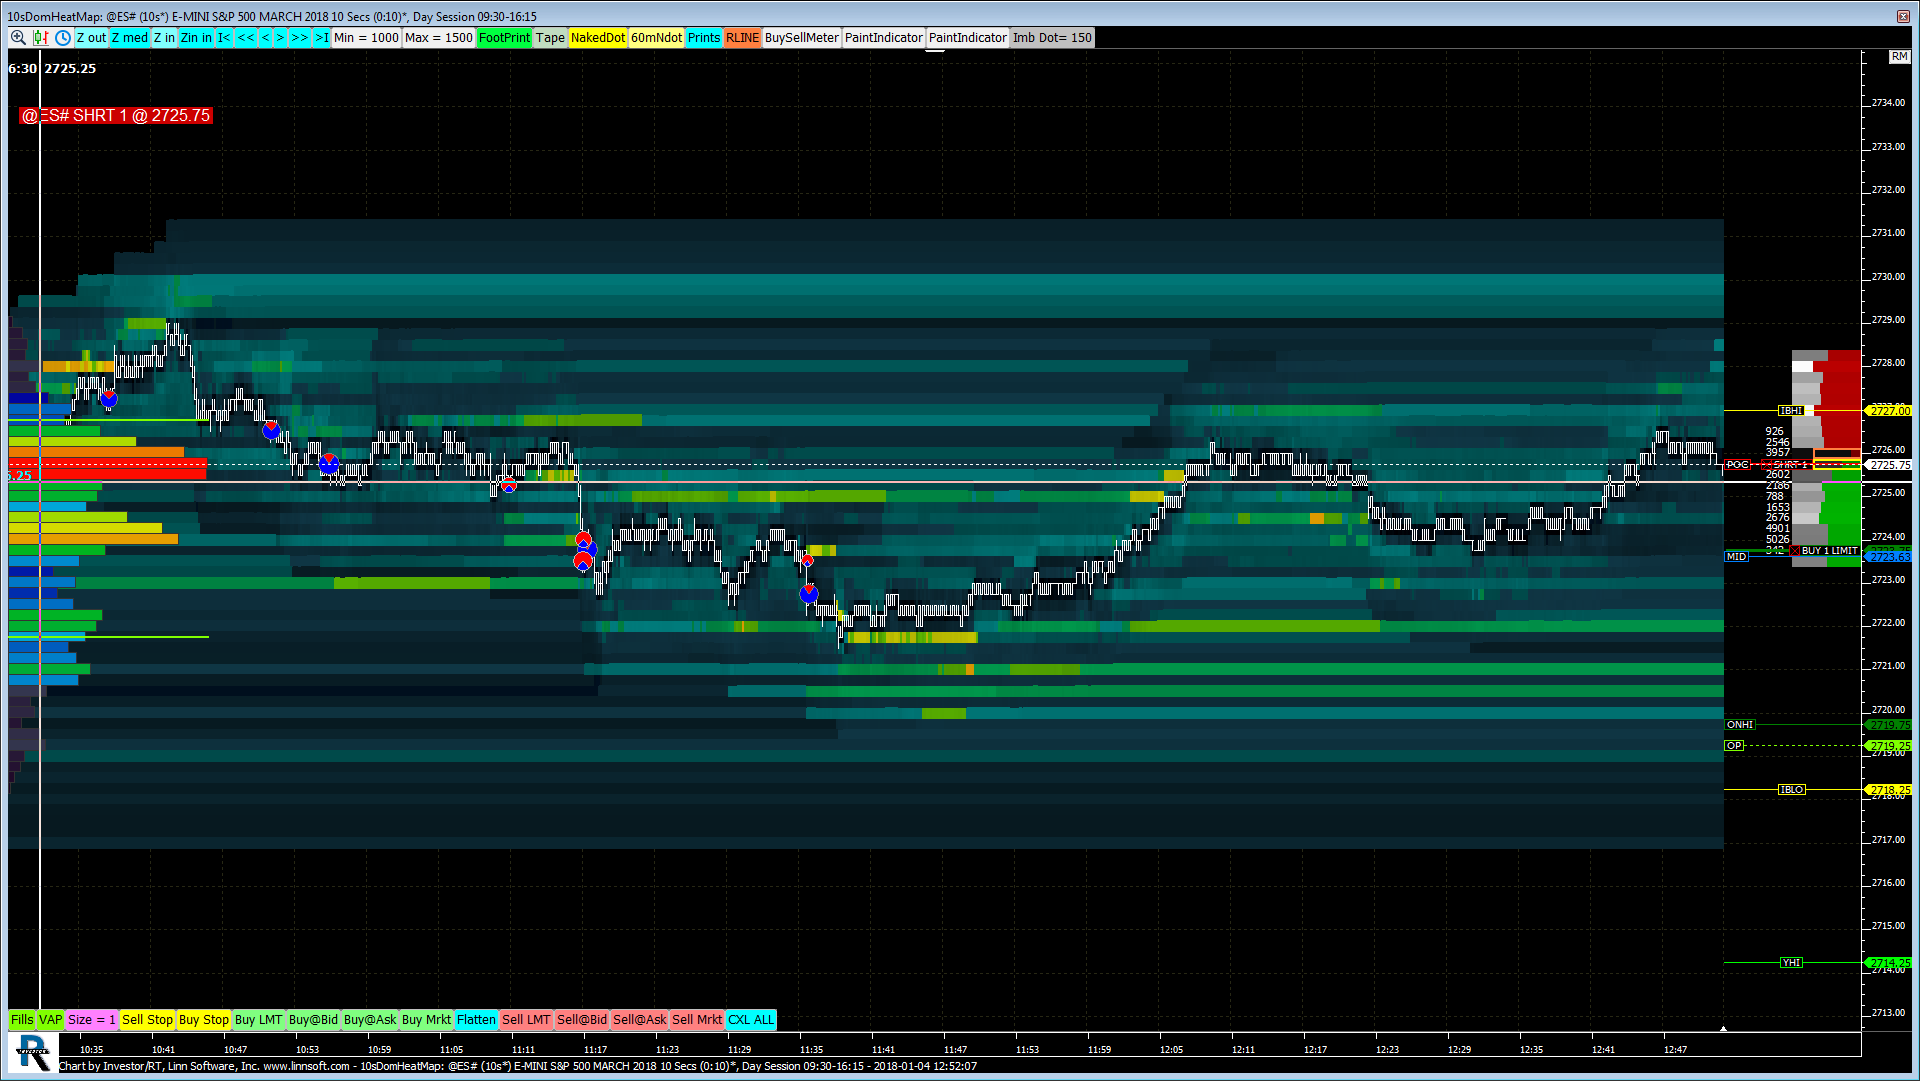
This chart was uploaded by Investor/RT 12.7.6 showing symbol: @ES#. |
View |
 |
CrudeMap10s (QCL#) jayski51369 [totalcount]
7 years 11 months ago
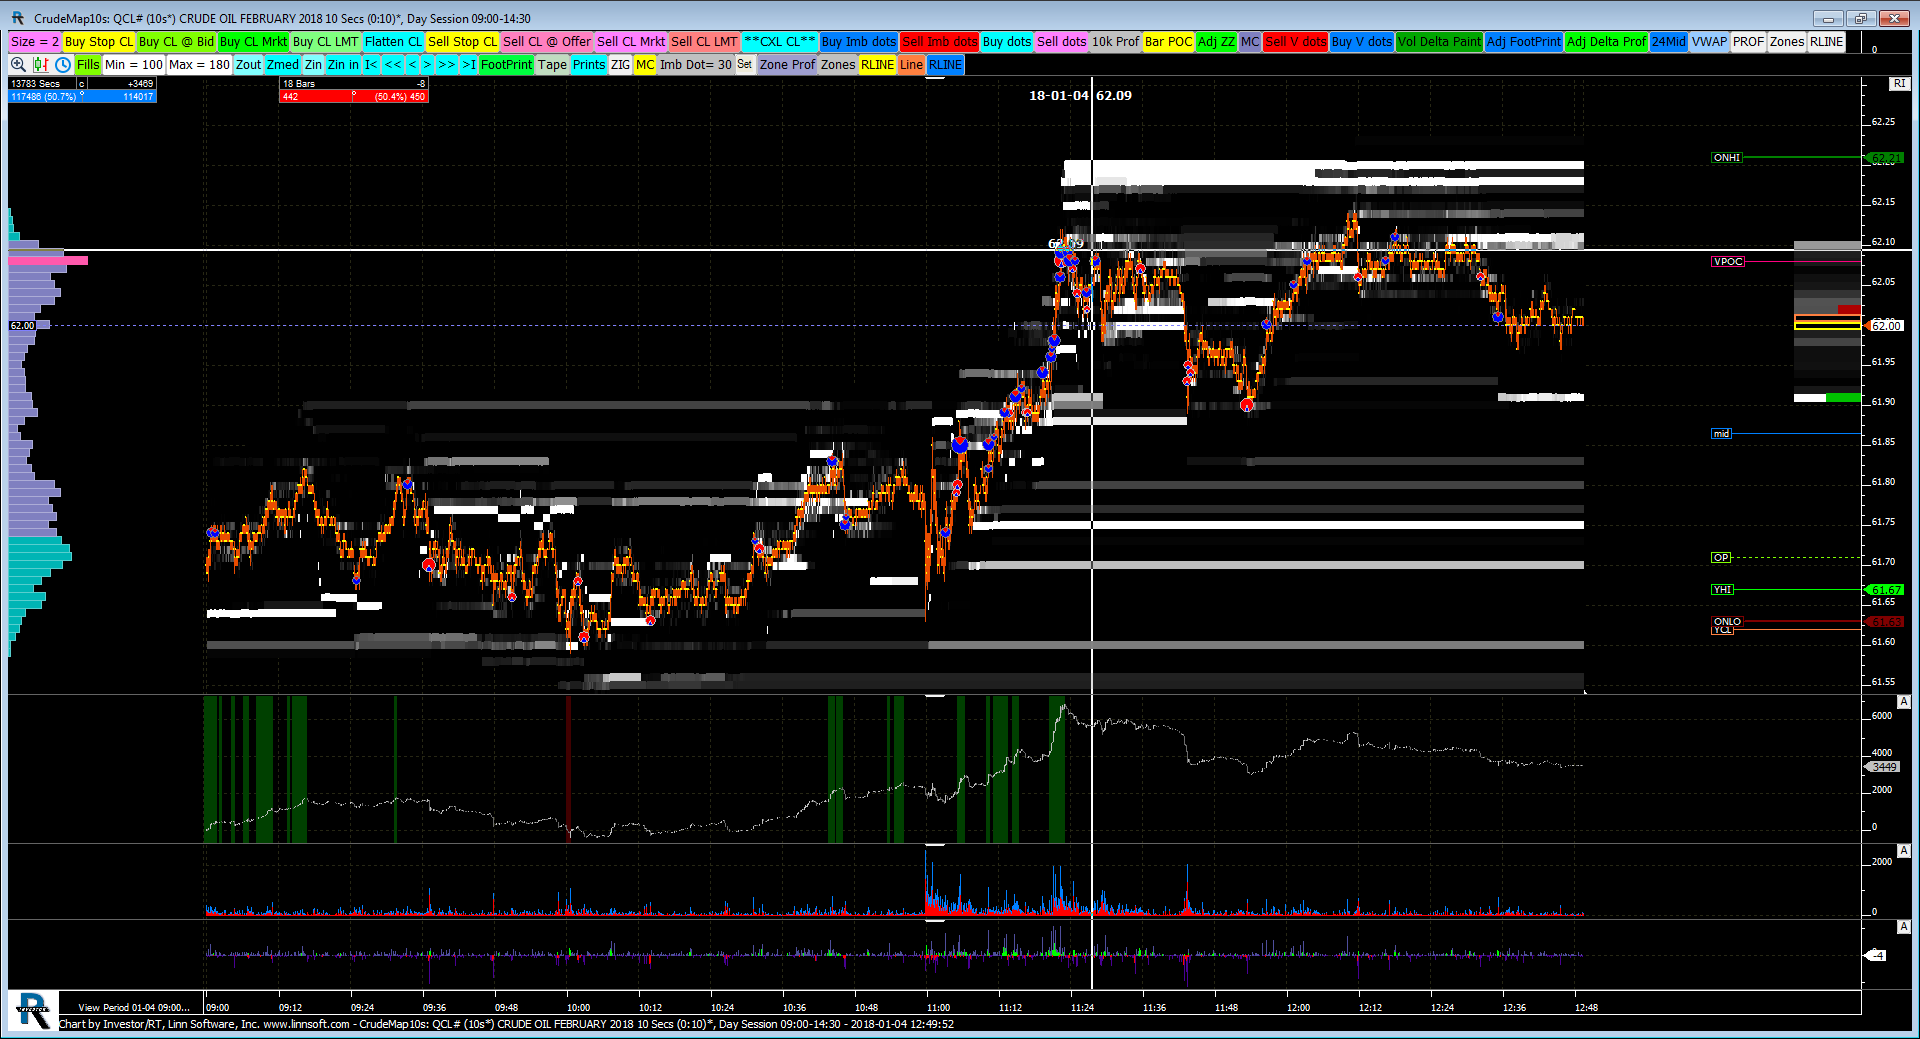
This chart was uploaded by Investor/RT 12.7.6 showing symbol: QCL#. |
View |
 |
Test Apple Chart (AAPL) scooke [totalcount]
7 years 11 months ago
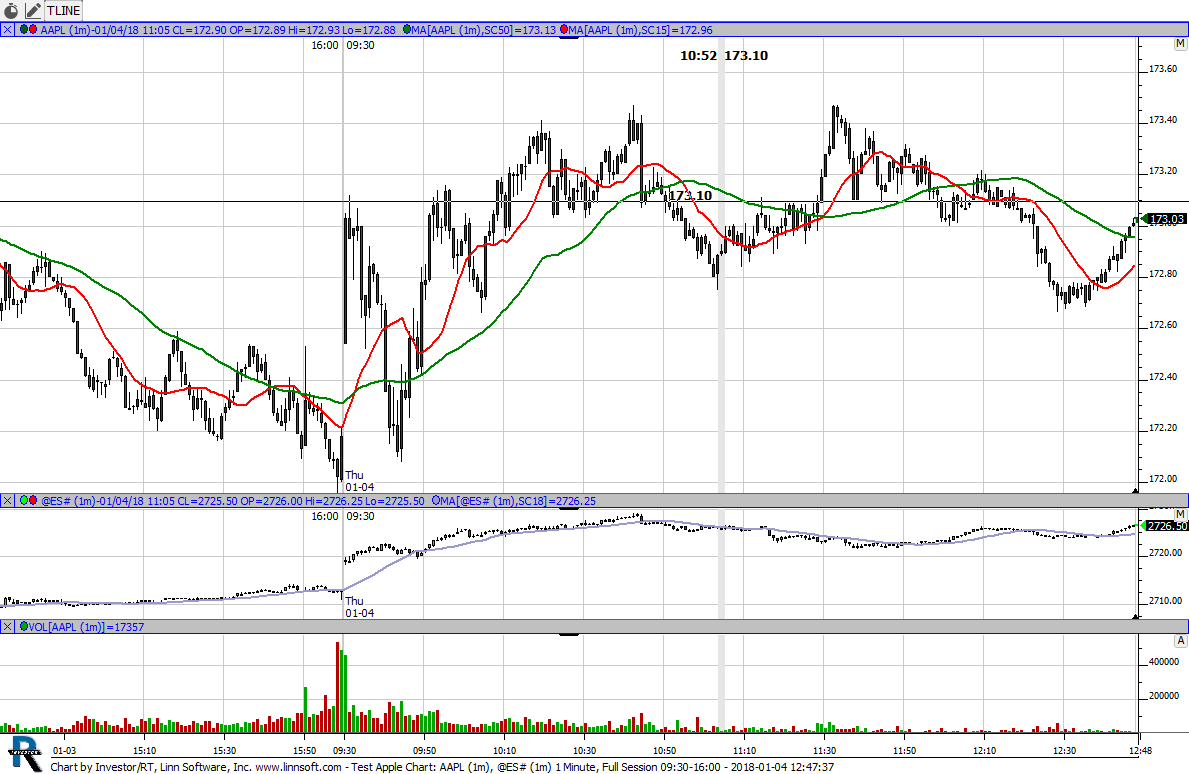
This chart was uploaded by Investor/RT 13.1.4 showing symbol: AAPL. |
View |
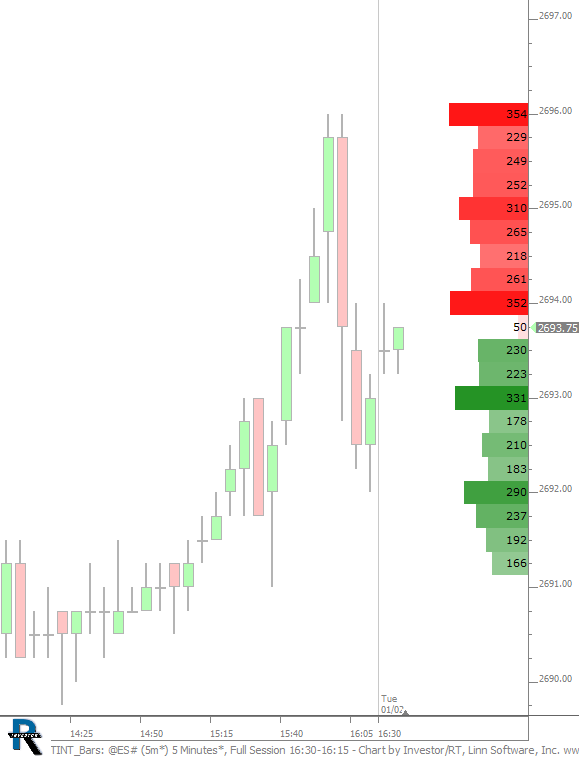 |
TINT Bars (@ES#) cpayne [totalcount]
7 years 11 months ago
Train of Intentions - Size Bars. This chart was uploaded by Investor/RT 13.1.4 showing symbol: @ES#. |
View |
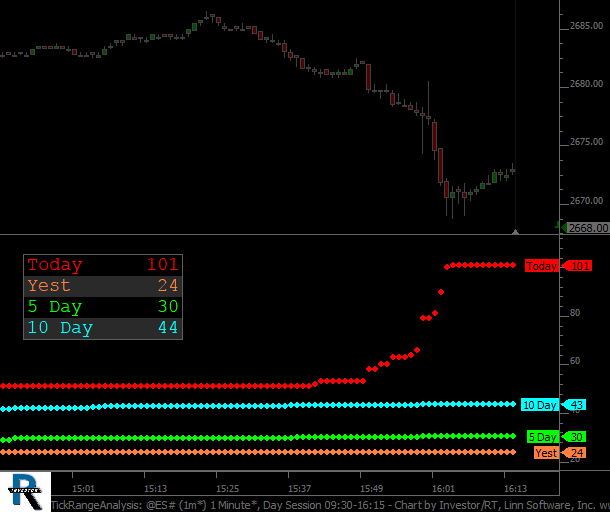 |
TickRangeAnalysis (@ES#) cpayne [totalcount]
7 years 11 months ago
Tick Range Analysis: Today vs Yesterday vs 5 Day Avg and 10 Day Avg (at time of day). This chart was uploaded by Investor/RT 13.1.4 showing symbol: @ES#. |
View |
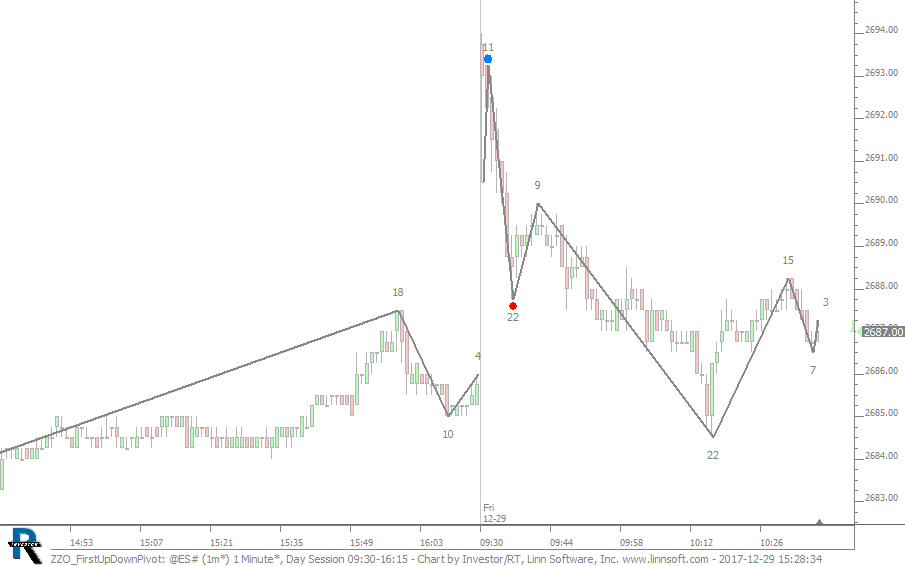 |
ZZO FirstUpDownPivot (@ES#) cpayne [totalcount]
7 years 11 months ago
Identify the 1st up and down pivot bars in session. This chart was uploaded by Investor/RT 13.1.4 showing symbol: @ES#. |
View |
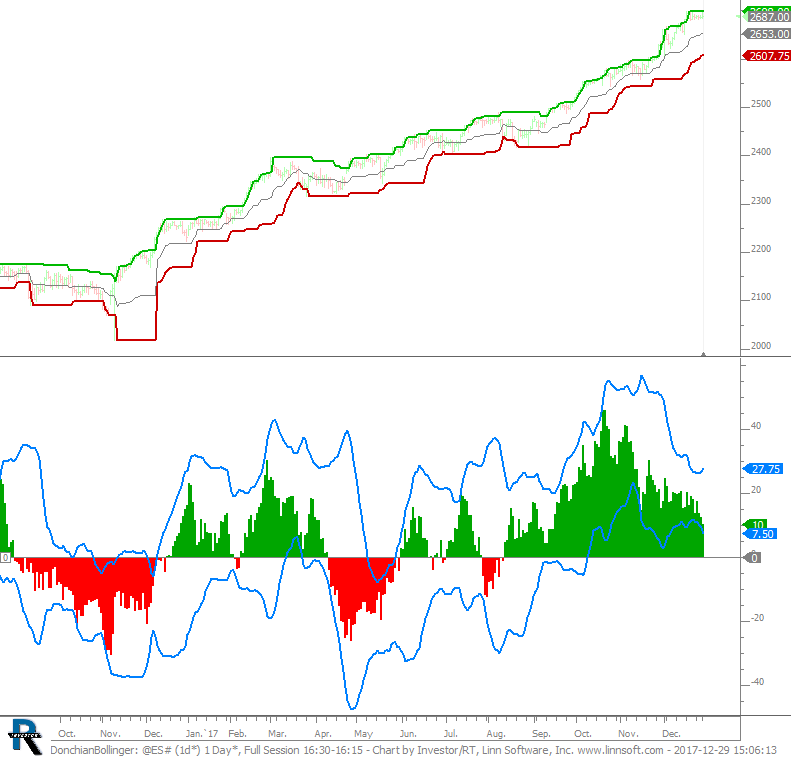 |
DonchianBollinger (@ES#) cpayne [totalcount]
7 years 11 months ago
Donchian Channel - Bollinger Bands on OBV. This chart was uploaded by Investor/RT 13.1.4 showing symbol: @ES#. |
View |
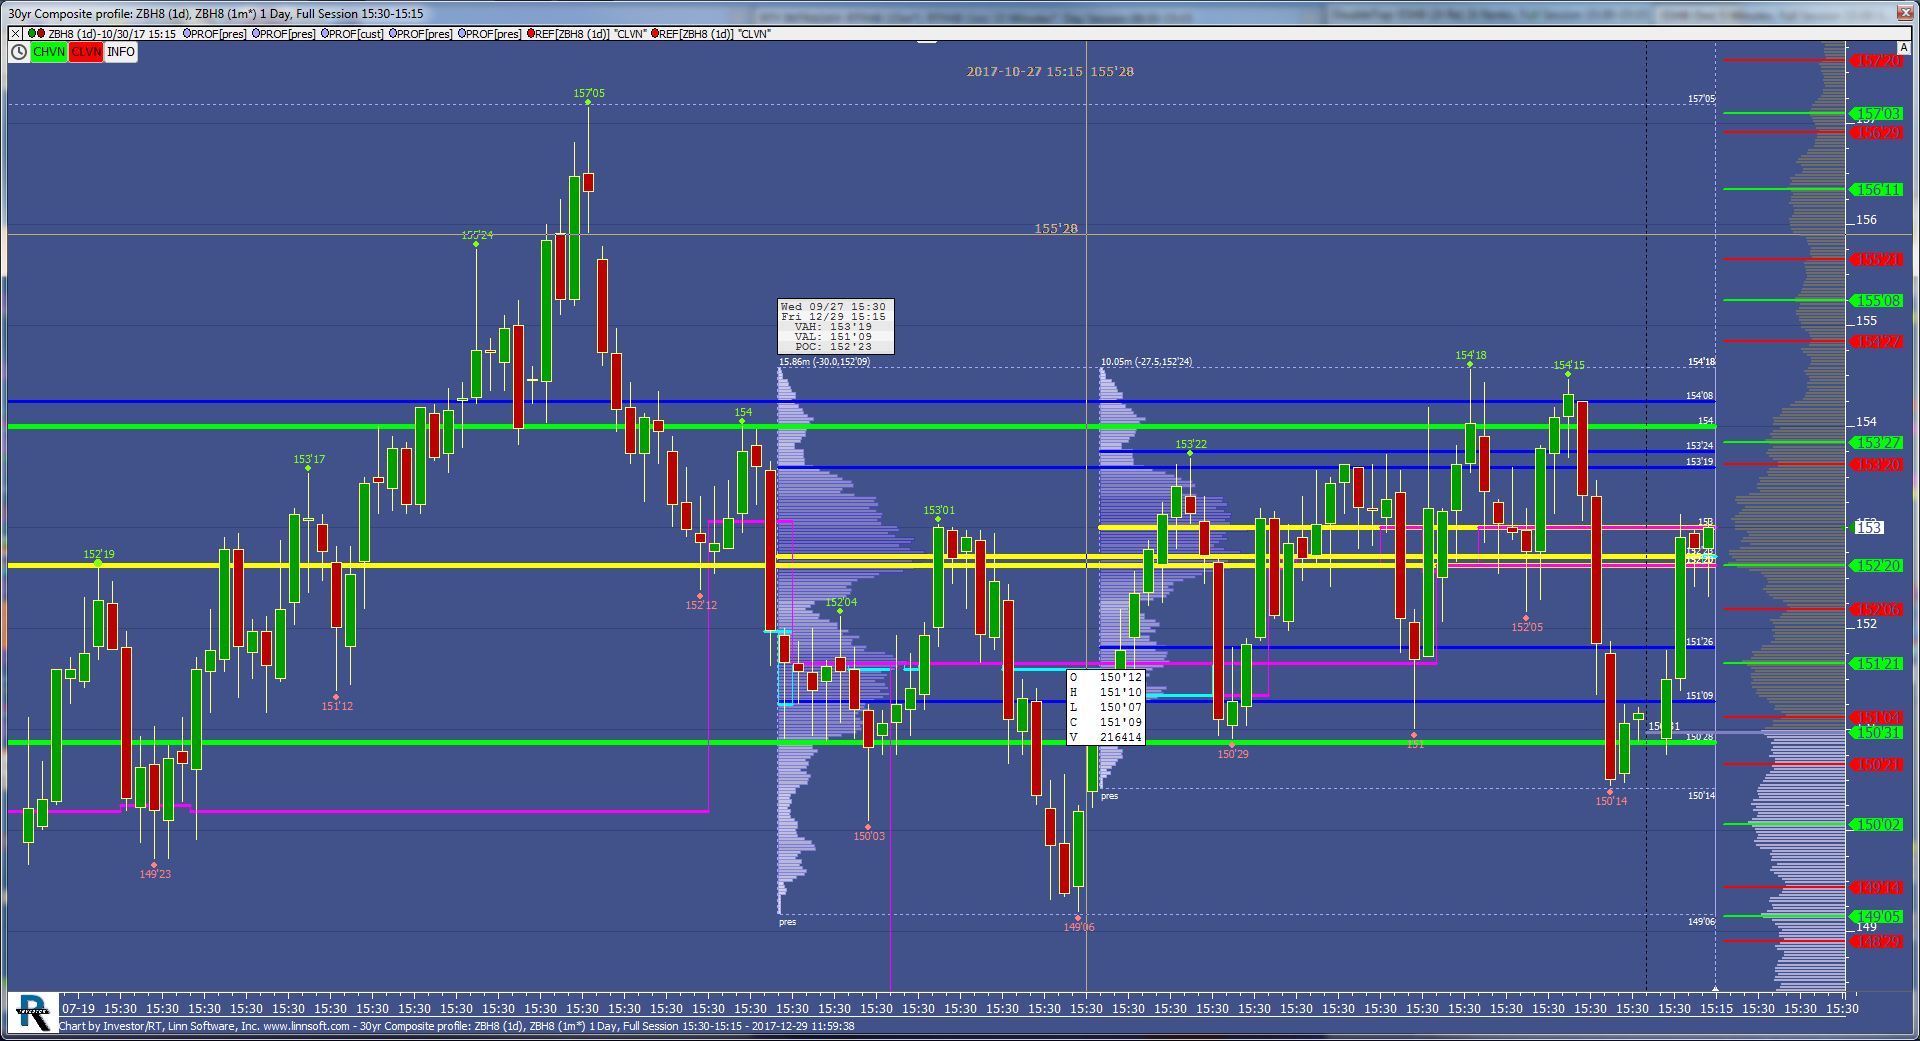 |
30yr Composite profile (ZBH8) scottz46 [totalcount]
7 years 11 months ago
This chart was uploaded by Investor/RT 13.1.4 showing symbol: ZBH8. |
View |
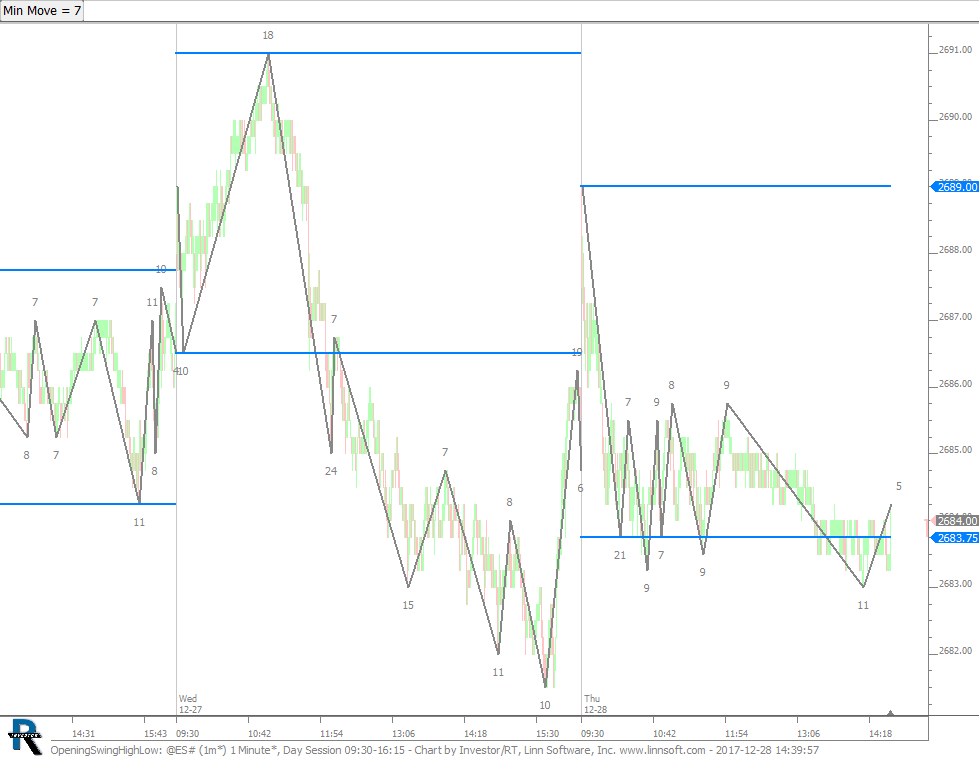 |
OpeningSwingHighLow (@ES#) cpayne [totalcount]
7 years 11 months ago
Opening Swing High and Low. This chart was uploaded by Investor/RT 13.1.4 showing symbol: @ES#. |
View |
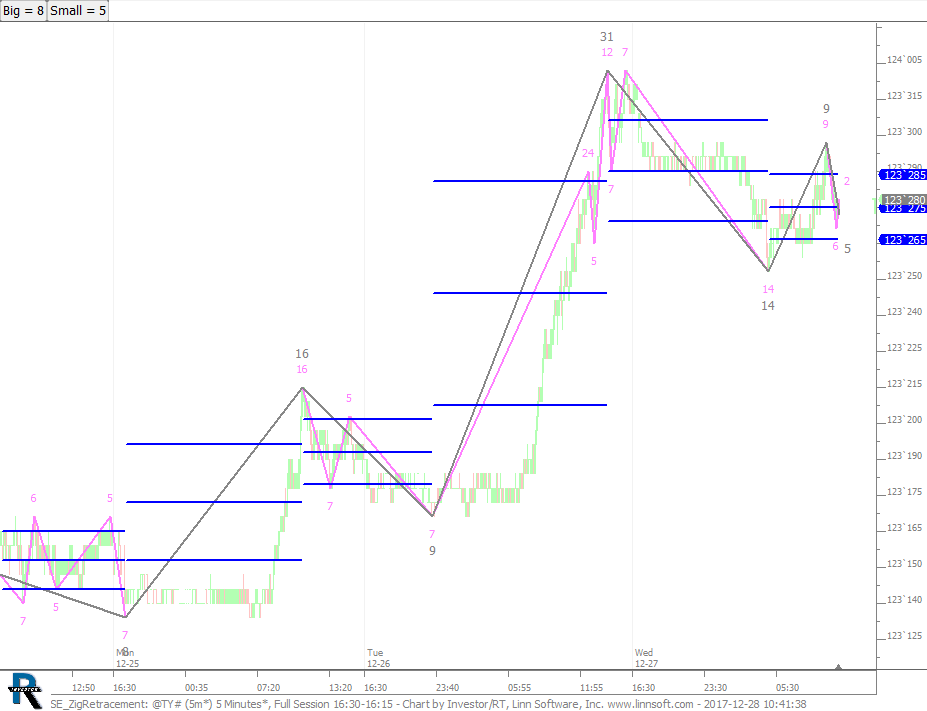 |
SE ZigRetracement (@TY#) cpayne [totalcount]
7 years 12 months ago
Zig Retracement - Big and Small Moves. This chart was uploaded by Investor/RT 13.1.4 showing symbol: @TY#. |
View |
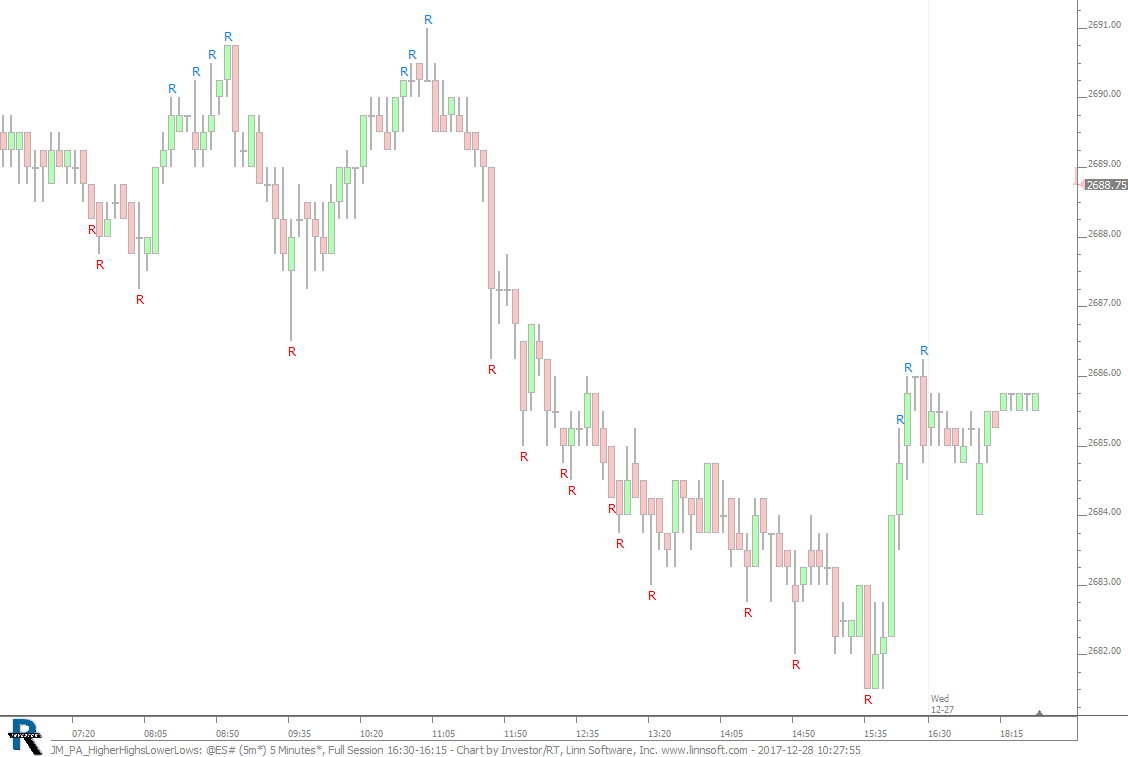 |
JM PA HigherHighsLowerLows (@ES#) cpayne [totalcount]
7 years 12 months ago
Higher Highs and Lower Lows (20 Bar). This chart was uploaded by Investor/RT 13.1.4 showing symbol: @ES#. |
View |
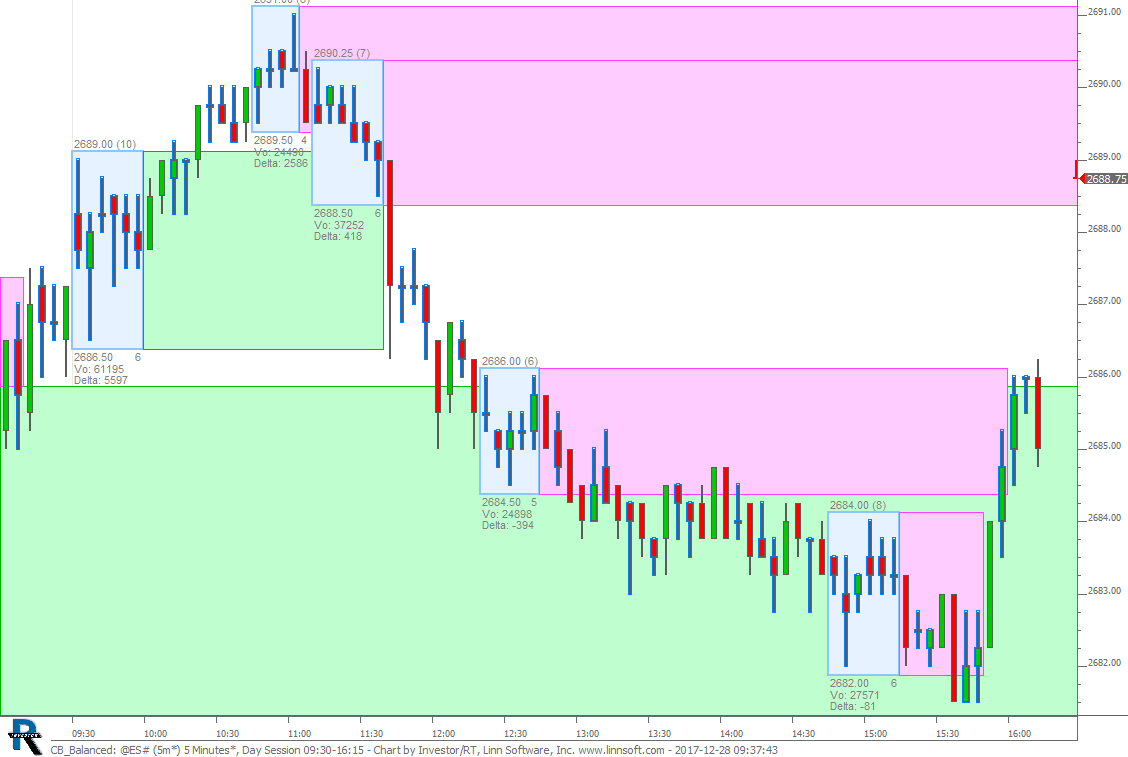 |
CB Balanced (@ES#) cpayne [totalcount]
7 years 12 months ago
Balanced Candles. This chart was uploaded by Investor/RT 13.1.4 showing symbol: @ES#. |
View |
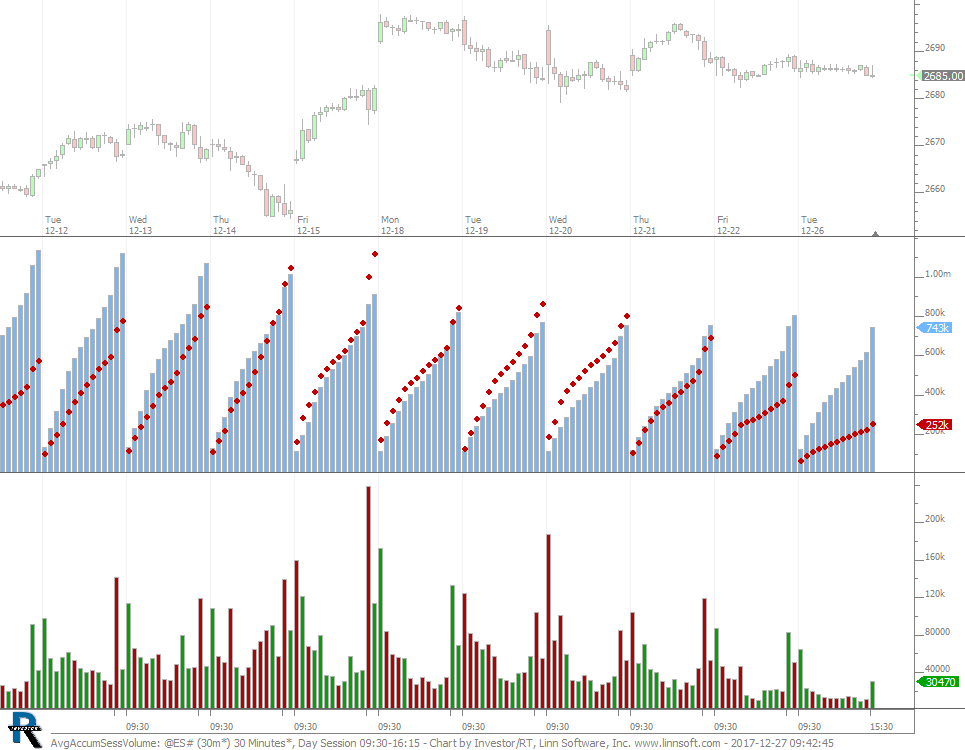 |
AvgAccumSessVolume (@ES#) cpayne [totalcount]
7 years 12 months ago
Average accumulated session volume. This chart was uploaded by Investor/RT 13.1.4 showing symbol: @ES#. |
View |
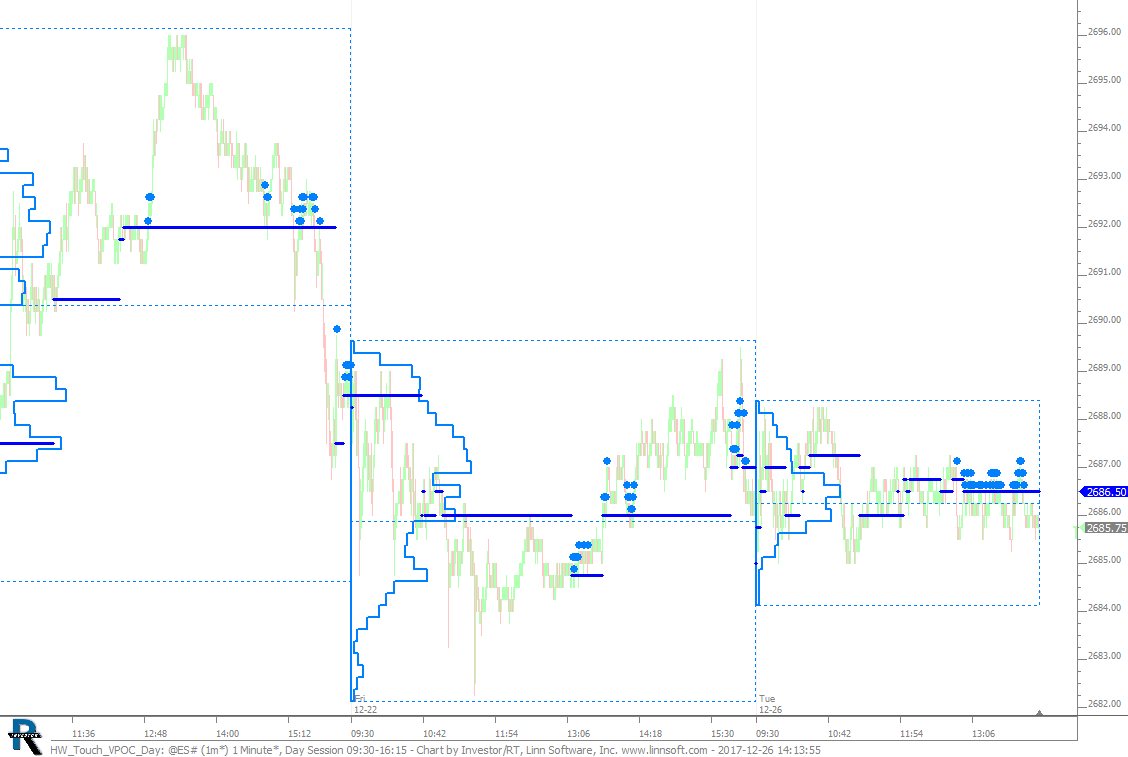 |
HW Touch VPOC Day (@ES#) cpayne [totalcount]
7 years 12 months ago
Touch VPOC after 200 Minutes. This chart was uploaded by Investor/RT 13.1.4 showing symbol: @ES#. |
View |
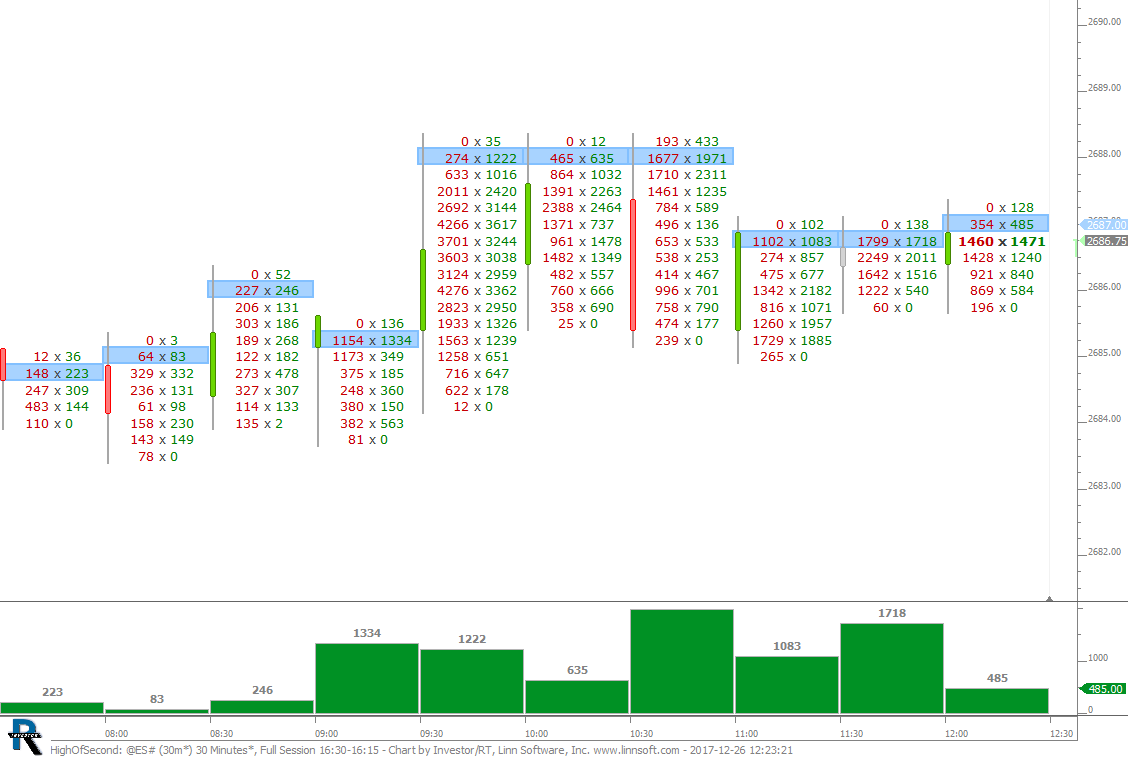 |
HighOfSecond (@ES#) cpayne [totalcount]
7 years 12 months ago
High Of Second Price. This chart was uploaded by Investor/RT 13.1.4 showing symbol: @ES#. |
View |
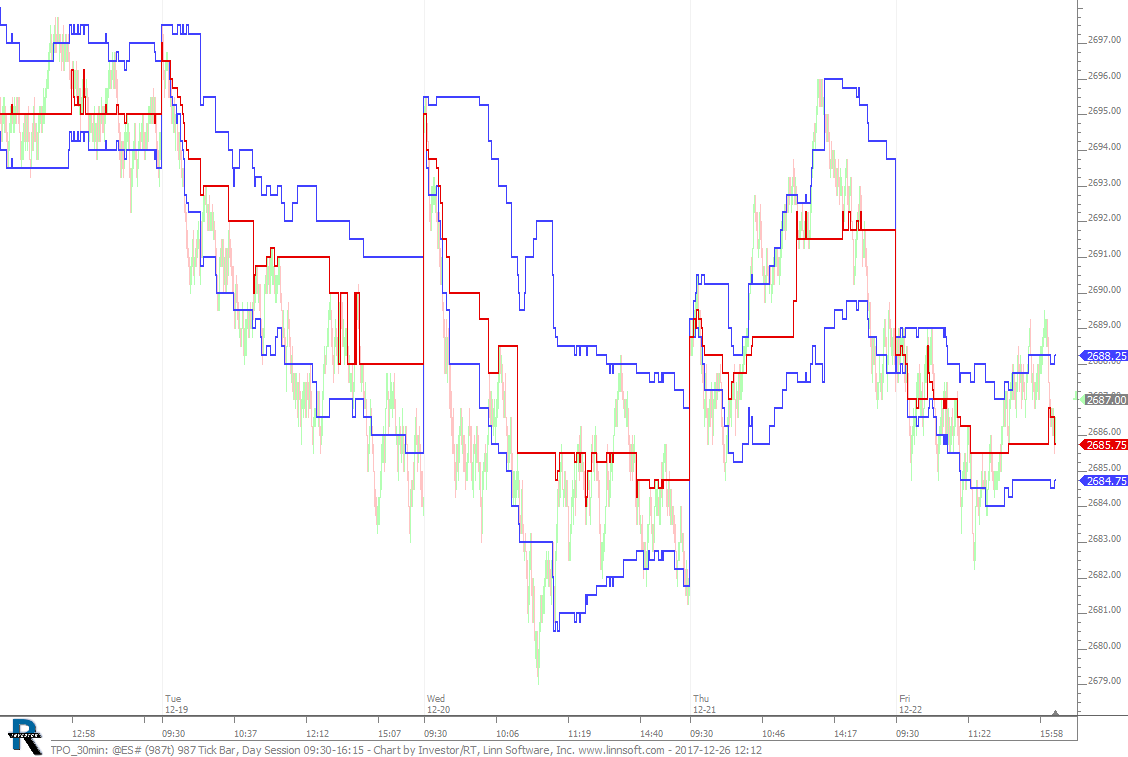 |
TPO 30min (@ES#) cpayne [totalcount]
7 years 12 months ago
TPO 30 minute on 987 tickbars. This chart was uploaded by Investor/RT 13.1.4 showing symbol: @ES#. |
View |
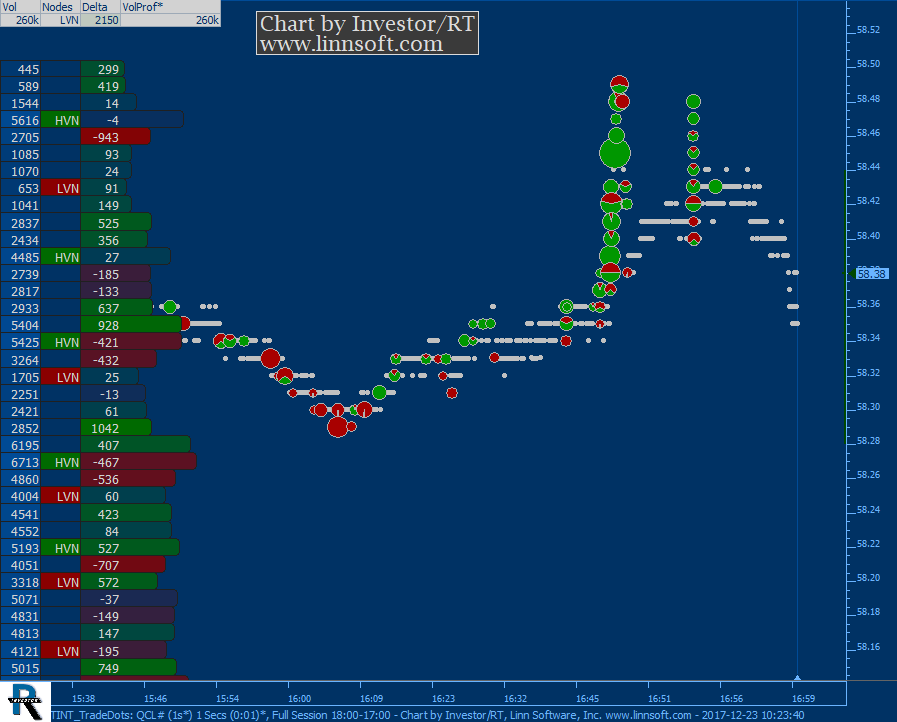 |
TINT TradeDots (QCL#) cpayne [totalcount]
8 years 2 hours ago
Trail of Intentions with Trade Dots. This chart was uploaded by Investor/RT 13.1.4 showing symbol: QCL#. |
View |
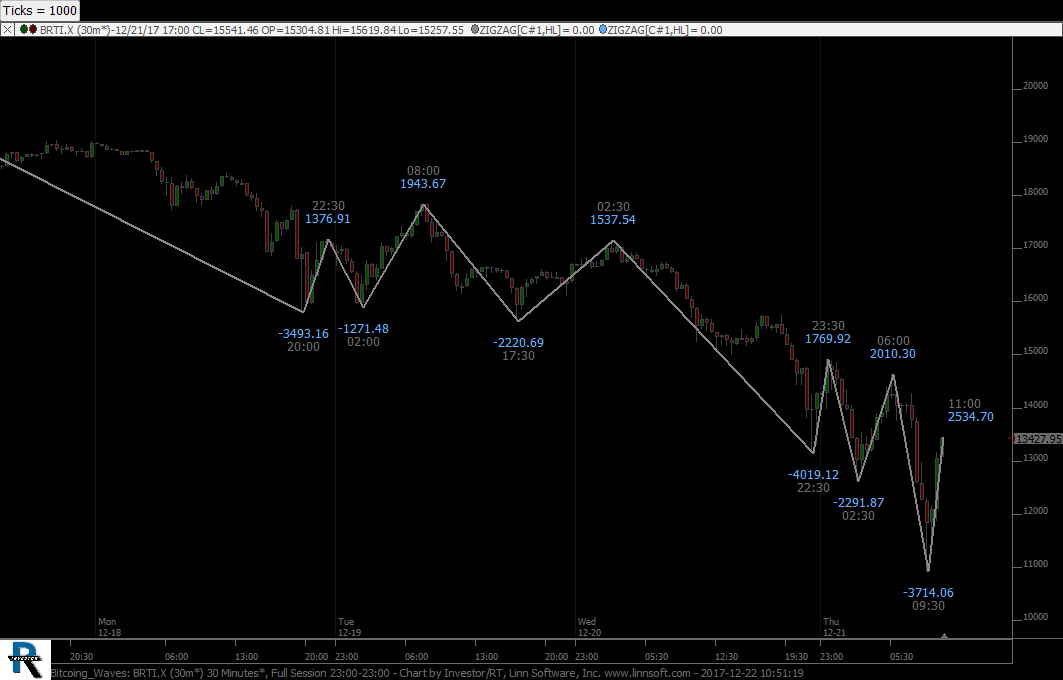 |
Bitcoing Waves (BRTI.X) cpayne [totalcount]
8 years 1 day ago
Bitcoin Waves. This chart was uploaded by Investor/RT 13.1.4 showing symbol: BRTI.X. |
View |
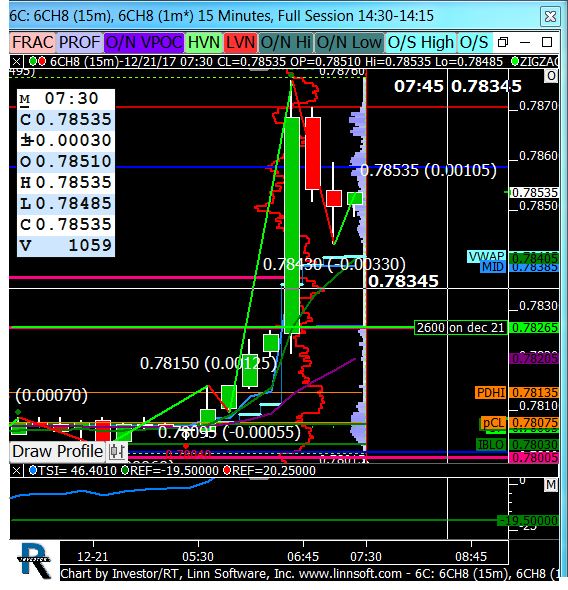 |
6C (6CH8) gurindergrewal99 [totalcount]
8 years 2 days ago
This chart was uploaded by Investor/RT 13.1.4 showing symbol: 6CH8. |
View |
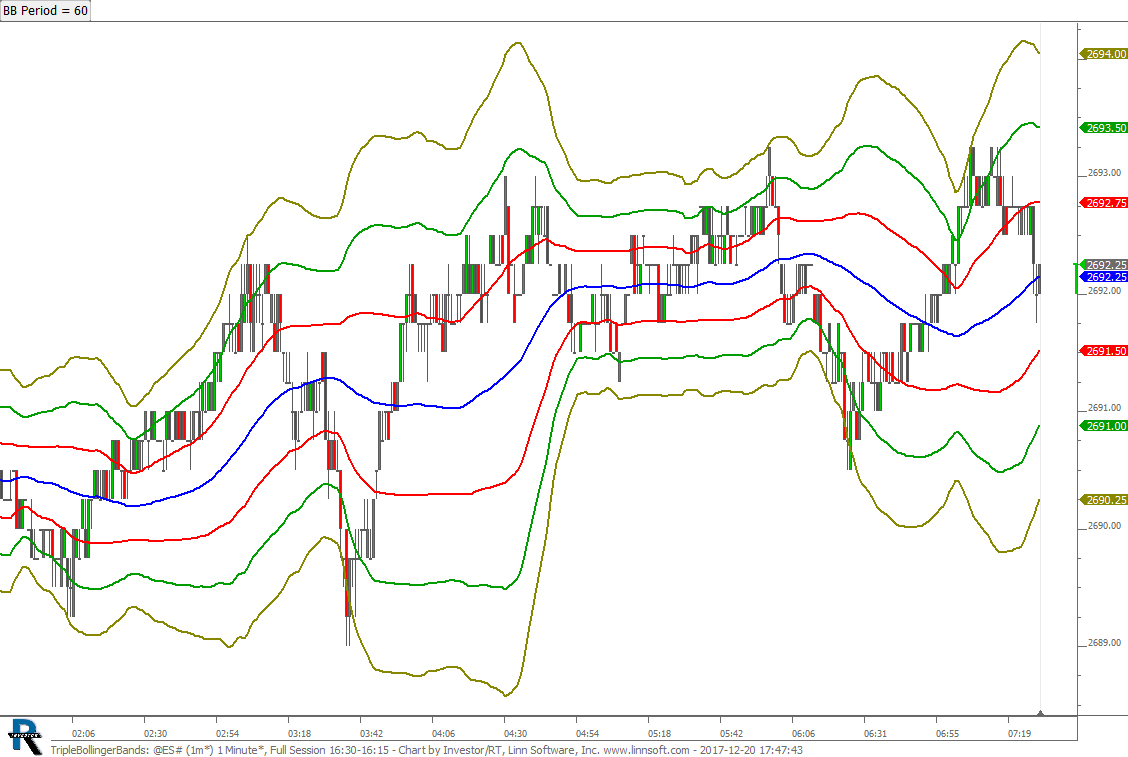 |
TripleBollingerBands (@ES#) cpayne [totalcount]
8 years 2 days ago
Triple Bollinger Bands. This chart was uploaded by Investor/RT 13.1.4 showing symbol: @ES#. |
View |