 |
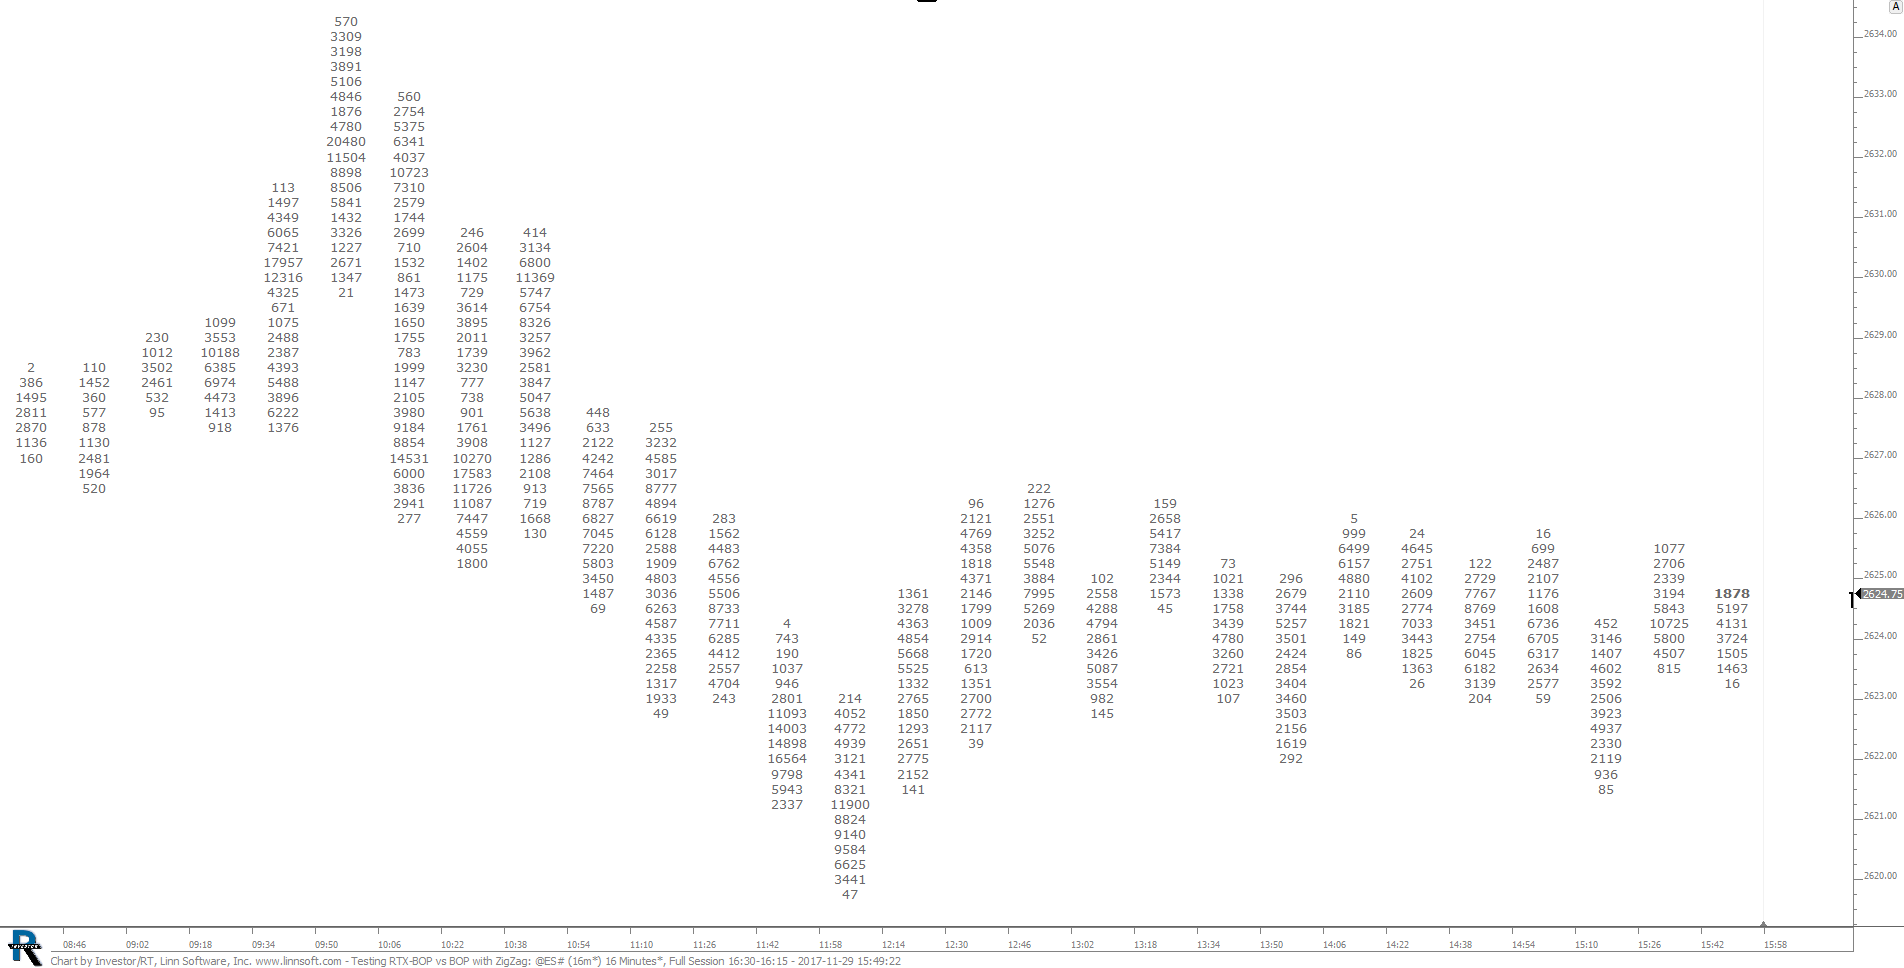
Testing RTX BOP vs BOP with Zig (@ES#) scooke [totalcount]
8 years 3 weeks ago
This chart was uploaded by Investor/RT 13.1.1 showing symbol: @ES#. |
View |
 |
Testing RTX BOP vs BOP with Zig (BD#) WAYNE CHANDLER [totalcount]
8 years 3 weeks ago
Hi Shawn, here is the chart definition with BOP added. If you test the two BOPs' independently, ZigZag seems to work best with the RTX-BOP version, as you can see from the chart. |
View |
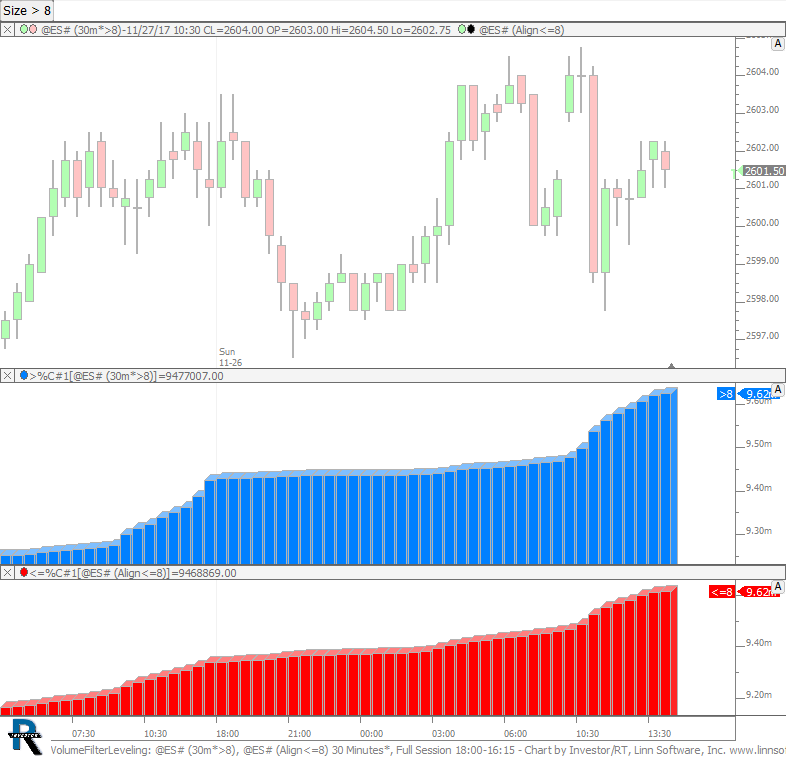 |
VolumeFilterLeveling (@ES#) cpayne [totalcount]
8 years 3 weeks ago
Volume Size Selection for Equal Distribution of Volume. This chart was uploaded by Investor/RT 13.1.1 showing symbol: @ES#. |
View |
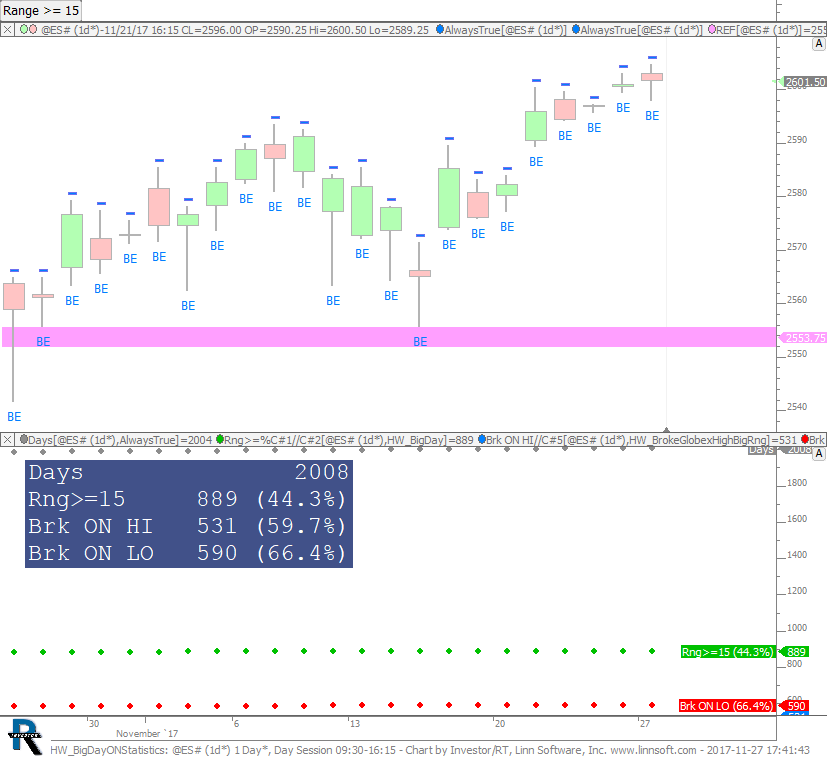 |
HW BigDayONStatistics (@ES#) cpayne [totalcount]
8 years 3 weeks ago
Big Range Days, and What Percent Brk Overnight High and Low. This chart was uploaded by Investor/RT 13.1.1 showing symbol: @ES#. |
View |
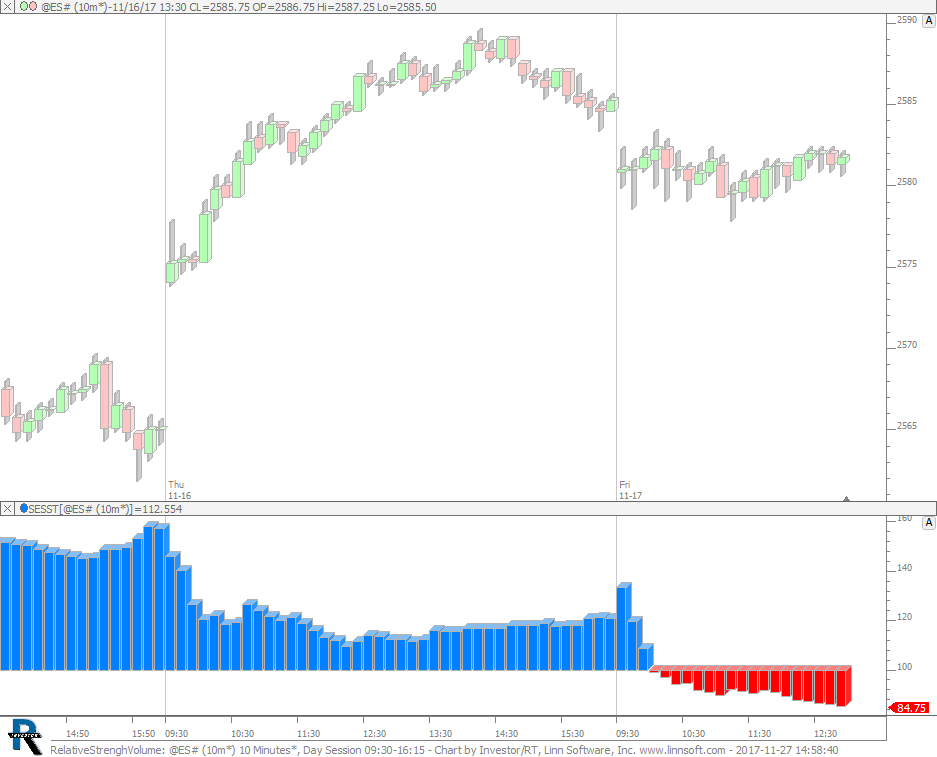 |
RelativeStrenghVolume (@ES#) cpayne [totalcount]
8 years 3 weeks ago
Relative Strengh - Volume. This chart was uploaded by Investor/RT 13.1.1 showing symbol: @ES#. |
View |
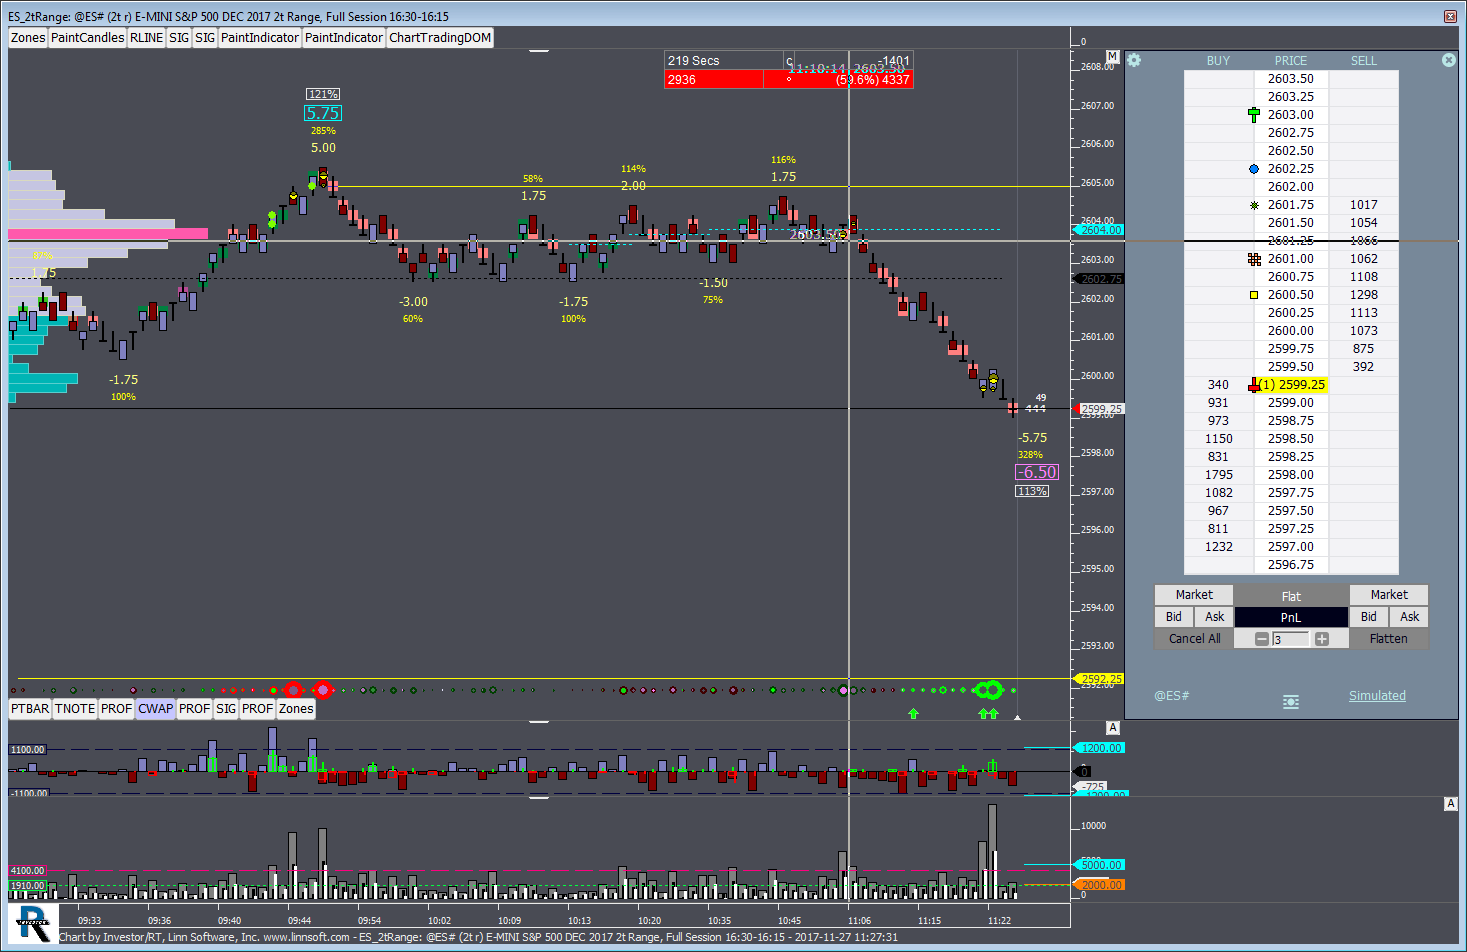 |
ES 2tRange (@ES#) jayski51369 [totalcount]
8 years 3 weeks ago
This chart was uploaded by Investor/RT 13.1.1 showing symbol: @ES#. |
View |
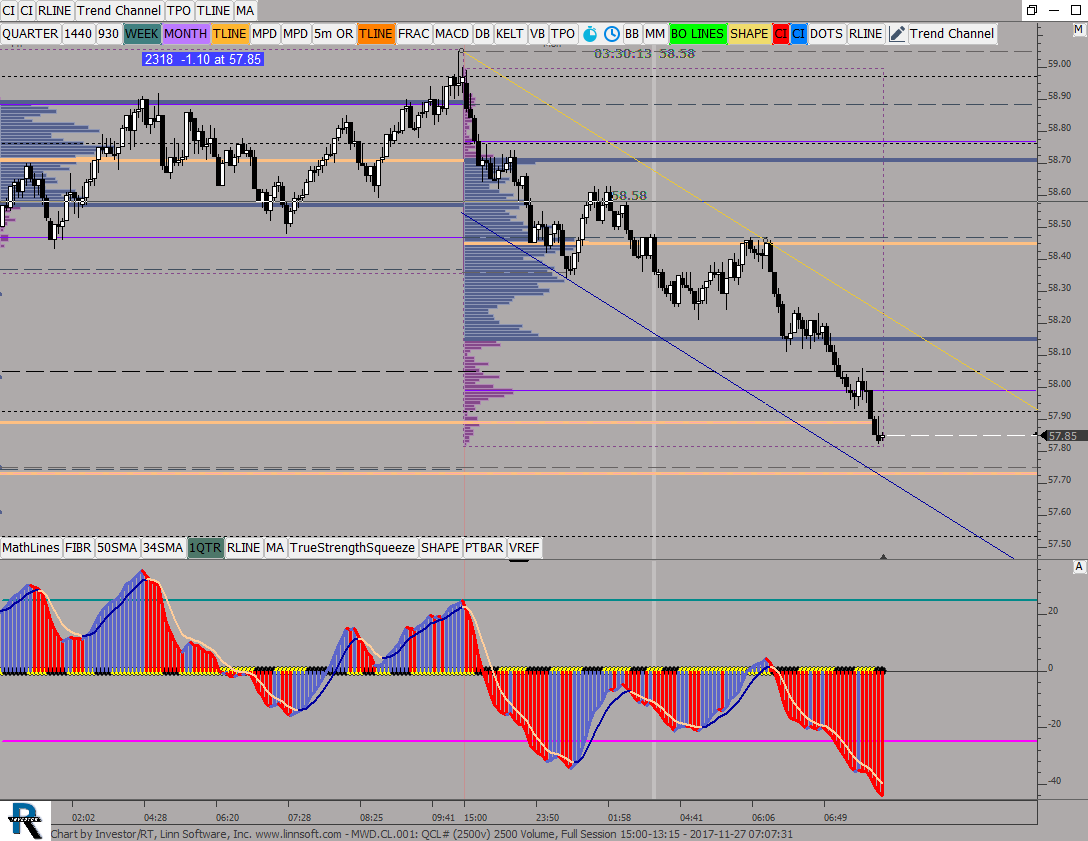 |
MWDCL001 (QCL#) ES42 [totalcount]
8 years 3 weeks ago
This chart was uploaded by Investor/RT 12.7.6 showing symbol: QCL#. |
View |
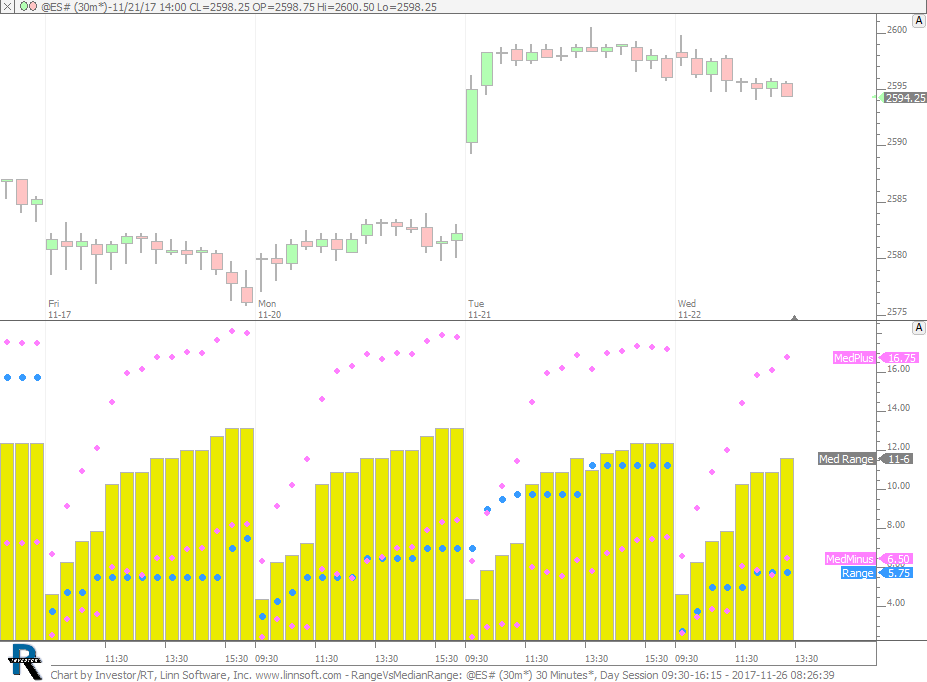 |
RangeVsMedianRange (@ES#) cpayne [totalcount]
8 years 3 weeks ago
Range Vs Median Range. This chart was uploaded by Investor/RT 13.1.1 showing symbol: @ES#. |
View |
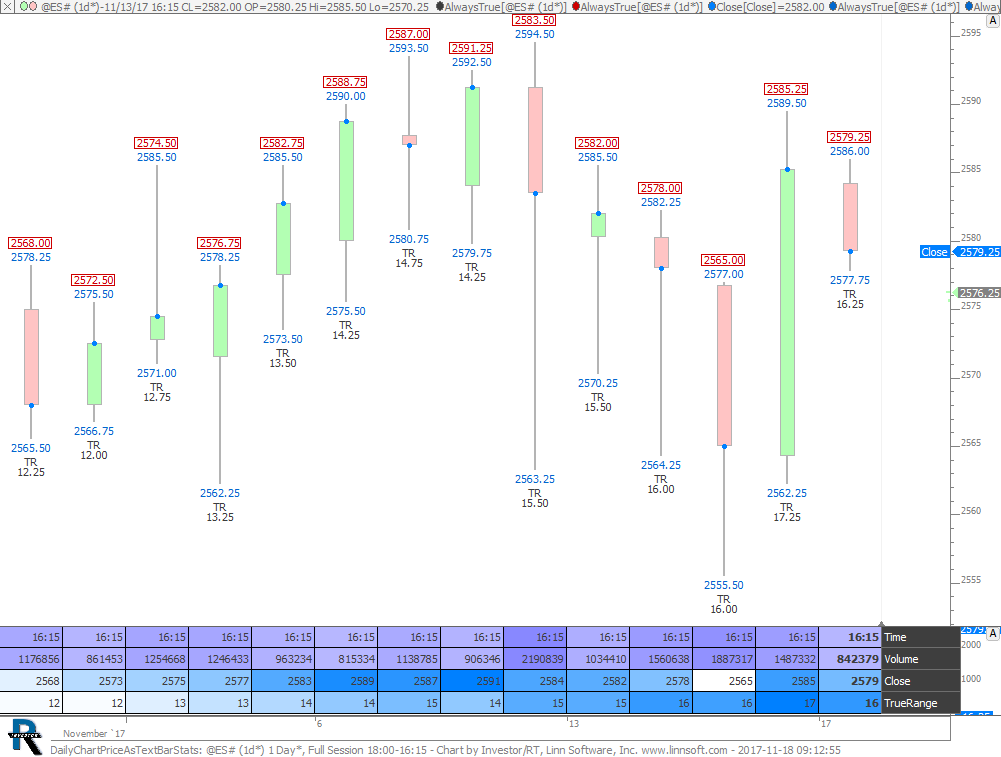 |
DailyChartPriceAsTextBarStats (@ES#) cpayne [totalcount]
8 years 1 month ago
Daily Chart with Prices as Text using Bar Statistics. This chart was uploaded by Investor/RT 13.1.1 showing symbol: @ES#. |
View |
 |
DailyChartPriceAsText (@ES#) cpayne [totalcount]
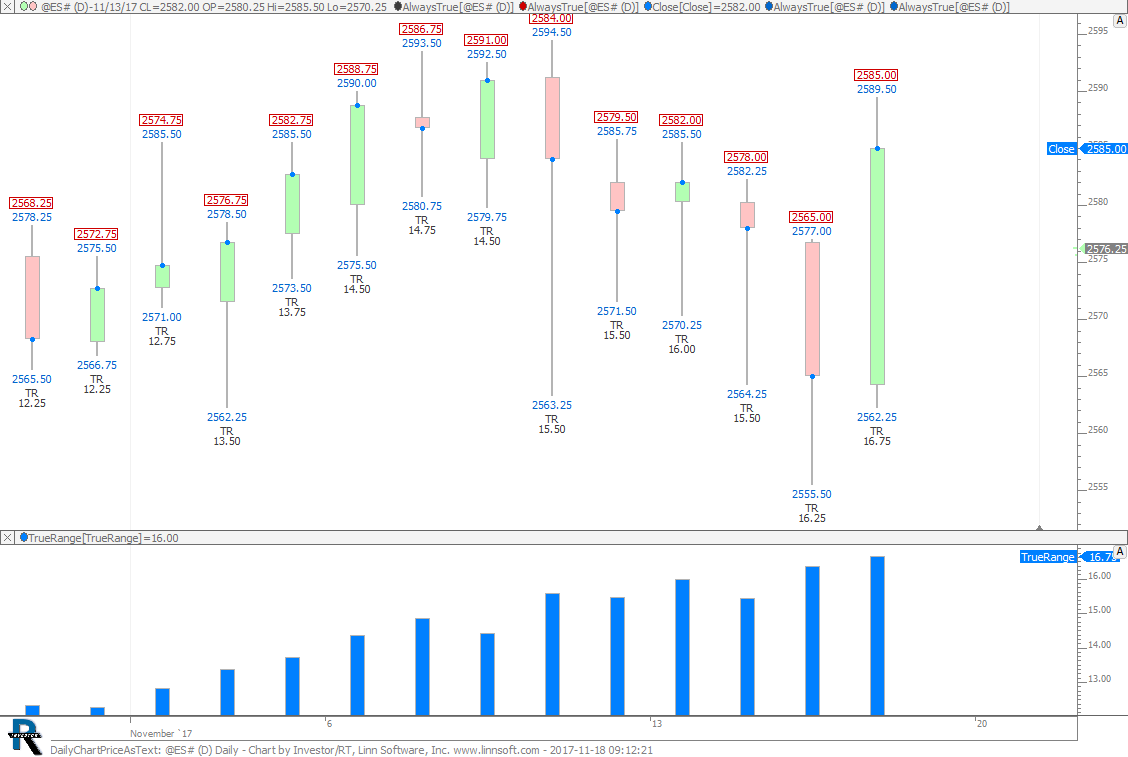
8 years 1 month ago
Daily Chart with Prices as Text. This chart was uploaded by Investor/RT 13.1.1 showing symbol: @ES#. |
View |
 |
PaintIndicatorTest (@ES#) cpayne [totalcount]
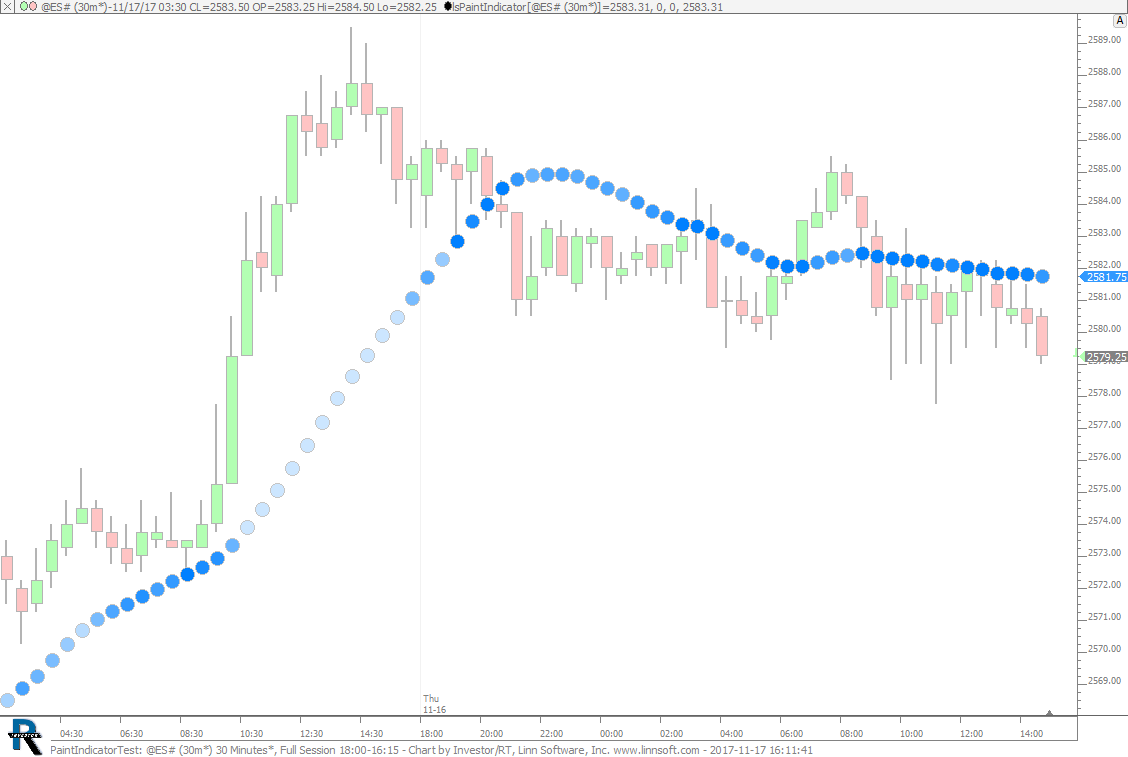
8 years 1 month ago
Paint Indicator Test - Painted MA based on how close it is to bars. This chart was uploaded by Investor/RT 13.1.1 showing symbol: @ES#. |
View |
 |
ProfilesProportional (@ES#) cpayne [totalcount]
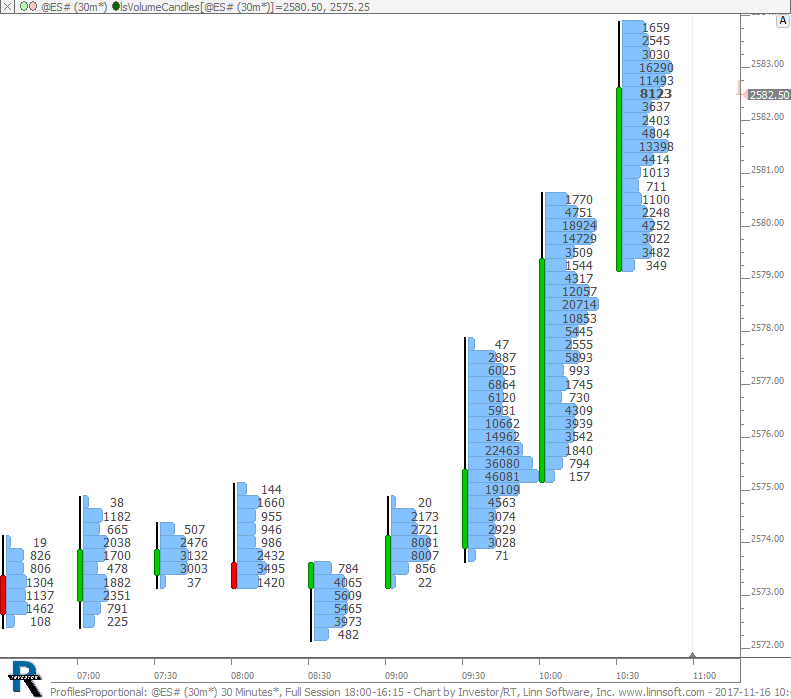
8 years 1 month ago
Proportional Bar Profiles. This chart was uploaded by Investor/RT 13.1.1 showing symbol: @ES#. |
View |
 |
ZigZagConfirmedPrice (@ES#) cpayne [totalcount]
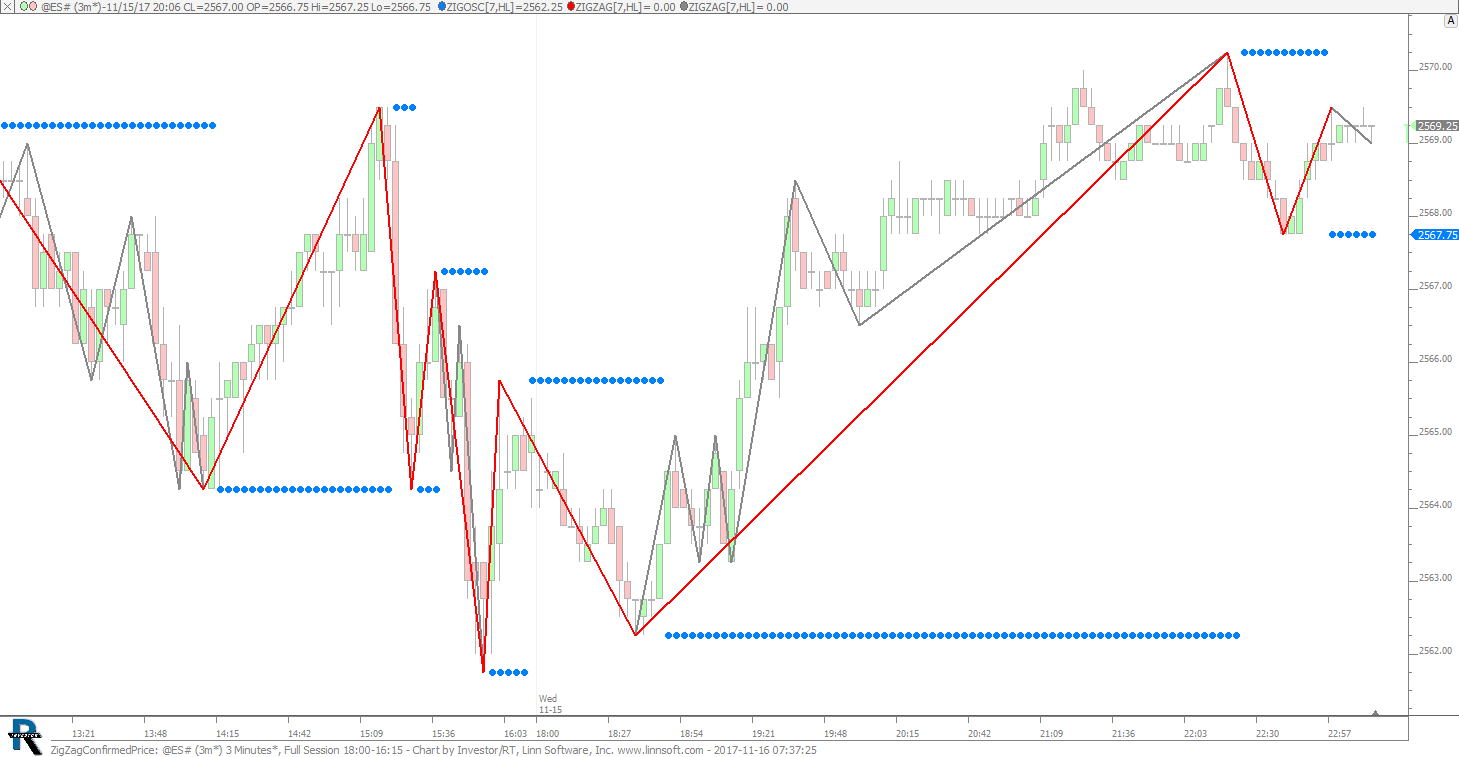
8 years 1 month ago
This chart was uploaded by Investor/RT 13.1.1 showing symbol: @ES#. |
View |
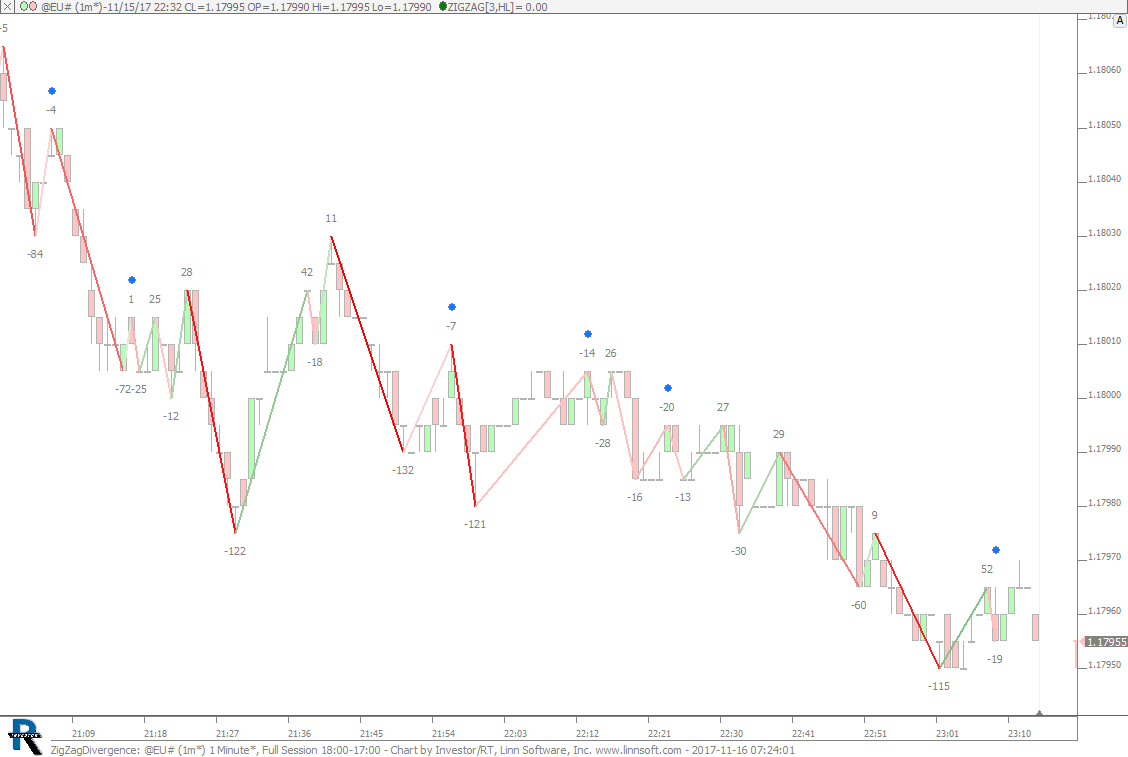 |
ZigZagDivergence (@EU#) cpayne [totalcount]
8 years 1 month ago
Zig Zag Divergence. This chart was uploaded by Investor/RT 13.1.1 showing symbol: @EU#. |
View |
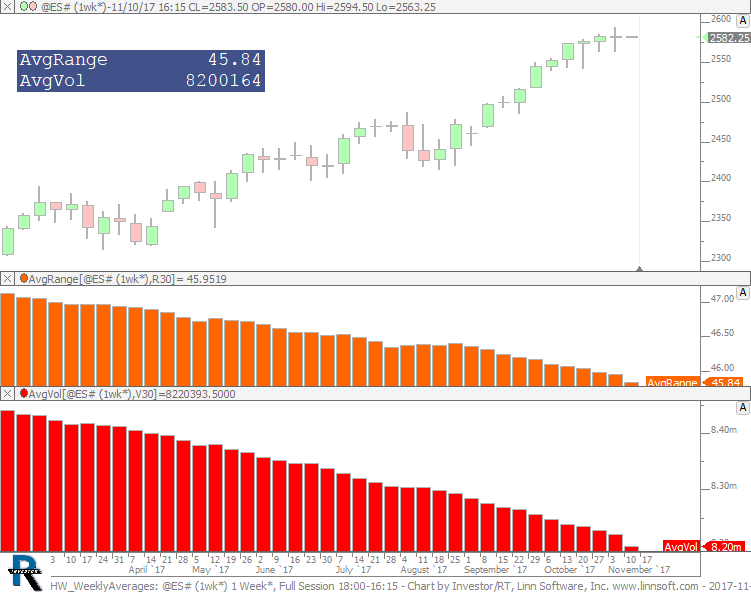 |
HW WeeklyAverages (@ES#) cpayne [totalcount]
8 years 1 month ago
Weekly Averages. This chart was uploaded by Investor/RT 13.1.1 showing symbol: @ES#. |
View |
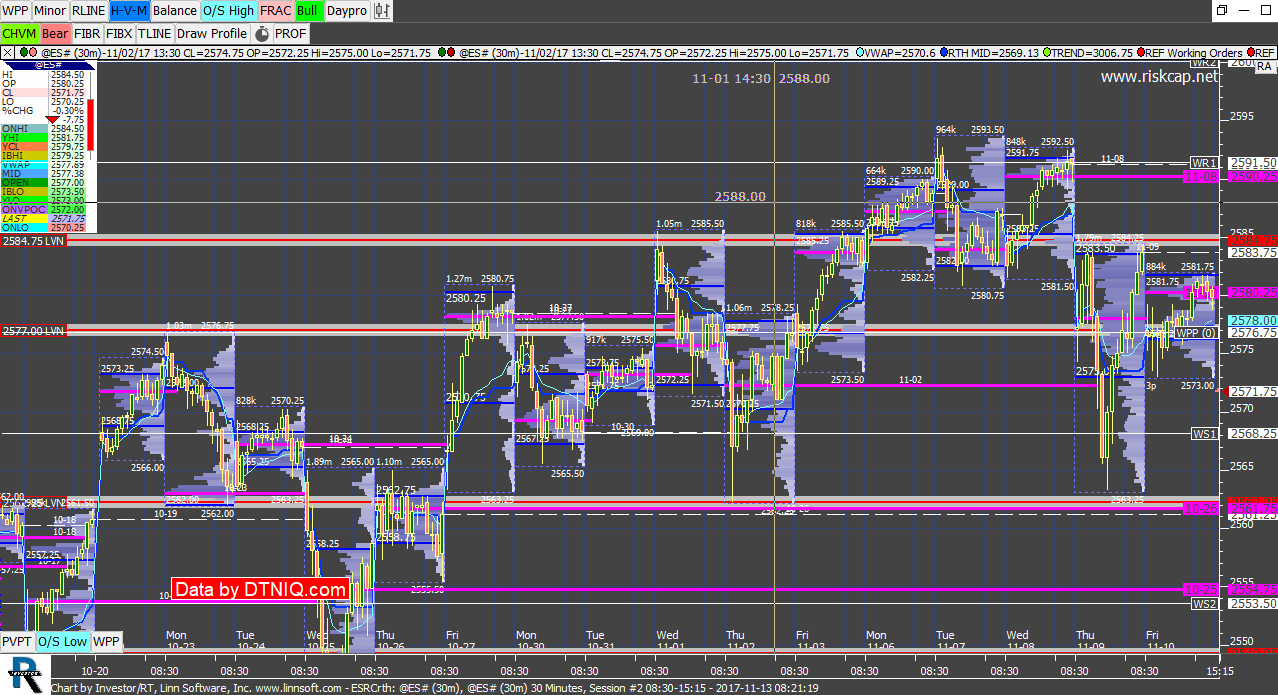 |
ESRCrth (@ES#) riskcap [totalcount]
8 years 1 month ago
ES_F emini levels of support/resistance. This chart was uploaded by Investor/RT 12.7.6 showing symbol: @ES#. |
View |
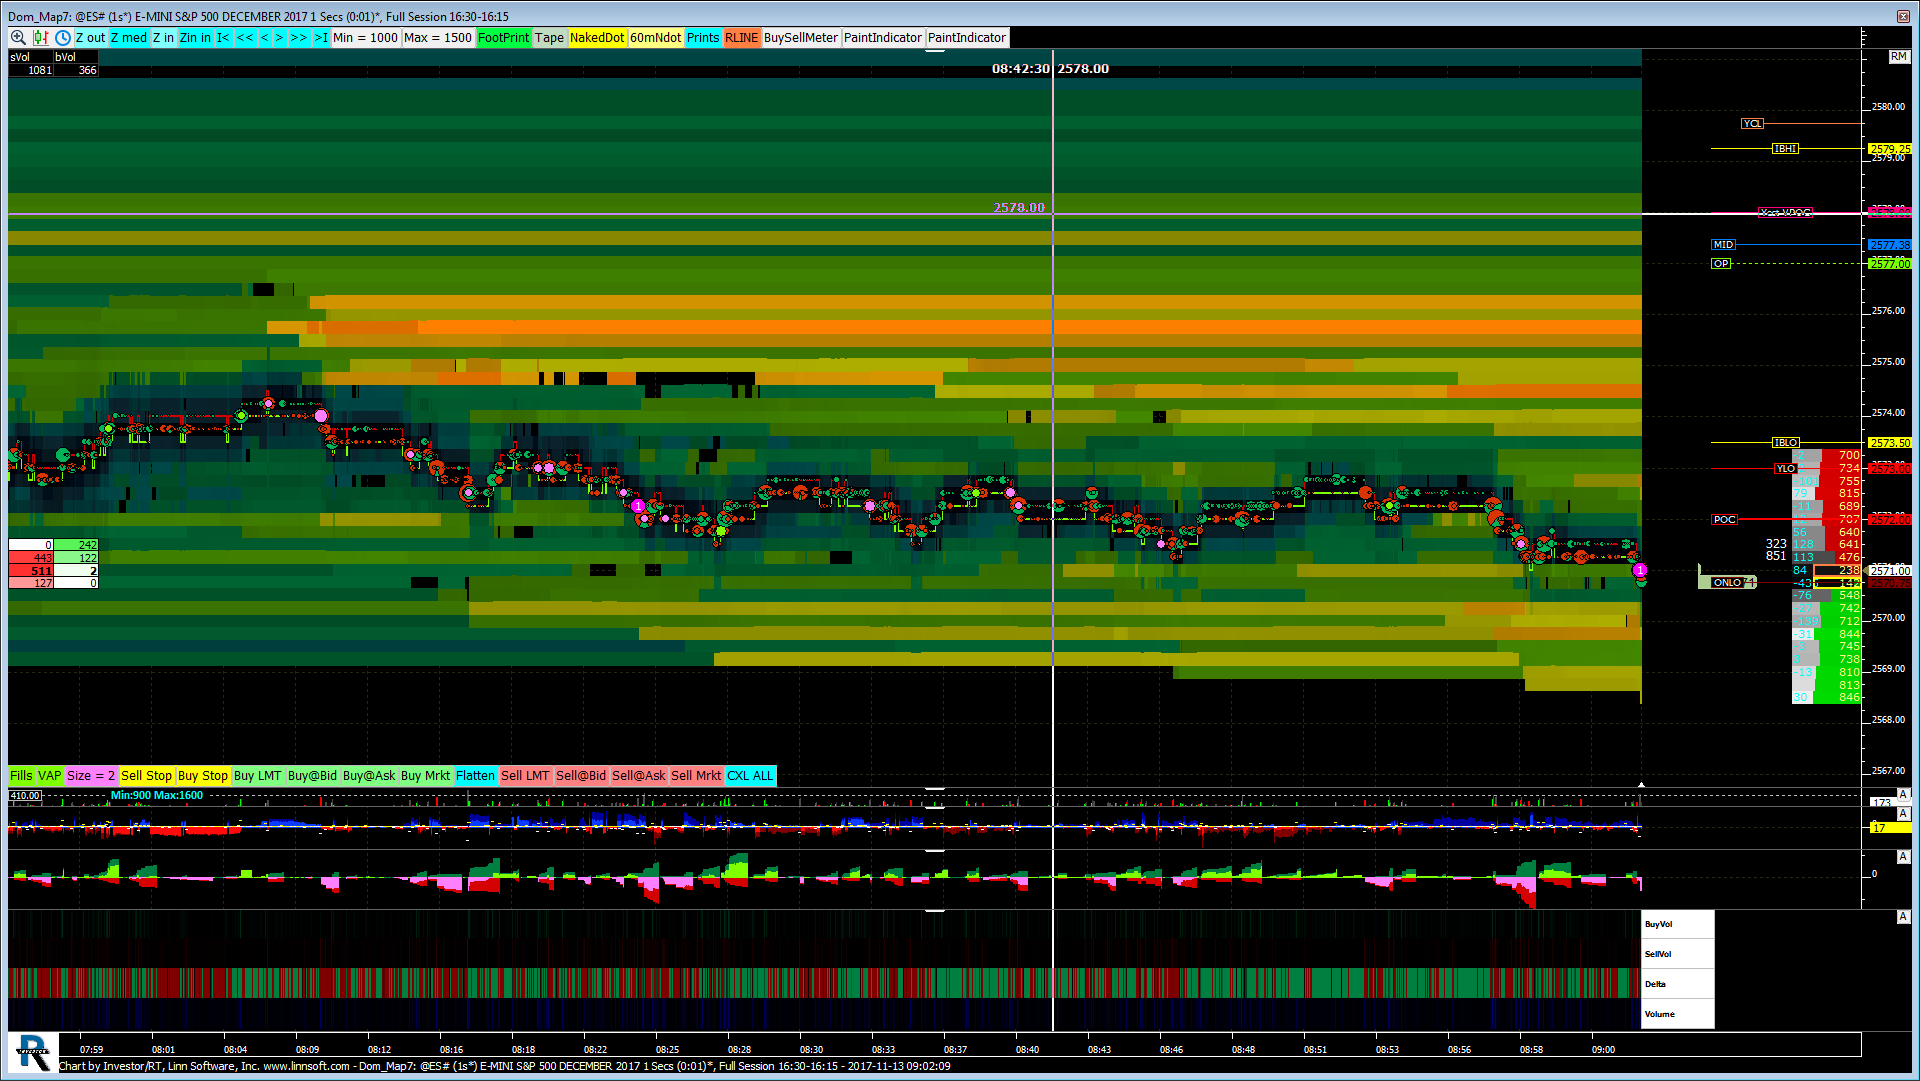 |
Dom Map (@ES#) jayski51369 [totalcount]
8 years 1 month ago
This chart was uploaded by Investor/RT 12.7.6 showing symbol: @ES#. |
View |
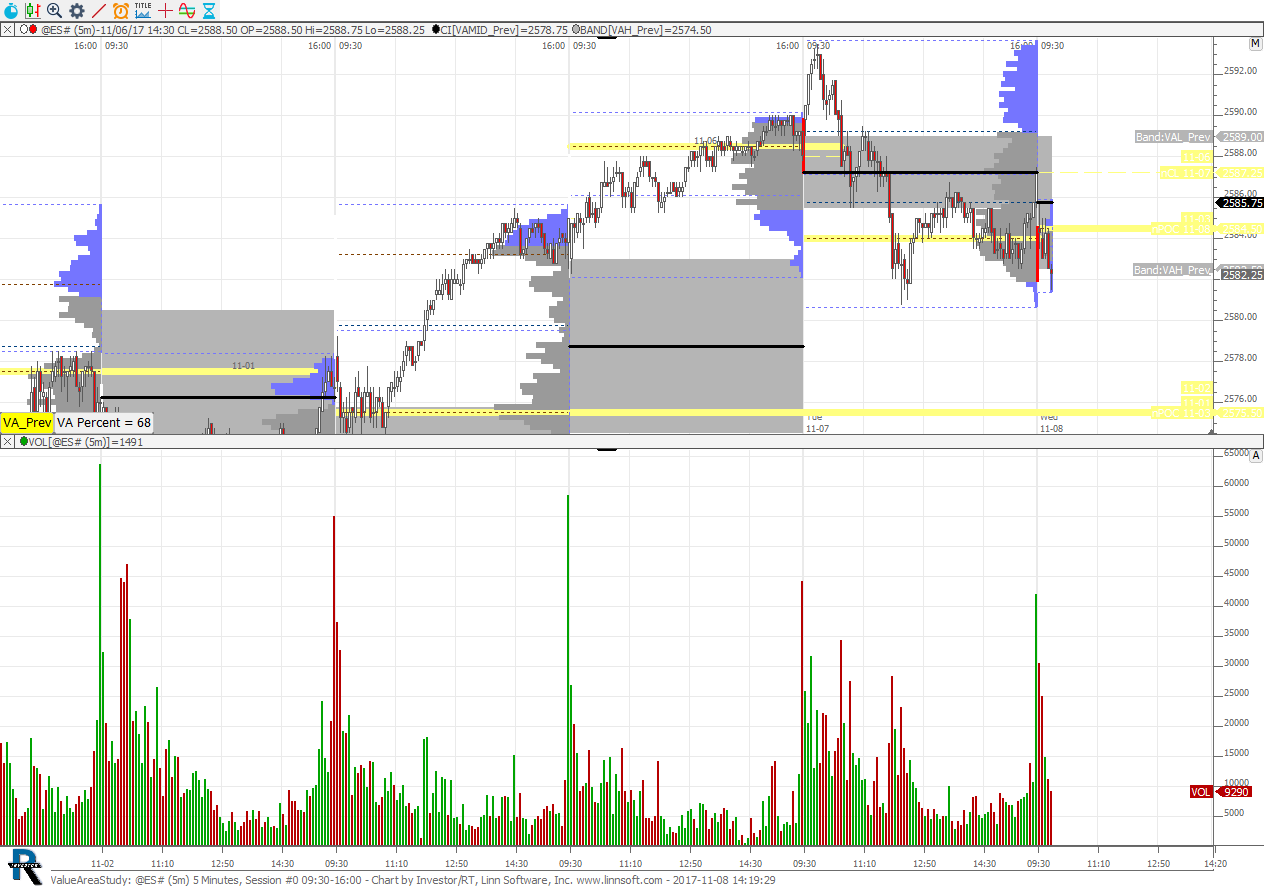 |
ValueAreaStudy (@ES#) cpayne [totalcount]
8 years 1 month ago
This chart was uploaded by Investor/RT 13.1.1 showing symbol: @ES#. |
View |
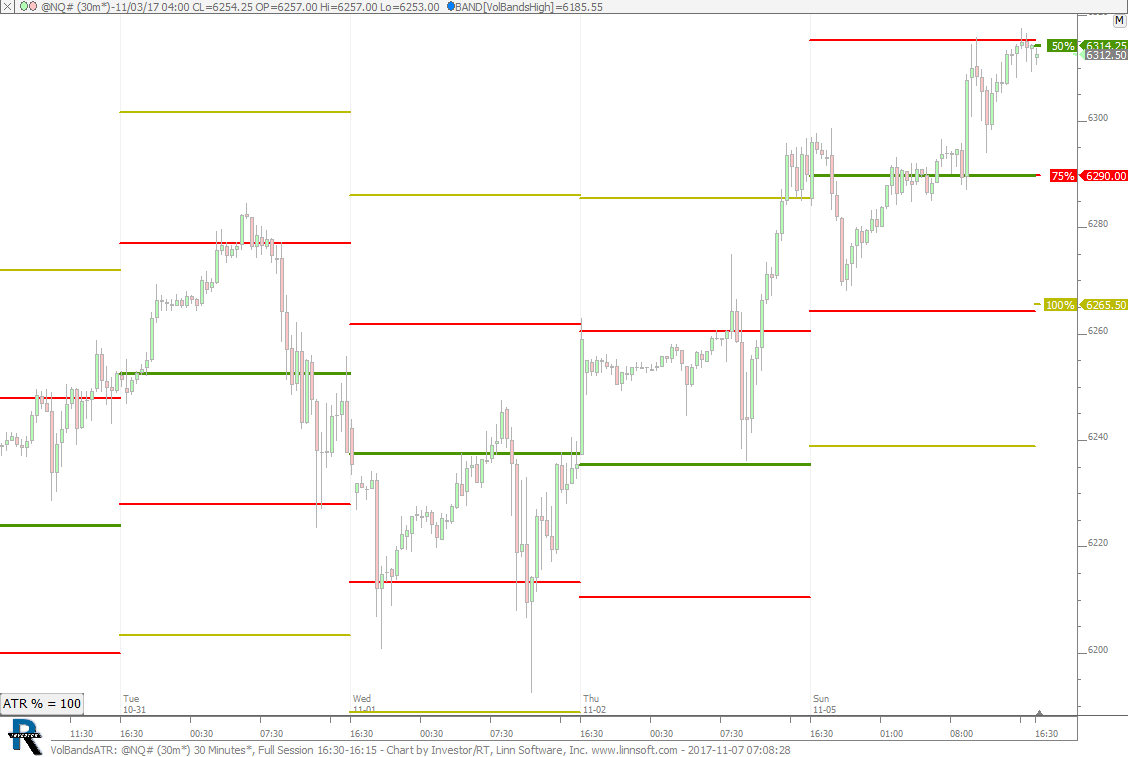 |
VolBandsATR (@NQ#) cpayne [totalcount]
8 years 1 month ago
Volatility Bands ATR. This chart was uploaded by Investor/RT 13.1.1 showing symbol: @NQ#. |
View |
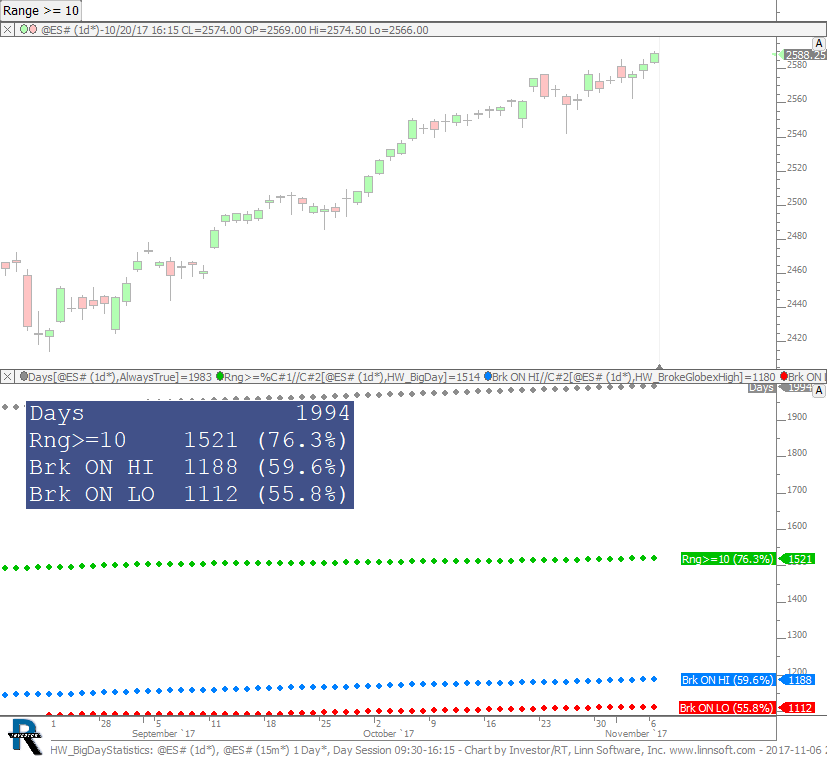 |
HW BigDayStatistics (@ES#) cpayne [totalcount]
8 years 1 month ago
Homework. Number of Big Days (Use Button For Min Range), and Number of Days we break overnight high and low (with percentages). |
View |
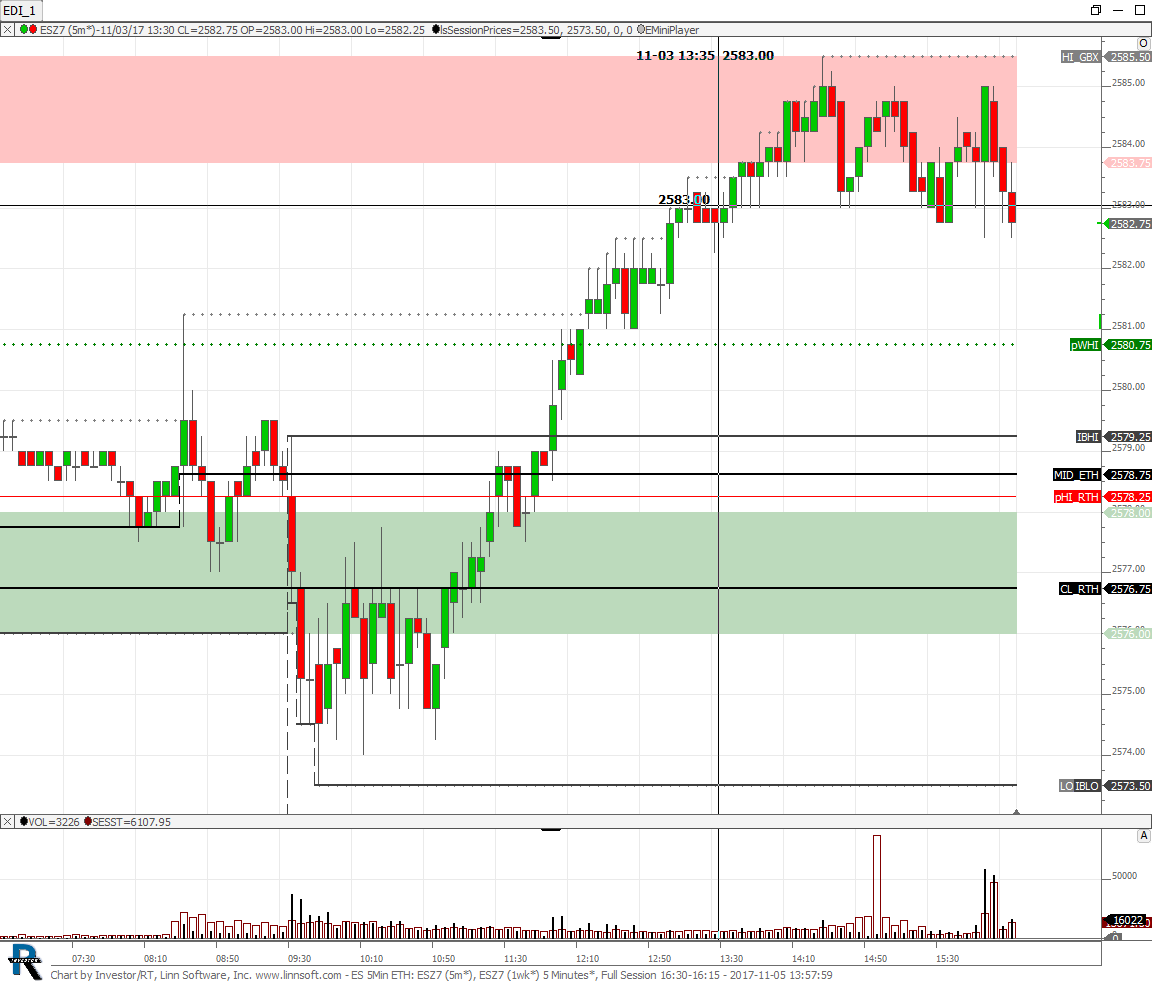 |
ES 5Min ETH (ESZ7) TAGr Capital [totalcount]
8 years 1 month ago
Wondering why the mid an close that should be dashed are solid. This chart was uploaded by Investor/RT 13.1.1 showing symbol: ESZ7. |
View |
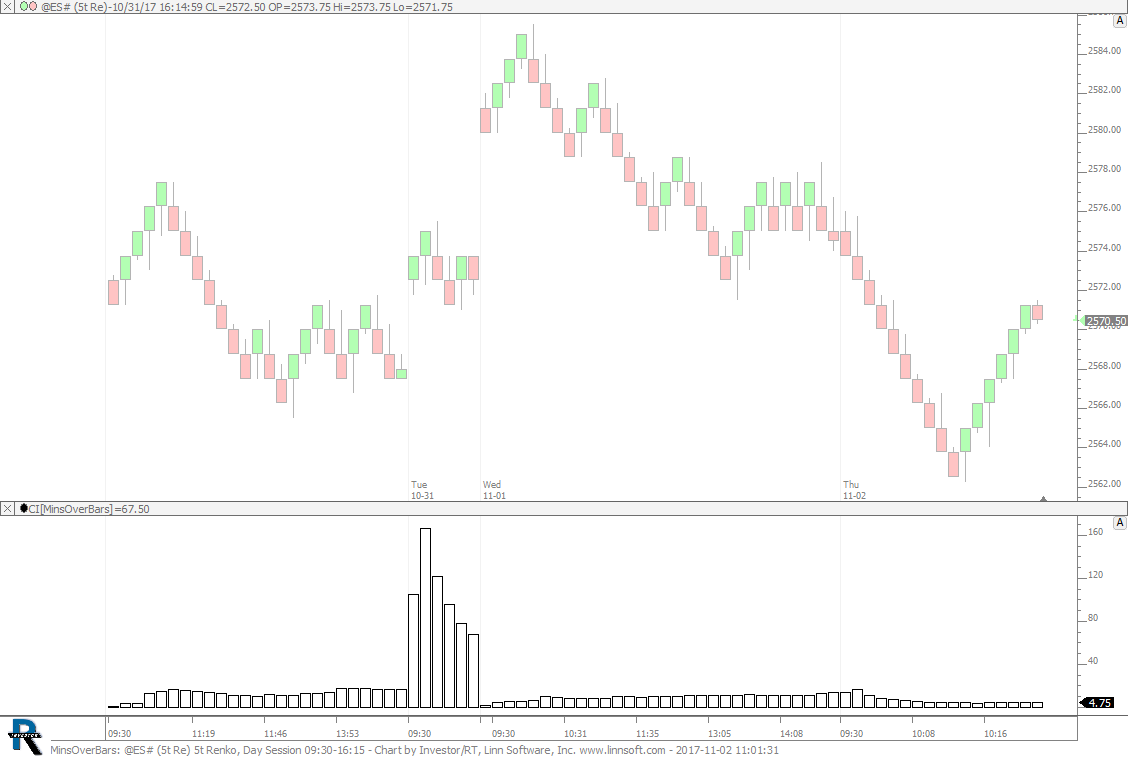 |
MinsOverBars (@ES#) cpayne [totalcount]
8 years 1 month ago
Minutes Into Session Divided by Bars Into Session. This chart was uploaded by Investor/RT 13.1.1 showing symbol: @ES#. |
View |
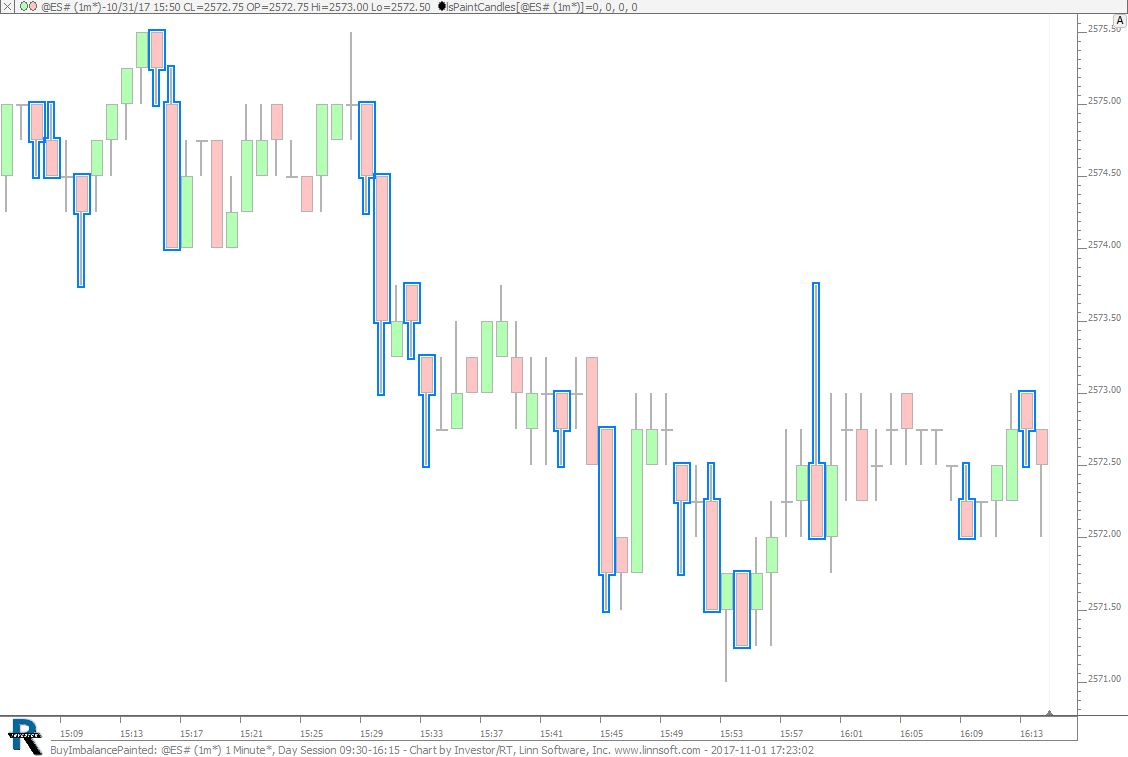 |
BuyImbalancePainted (@ES#) cpayne [totalcount]
8 years 1 month ago
Buy Imbalance Painted. This chart was uploaded by Investor/RT 13.1.1 showing symbol: @ES#. |
View |
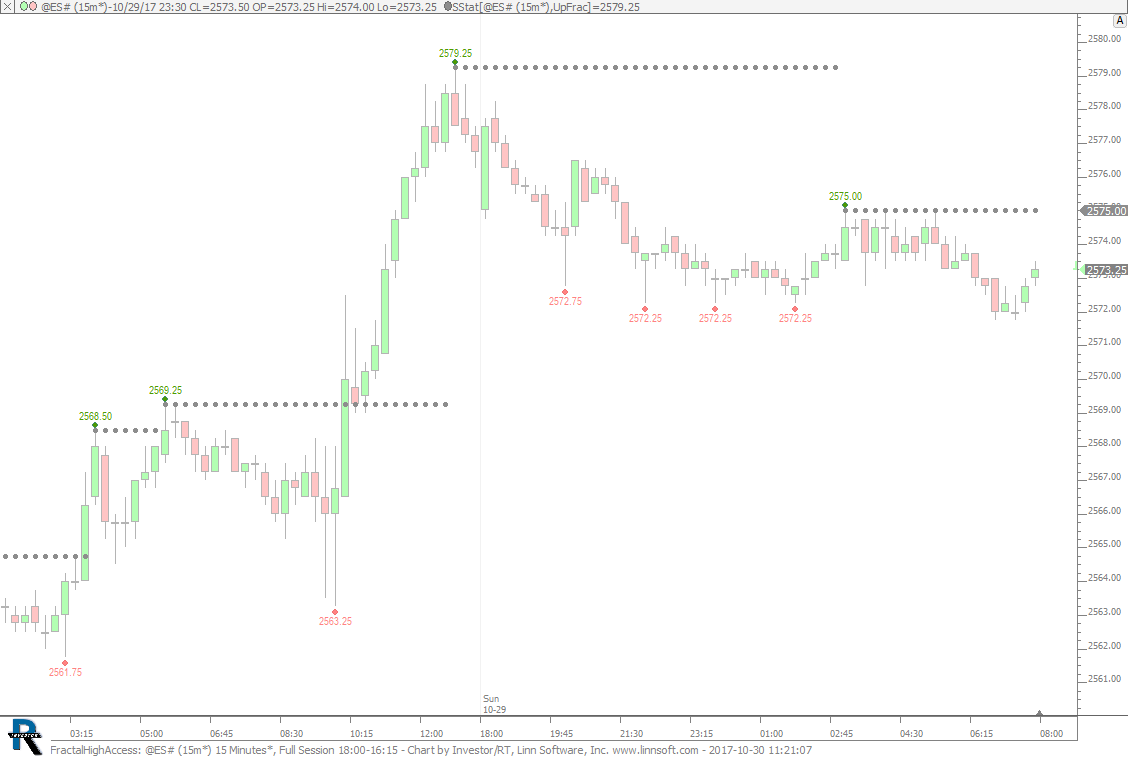 |
FractalHighAccess (@ES#) cpayne [totalcount]
8 years 1 month ago
Accessing the High of Up Fractal. This chart was uploaded by Investor/RT 13.1.1 showing symbol: @ES#. |
View |
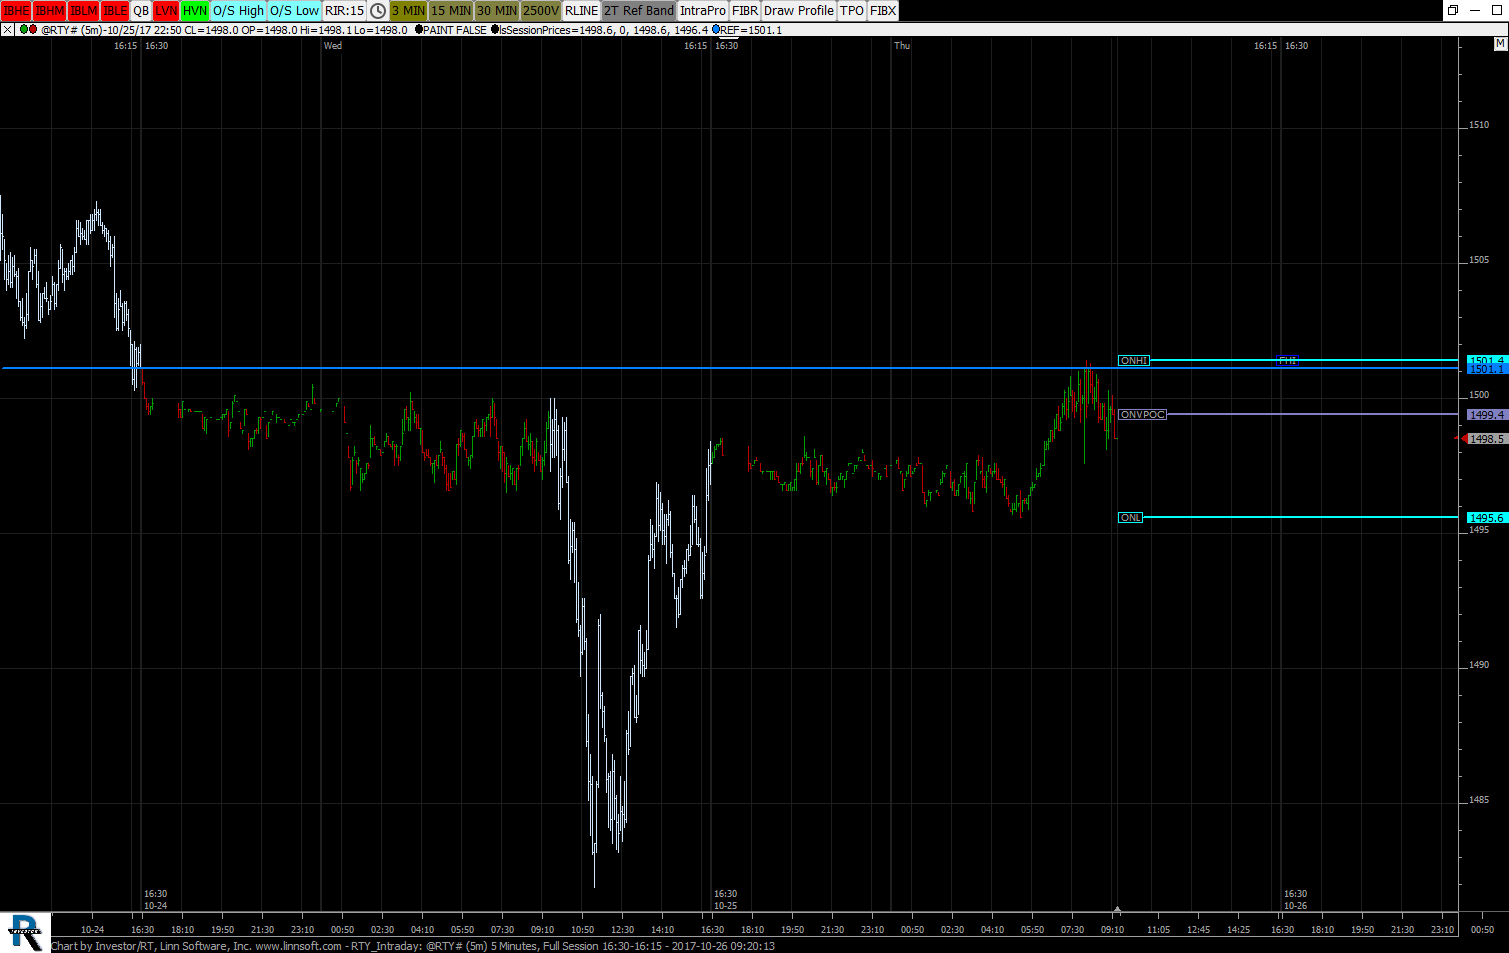 |
RTY Intraday (@RTY#) 2 scooke [totalcount]
8 years 1 month ago
This chart was uploaded by Investor/RT 13.1.1 showing symbol: @RTY#. |
View |