 |
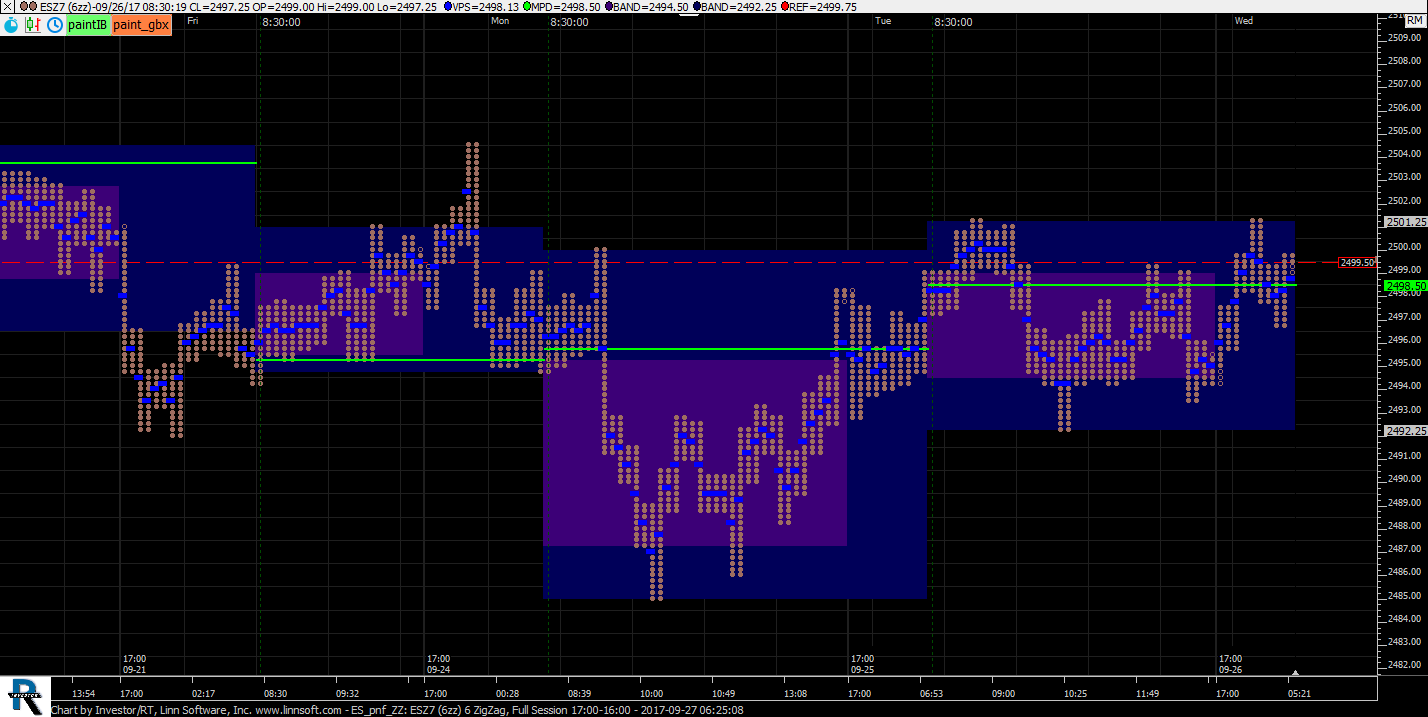
ES pnf ZZ (ESZ7) ctj0601 [totalcount]
8 years 2 months ago
pnf style on ZigZag periodicity. This chart was uploaded by Investor/RT 12.7.6 showing symbol: ESZ7. |
View |
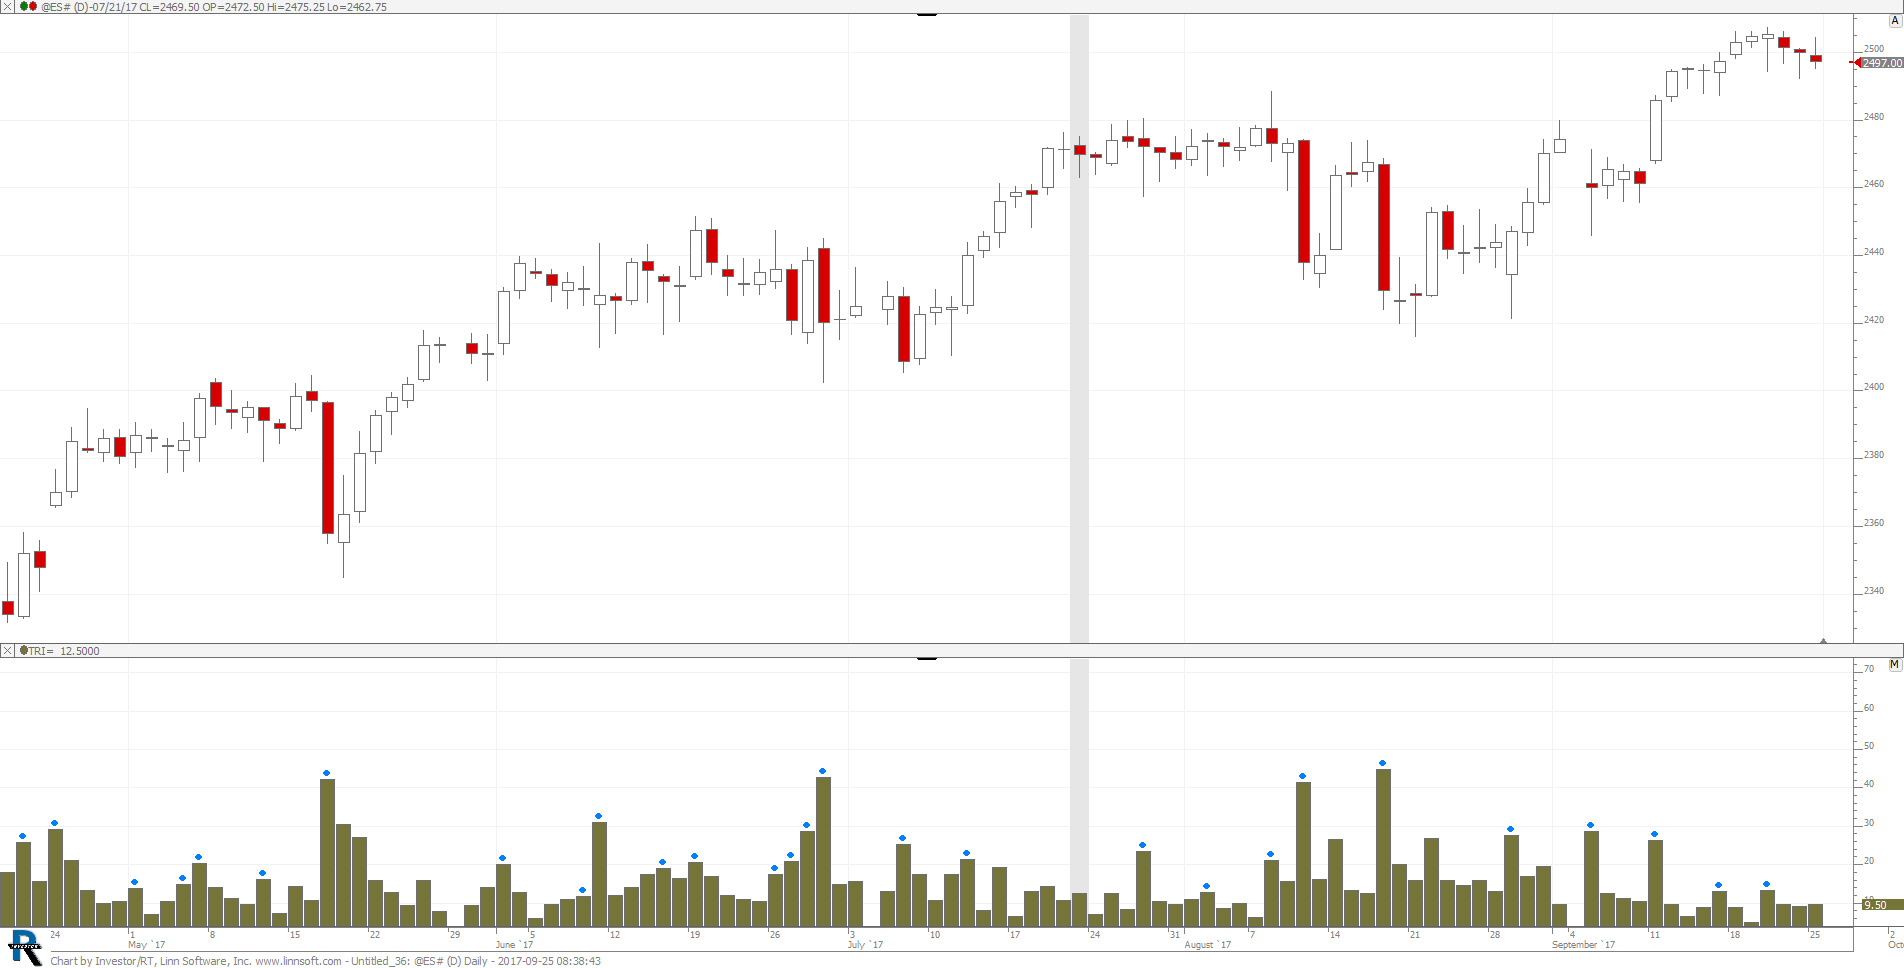 |
Untitled 36 (@ES#) scooke [totalcount]
8 years 2 months ago
This chart was uploaded by Investor/RT 12.7.6 showing symbol: @ES#. |
View |
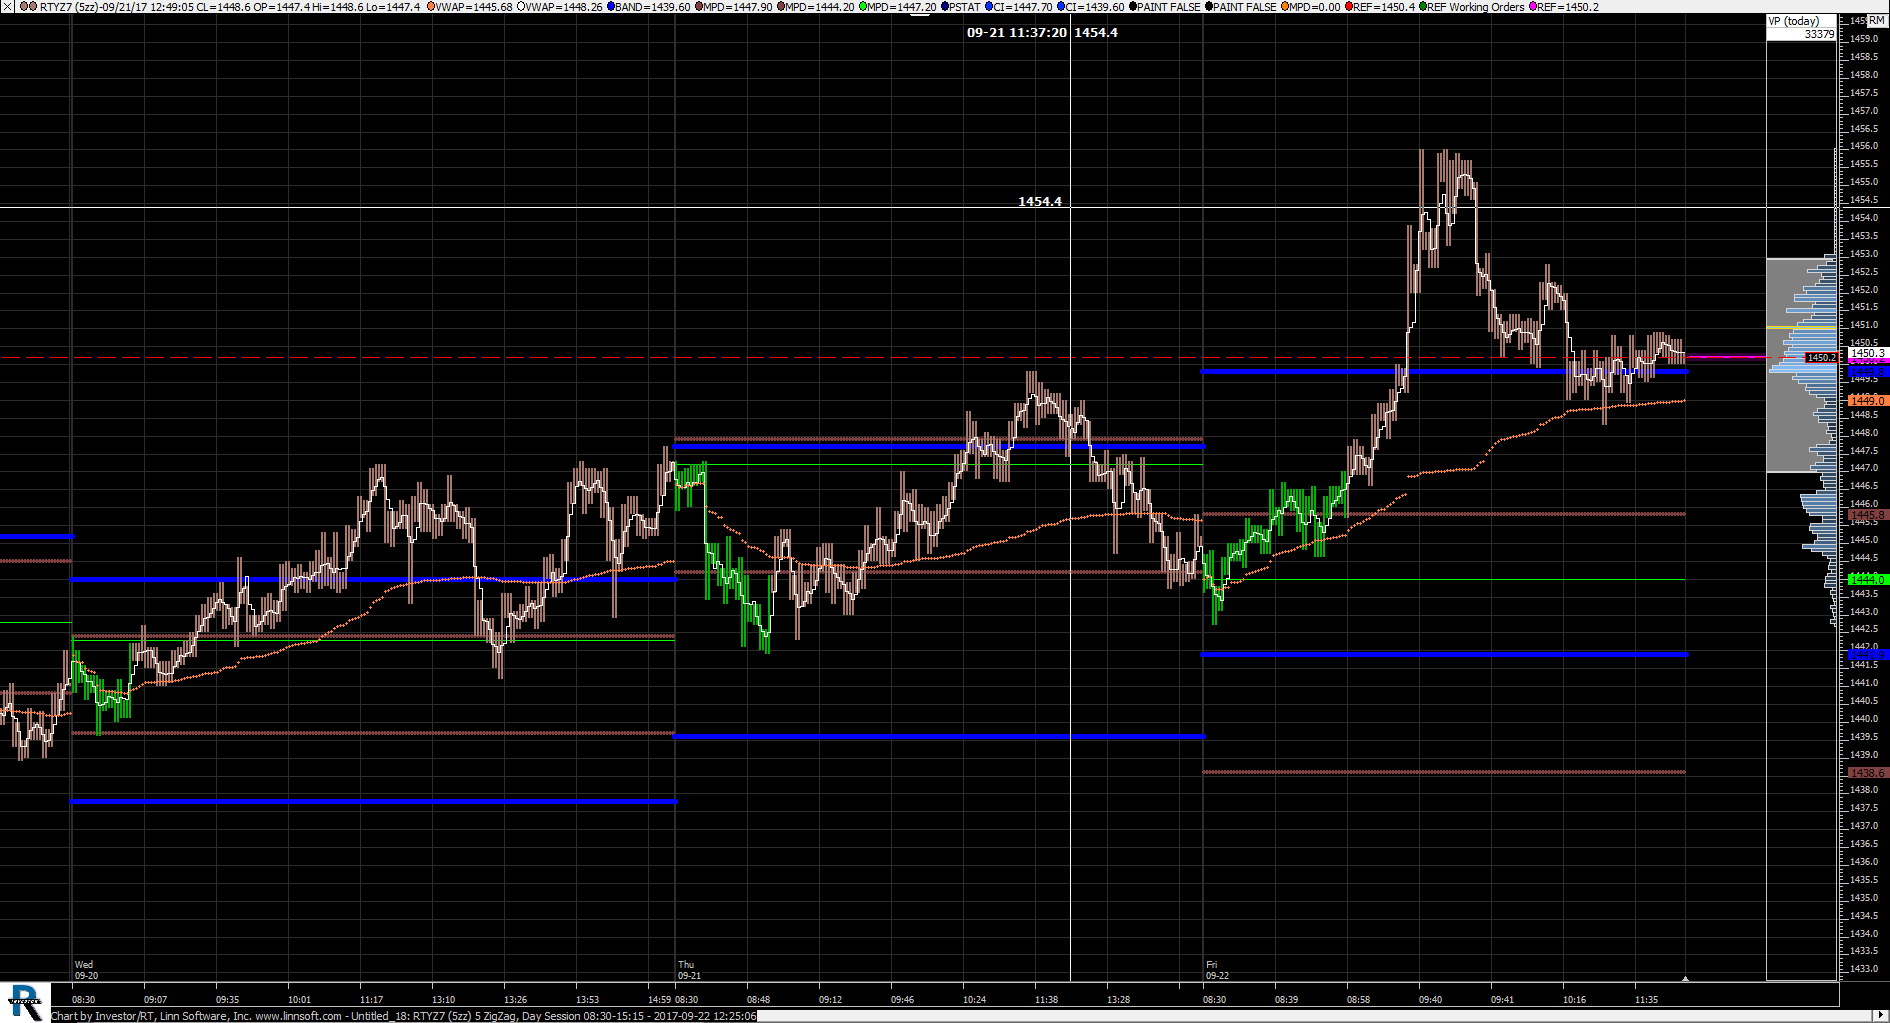 |
Untitled (RTYZ7) ctj0601 [totalcount]
8 years 3 months ago
RTY chart. This chart was uploaded by Investor/RT 12.7.6 showing symbol: RTYZ7. |
View |
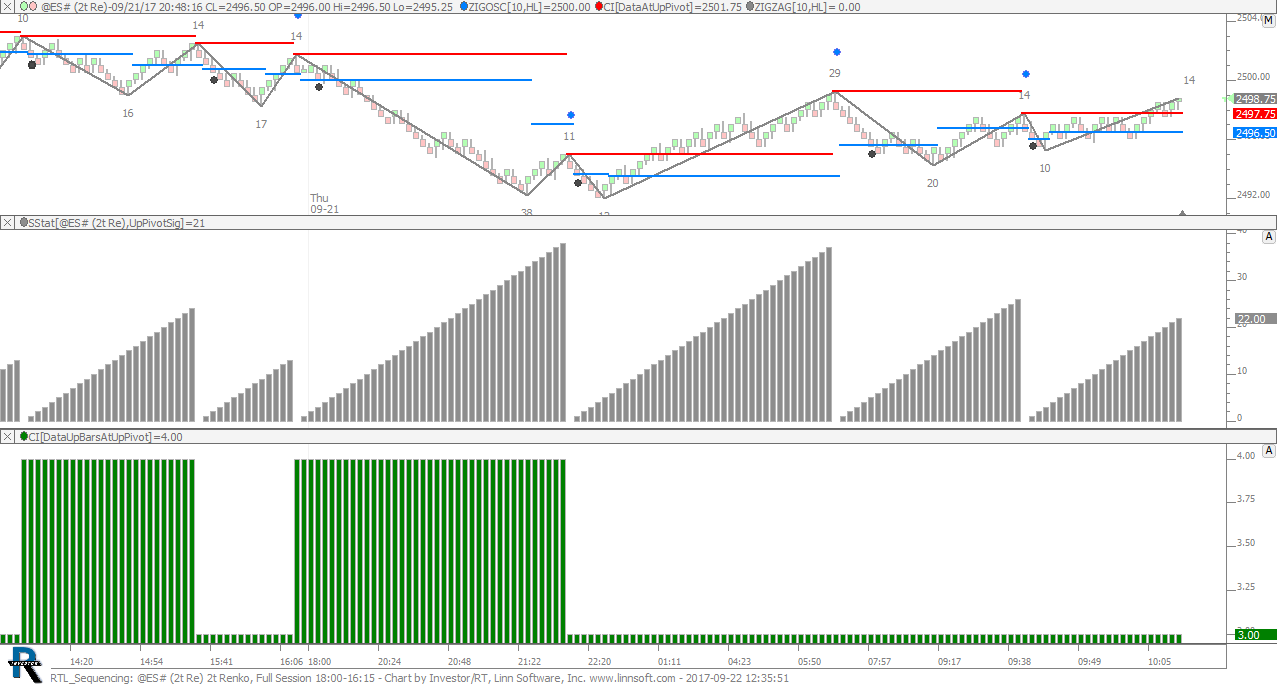 |
RTL Sequencing (@ES#) cpayne [totalcount]
8 years 3 months ago
Advanced RTL - Sequencing Events. This chart was uploaded by Investor/RT 13.1.1 showing symbol: @ES#. |
View |
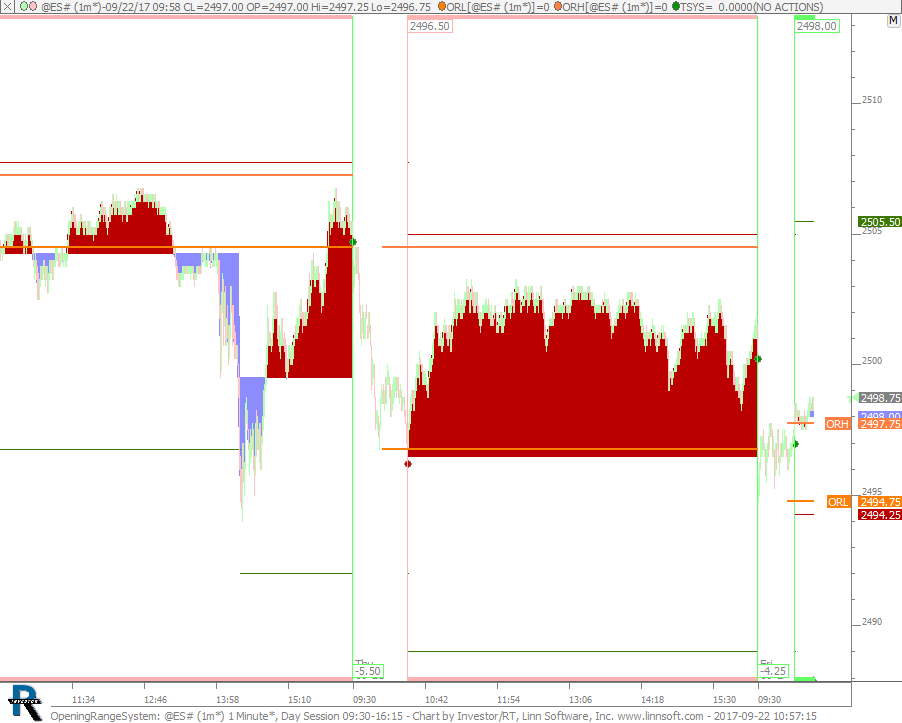 |
OpeningRangeSystem (@ES#) cpayne [totalcount]
8 years 3 months ago
Opening Range Trading System. This chart was uploaded by Investor/RT 13.1.1 showing symbol: @ES#. |
View |
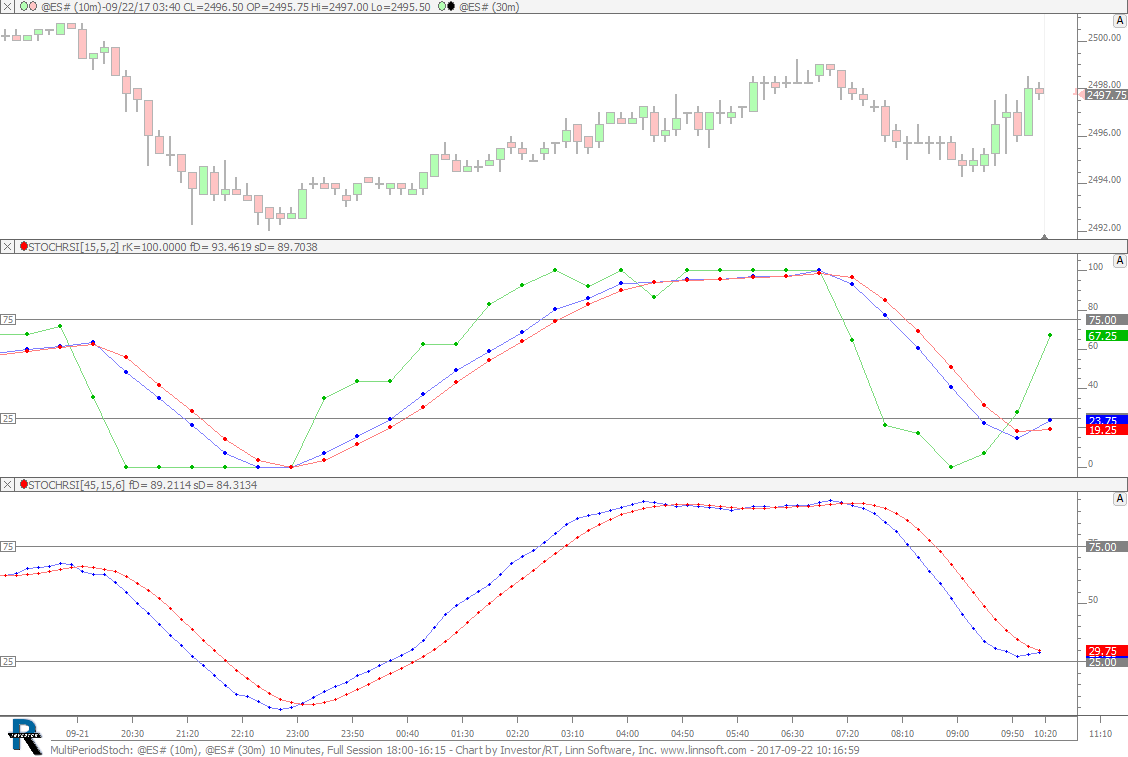 |
MultiPeriodStoch (@ES#) cpayne [totalcount]
8 years 3 months ago
Multi-Period Stochastics Options. This chart was uploaded by Investor/RT 13.1.1 showing symbol: @ES#. |
View |
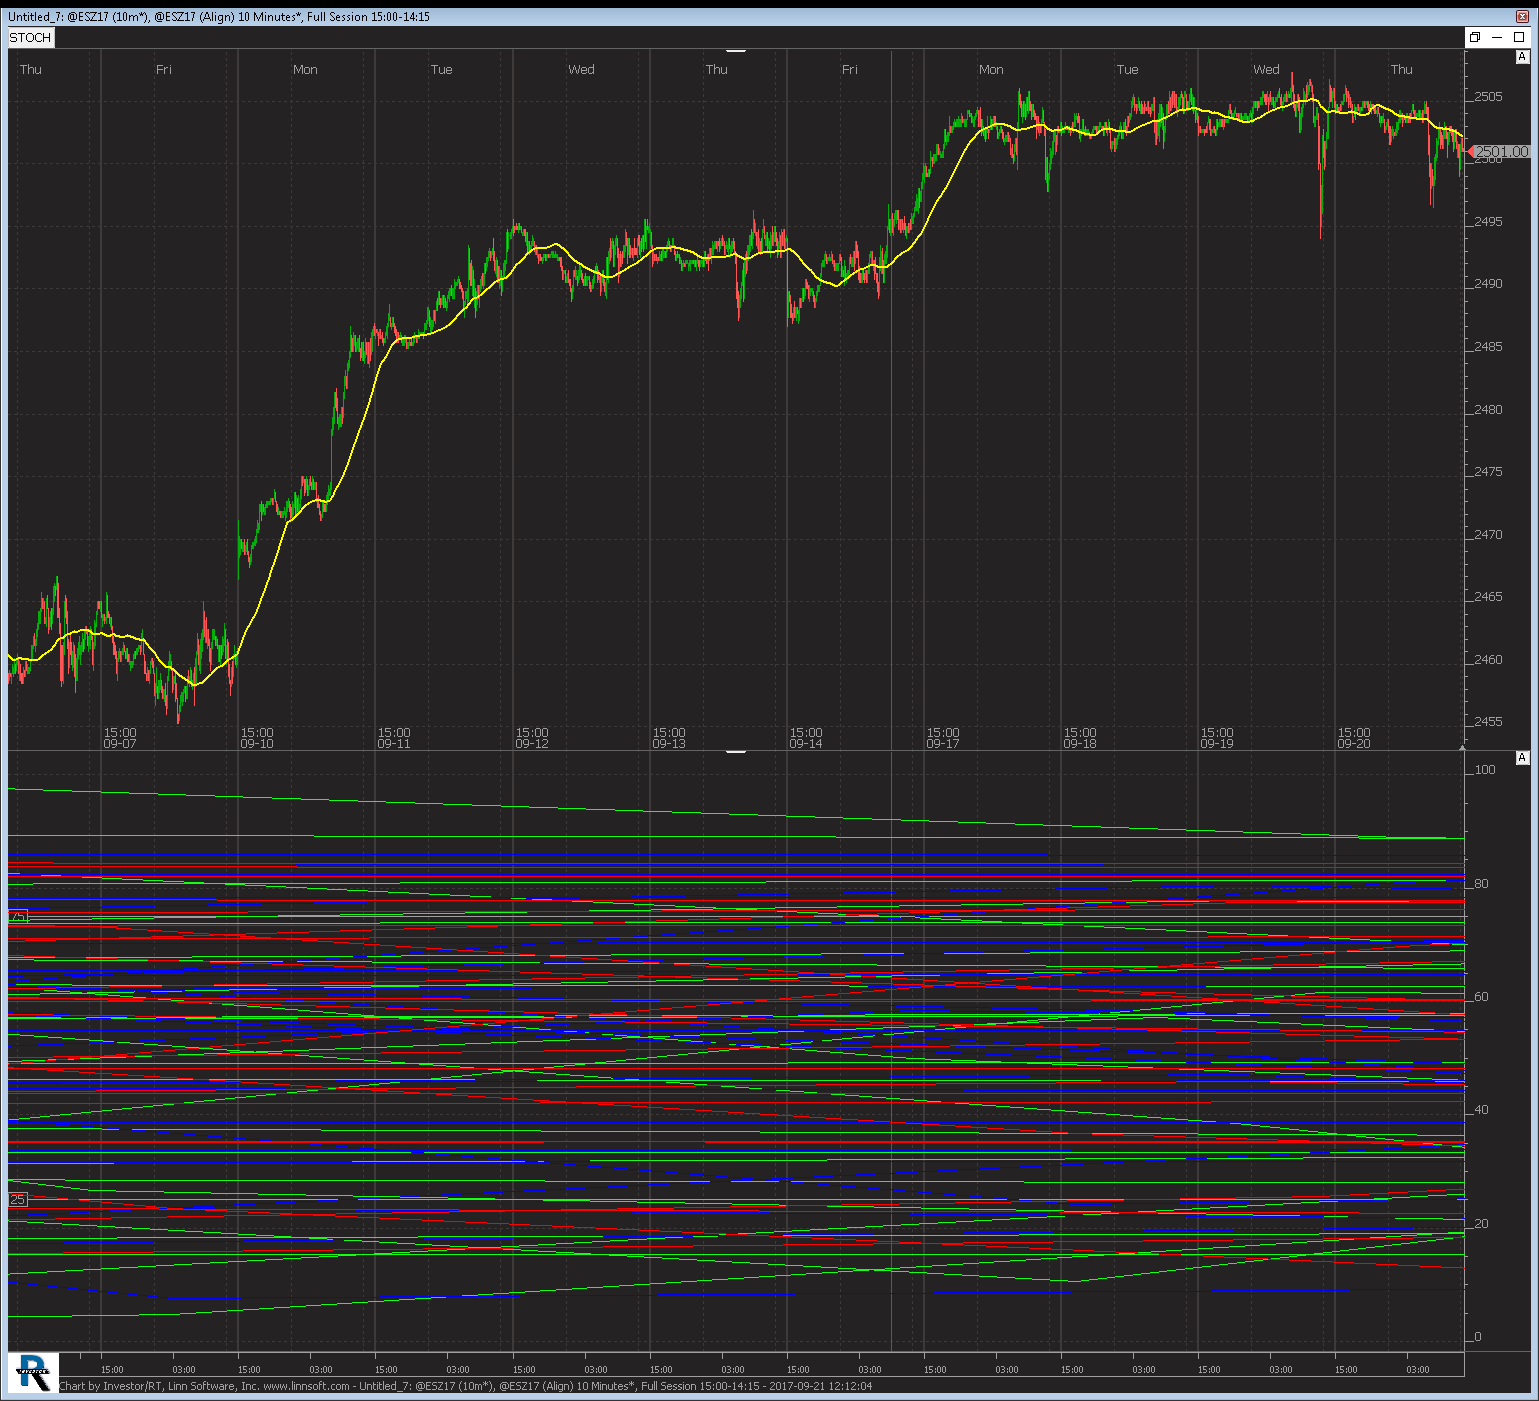 |
Untitled 7 (@ESZ17) aldica [totalcount]
8 years 3 months ago
This chart was uploaded by Investor/RT 12.7.6 showing symbol: @ESZ17. |
View |
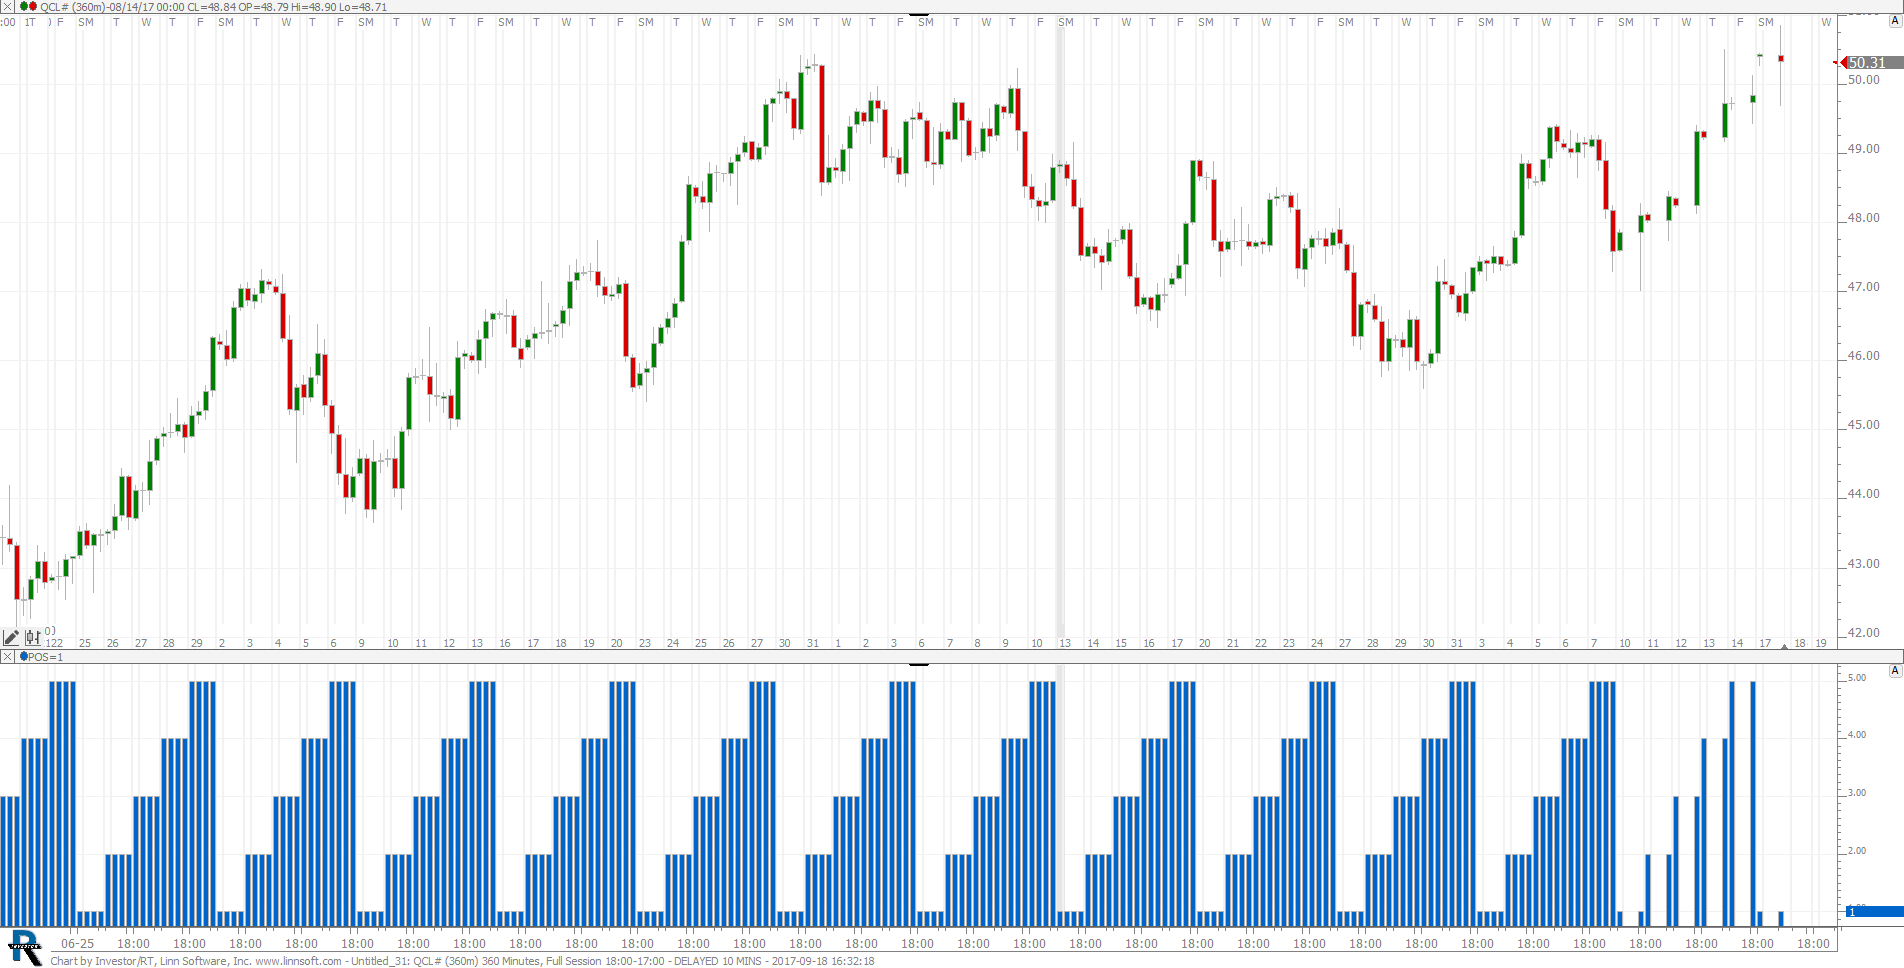 |
Untitled 31 (QCL#) scooke [totalcount]
8 years 3 months ago
This chart was uploaded by Investor/RT 12.7.6 showing symbol: QCL#. |
View |
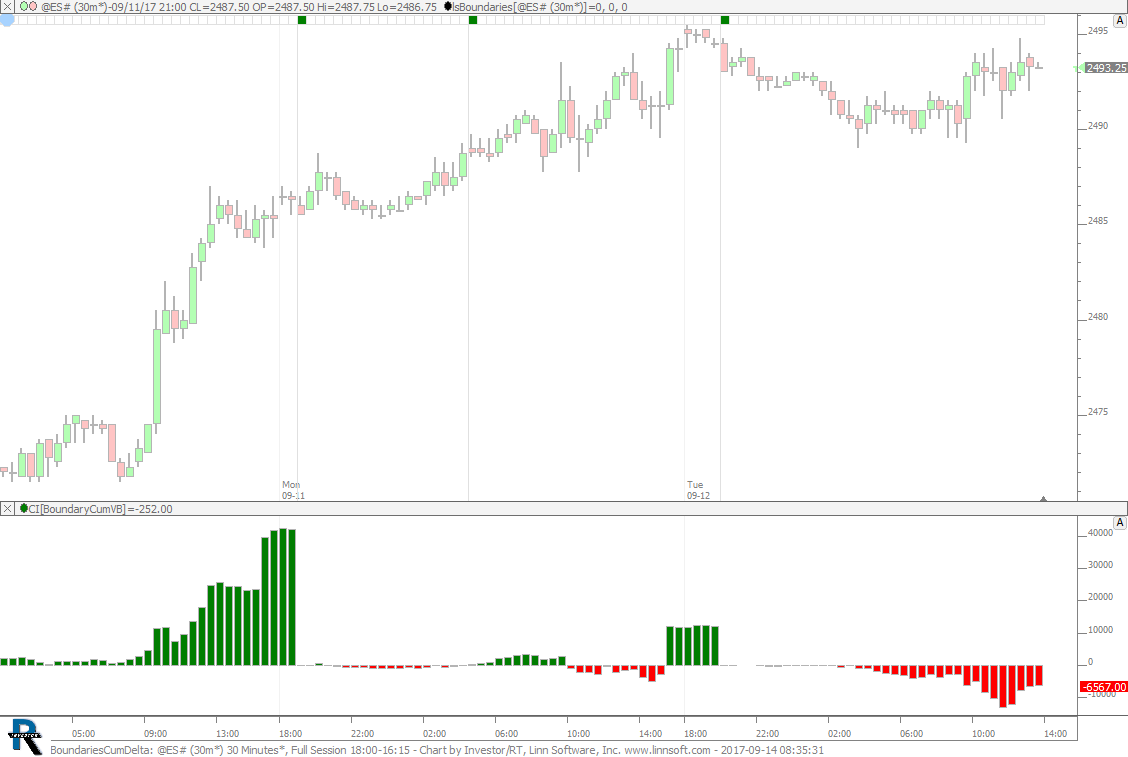 |
BoundariesCumDelta (@ES#) cpayne [totalcount]
8 years 3 months ago
Boundaries Cumulative Delta. This chart was uploaded by Investor/RT 13.1.1 showing symbol: @ES#. |
View |
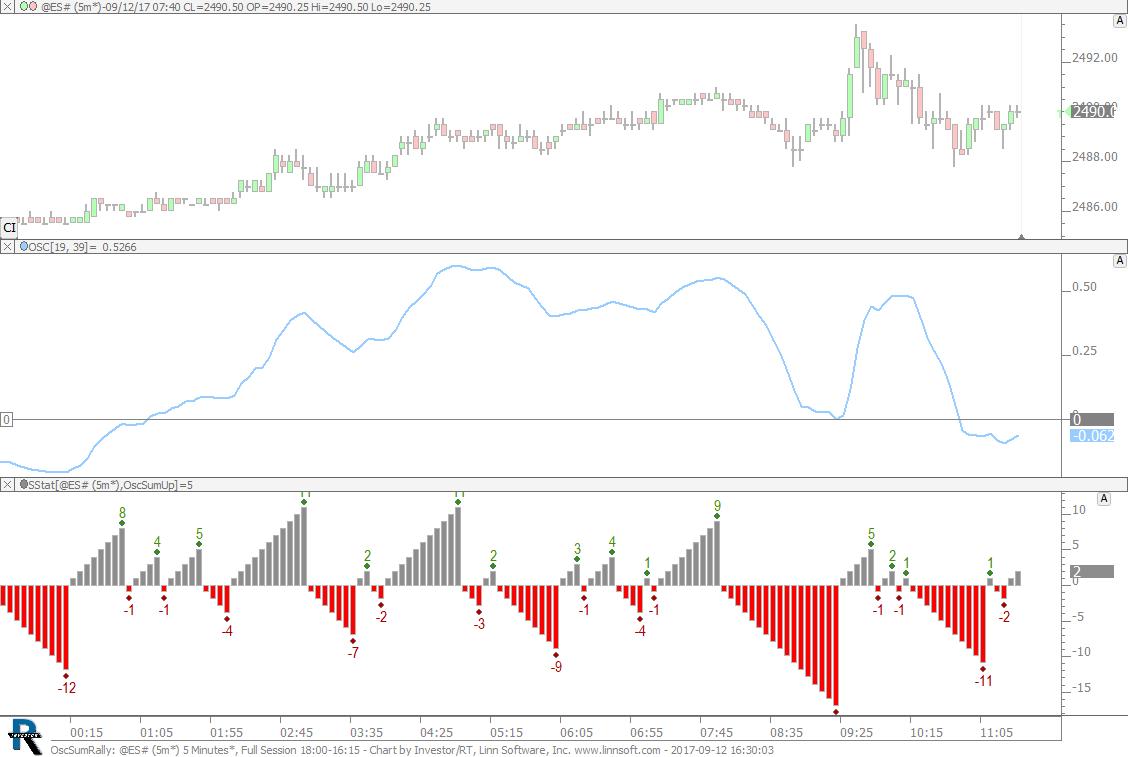 |
OscSumRally (@ES#) cpayne [totalcount]
8 years 3 months ago
Oscillator Summation Rally. This chart was uploaded by Investor/RT 13.1.1 showing symbol: @ES#. |
View |
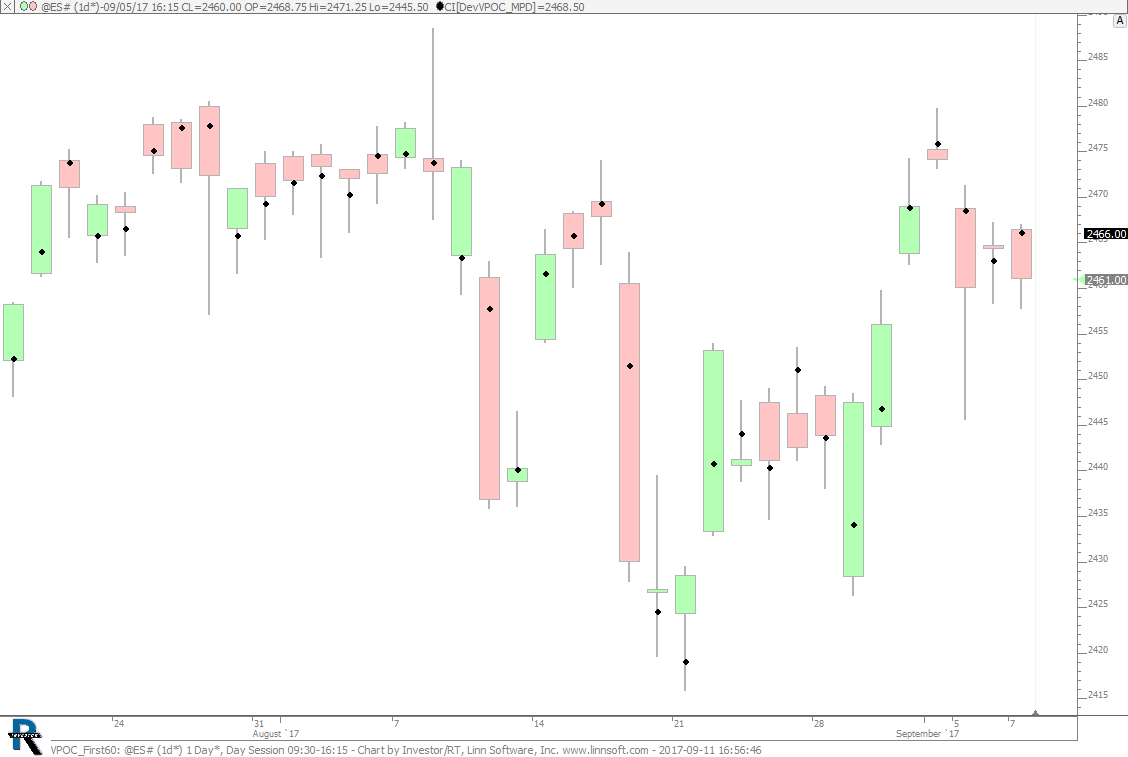 |
VPOC First60 (@ES#) cpayne [totalcount]
8 years 3 months ago
VPOC of 1st 60 Minutes of Session. This chart was uploaded by Investor/RT 13.1.1 showing symbol: @ES#. |
View |
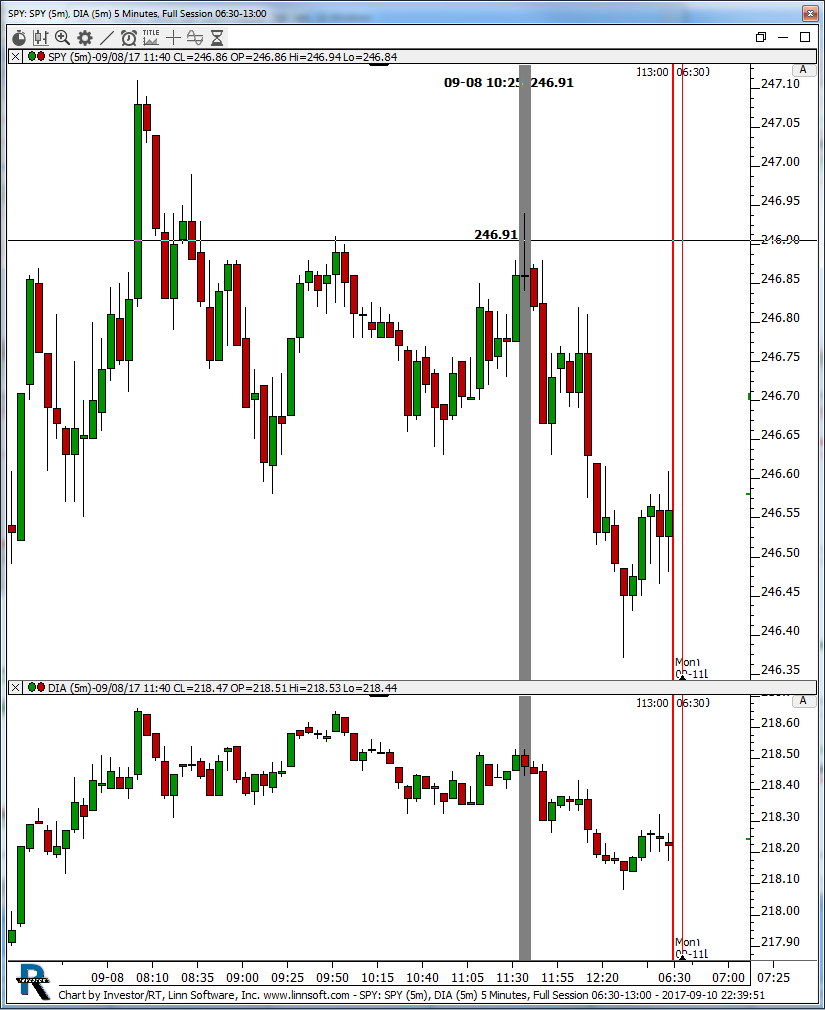 |
SPY (SPY) kencassorla [totalcount]
8 years 3 months ago
spy/dia. This chart was uploaded by Investor/RT 12.7.6 showing symbol: SPY. |
View |
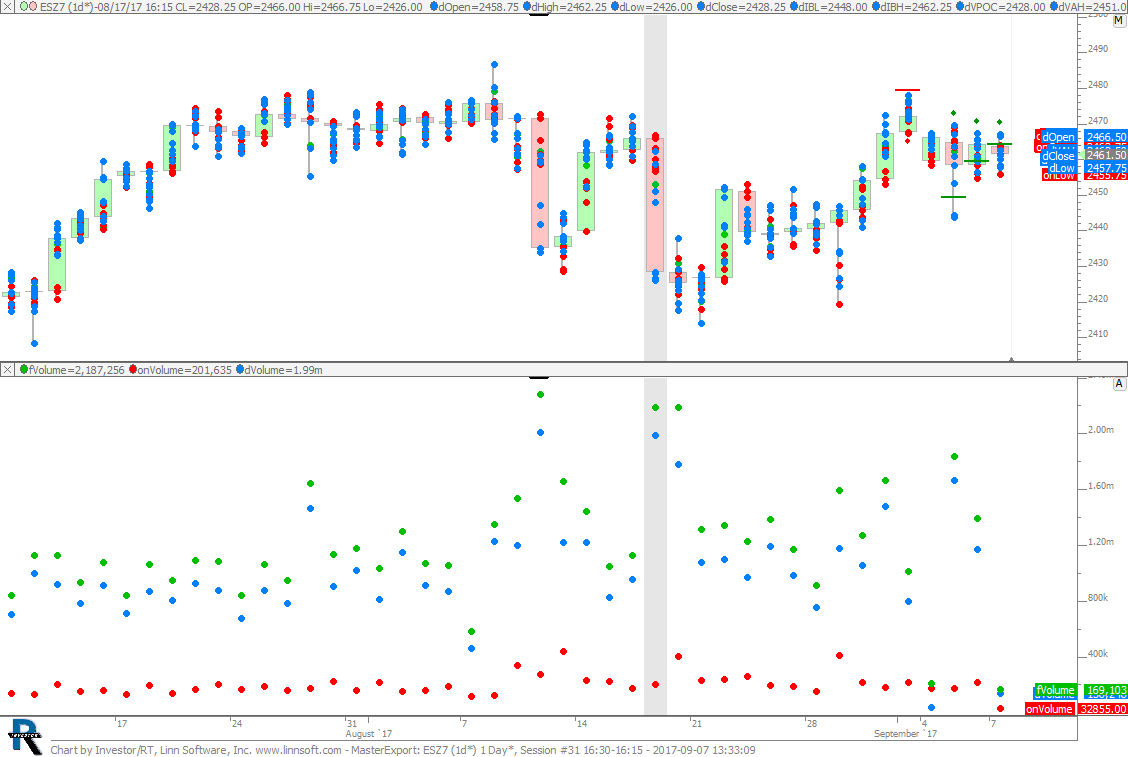 |
MasterExport (ESZ7) SPetkov [totalcount]
8 years 3 months ago
This chart was uploaded by Investor/RT 12.7.6 showing symbol: ESZ7. |
View |
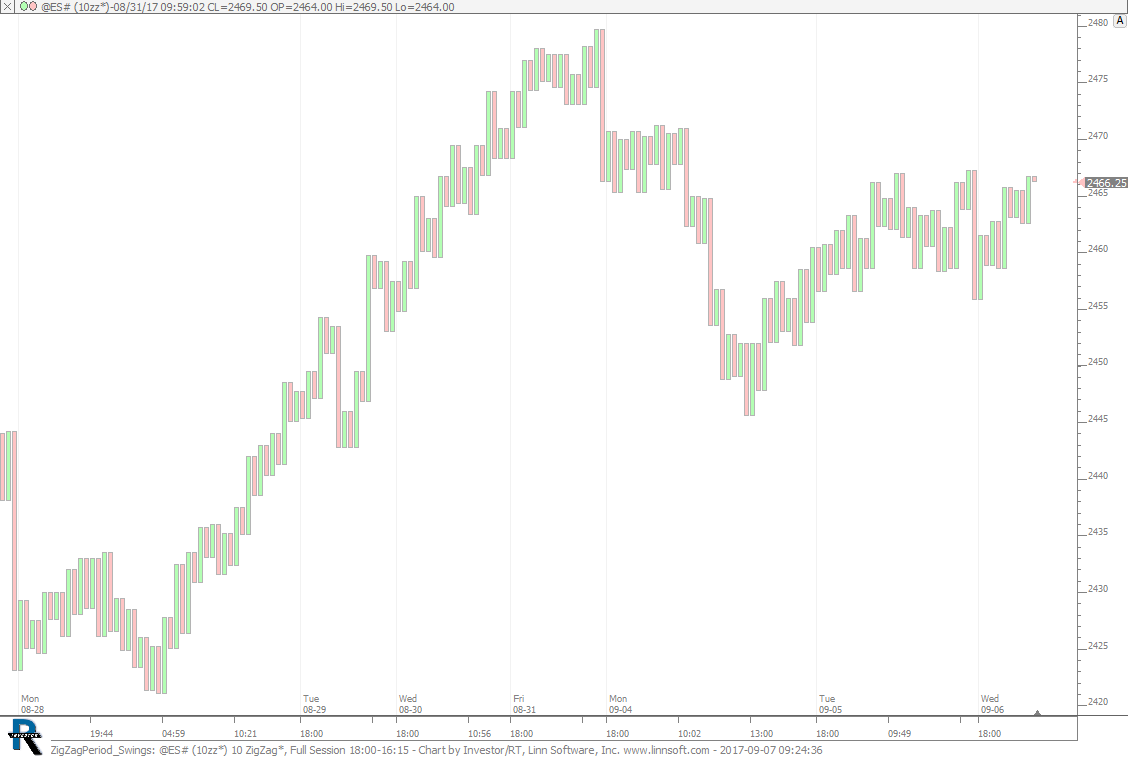 |
ZigZagPeriod Swings (@ES#) cpayne [totalcount]
8 years 3 months ago
Zig Zag Periodicity - Swing Highs/Lows. This chart was uploaded by Investor/RT 13.1.1 showing symbol: @ES#. |
View |
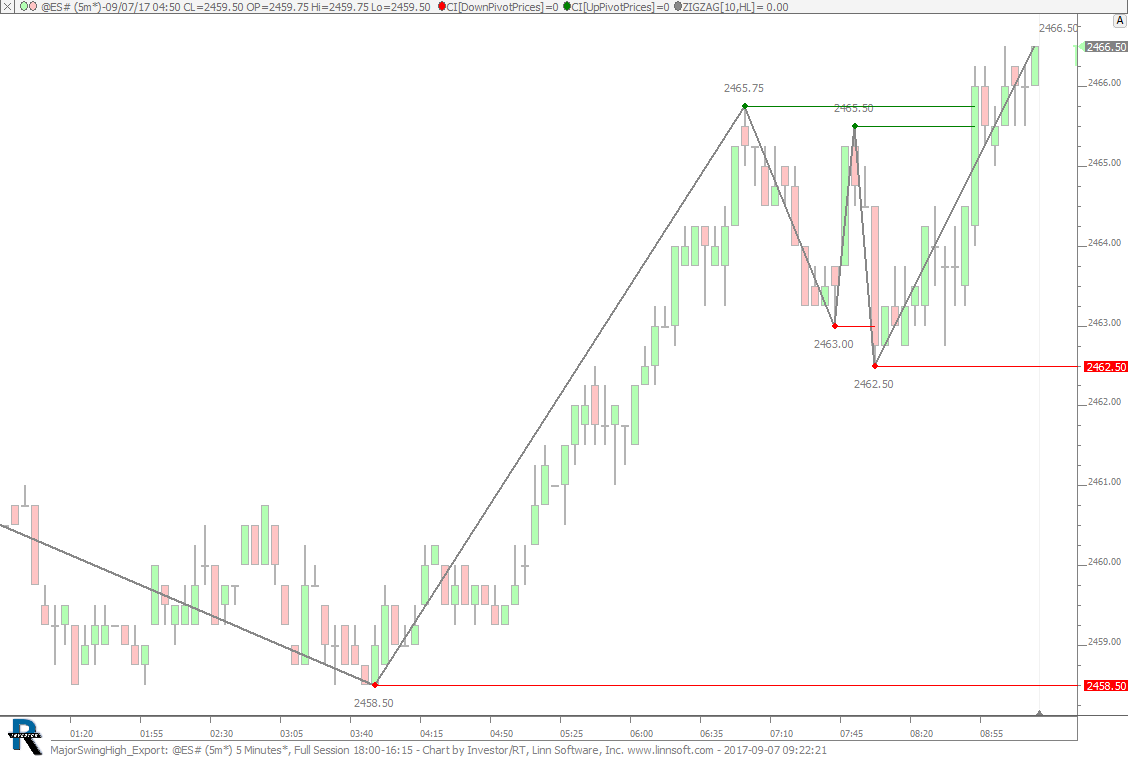 |
MajorSwingHigh Export (@ES#) cpayne [totalcount]
8 years 3 months ago
Up and Down Pivots for Export. This chart was uploaded by Investor/RT 13.1.1 showing symbol: @ES#. |
View |
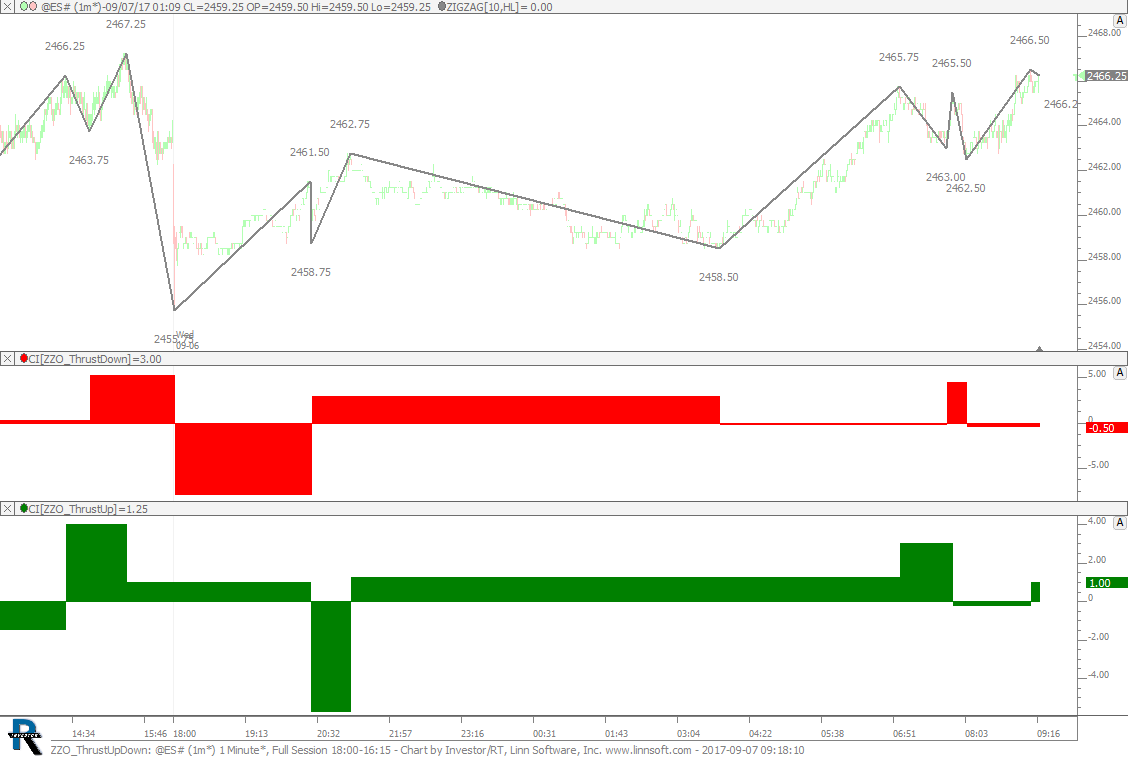 |
ZZO ThrustUpDown (@ES#) cpayne [totalcount]
8 years 3 months ago
ZZO - Thrust Up and Down. This chart was uploaded by Investor/RT 13.1.1 showing symbol: @ES#. |
View |
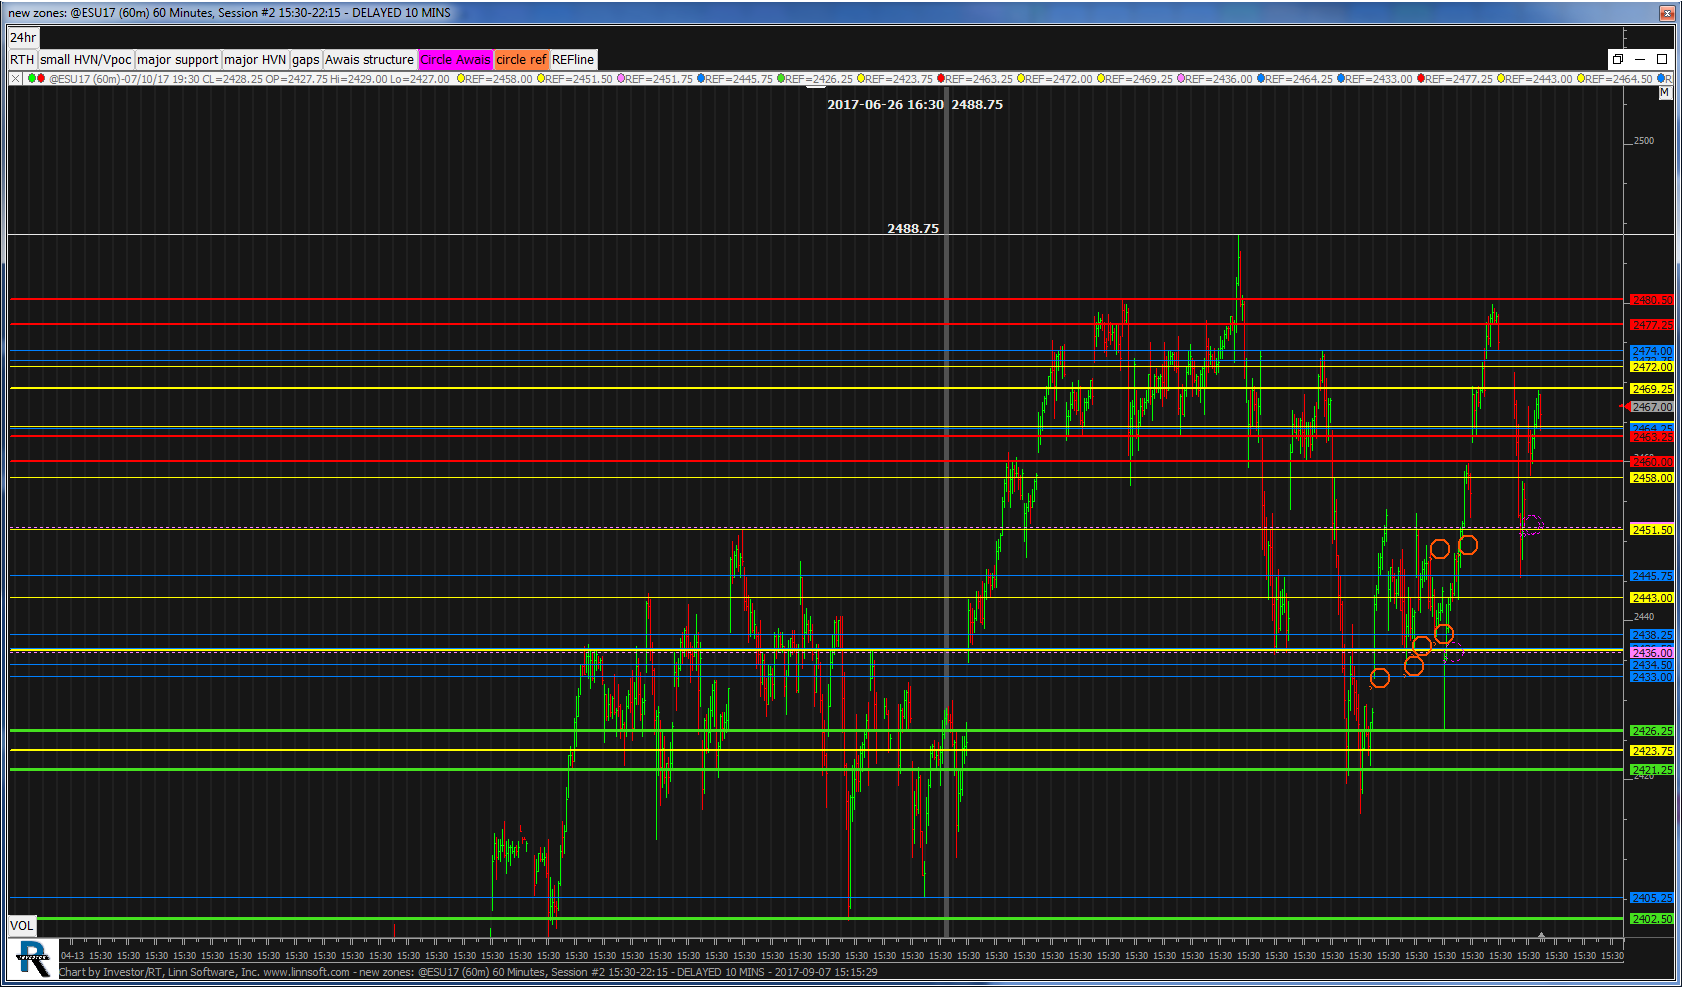 |
new zones (@ESU17) Joern Felgendreher [totalcount]
8 years 3 months ago
This chart was uploaded by Investor/RT 12.7.3 showing symbol: @ESU17. |
View |
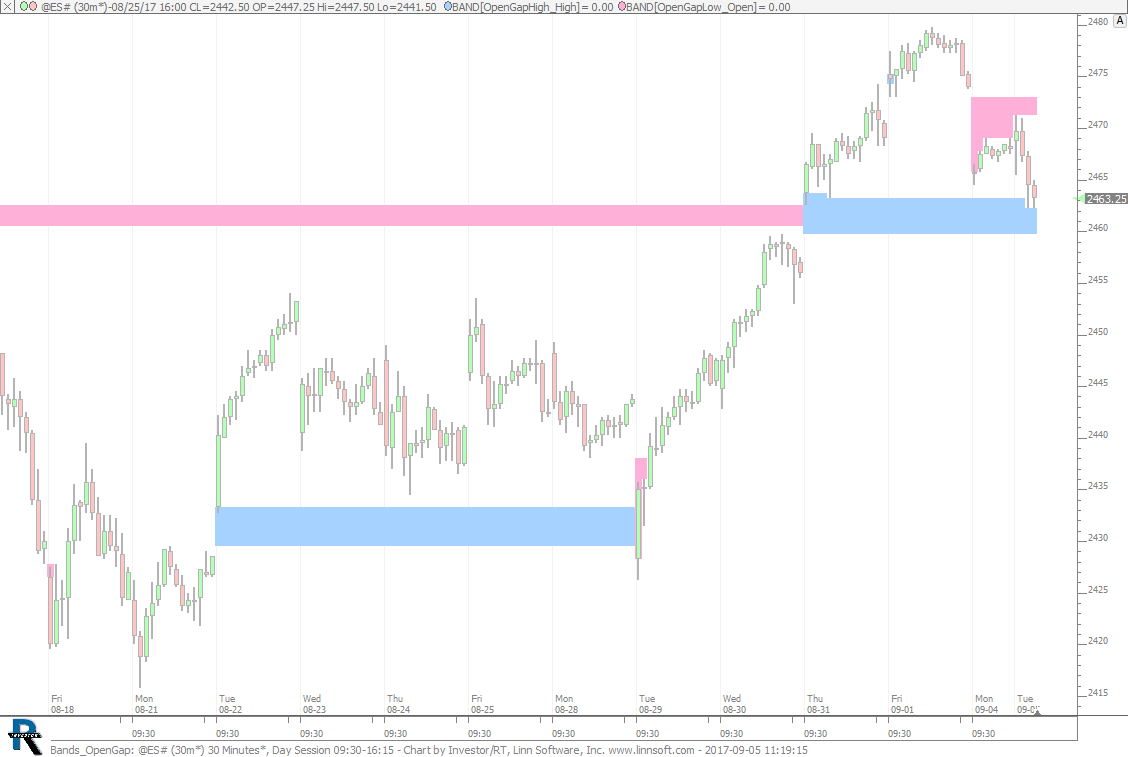 |
Bands OpenGap (@ES#) cpayne [totalcount]
8 years 3 months ago
Bands - Open Gap Yesterdays Range. This chart was uploaded by Investor/RT 13.1.1 showing symbol: @ES#. |
View |
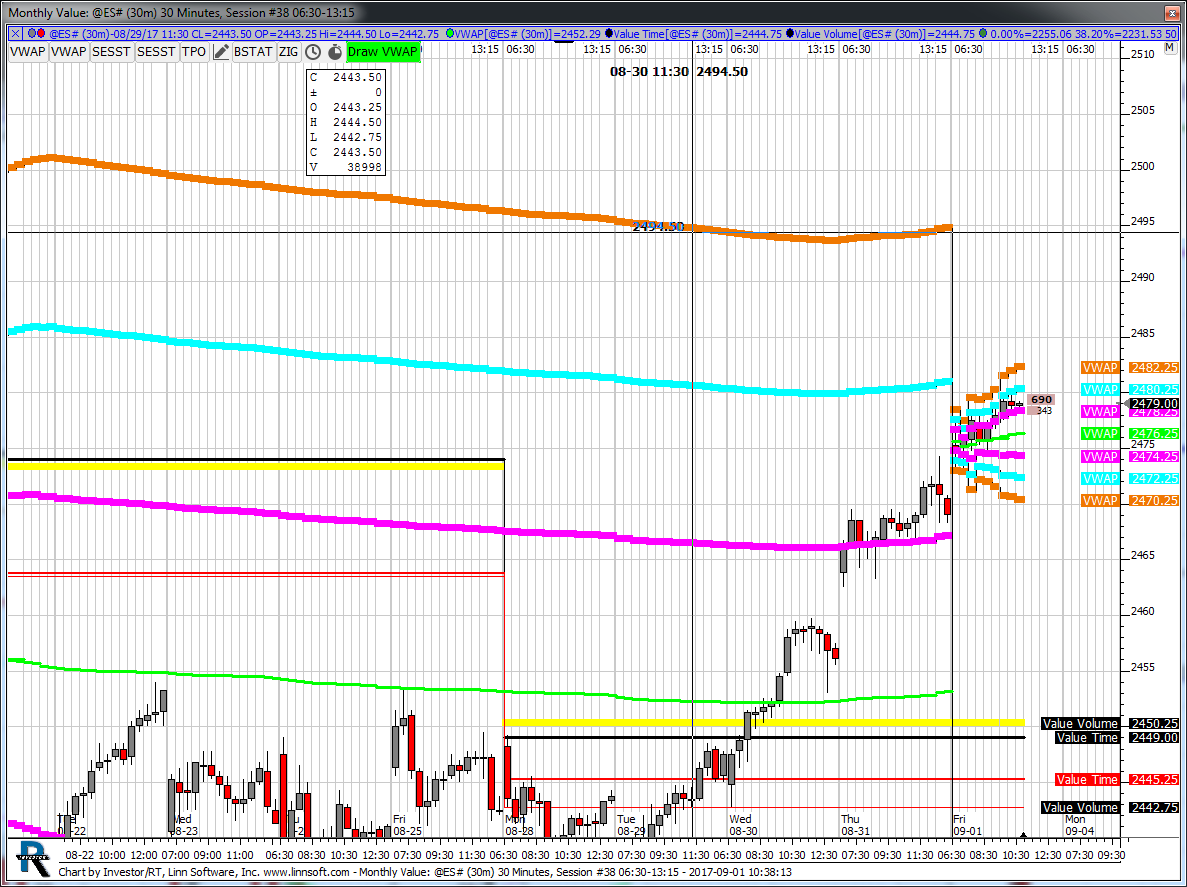 |
Monthly Value (@ES#) Marvin Baker [totalcount]
8 years 3 months ago
This chart was uploaded by Investor/RT 12.7.6 showing symbol: @ES#. |
View |
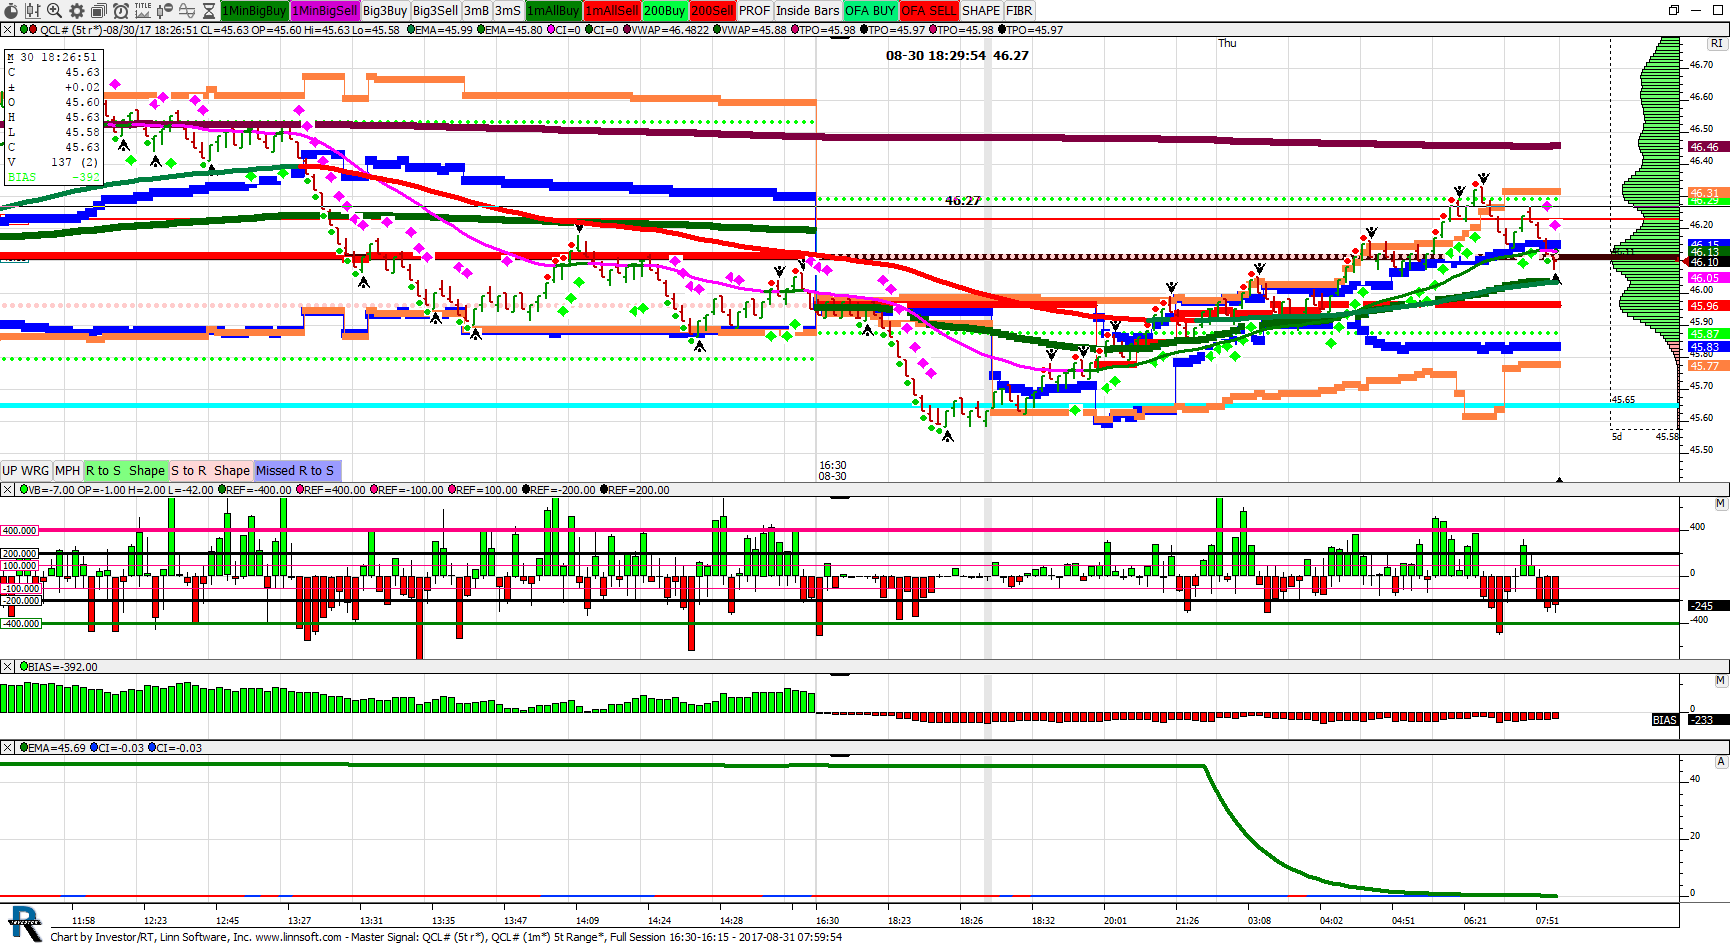 |
Master Signal (QCL#) dbutcherd [totalcount]
8 years 3 months ago
5 Day Profile values. This chart was uploaded by Investor/RT 12.6.1 showing symbol: QCL#. |
View |
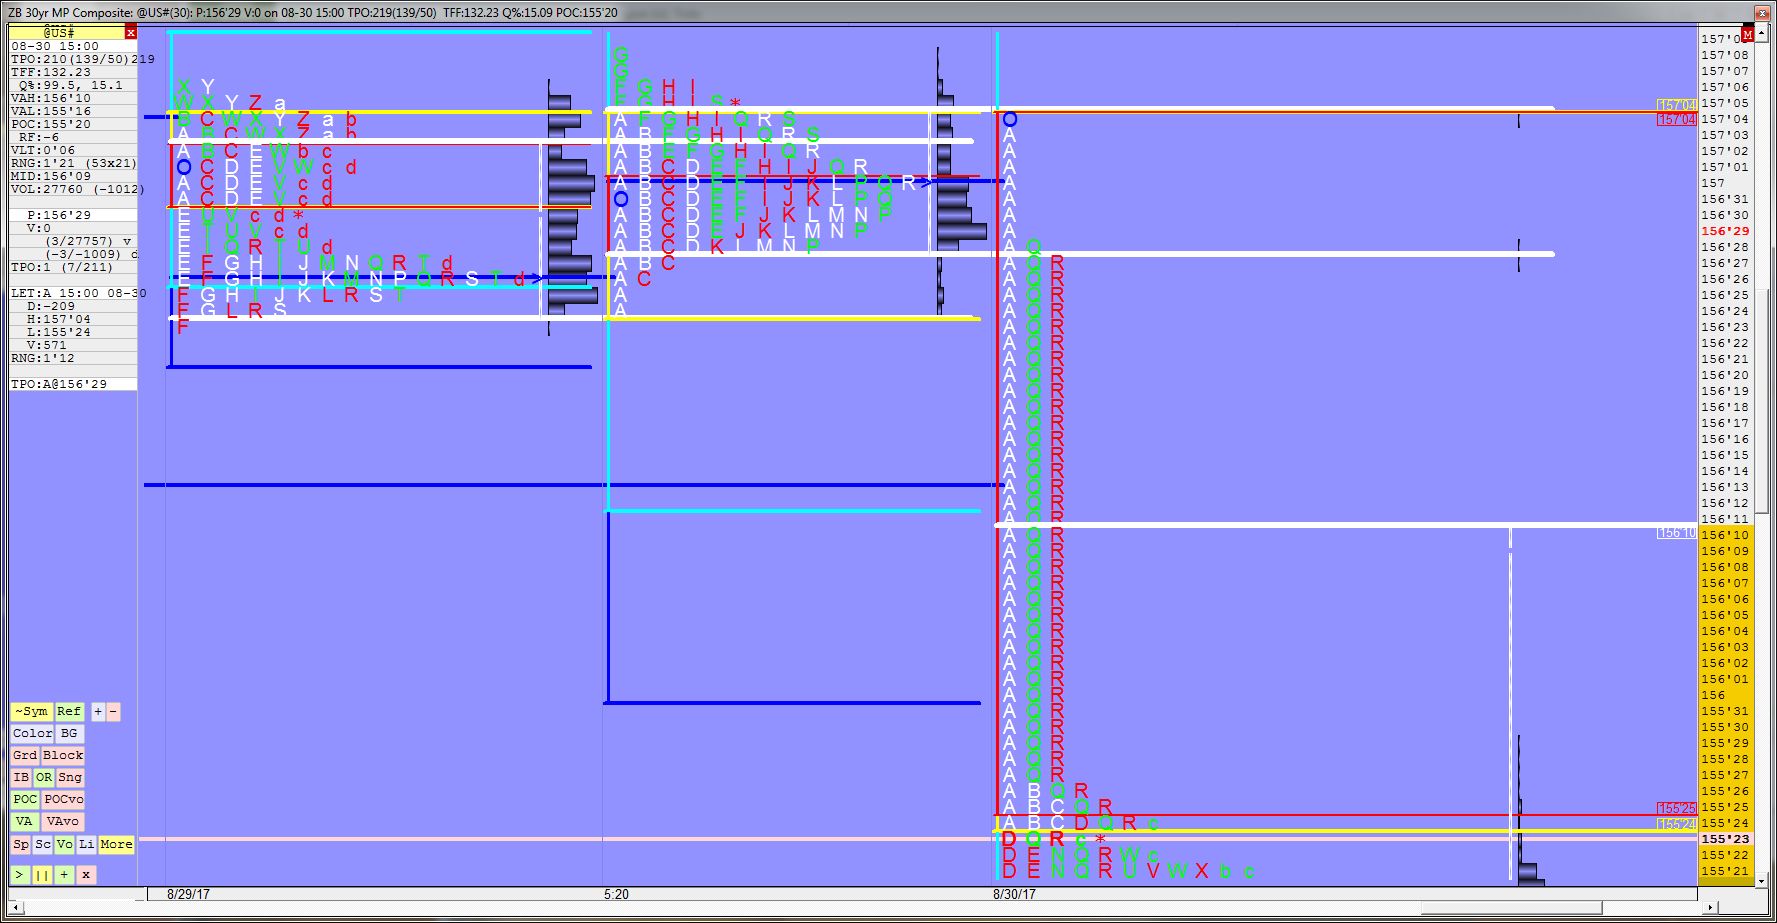 |
ZB 30yr MP Composite (@US#) garyvezina [totalcount]
8 years 3 months ago
This chart does not look right. Please verify the A and M period and price. This chart was uploaded by Investor/RT 12.7.3 showing symbol: @US#. |
View |
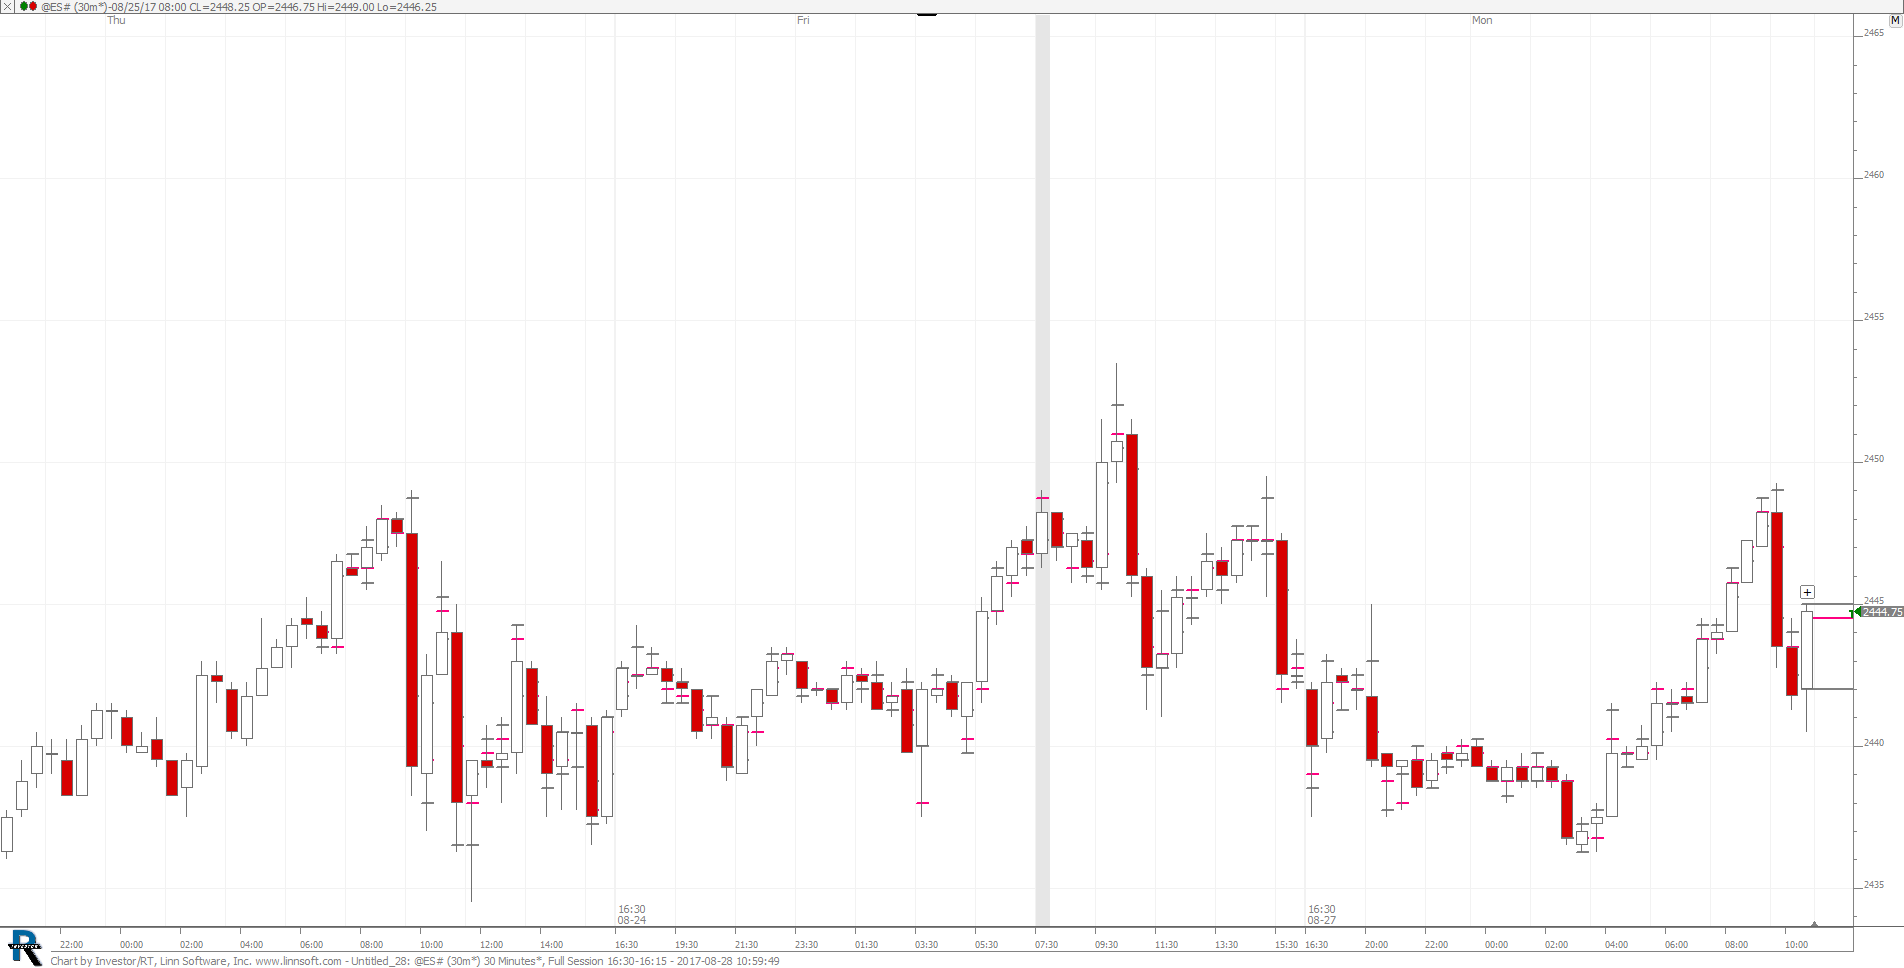 |
Untitled 28 (@ES#) scooke [totalcount]
8 years 3 months ago
This chart was uploaded by Investor/RT 13.1.1 showing symbol: @ES#. |
View |
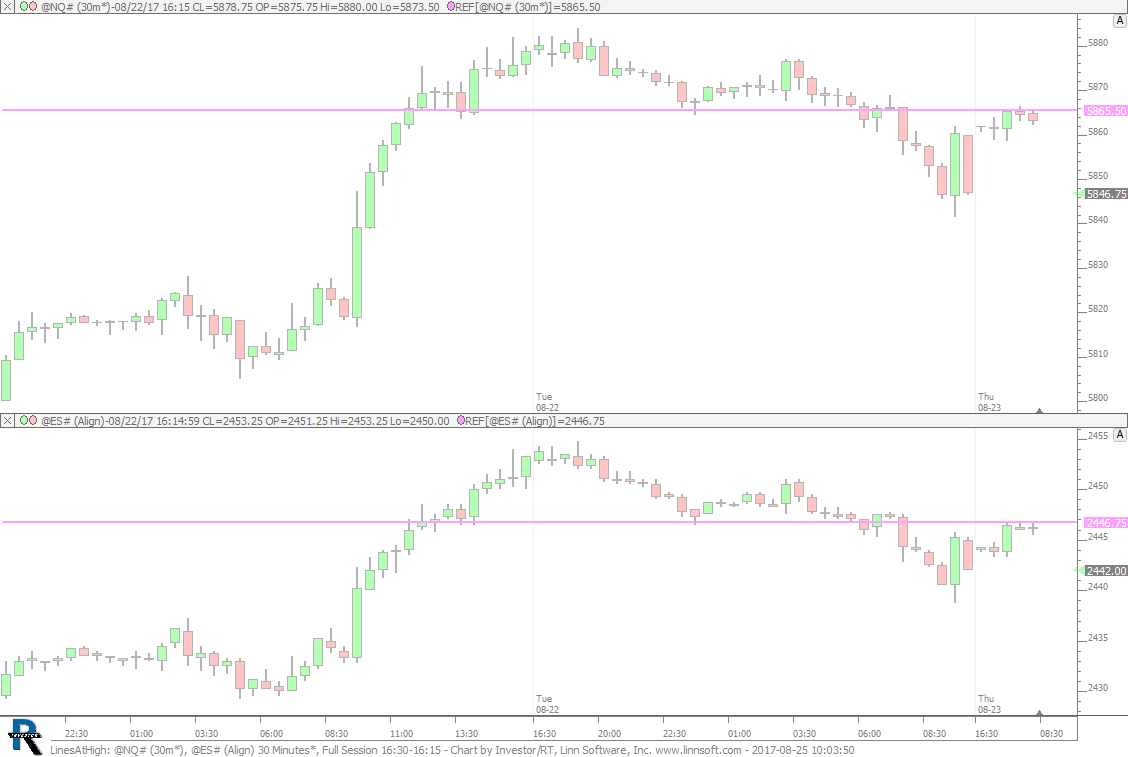 |
LinesAtHigh (@NQ#) cpayne [totalcount]
8 years 3 months ago
Lines At Highs. This chart was uploaded by Investor/RT 13.1.1 showing symbol: @NQ#. |
View |
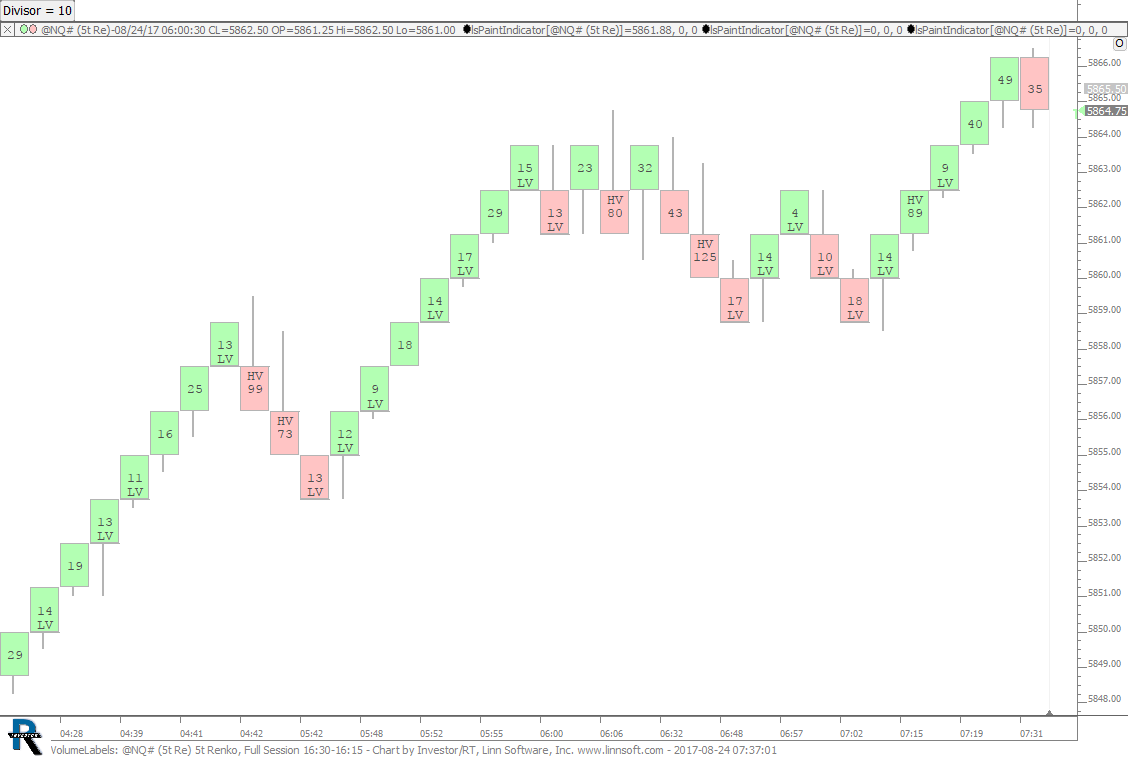 |
VolumeLabels (@NQ#) cpayne [totalcount]
8 years 4 months ago
Volume Labeling using Paint Indicator. This chart was uploaded by Investor/RT 12.7.7 showing symbol: @NQ#. |
View |
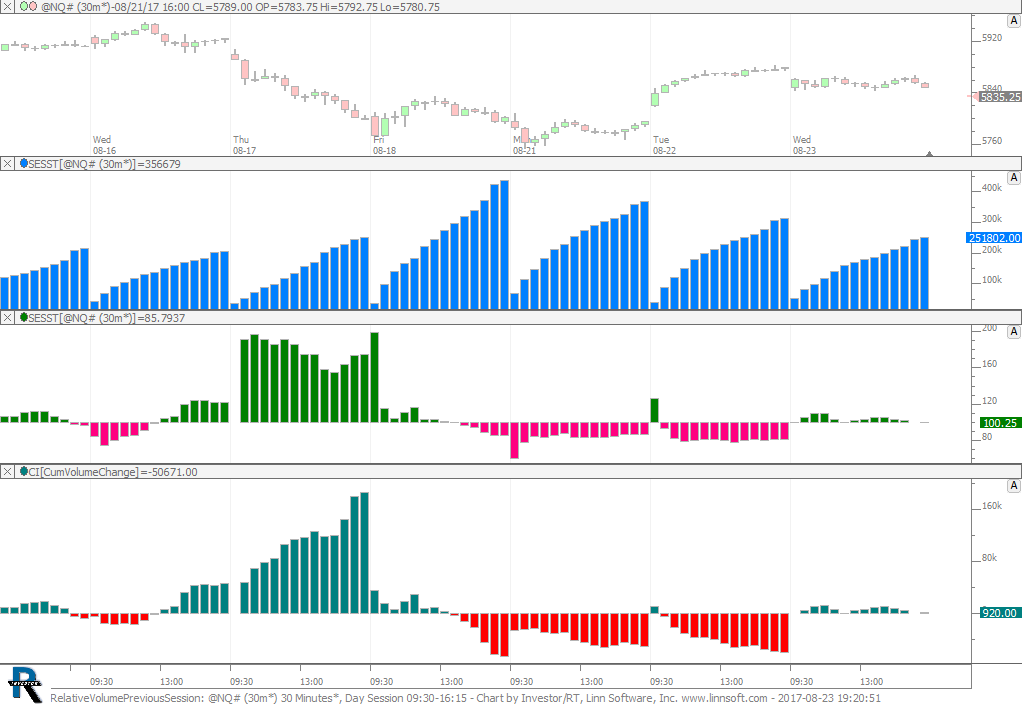 |
RelativeVolumePreviousSession (@NQ#) cpayne [totalcount]
8 years 4 months ago
Relative Volume Previous Session. This chart was uploaded by Investor/RT 12.7.7 showing symbol: @NQ#. |
View |