 |
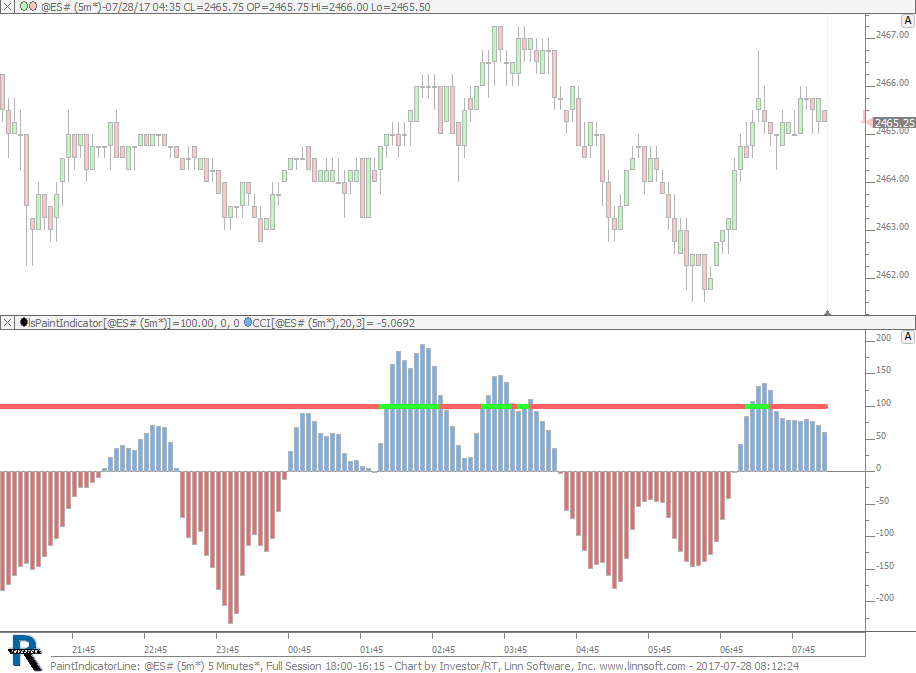
PaintIndicatorLine (@ES#) cpayne [totalcount]
8 years 4 months ago
Painted Reference Line. This chart was uploaded by Investor/RT 12.7.7 showing symbol: @ES#. |
View |
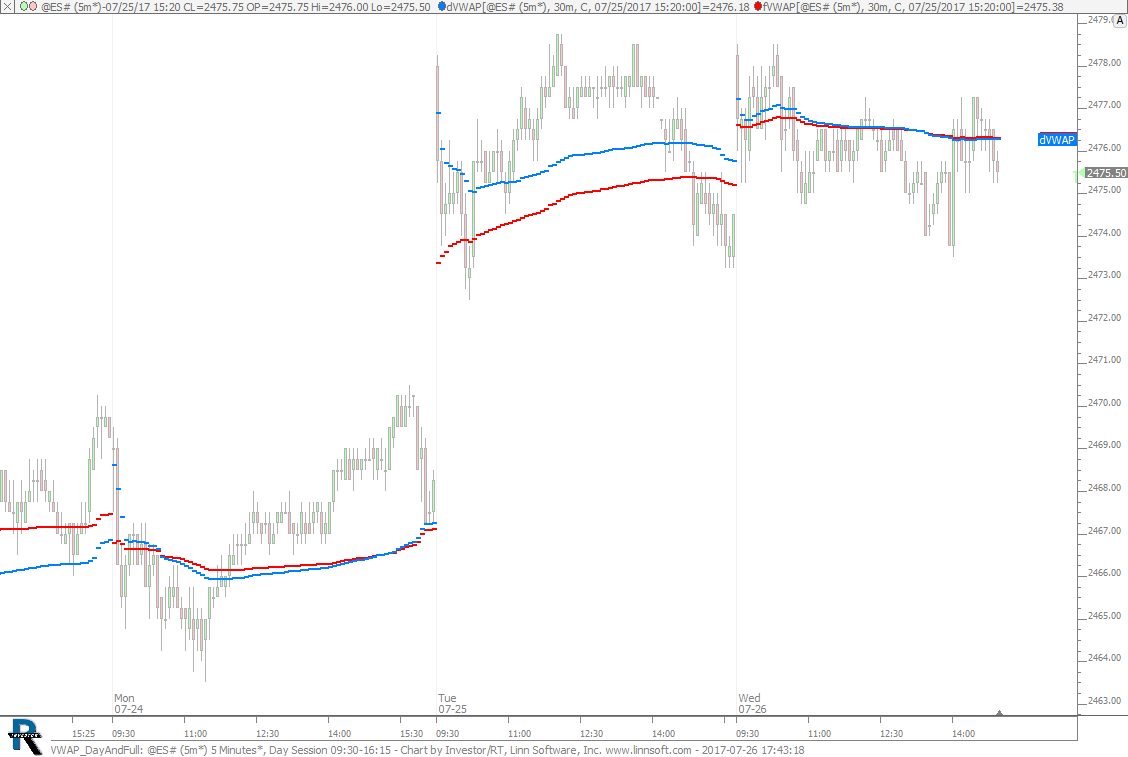 |
VWAP DayAndFull (@ES#) cpayne [totalcount]
8 years 4 months ago
Day (Blue) and Full (Red) Session VWAP. Both are independant of session of chart. This chart was uploaded by Investor/RT 12.7.7 showing symbol: @ES#. |
View |
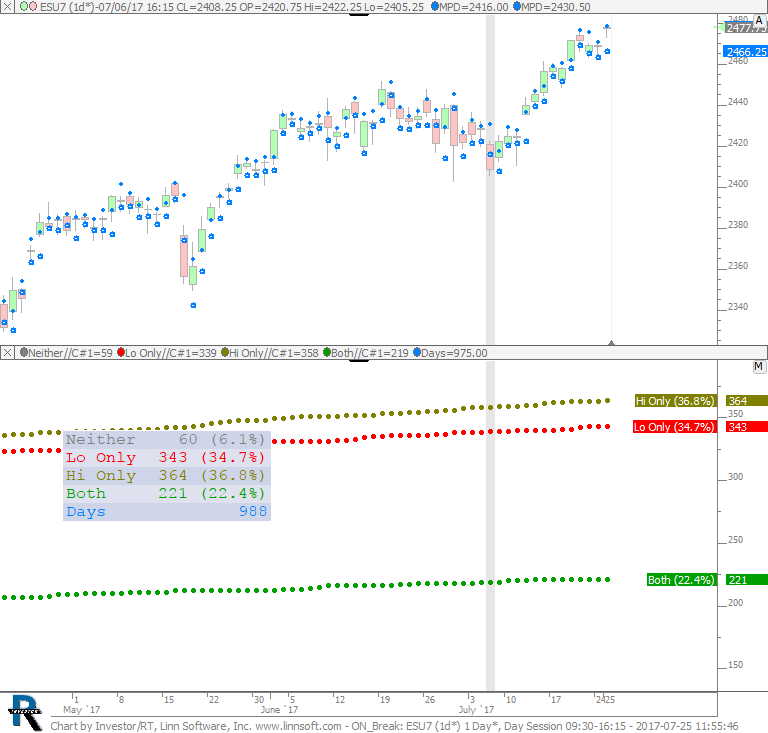 |
ON Break (ESU7) SPetkov [totalcount]
8 years 5 months ago
This chart was uploaded by Investor/RT 12.7.6 showing symbol: ESU7. |
View |
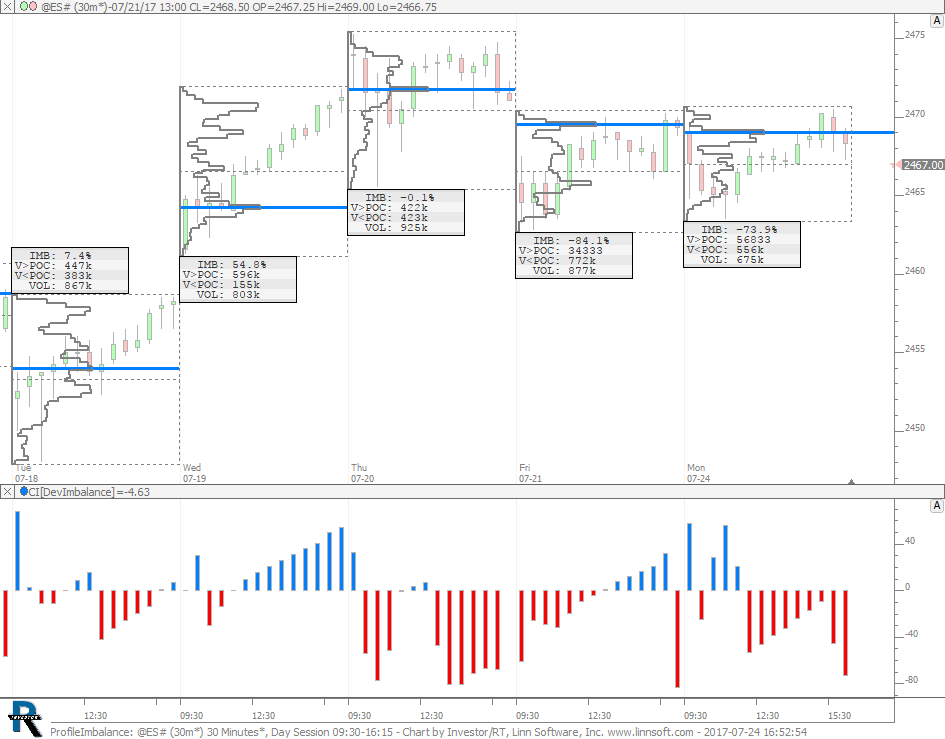 |
ProfileImbalance (@ES#) cpayne [totalcount]
8 years 5 months ago
Profile Imbalance. This chart was uploaded by Investor/RT 12.7.7 showing symbol: @ES#. |
View |
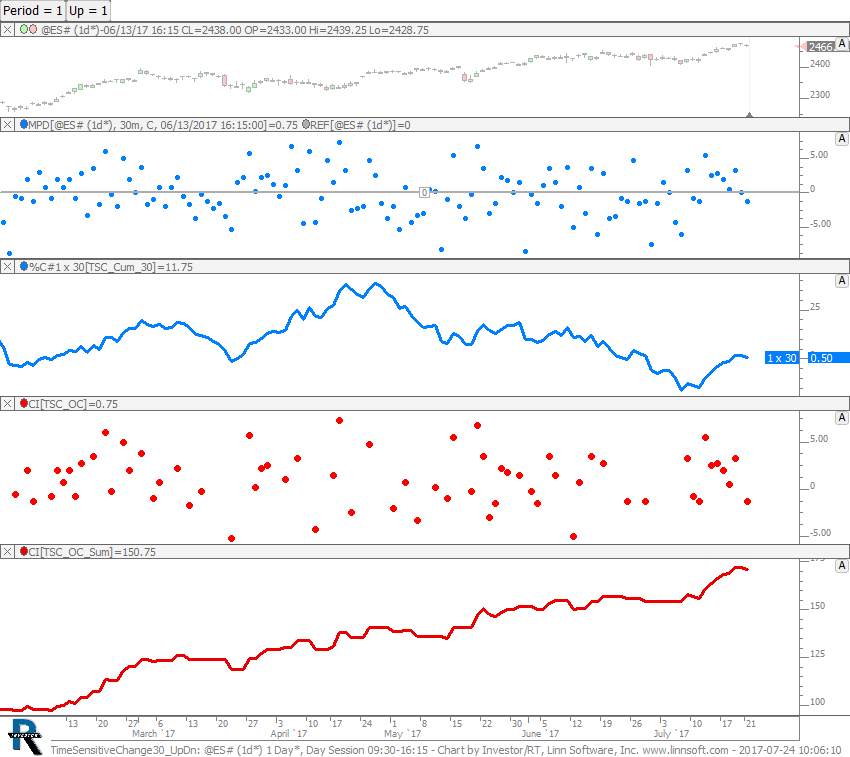 |
TimeSensitiveChange30 UpDn (@ES#) cpayne [totalcount]
8 years 5 months ago
Time Sensitive Change - Up or Down Days (Up = 1 for Up Days and Up = 0 for Down Days). This chart was uploaded by Investor/RT 12.7.7 showing symbol: @ES#. |
View |
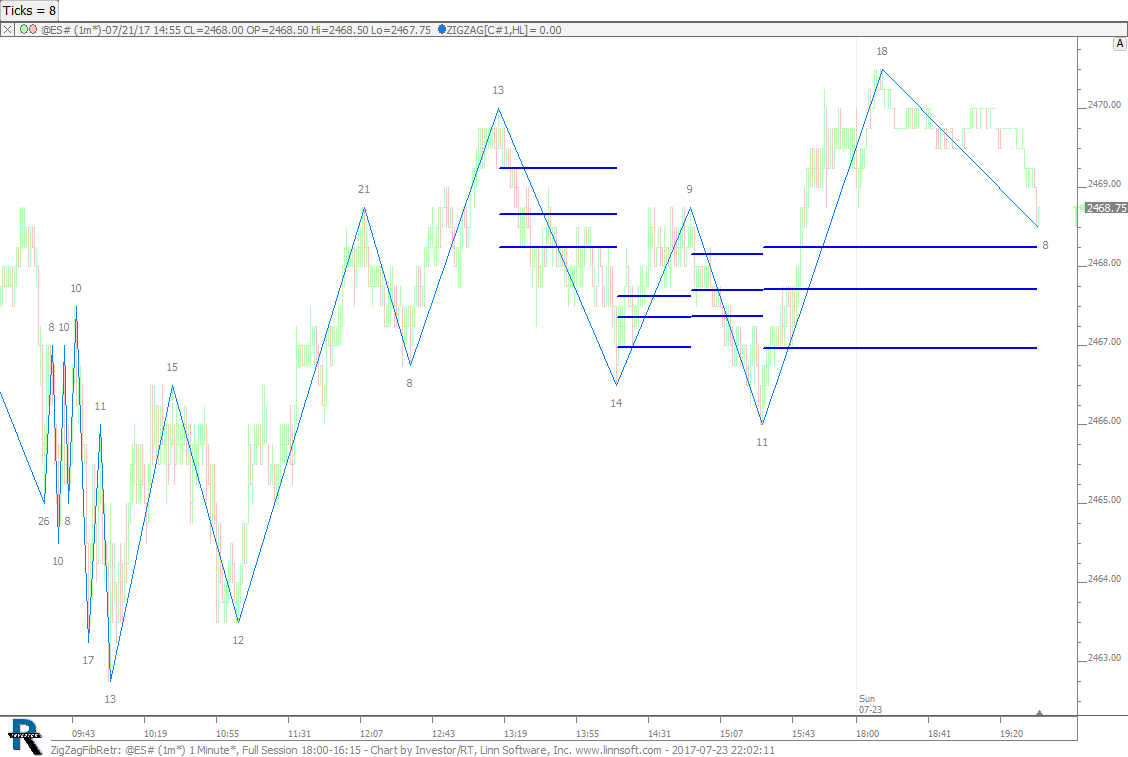 |
ZigZagFibRetr (@ES#) cpayne [totalcount]
8 years 5 months ago
This chart was uploaded by Investor/RT 12.7.7 showing symbol: @ES#. |
View |
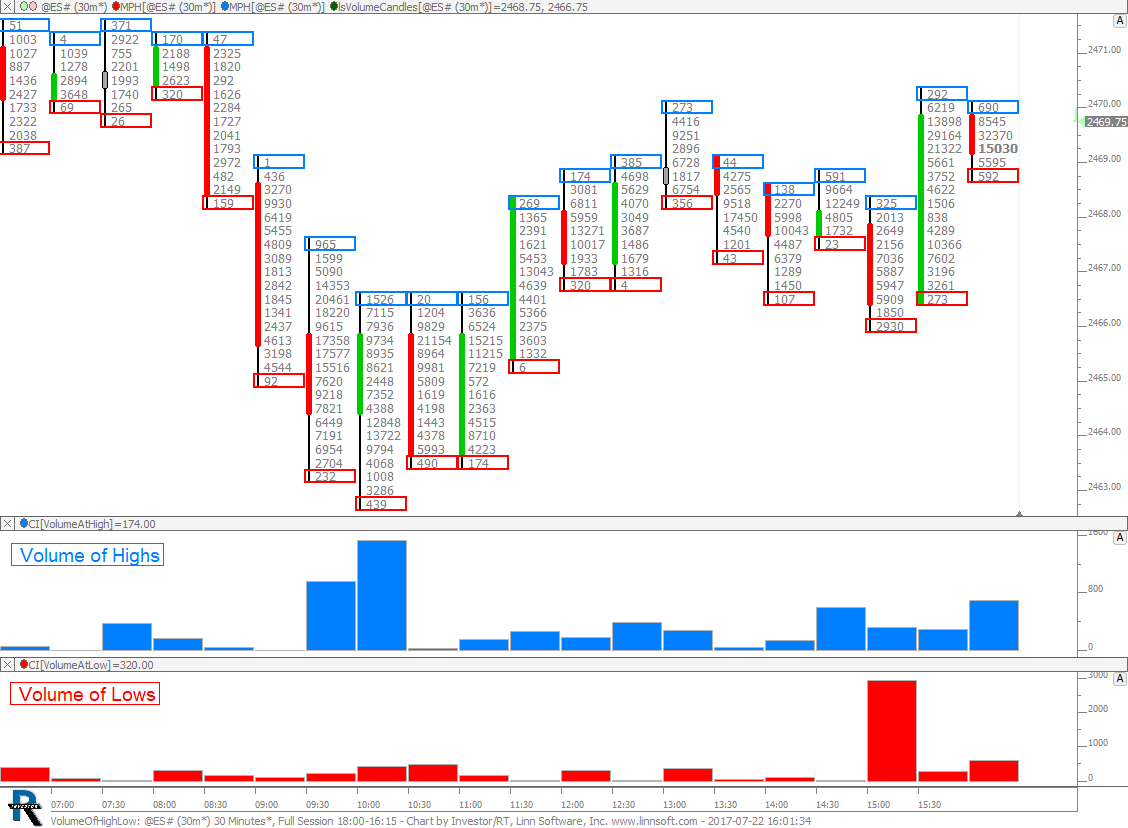 |
VolumeOfHighLow (@ES#) cpayne [totalcount]
8 years 5 months ago
Volume of High and Low Prices in RTL. This chart was uploaded by Investor/RT 12.7.7 showing symbol: @ES#. |
View |
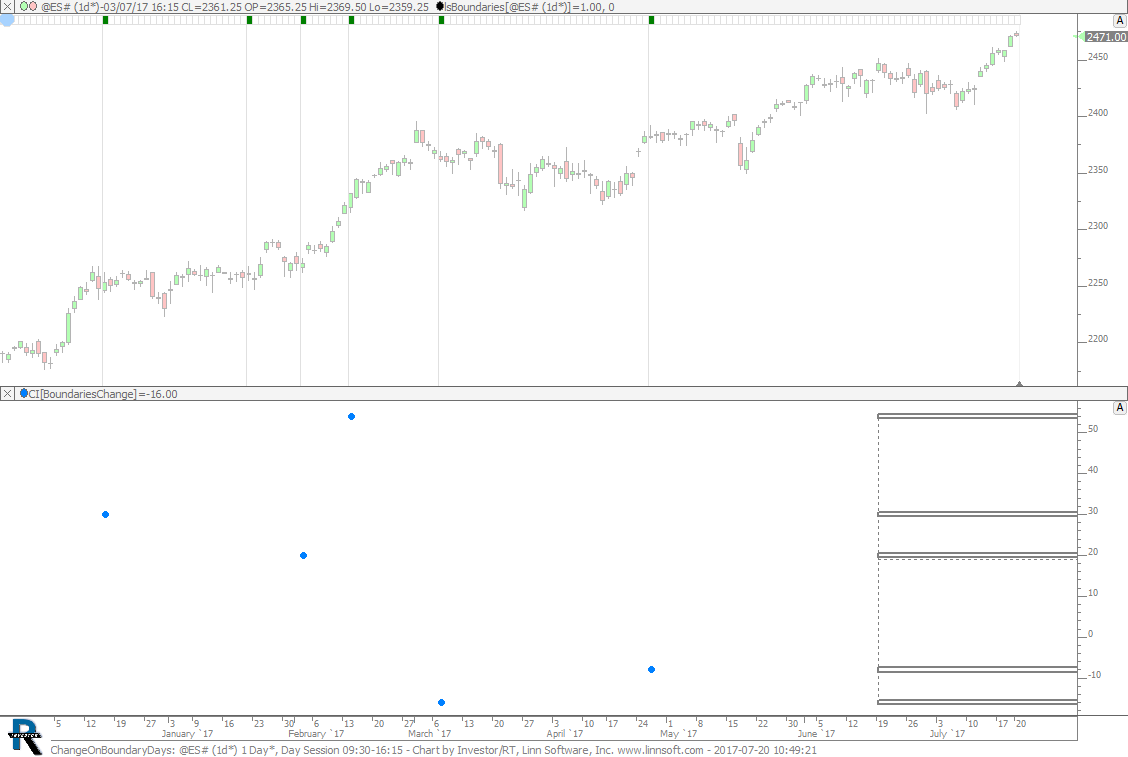 |
ChangeOnBoundaryDays (@ES#) cpayne [totalcount]
8 years 5 months ago
Change on Boundary Days Profiled. This chart was uploaded by Investor/RT 12.7.7 showing symbol: @ES#. |
View |
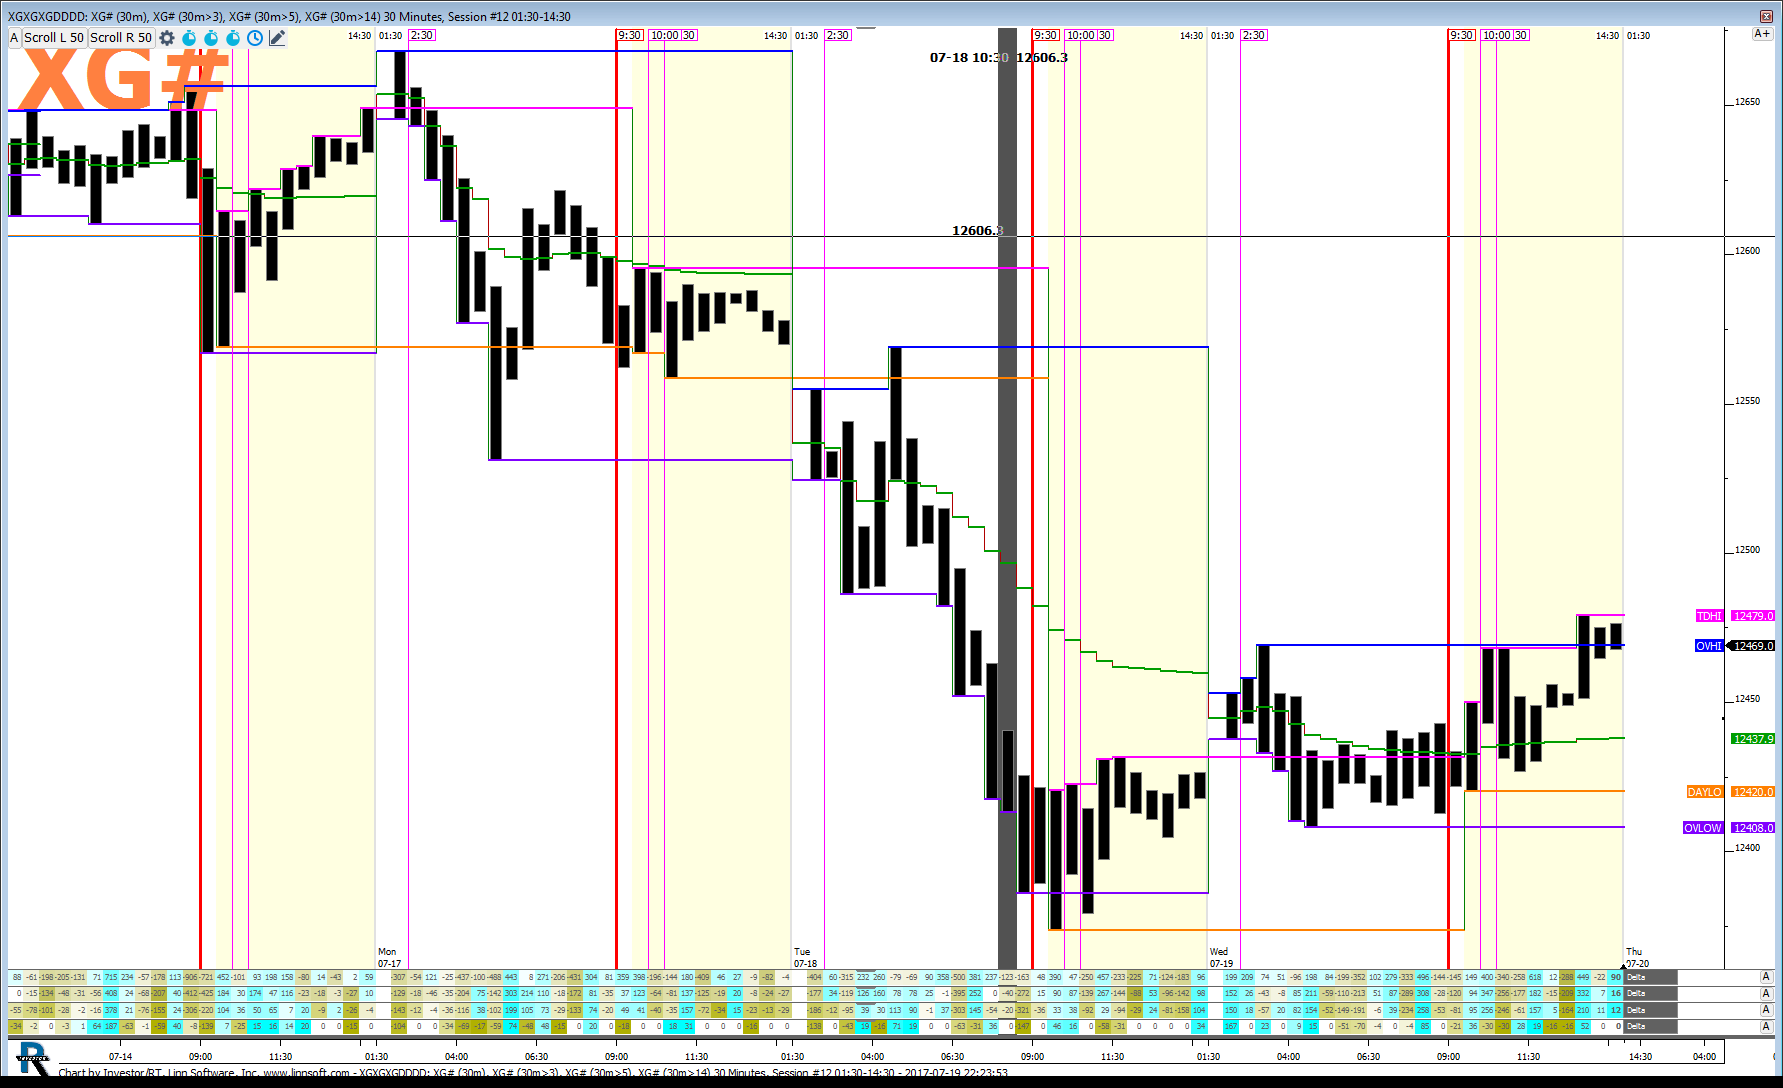 |
XGXGXGDDDD (XG#) hsams1 [totalcount]
8 years 5 months ago
CURTIS. This chart was uploaded by Investor/RT 12.7.6 showing symbol: XG#. |
View |
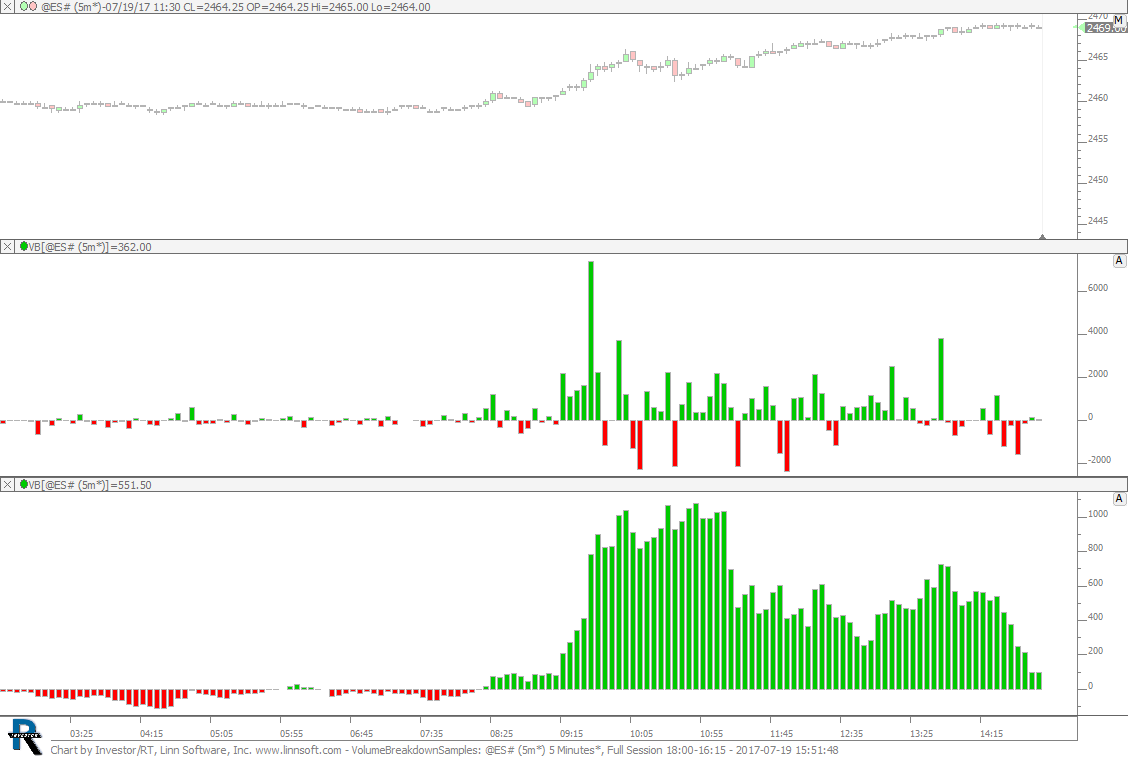 |
VolumeBreakdownSamples (@ES#) cpayne [totalcount]
8 years 5 months ago
Volume Breakdown Samples. This chart was uploaded by Investor/RT 12.7.6 showing symbol: @ES#. |
View |
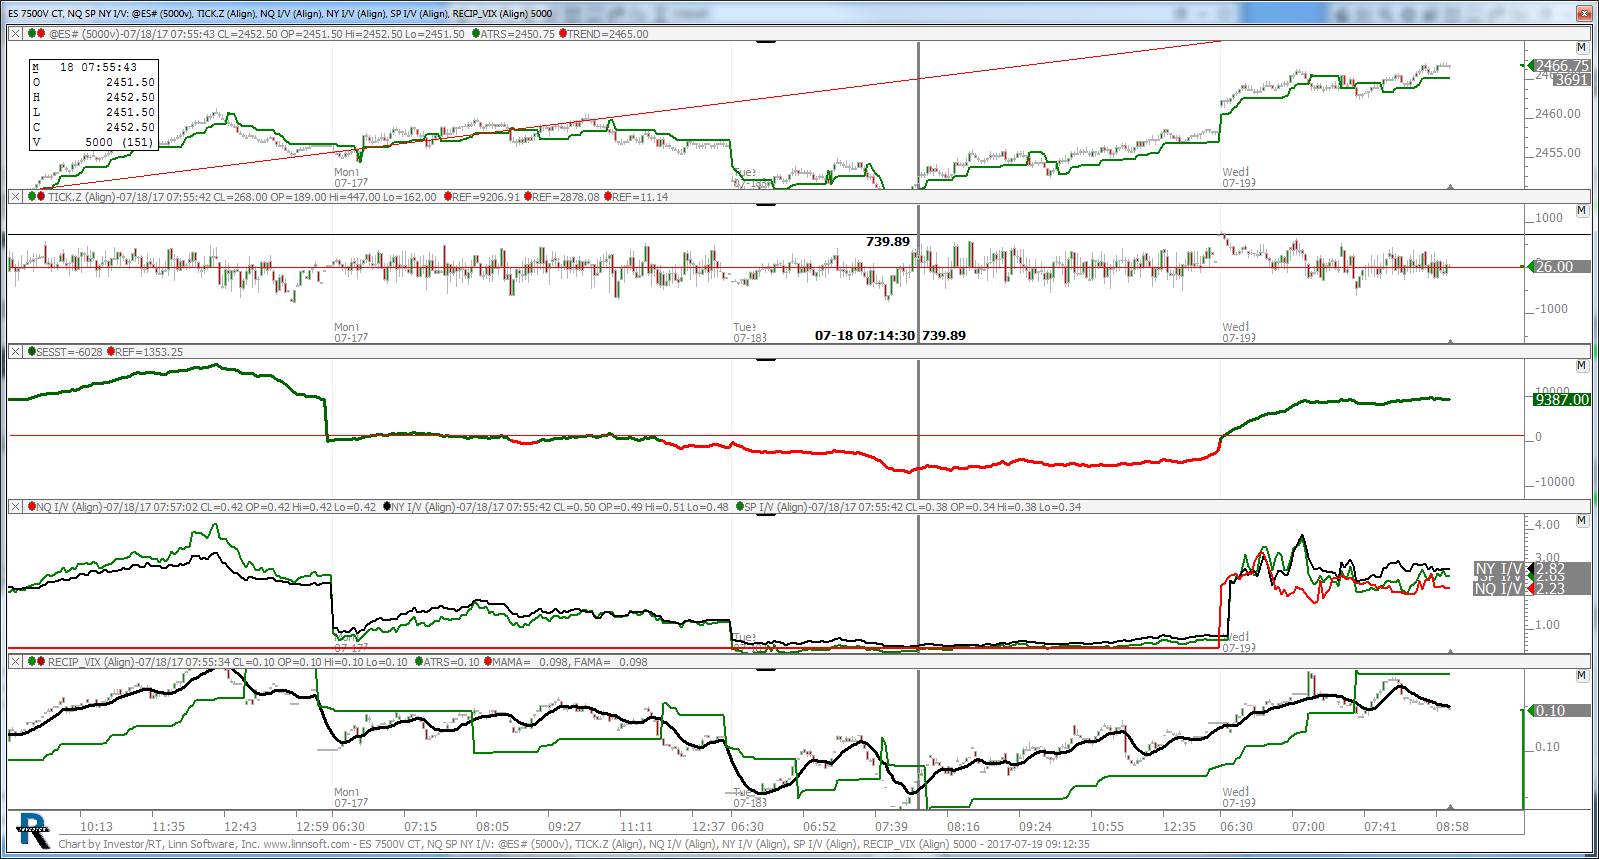 |
ES 7500V CT NQ SP NY I V (@ES#) kencassorla [totalcount]
8 years 5 months ago
7500v. This chart was uploaded by Investor/RT 12.7.6 showing symbol: @ES#. |
View |
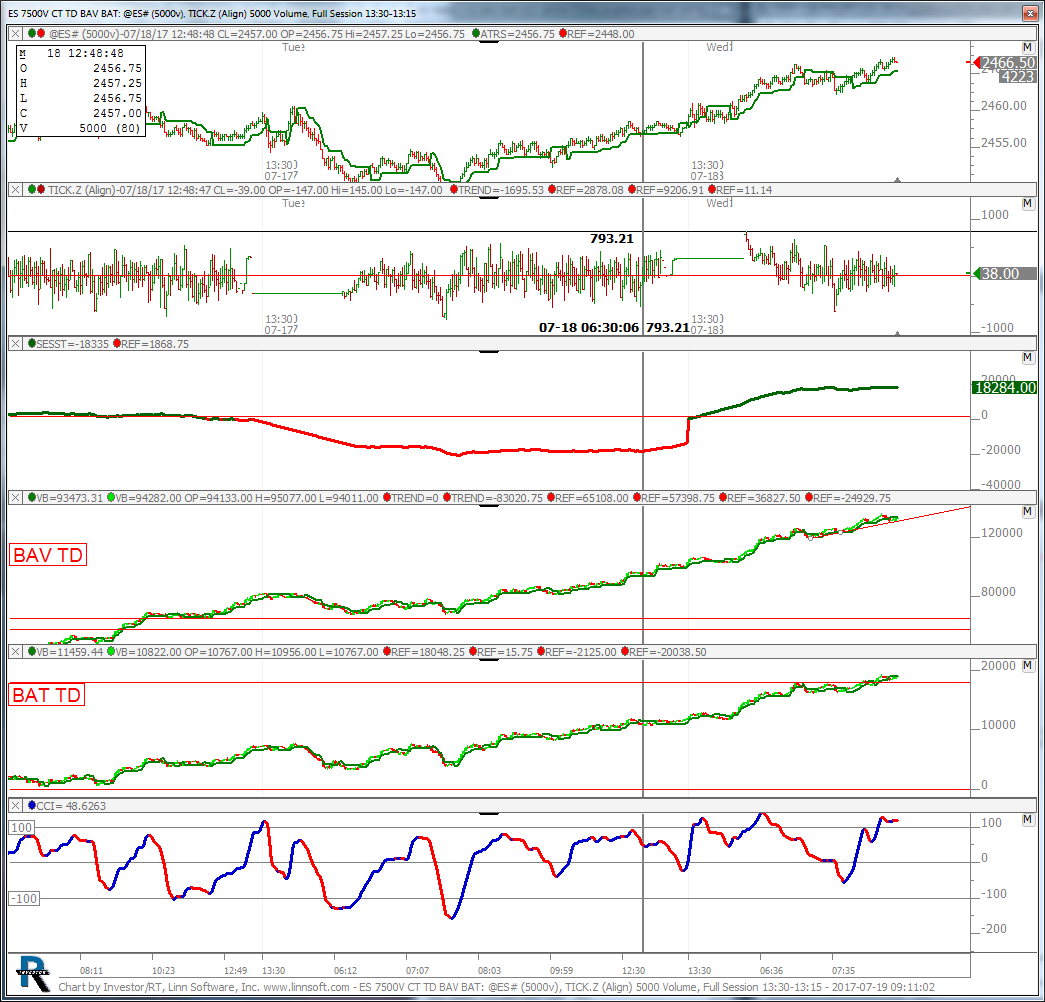 |
ES 7500V CT TD BAV BAT (@ES#) kencassorla [totalcount]
8 years 5 months ago
7500v. This chart was uploaded by Investor/RT 12.7.6 showing symbol: @ES#. |
View |
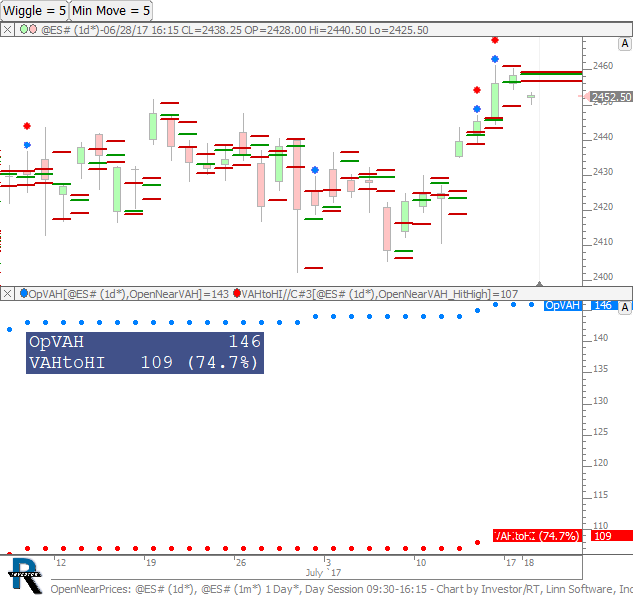 |
OpenNearPrices (@ES#) cpayne [totalcount]
8 years 5 months ago
Open Near Prev VAH and Move to Prev High. This chart was uploaded by Investor/RT 12.7.7 showing symbol: @ES#. |
View |
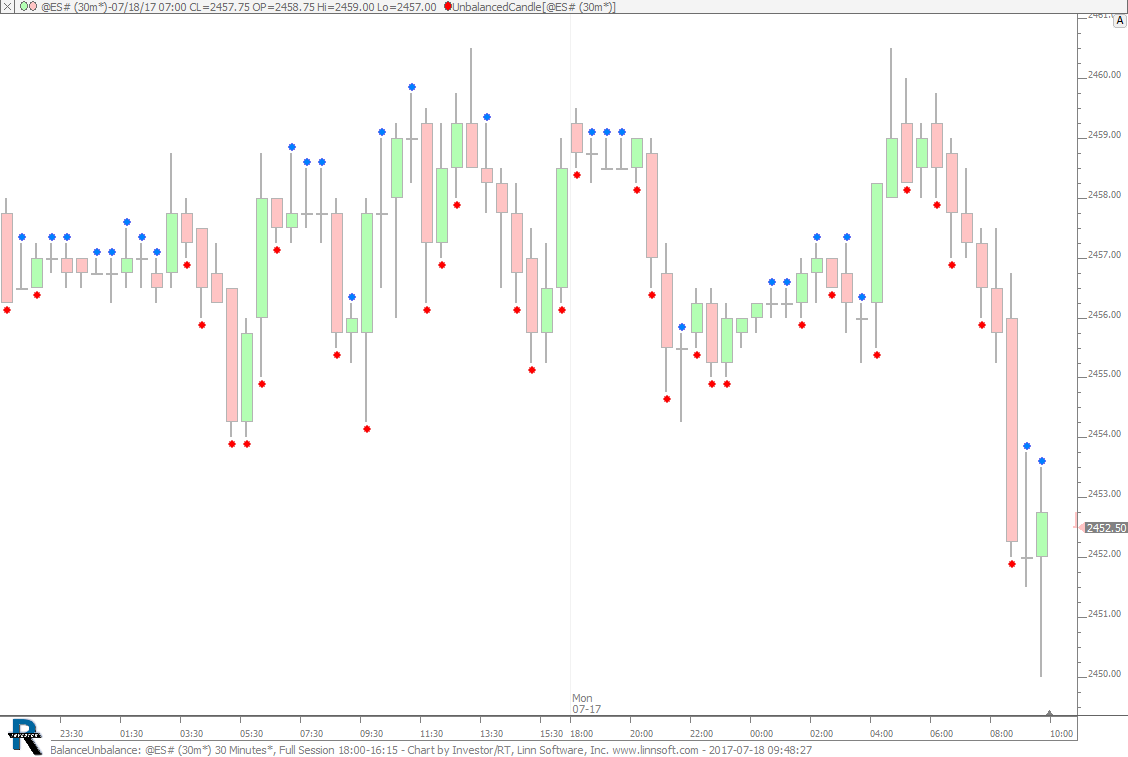 |
BalanceUnbalance (@ES#) cpayne [totalcount]
8 years 5 months ago
Balanced and Unbalanced Candles. This chart was uploaded by Investor/RT 12.7.7 showing symbol: @ES#. |
View |
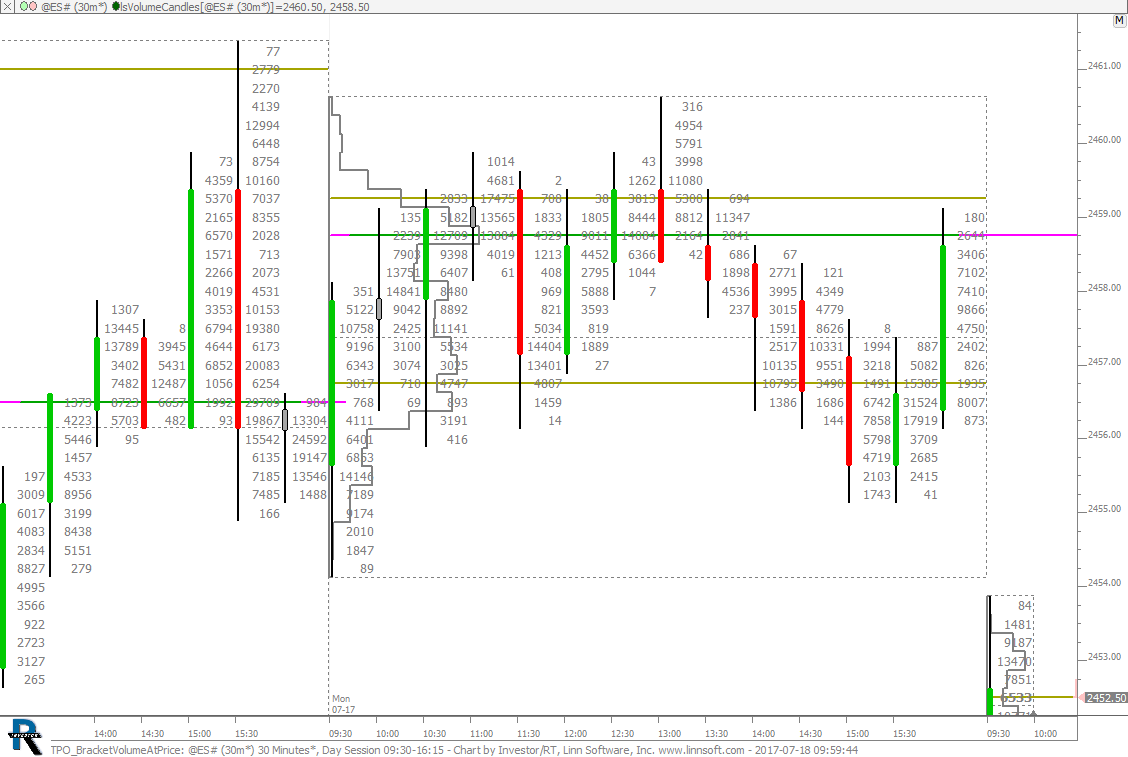 |
TPO BracketVolumeAtPrice (@ES#) cpayne [totalcount]
8 years 5 months ago
This chart was uploaded by Investor/RT 12.7.7 showing symbol: @ES#. |
View |
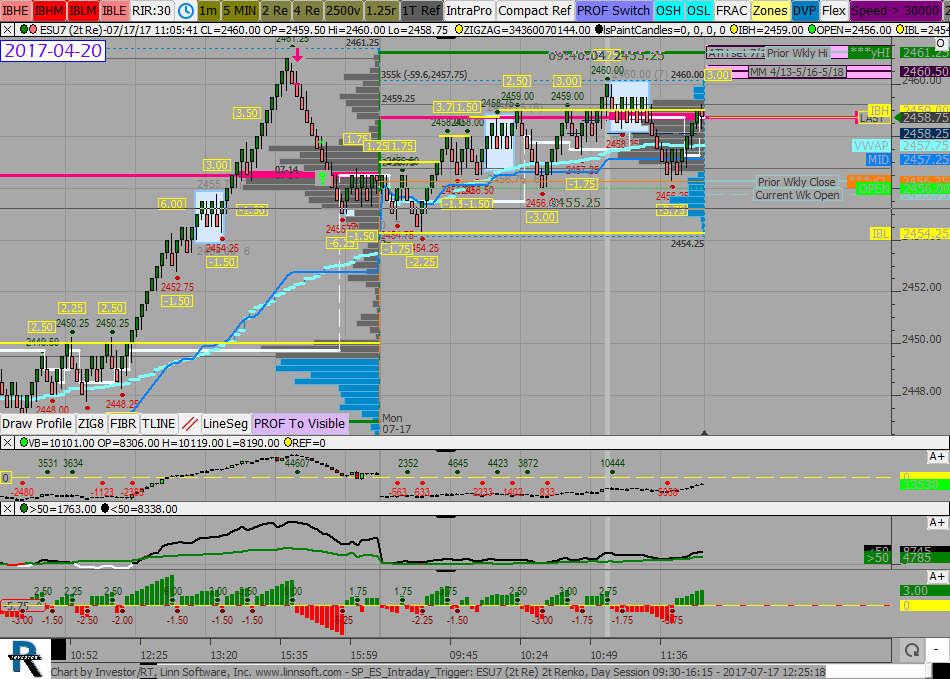 |
SP ES Intraday Trigger (ESU7) SPetkov [totalcount]
8 years 5 months ago
This chart was uploaded by Investor/RT 12.7.6 showing symbol: ESU7. |
View |
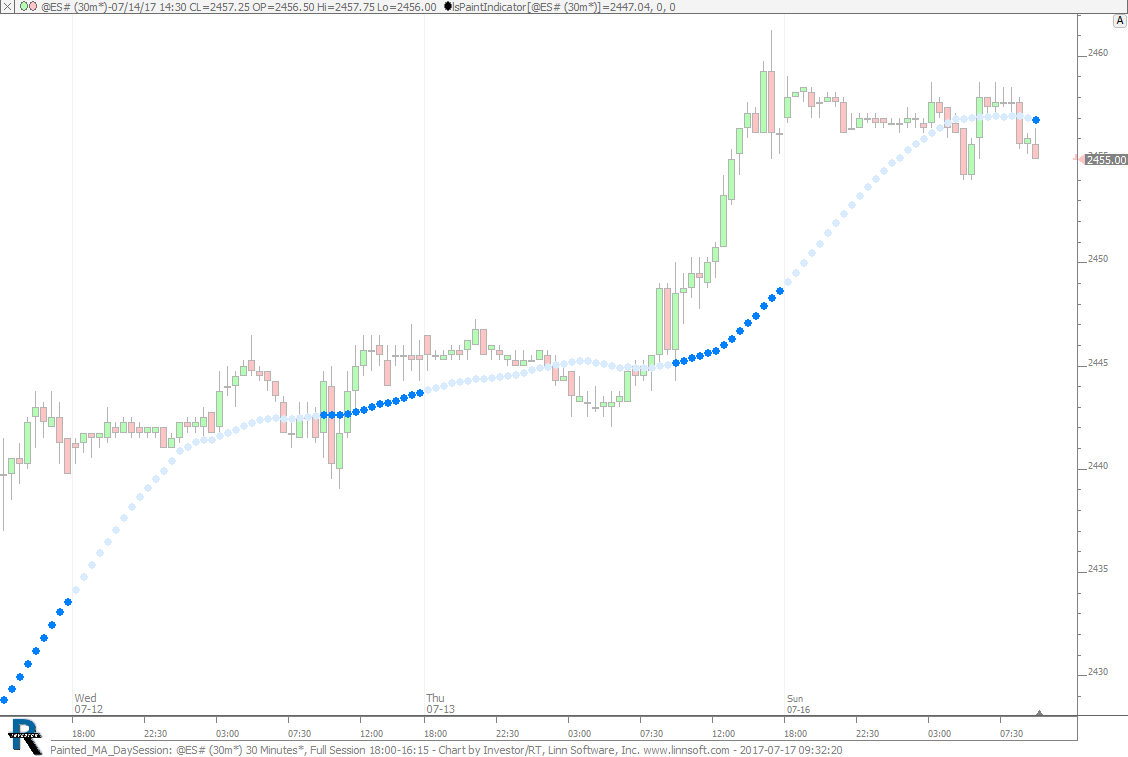 |
Painted MA DaySession (@ES#) cpayne [totalcount]
8 years 5 months ago
Moving Average Painted During Day Session. This chart was uploaded by Investor/RT 12.7.7 showing symbol: @ES#. |
View |
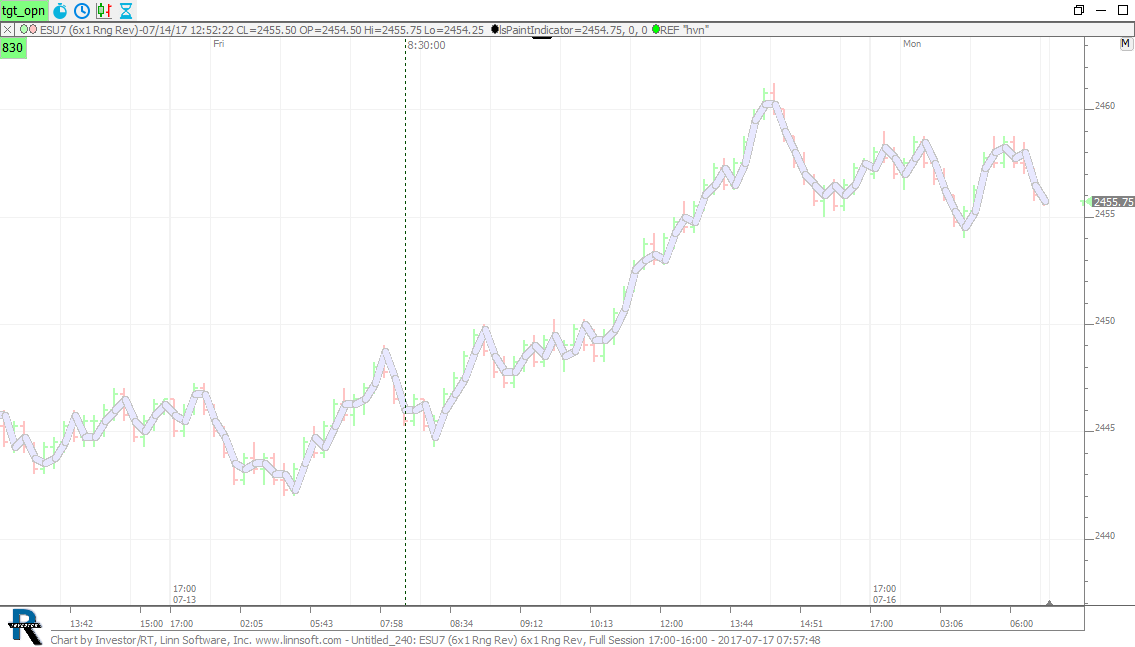 |
Untitled (ESU7) ctj0601 [totalcount]
8 years 5 months ago
IsPaintIndicator - how to color by session?. This chart was uploaded by Investor/RT 12.7.6 showing symbol: ESU7. |
View |
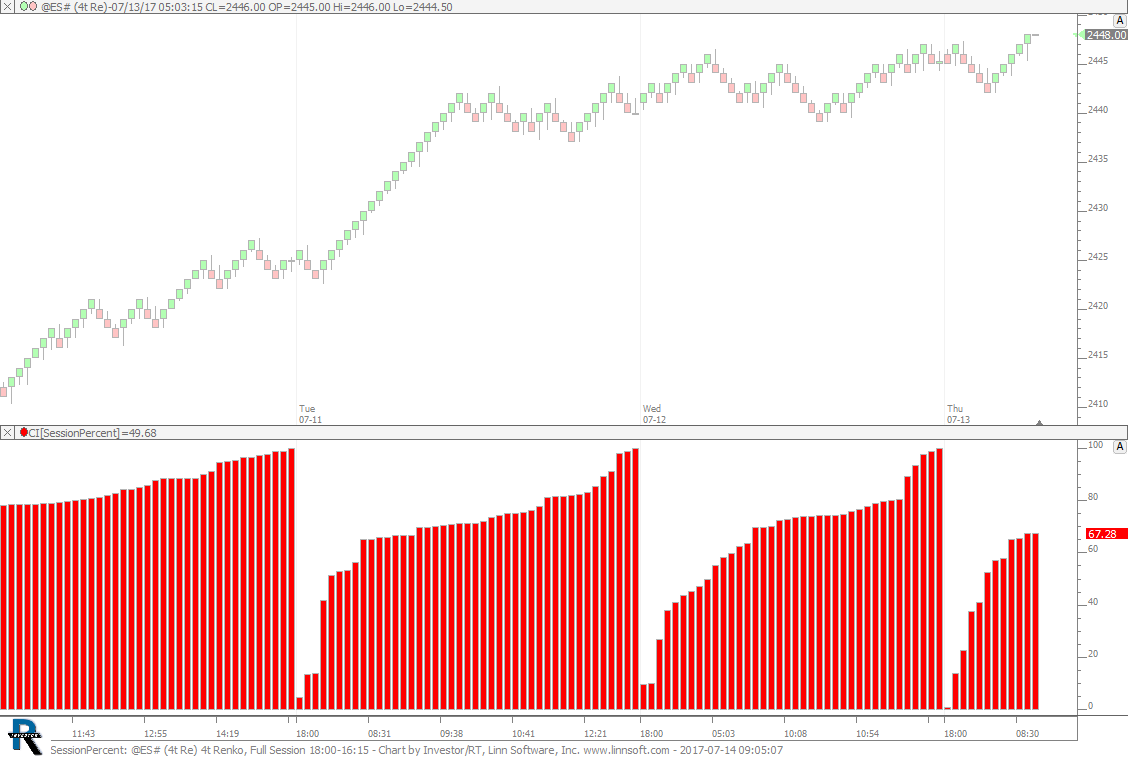 |
SessionPercent (@ES#) cpayne [totalcount]
8 years 5 months ago
Day Percent Historically. This chart was uploaded by Investor/RT 12.7.7 showing symbol: @ES#. |
View |
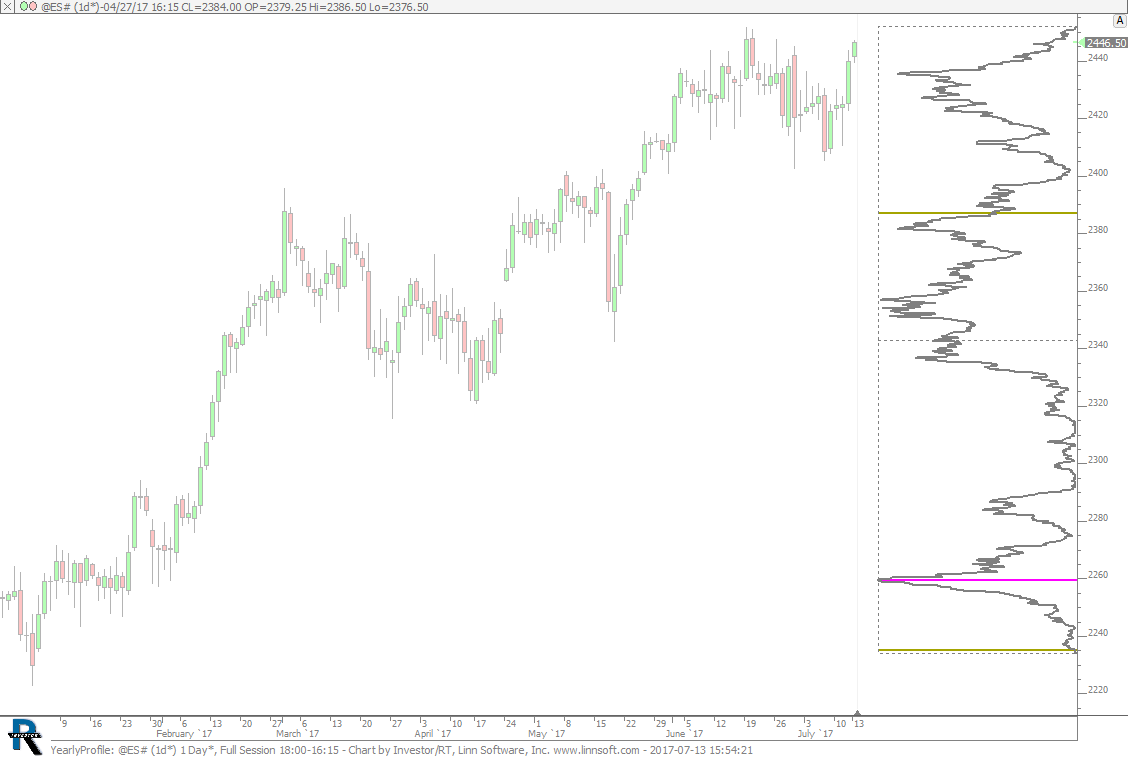 |
YearlyProfile (@ES#) cpayne [totalcount]
8 years 5 months ago
Yearly Profile. This chart was uploaded by Investor/RT 12.7.7 showing symbol: @ES#. |
View |
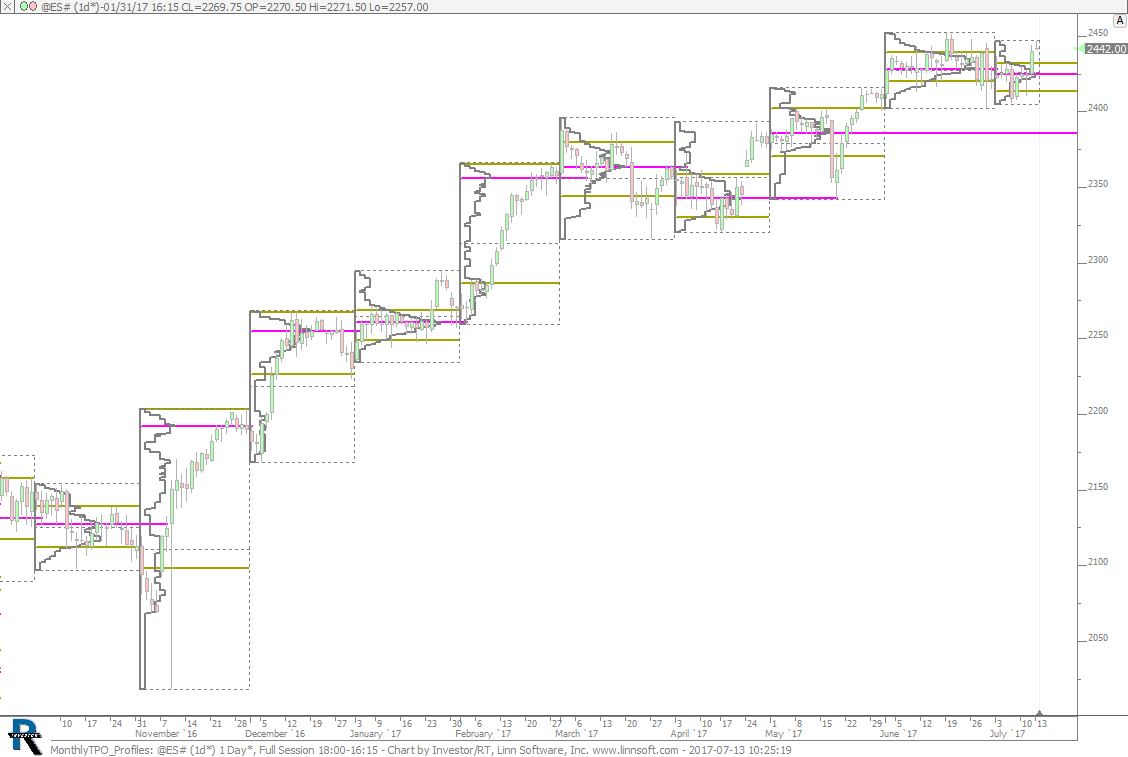 |
MonthlyTPO Profiles (@ES#) cpayne [totalcount]
8 years 5 months ago
Monthly TPO Chart. This chart was uploaded by Investor/RT 12.7.7 showing symbol: @ES#. |
View |
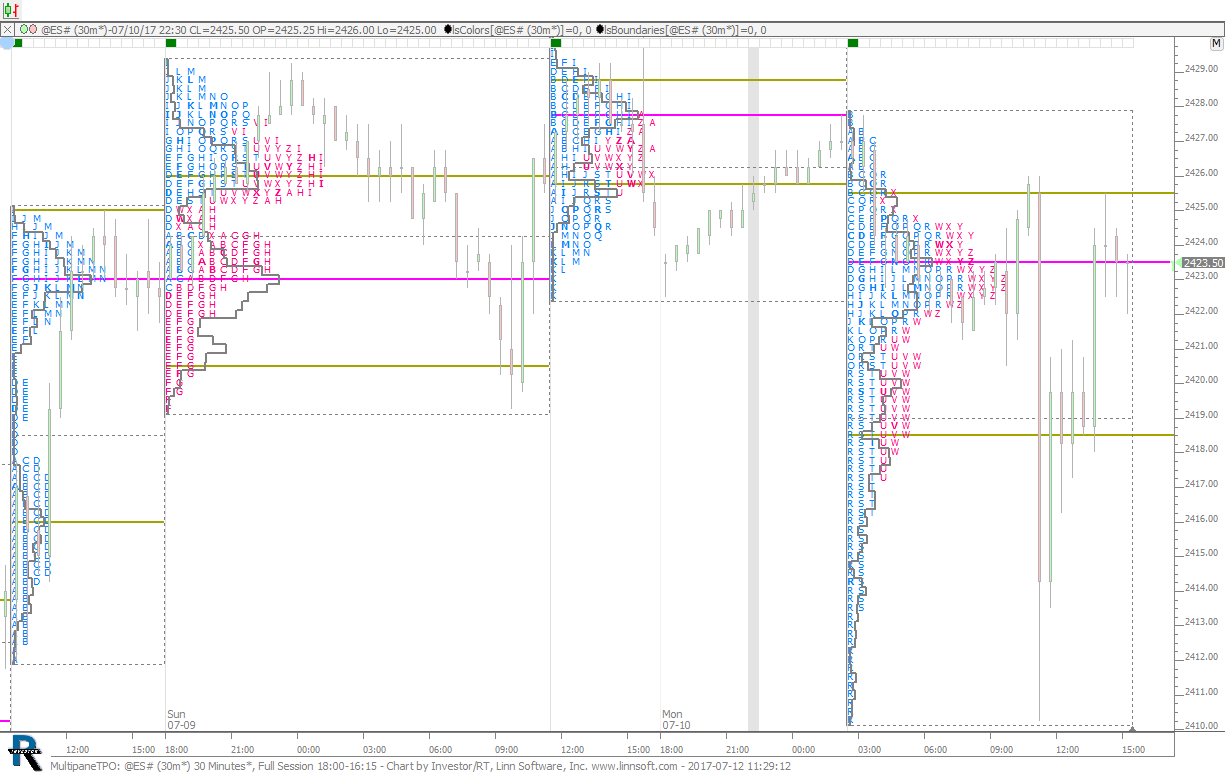 |
MultipaneTPO (@ES#) cpayne [totalcount]
8 years 5 months ago
TPO Candle Chart. This chart was uploaded by Investor/RT 12.7.7 showing symbol: @ES#. |
View |
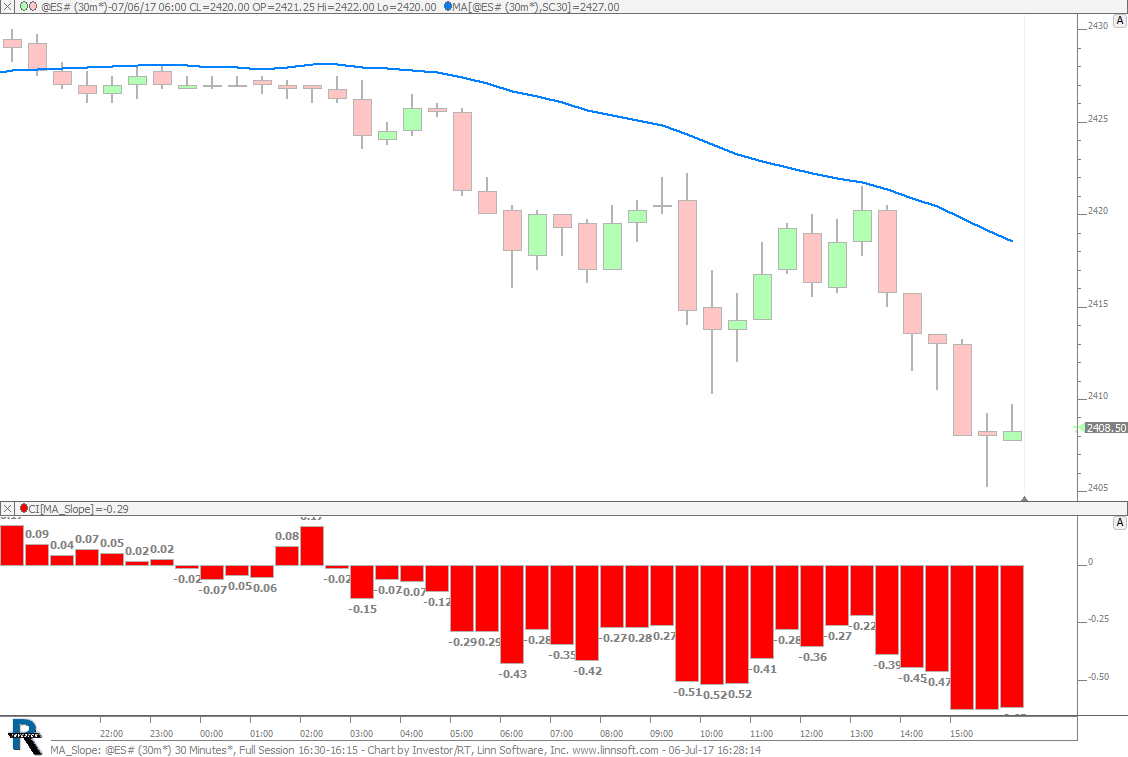 |
MA Slope (@ES#) cpayne [totalcount]
8 years 5 months ago
MA Slope. This chart was uploaded by Investor/RT 12.7.7 showing symbol: @ES#. |
View |
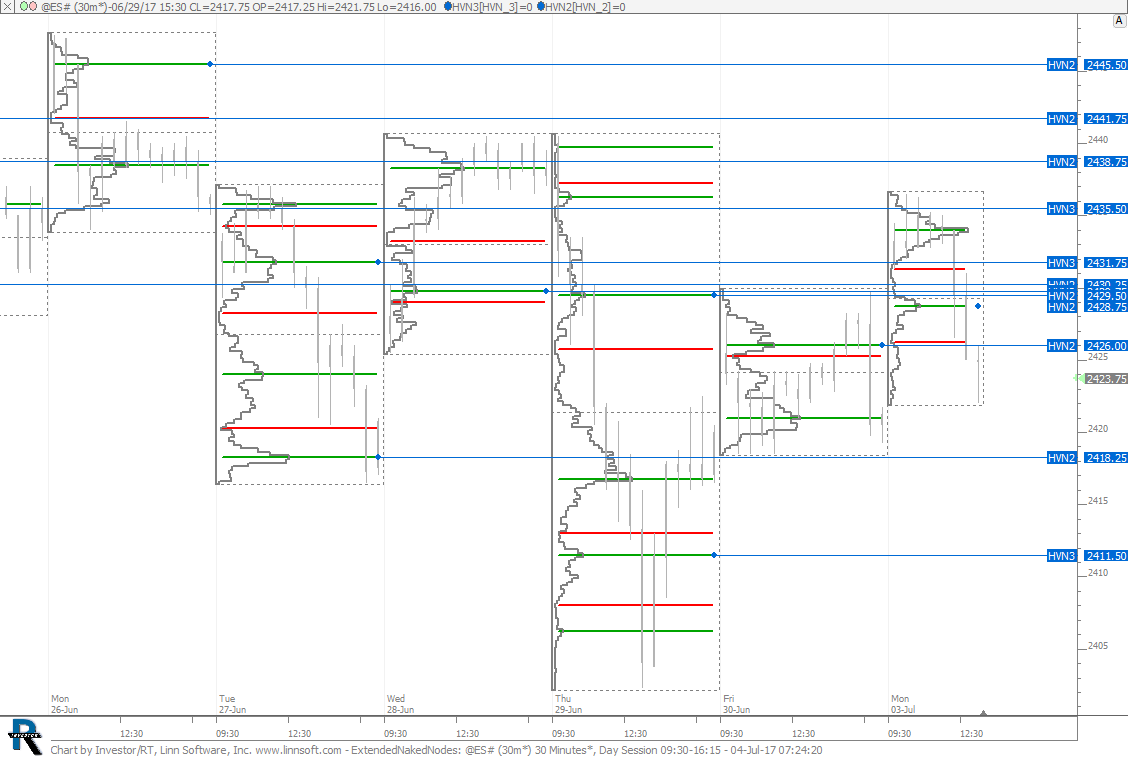 |
ExtendedNakedNodes (@ES#) cpayne [totalcount]
8 years 5 months ago
Extended Naked Nodes. This chart was uploaded by Investor/RT 12.7.6 showing symbol: @ES#. |
View |
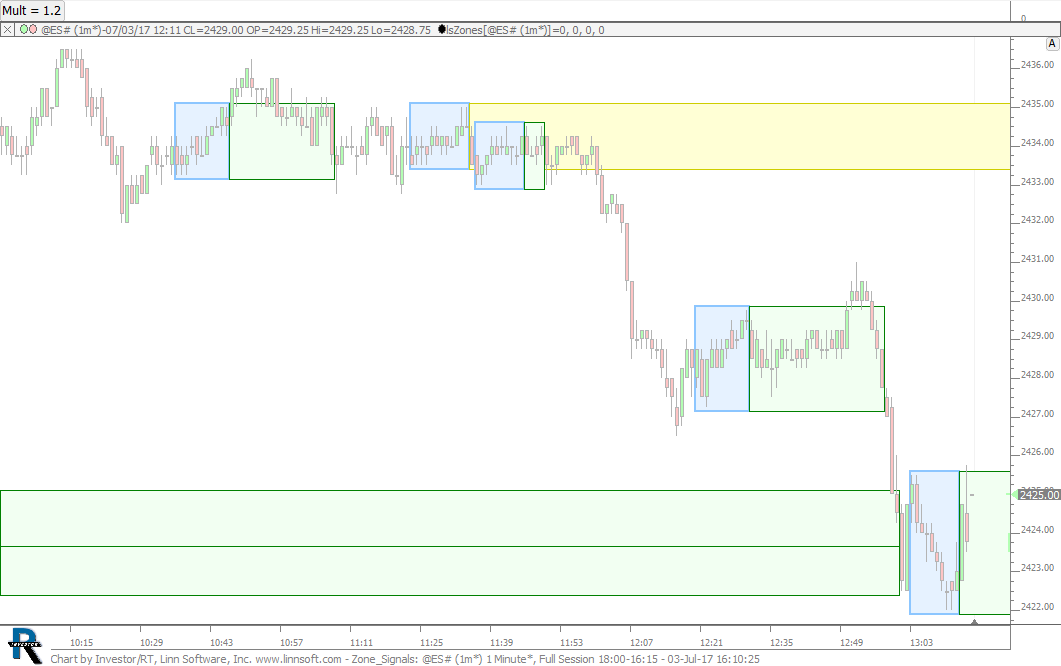 |
Zone Signals (@ES#) cpayne [totalcount]
8 years 5 months ago
Zones 2.6 with option to draw zones for consecutive signal bars. In chart above, the signal is "Range less than 1.2 * True Range" with 1.2 adjustable with button. |
View |