 |
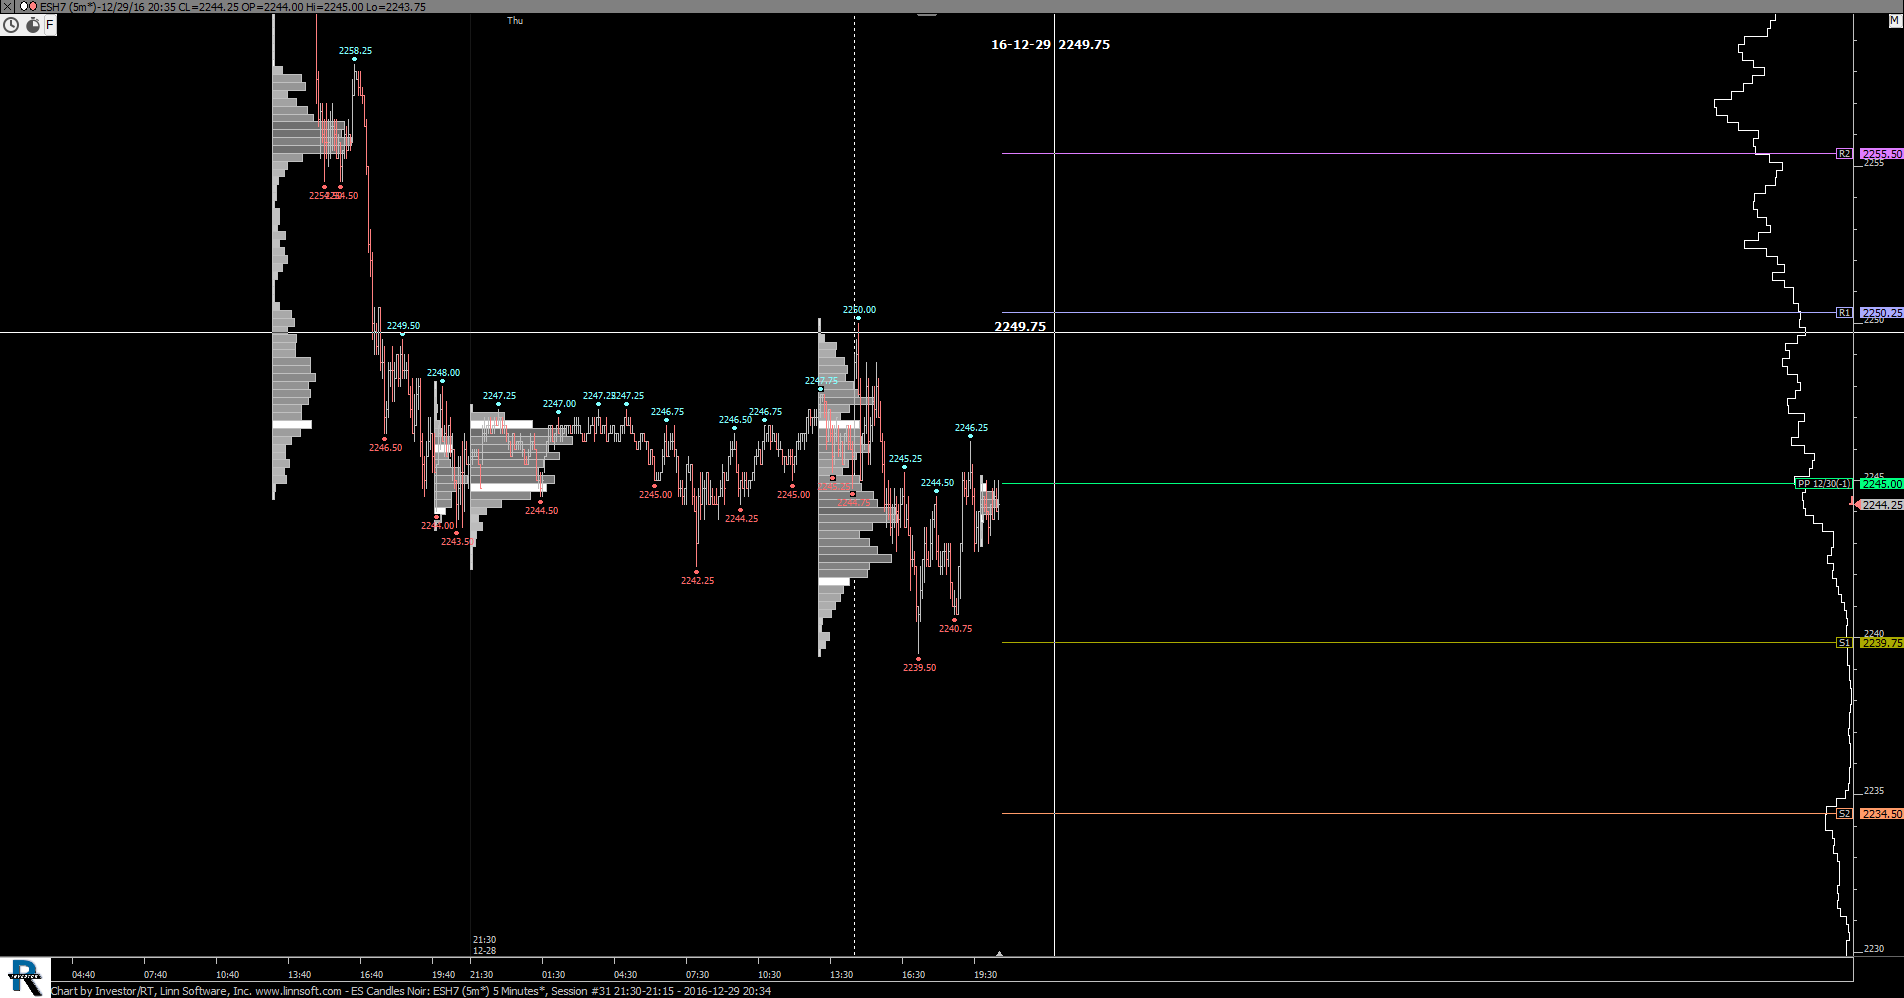
ES Candles Noir (ESH7) Stumpy68 [totalcount]
8 years 11 months ago
DTG Candles Noir. This chart was uploaded by Investor/RT 12.7.1 showing symbol: ESH7. |
View |
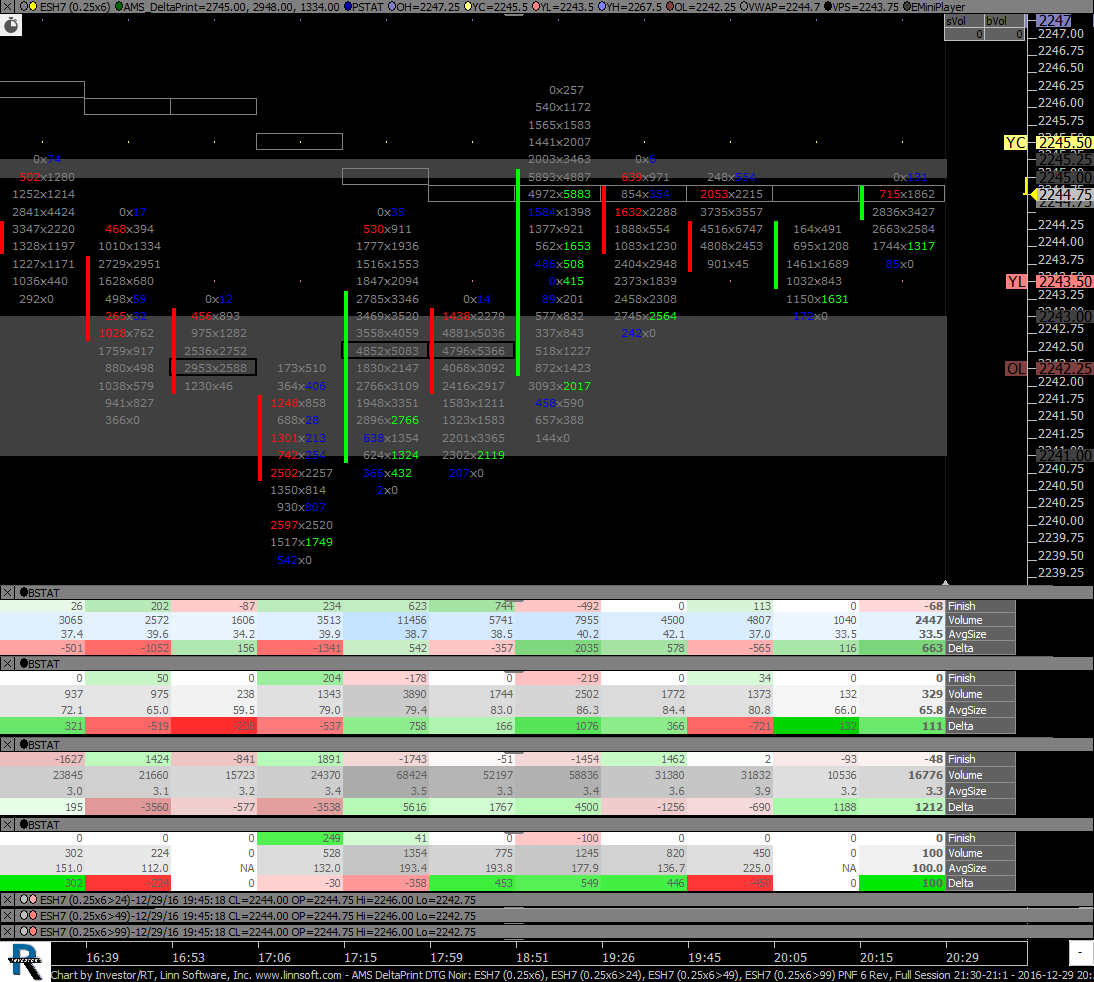 |
AMS DeltaPrint DTG Noir (ESH7) Stumpy68 [totalcount]
8 years 11 months ago
AMS DP Size. This chart was uploaded by Investor/RT 12.7.1 showing symbol: ESH7. |
View |
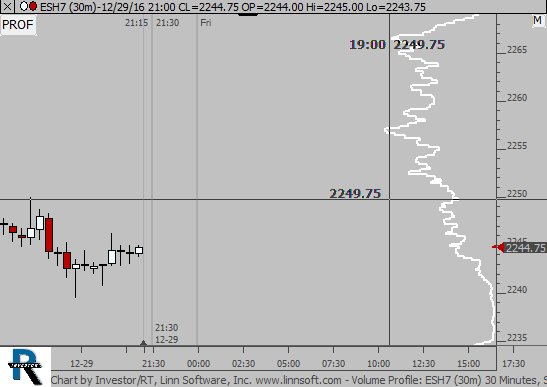 |
Volume Profile (ESH7) Stumpy68 [totalcount]
8 years 11 months ago
VP LONG. This chart was uploaded by Investor/RT 12.7.1 showing symbol: ESH7. |
View |
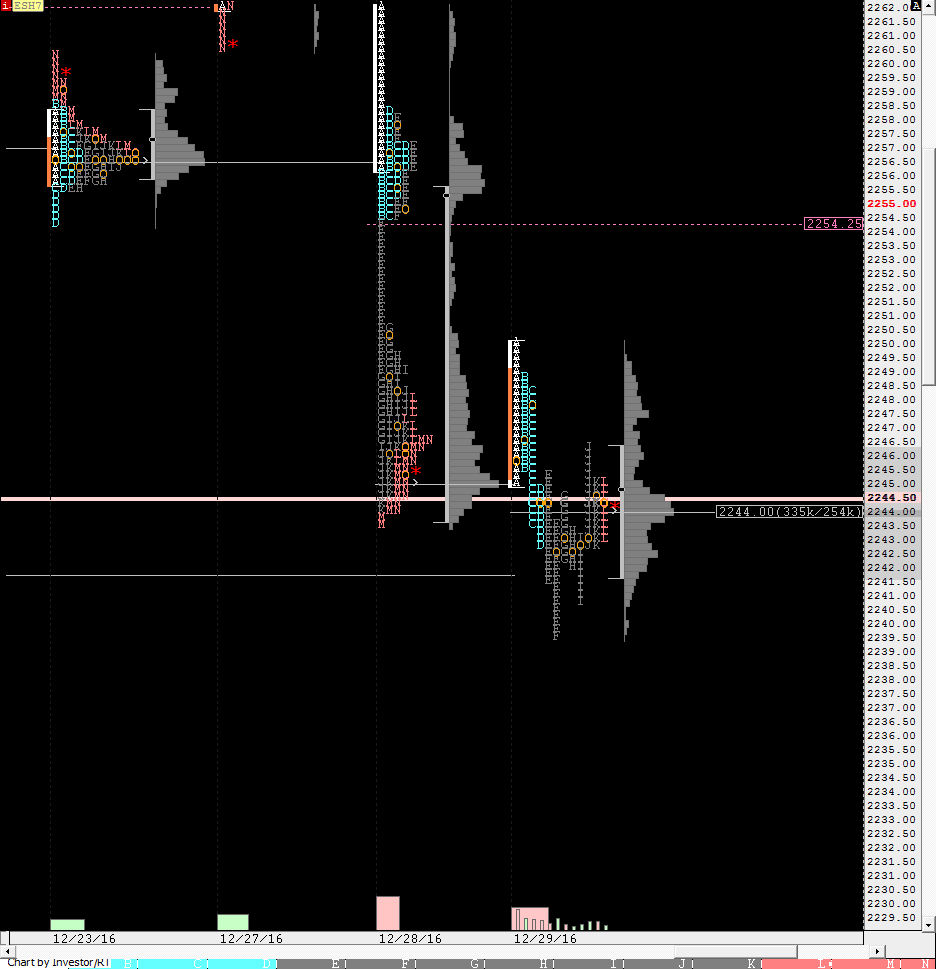 |
ES MP Noir (ESH7) Stumpy68 [totalcount]
8 years 11 months ago
ES MP NOIR. This chart was uploaded by Investor/RT 12.7.1 showing symbol: ESH7. |
View |
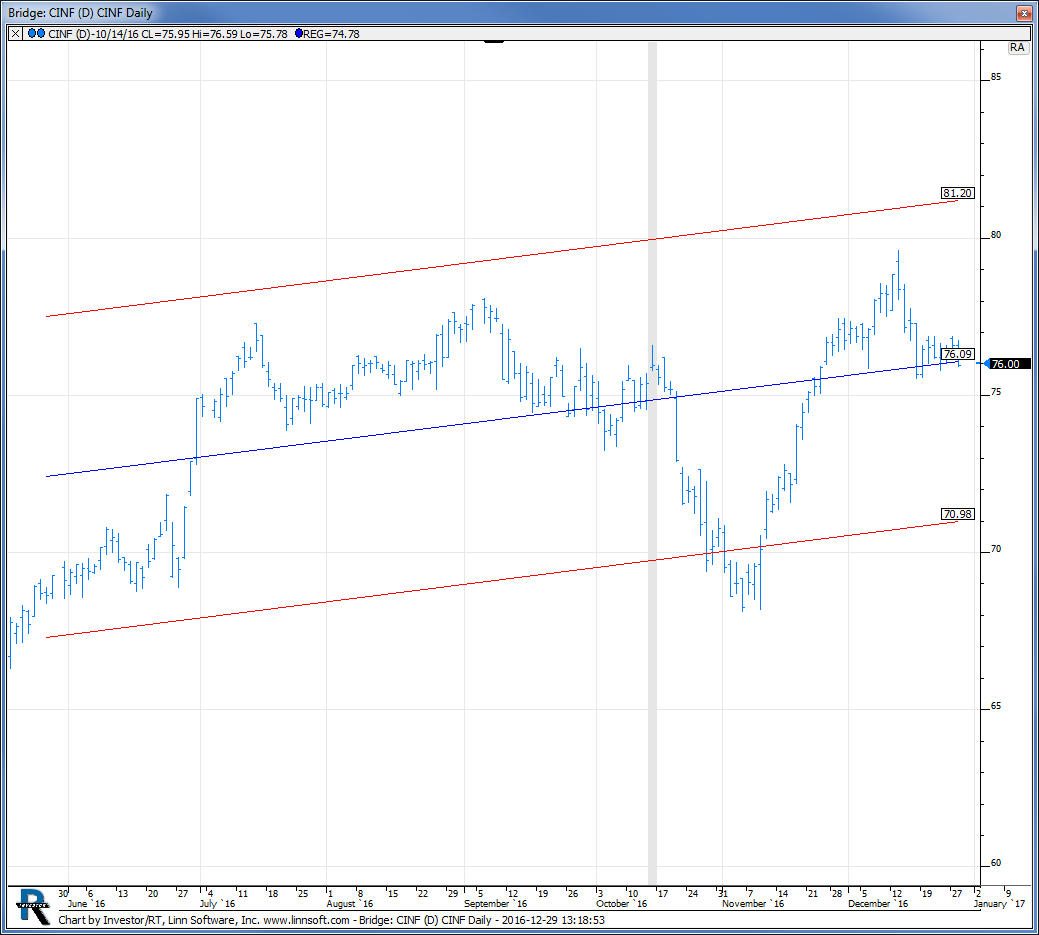 |
Bridge (CINF) mreed1 [totalcount]
8 years 11 months ago
This chart was uploaded by Investor/RT 12.6.8 showing symbol: CINF. |
View |
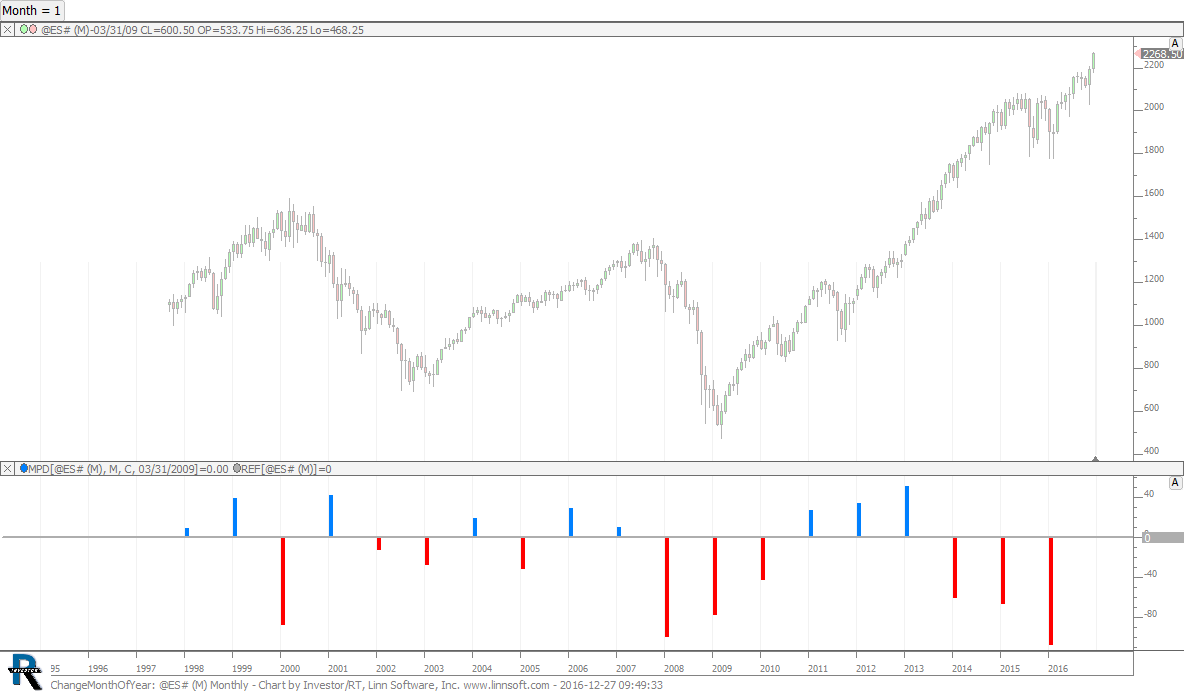 |
ChangeMonthOfYear (@ES#) cpayne [totalcount]
8 years 11 months ago
Change by Month. Use button at top to choose the month (1 for Jan, 2 for Feb, etc). This chart was uploaded by Investor/RT 12.7.1 showing symbol: @ES#. |
View |
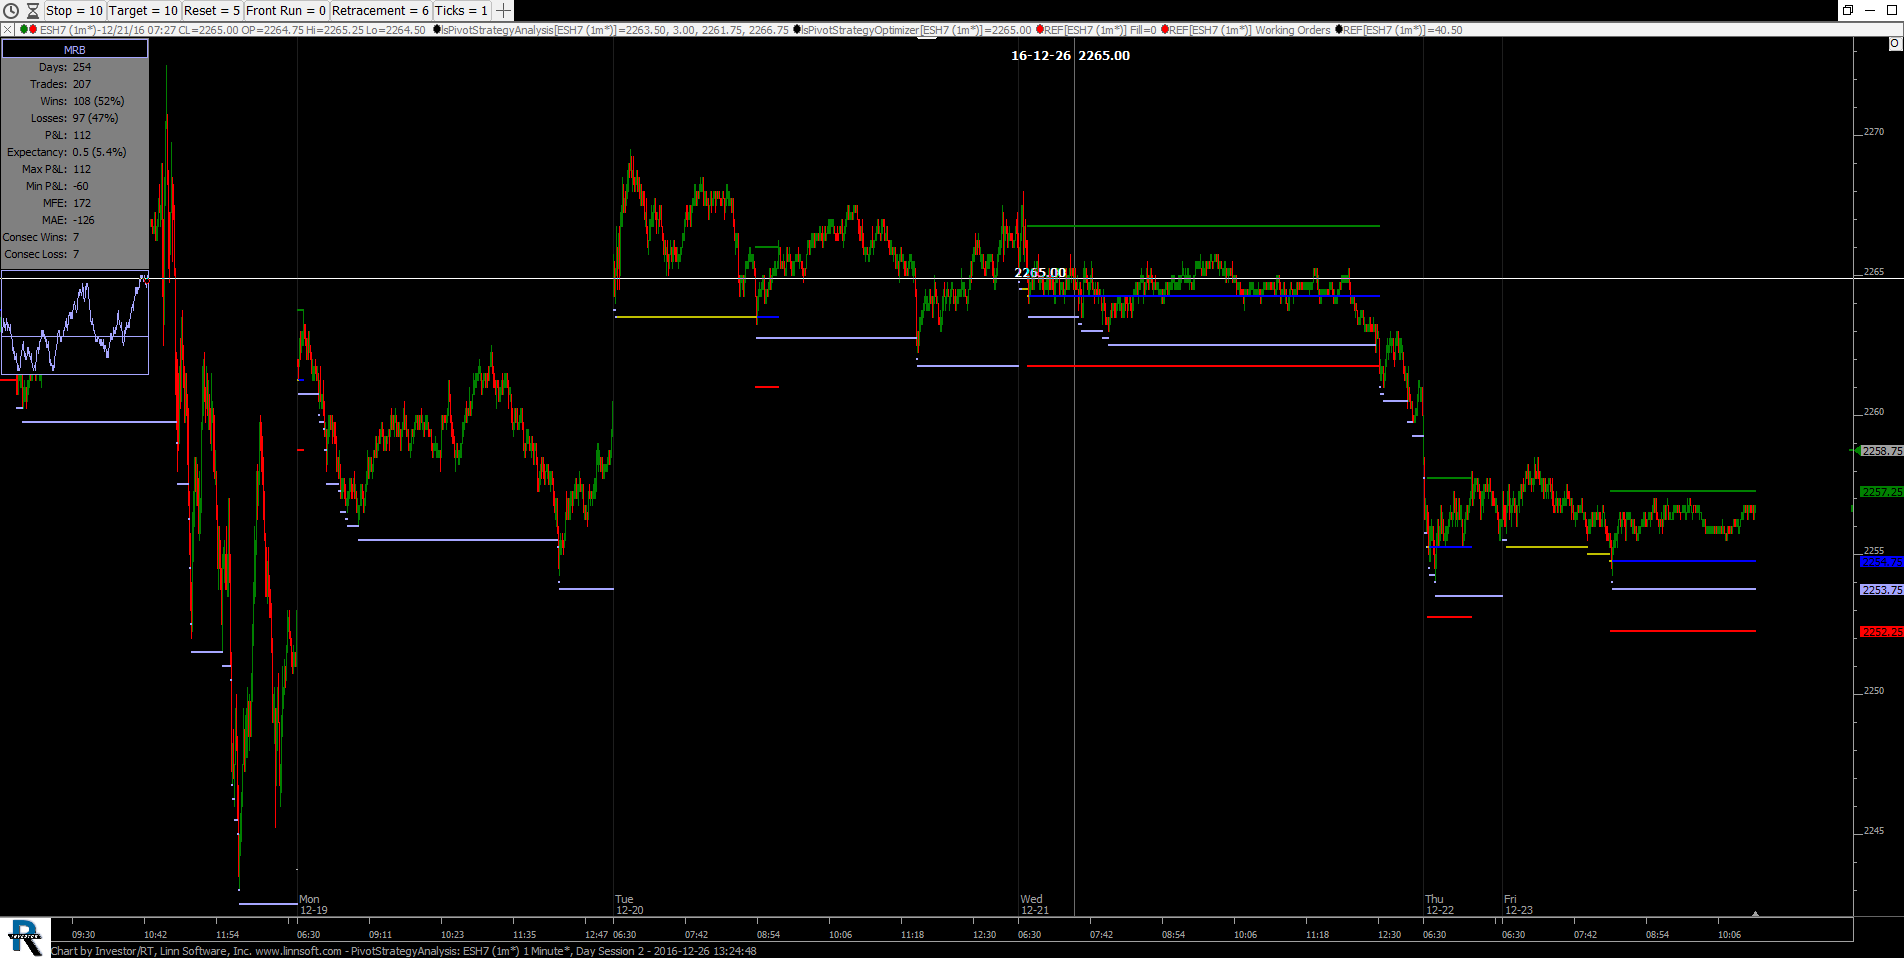 |
PivotStrategyAnalysis (ESH7) mostafacali [totalcount]
8 years 12 months ago
This chart was uploaded by Investor/RT 12.6.8 showing symbol: ESH7. |
View |
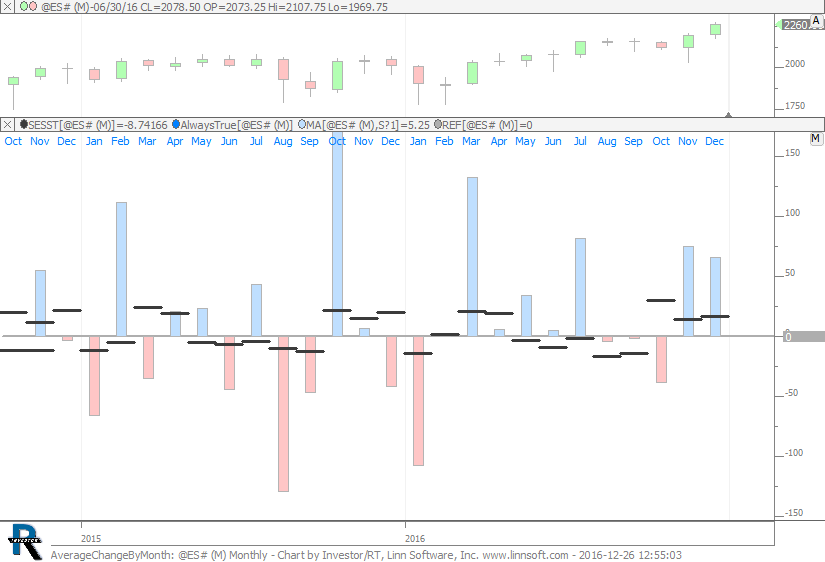 |
AverageChangeByMonth (@ES#) cpayne [totalcount]
8 years 12 months ago
Average Change By Month - Black is Average since 1998. Histogram is change of that month. This chart was uploaded by Investor/RT 12.7.1 showing symbol: @ES#. |
View |
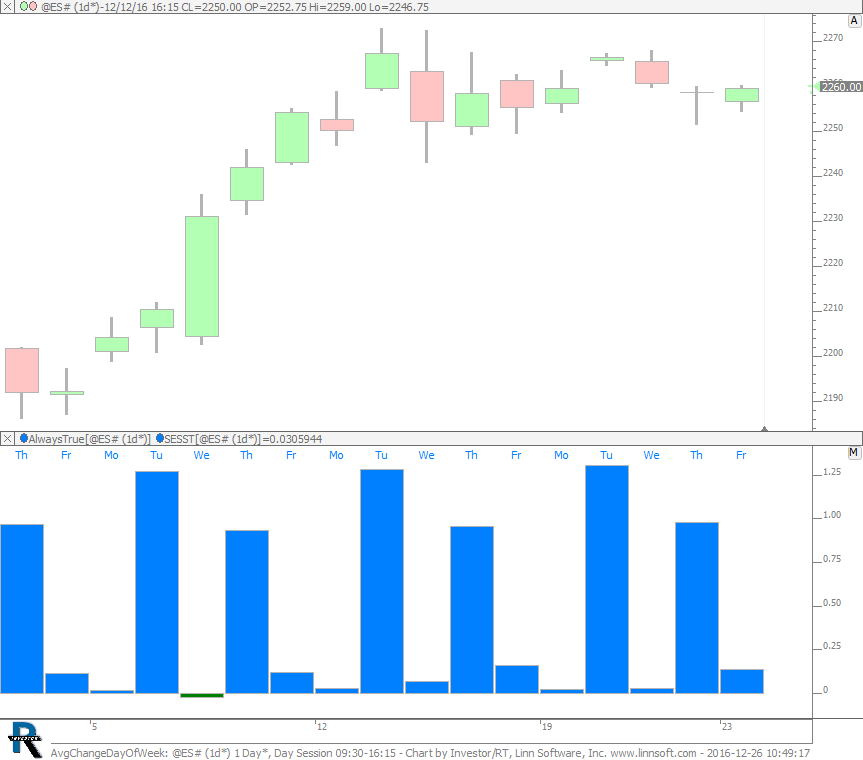 |
AvgChangeDayOfWeek (@ES#) cpayne [totalcount]
8 years 12 months ago
Average Change by Day of Week. This chart was uploaded by Investor/RT 12.7.1 showing symbol: @ES#. |
View |
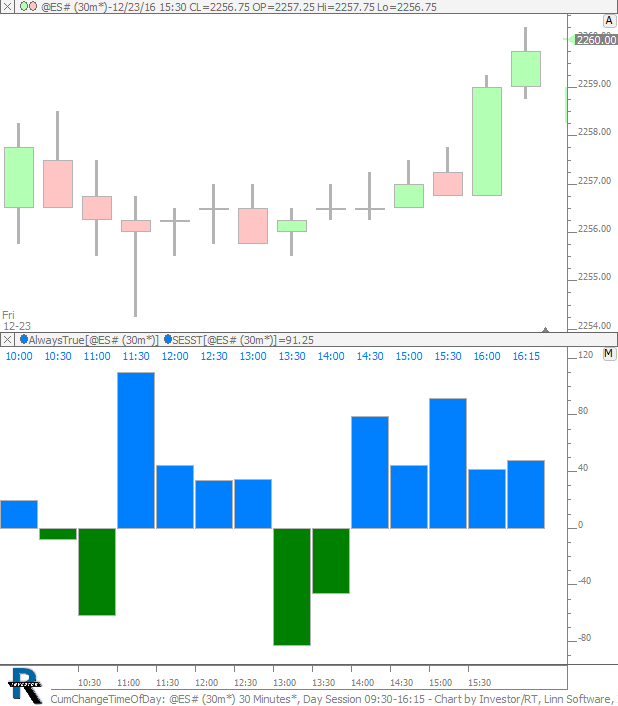 |
CumChangeTimeOfDay (@ES#) cpayne [totalcount]
8 years 12 months ago
Cumulative Change by Time of Day. This chart was uploaded by Investor/RT 12.7.1 showing symbol: @ES#. |
View |
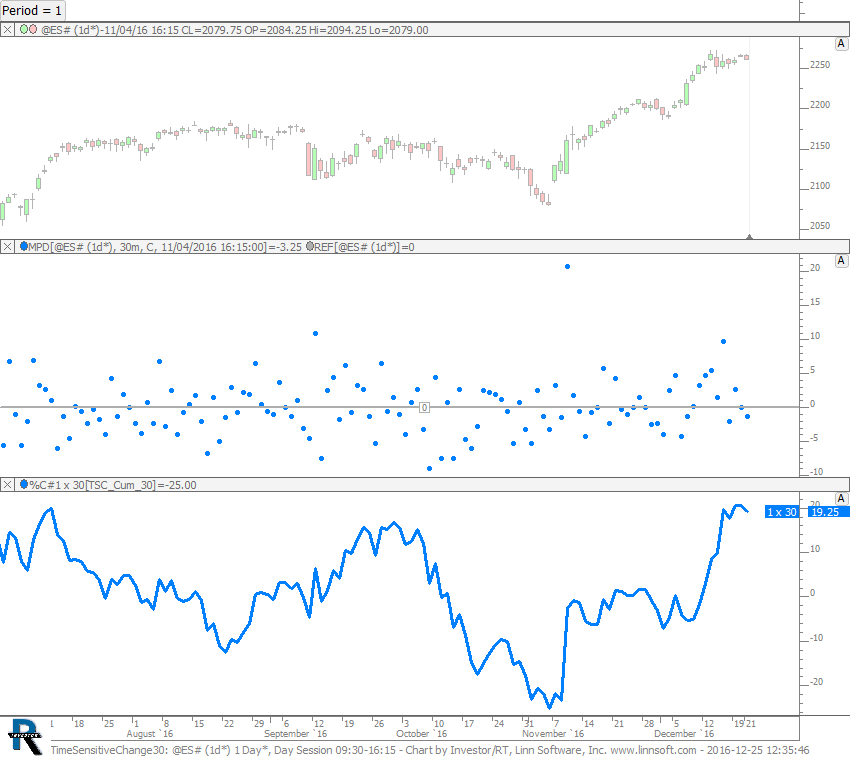 |
TimeSensitiveChange30 (@ES#) cpayne [totalcount]
8 years 12 months ago
Cumulative Change by Time of Day using 30-minute periods. This chart was uploaded by Investor/RT 12.7.1 showing symbol: @ES#. |
View |
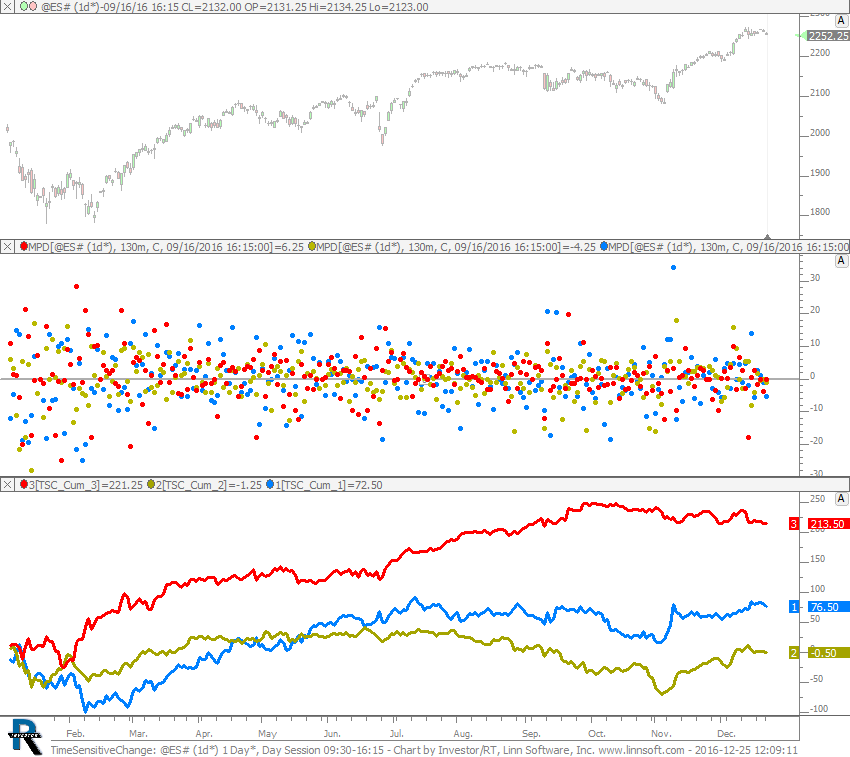 |
TimeSensitiveChange (@ES#) cpayne [totalcount]
8 years 12 months ago
Time Sensitive Change - Blue is 1st 130 minutes. Gold is 2nd 130 minutes. Red is 3rd 130 minutes of day session. |
View |
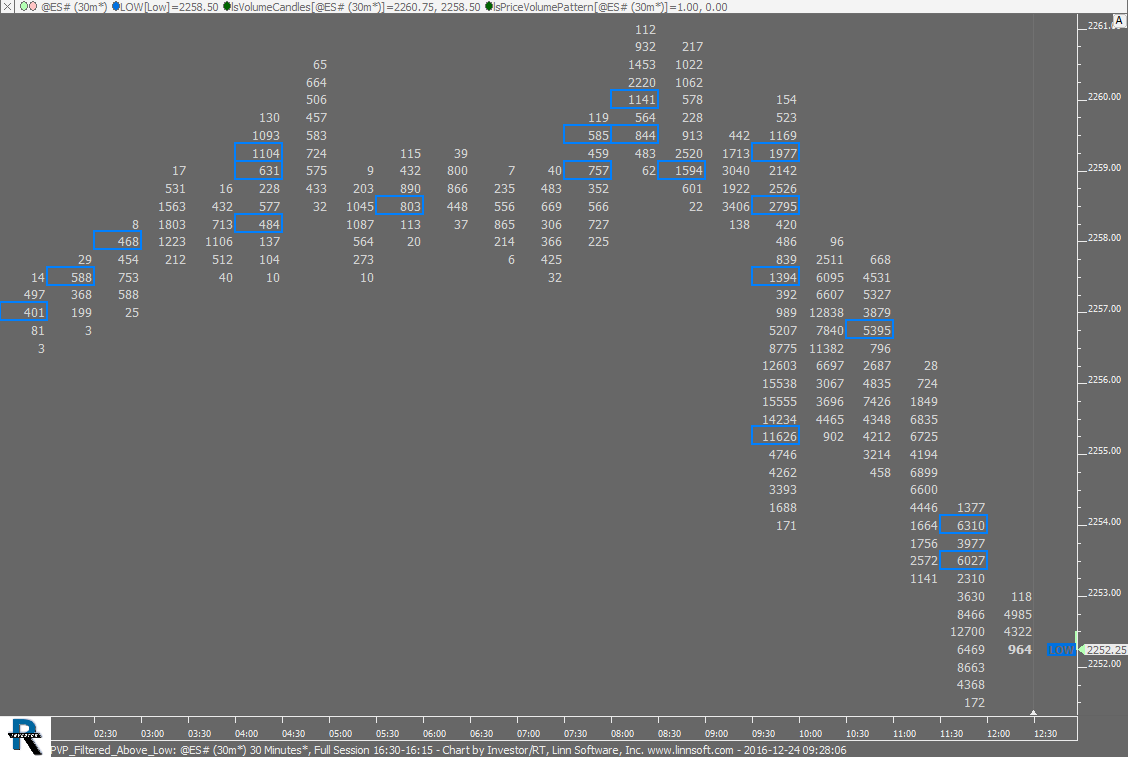 |
PVP Filtered Above Low (@ES#) cpayne [totalcount]
8 years 12 months ago
This chart was uploaded by Investor/RT 12.7.1 showing symbol: @ES#. |
View |
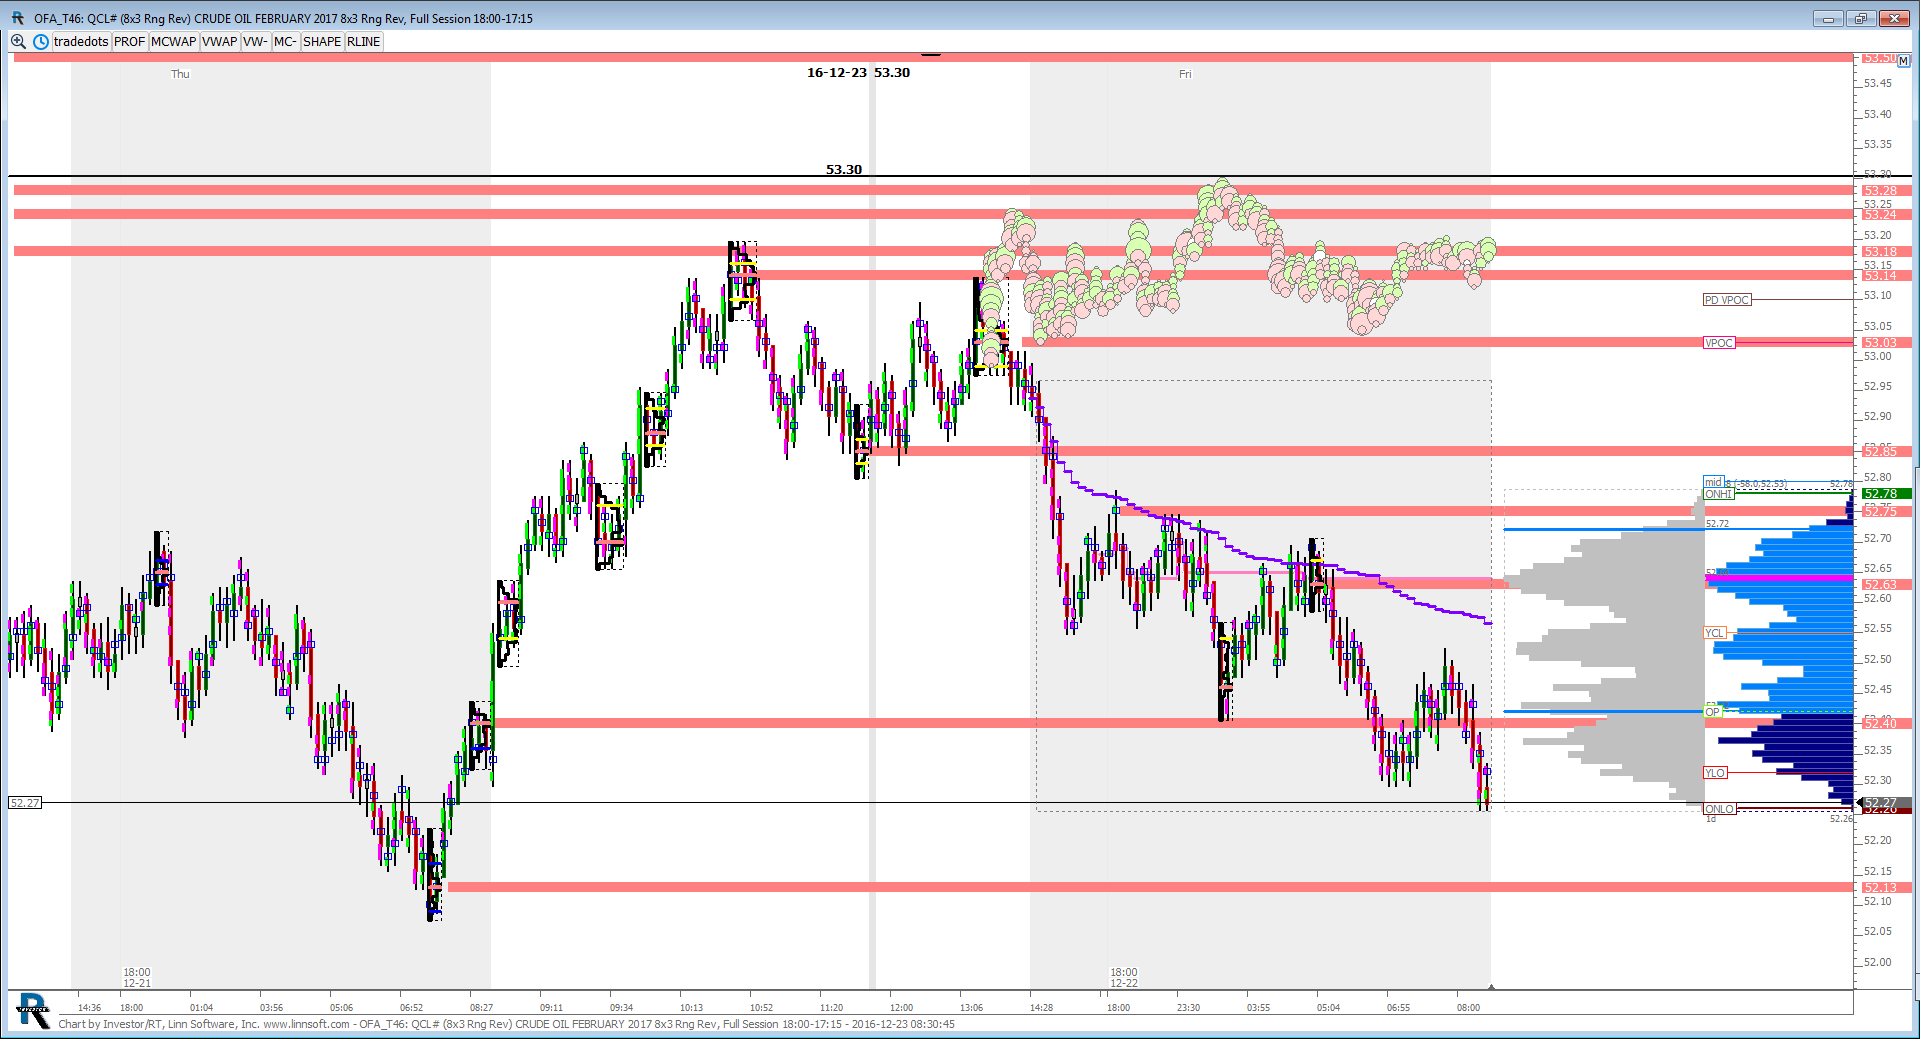 |
OFA T (QCL#) jayski51369 [totalcount]
8 years 12 months ago
This chart was uploaded by Investor/RT 12.7.1 showing symbol: QCL#. |
View |
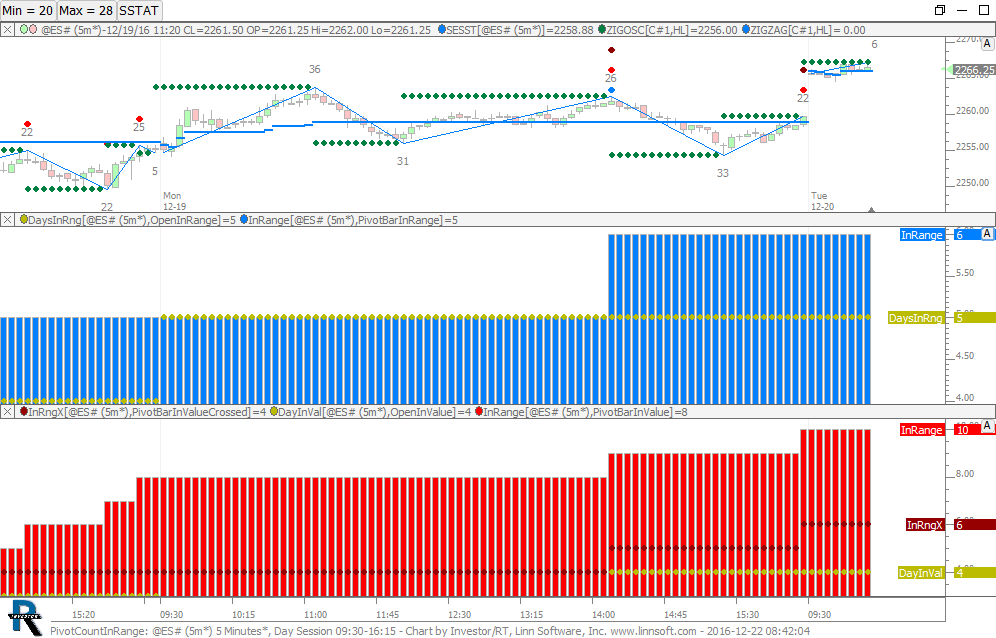 |
PivotCountInRange (@ES#) cpayne [totalcount]
8 years 12 months ago
Pivot Count In Range?. This chart was uploaded by Investor/RT 12.7.1 showing symbol: @ES#. |
View |
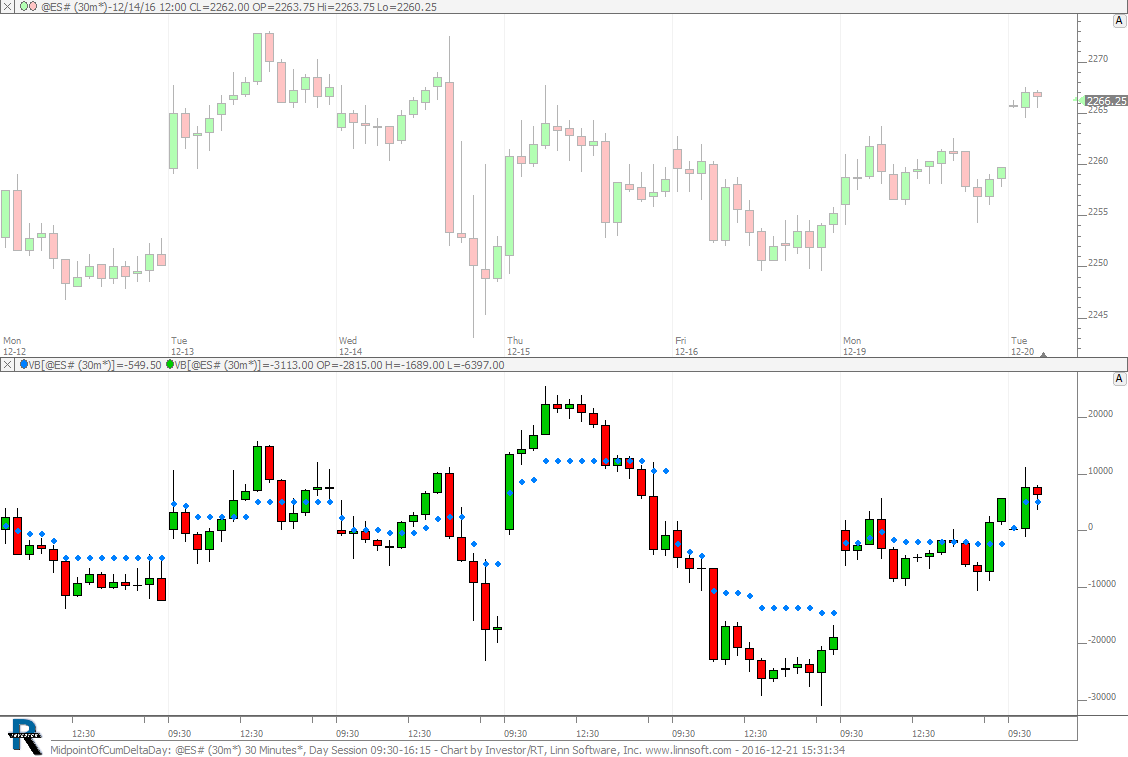 |
MidpointOfCumDeltaDay (@ES#) cpayne [totalcount]
9 years 2 hours ago
Midpoint of daily cumulative delta. This chart was uploaded by Investor/RT 12.7.1 showing symbol: @ES#. |
View |
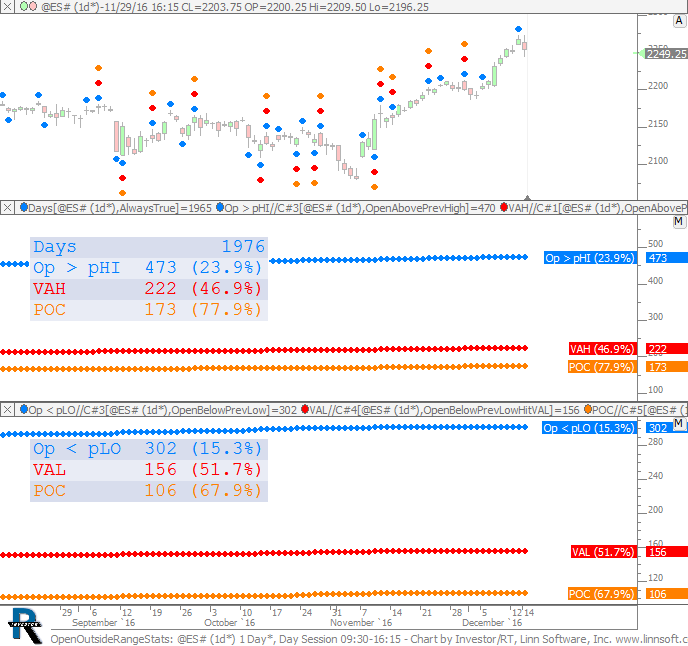 |
Homework #28: Open Outside Range Statistics cpayne [totalcount]
9 years 5 days ago
Statistic on days that opened outside of previous day range. If opening above range... How often did price return to the VAH? How often did price return to POC? If opening below range... |
View |
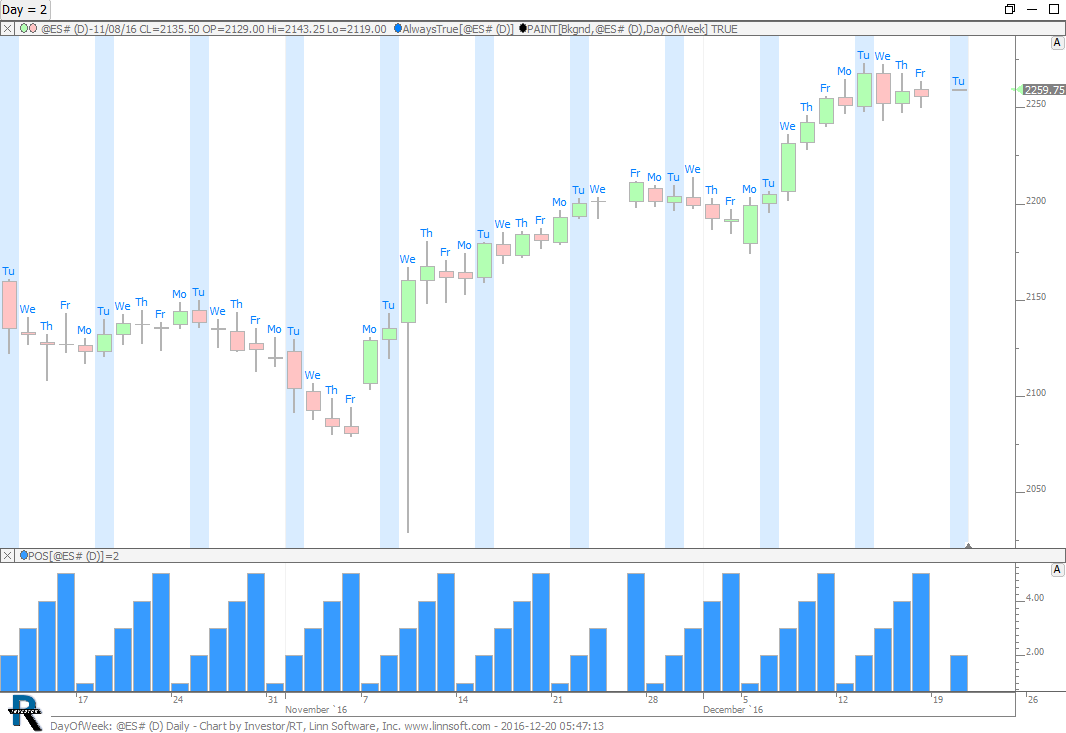 |
DayOfWeek (@ES#) cpayne [totalcount]
9 years 1 day ago
Day of Week. This chart was uploaded by Investor/RT 12.7.1 showing symbol: @ES#. |
View |
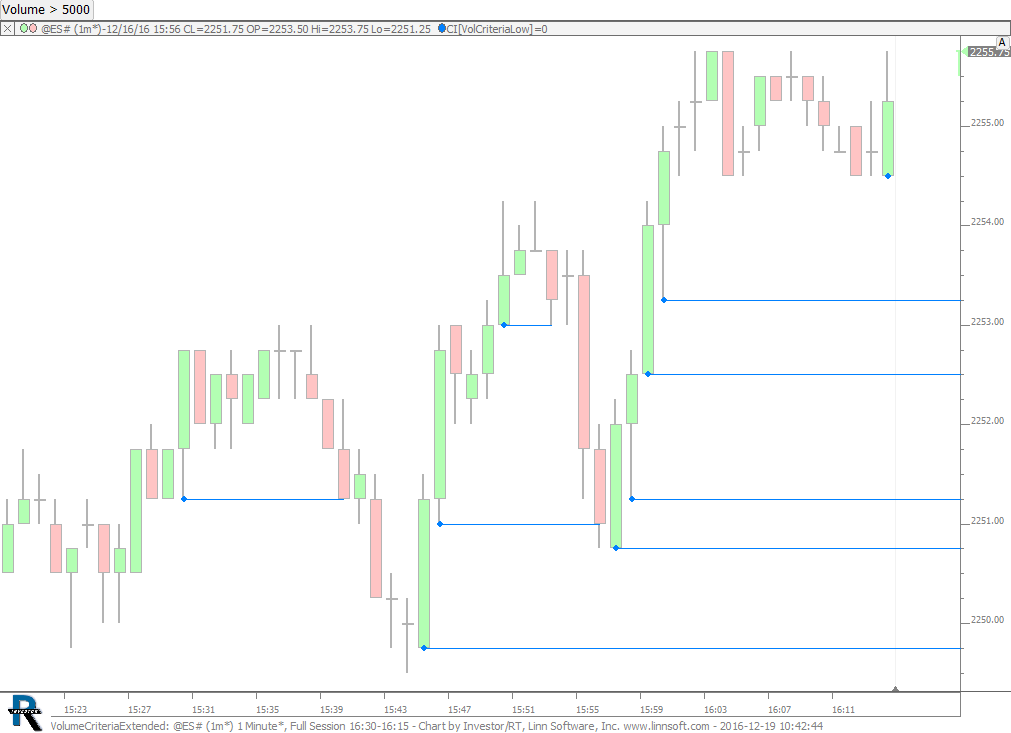 |
VolumeCriteriaExtended (@ES#) cpayne [totalcount]
9 years 2 days ago
Extend the naked lows of bars that meet volume and price criteria. This chart was uploaded by Investor/RT 12.7.1 showing symbol: @ES#. |
View |
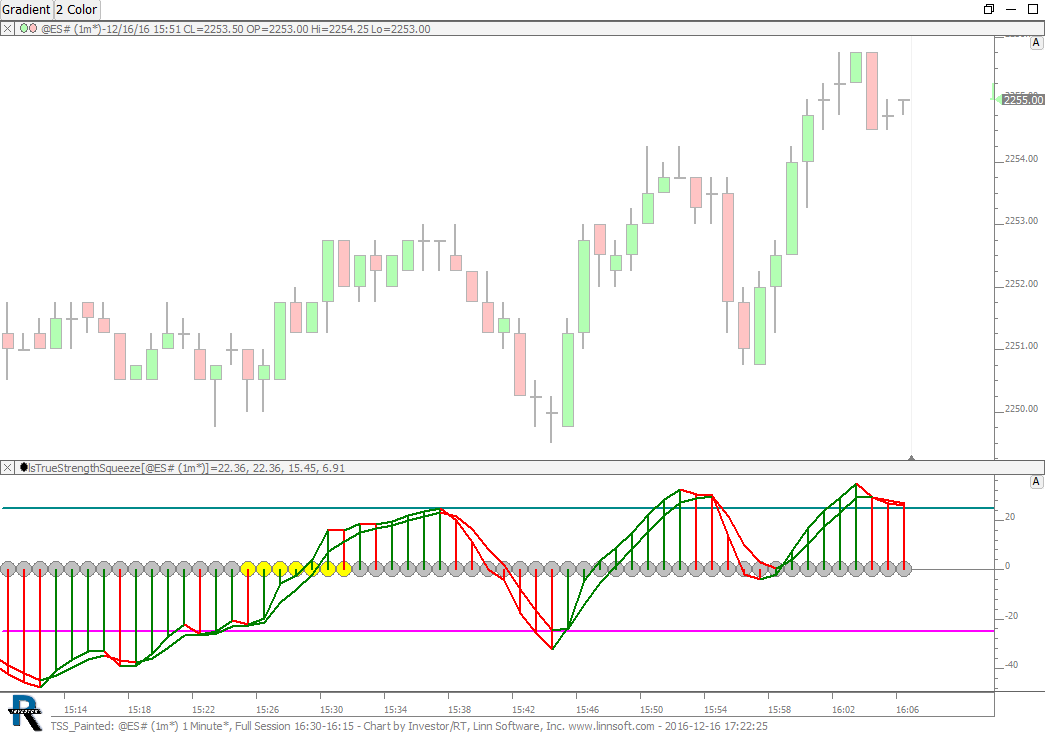 |
TSS Painted (@ES#) cpayne [totalcount]
9 years 5 days ago
Paint Candles using the TSS. Click the buttons at top to toggle different painting options on/off. This chart was uploaded by Investor/RT 12.7.1 showing symbol: @ES#. |
View |
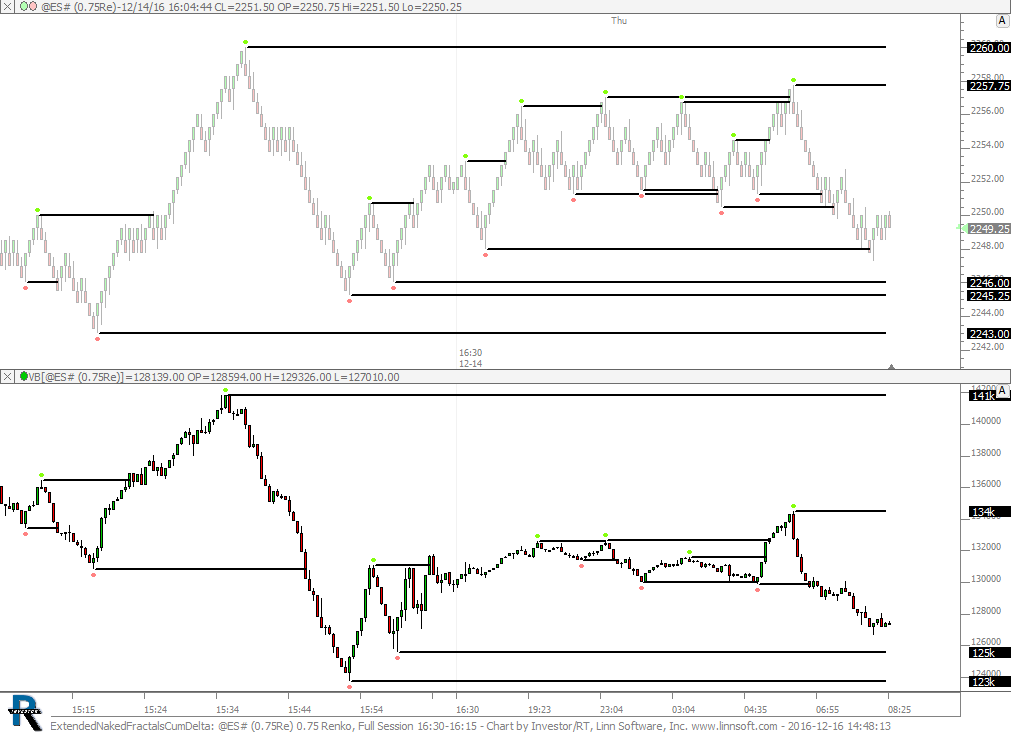 |
ExtendedNakedFractalsCumDelta (@ES#) cpayne [totalcount]
9 years 5 days ago
This chart was uploaded by Investor/RT 12.7.1 showing symbol: @ES#. |
View |
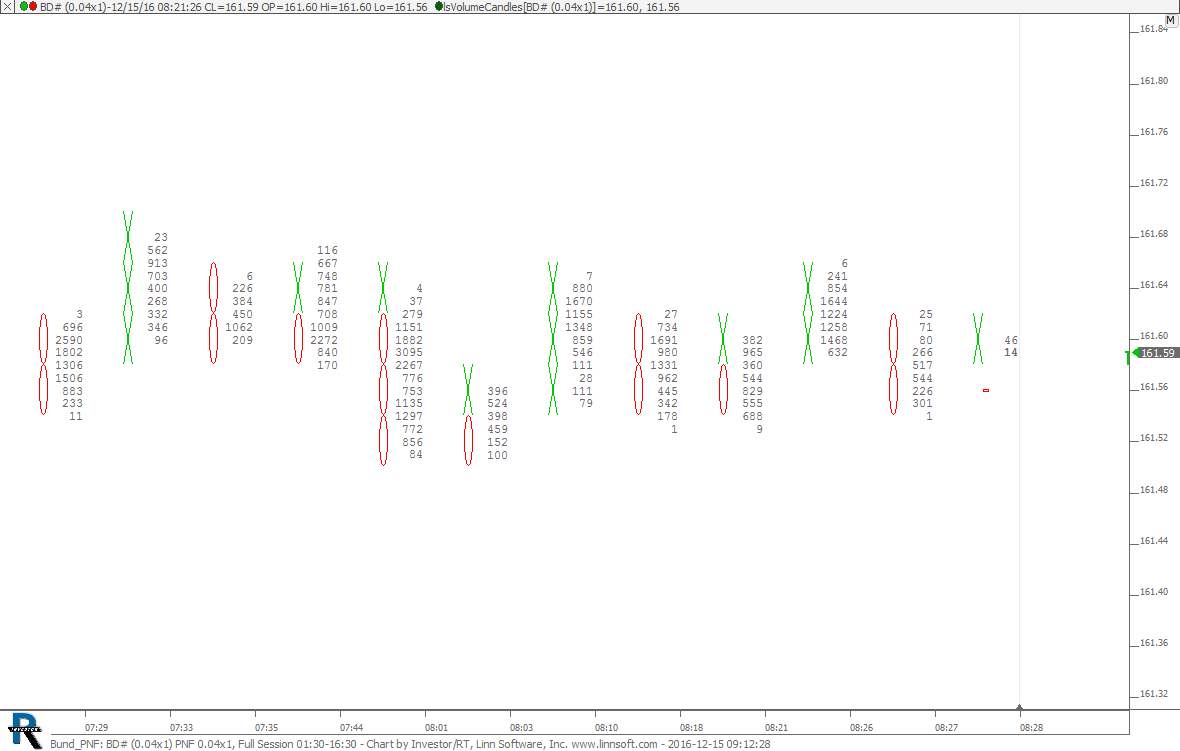 |
Bund PNF (BD#) cpayne [totalcount]
9 years 6 days ago
This chart was uploaded by Investor/RT 12.7.1 showing symbol: BD#. |
View |
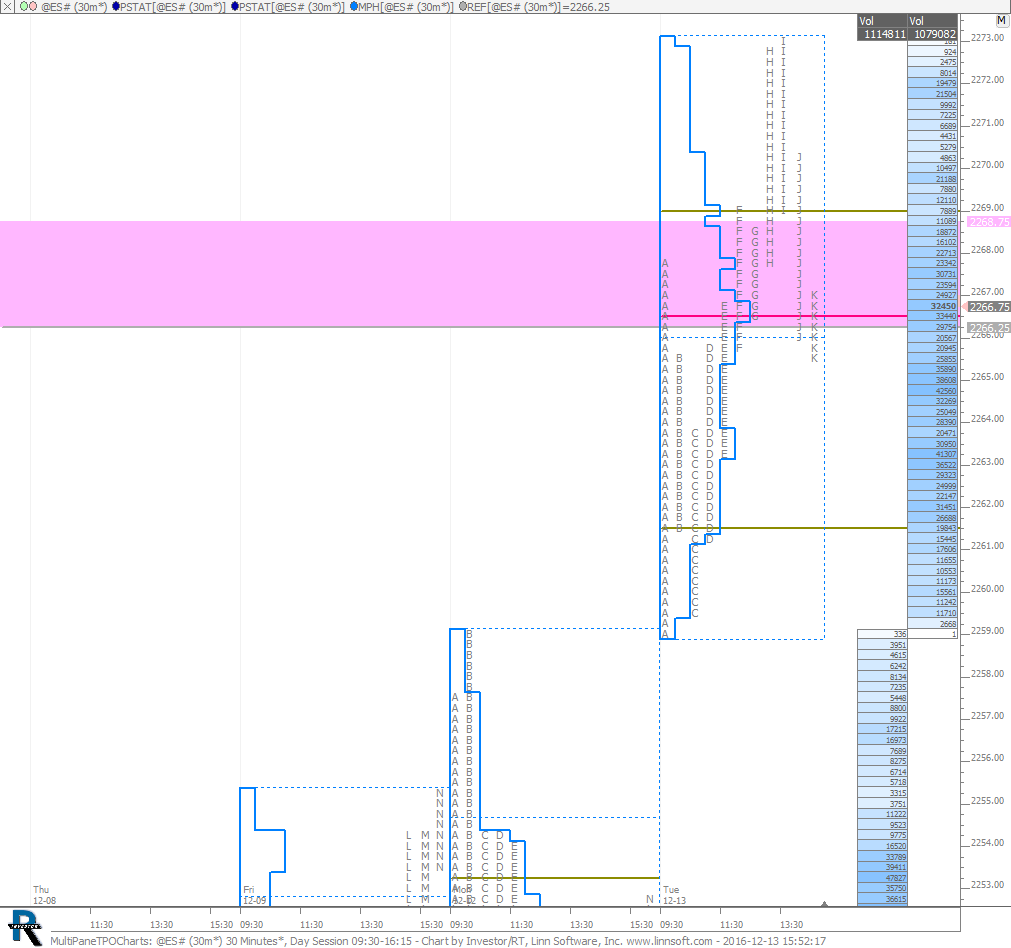 |
MultiPaneTPOCharts (@ES#) cpayne [totalcount]
9 years 1 week ago
Multi-Pane TPO Charts. This chart was uploaded by Investor/RT 12.7.1 showing symbol: @ES#. |
View |
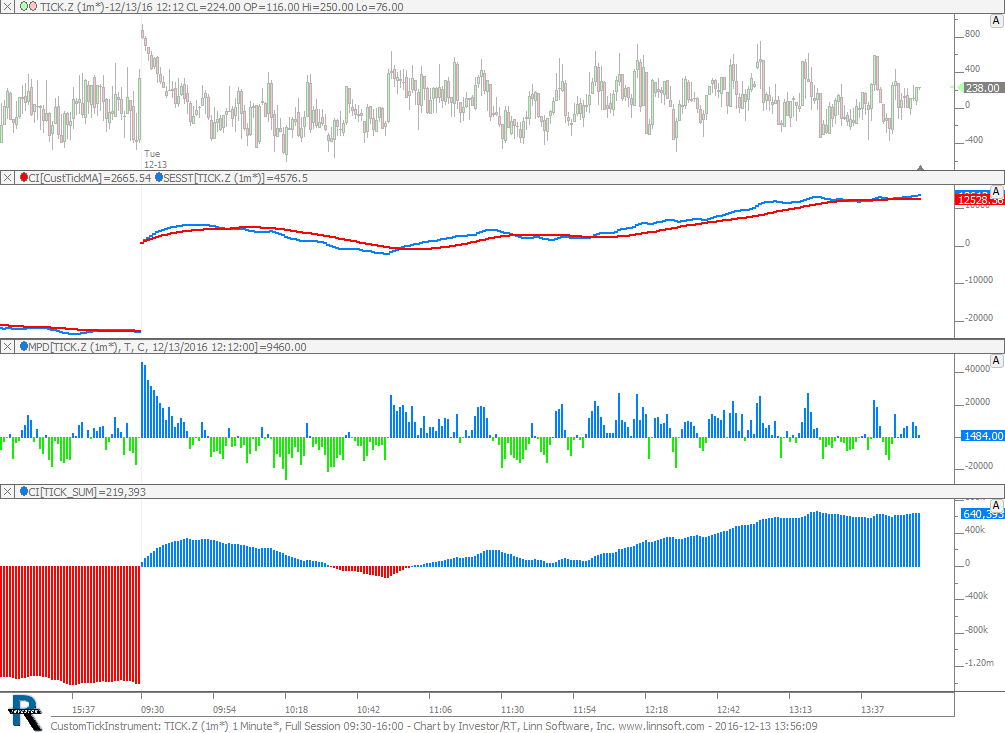 |
CustomTickInstrument (TICK.Z) cpayne [totalcount]
9 years 1 week ago
Custom Tick Instrument / Indicator. This chart was uploaded by Investor/RT 12.7.1 showing symbol: TICK.Z. |
View |
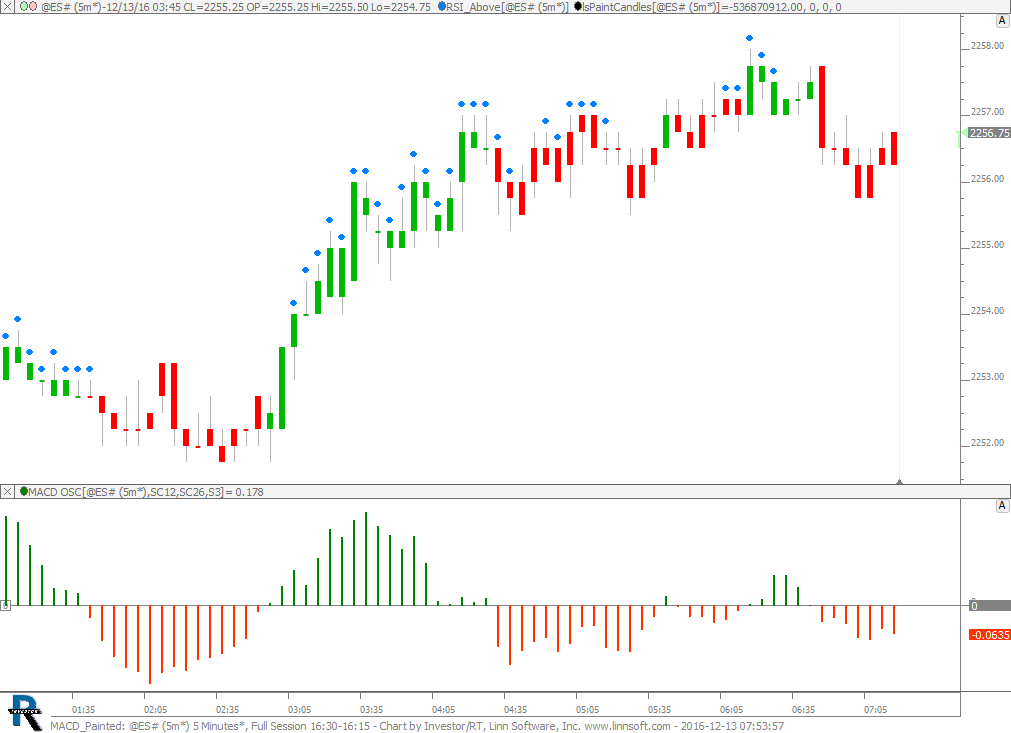 |
MACD Painted (@ES#) cpayne [totalcount]
9 years 1 week ago
MACD Painted Bars. This chart was uploaded by Investor/RT 12.7.1 showing symbol: @ES#. |
View |