 |
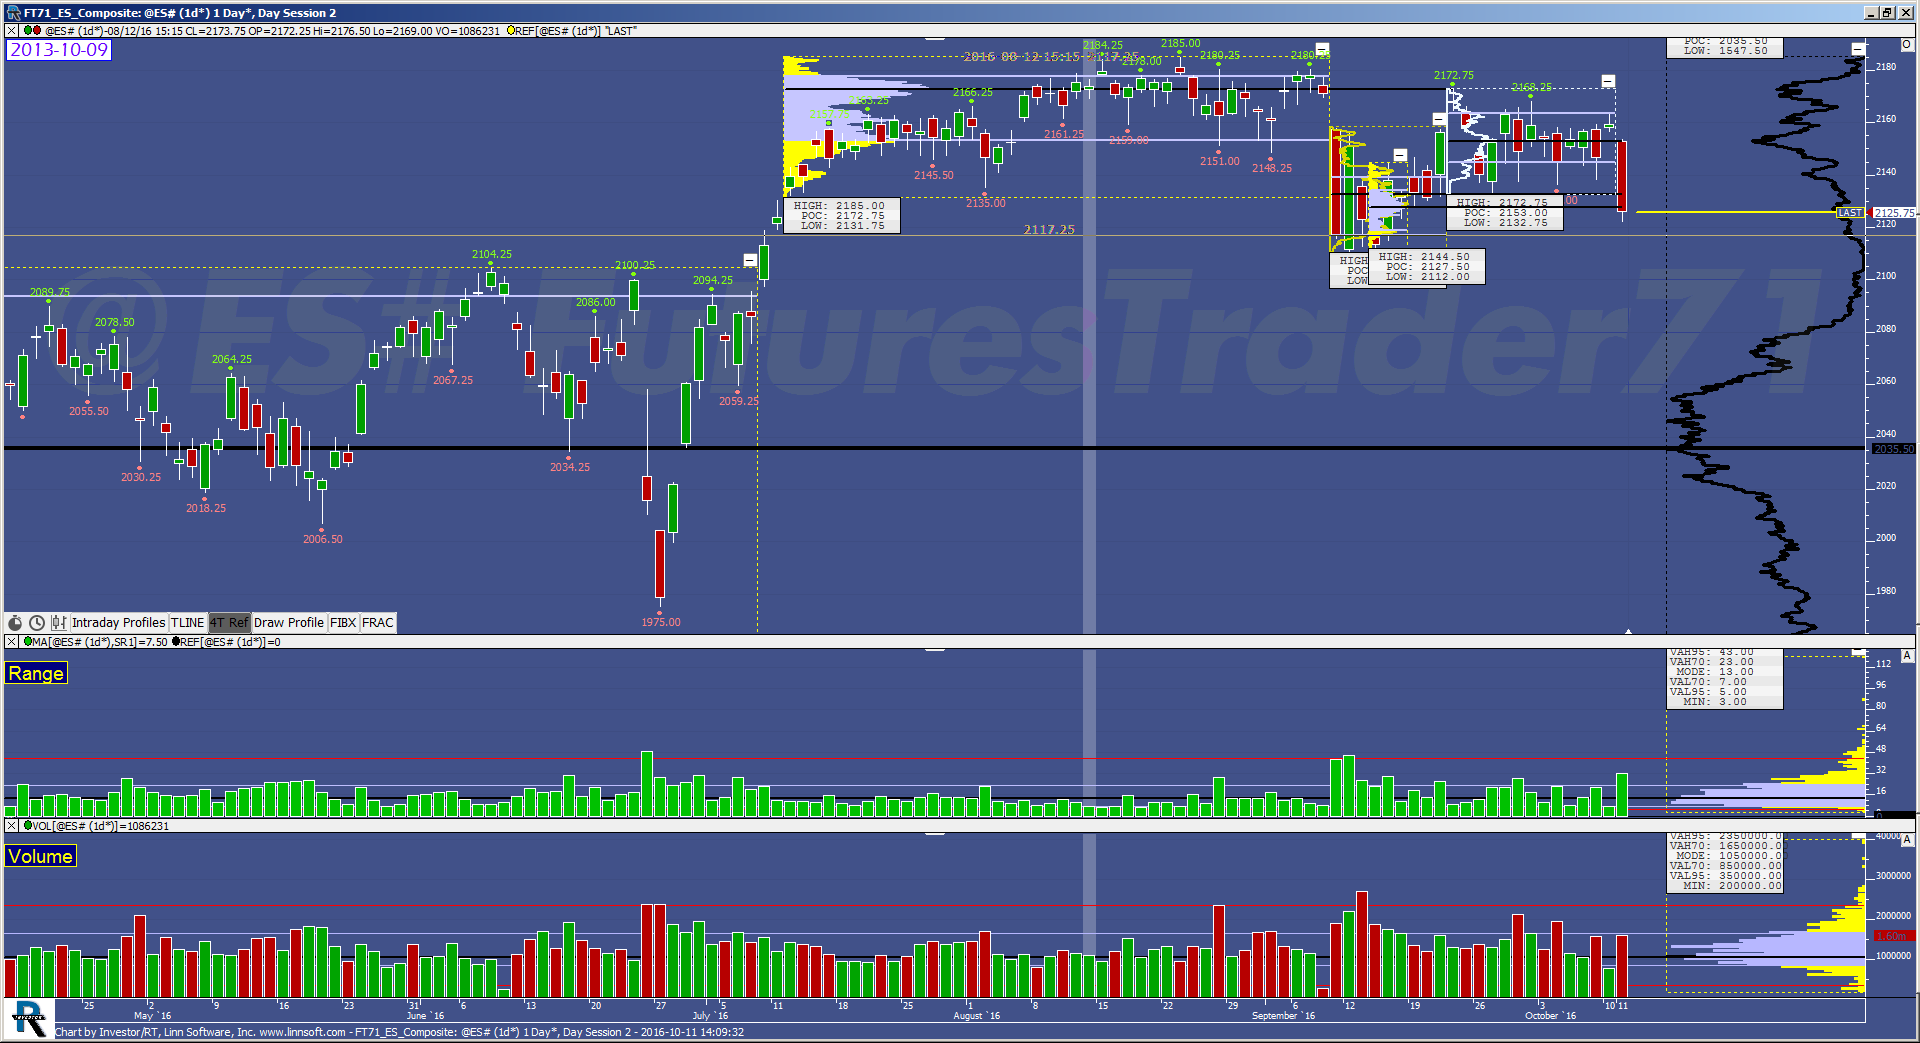
FT71 ES Composite (@ES#) futurestrader71 [totalcount]
9 years 2 months ago
ES Composite Day Session chart showing the composite profile as well as the dynamic studies of Range and Volume per day. This is used for the big picture and is key to analyzing the market's bias... |
View |
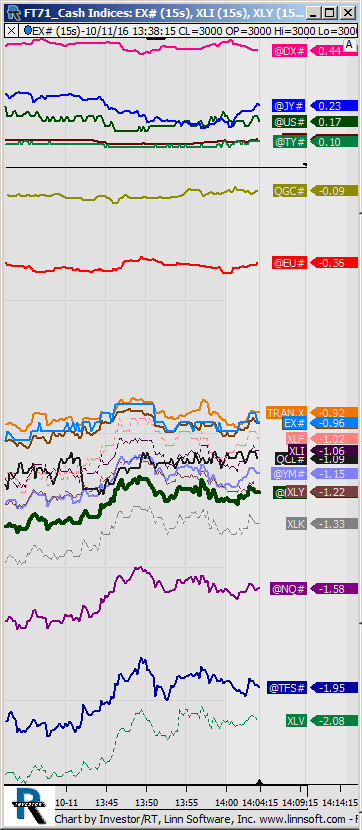 |
FT71 Cash Indices (EX#) futurestrader71 [totalcount]
9 years 2 months ago
This chart was uploaded by Investor/RT 12.6.3 showing symbol: EX#. |
View |
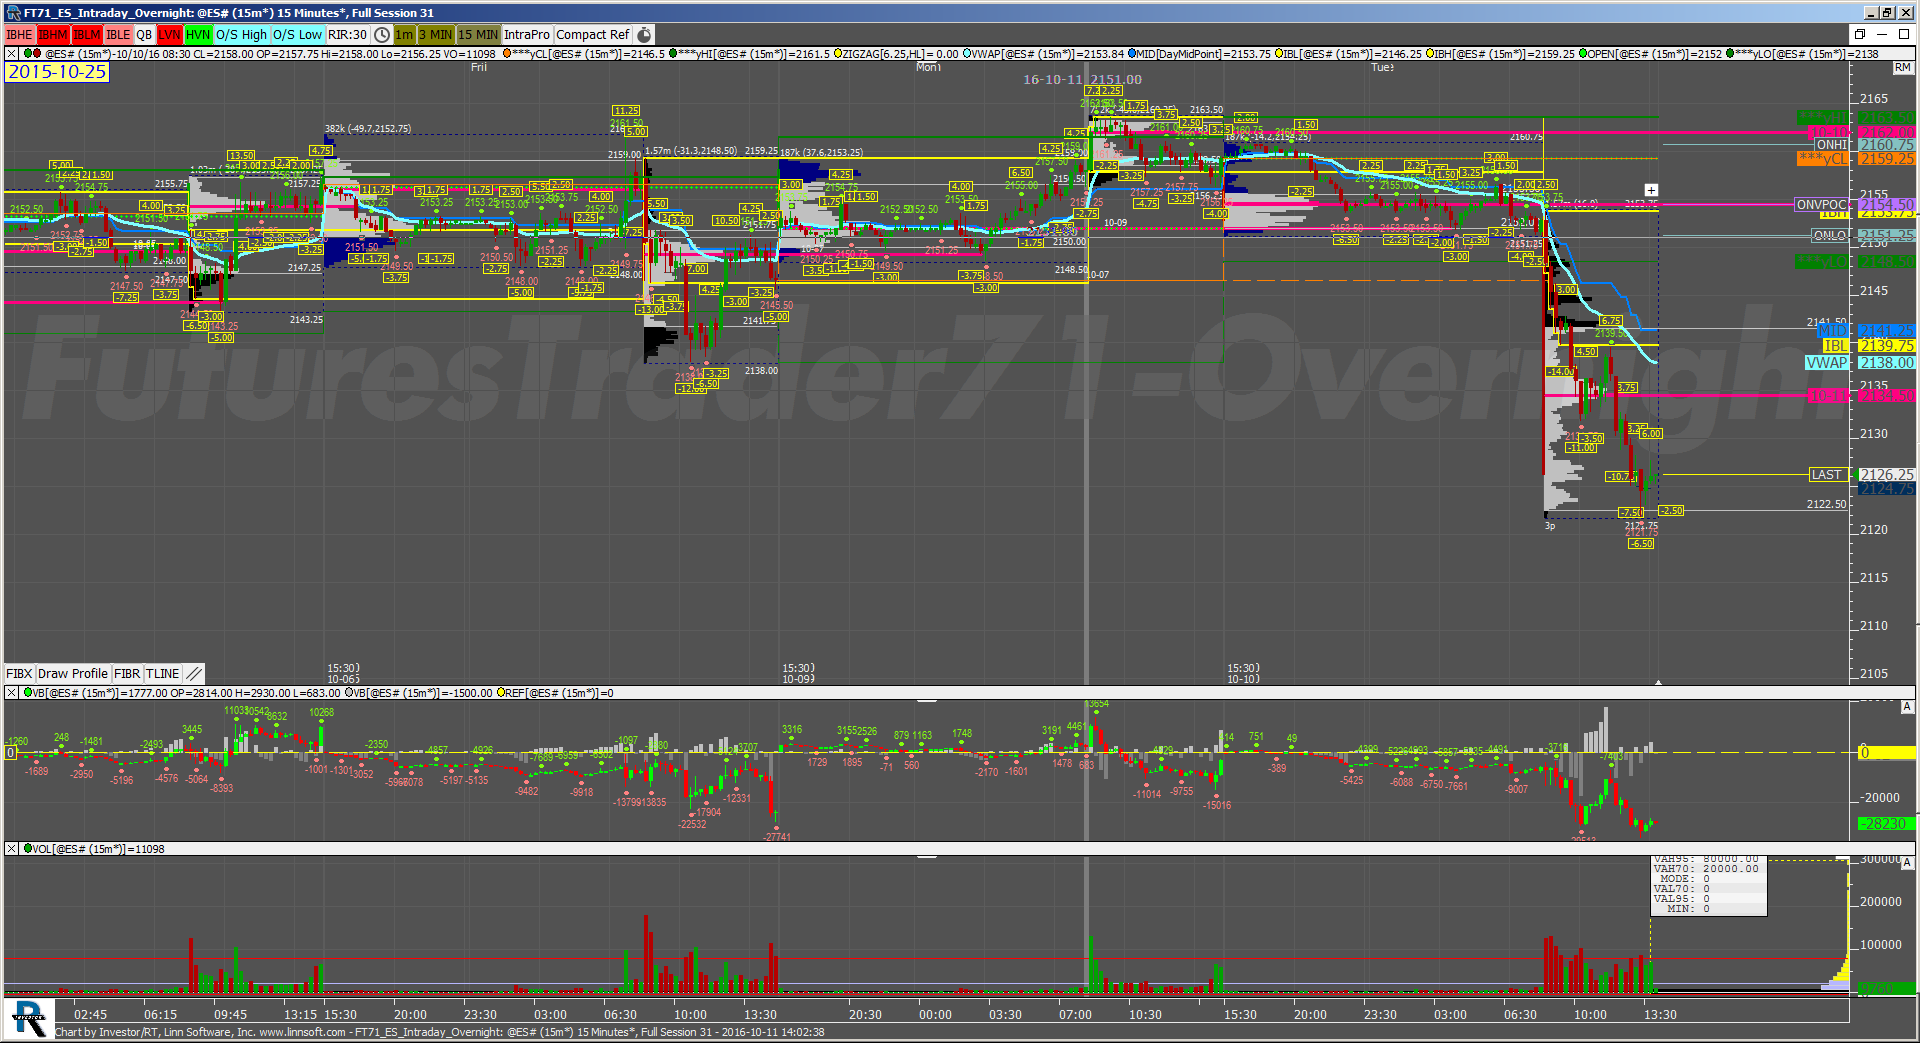 |
FT71 ES Intraday Overnight (@ES#) futurestrader71 [totalcount]
9 years 2 months ago
ES Intraday Overnight Chart as soon the Trader Bite showing both Day and Globex sessions. This chart was uploaded by Investor/RT 12.6.5 showing symbol: @ES#. |
View |
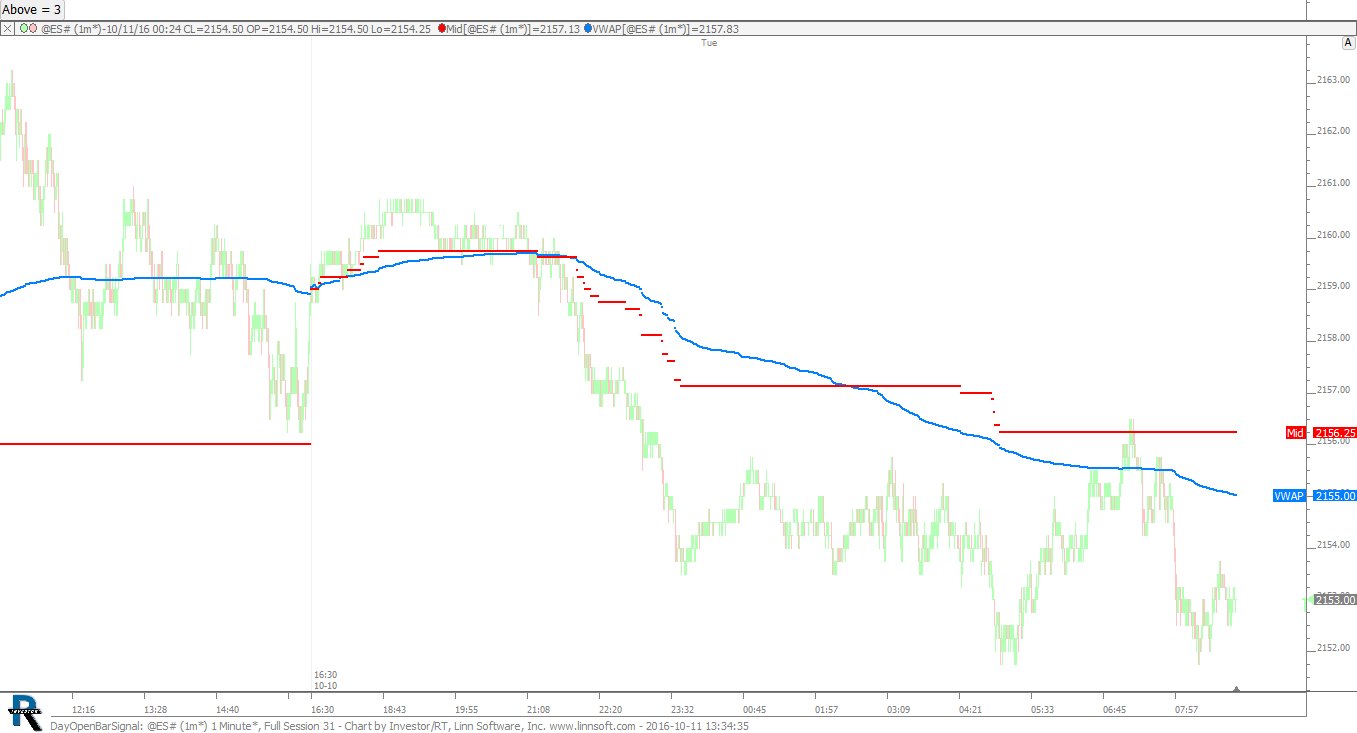 |
DayOpenBarSignal (@ES#) cpayne [totalcount]
9 years 2 months ago
Day Open Bar Signal. This chart was uploaded by Investor/RT 12.6.5 showing symbol: @ES#. |
View |
 |
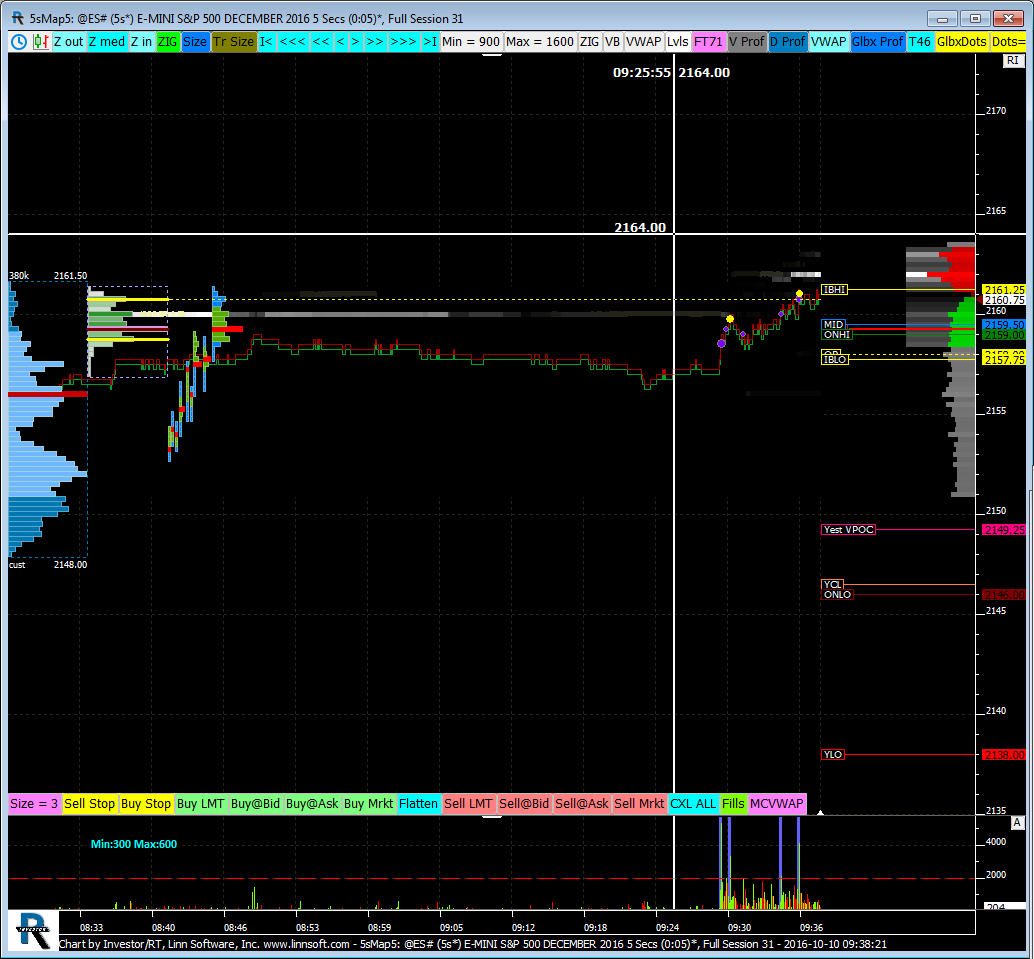
5sMap (@ES#) 2 jayski51369 [totalcount]
9 years 2 months ago
This chart was uploaded by Investor/RT 12.6.5 showing symbol: @ES#. |
View |
 |
JS esmap (@ES#) 2 jayski51369 [totalcount]
9 years 2 months ago
This chart was uploaded by Investor/RT 12.6.5 showing symbol: @ES#. |
View |
 |
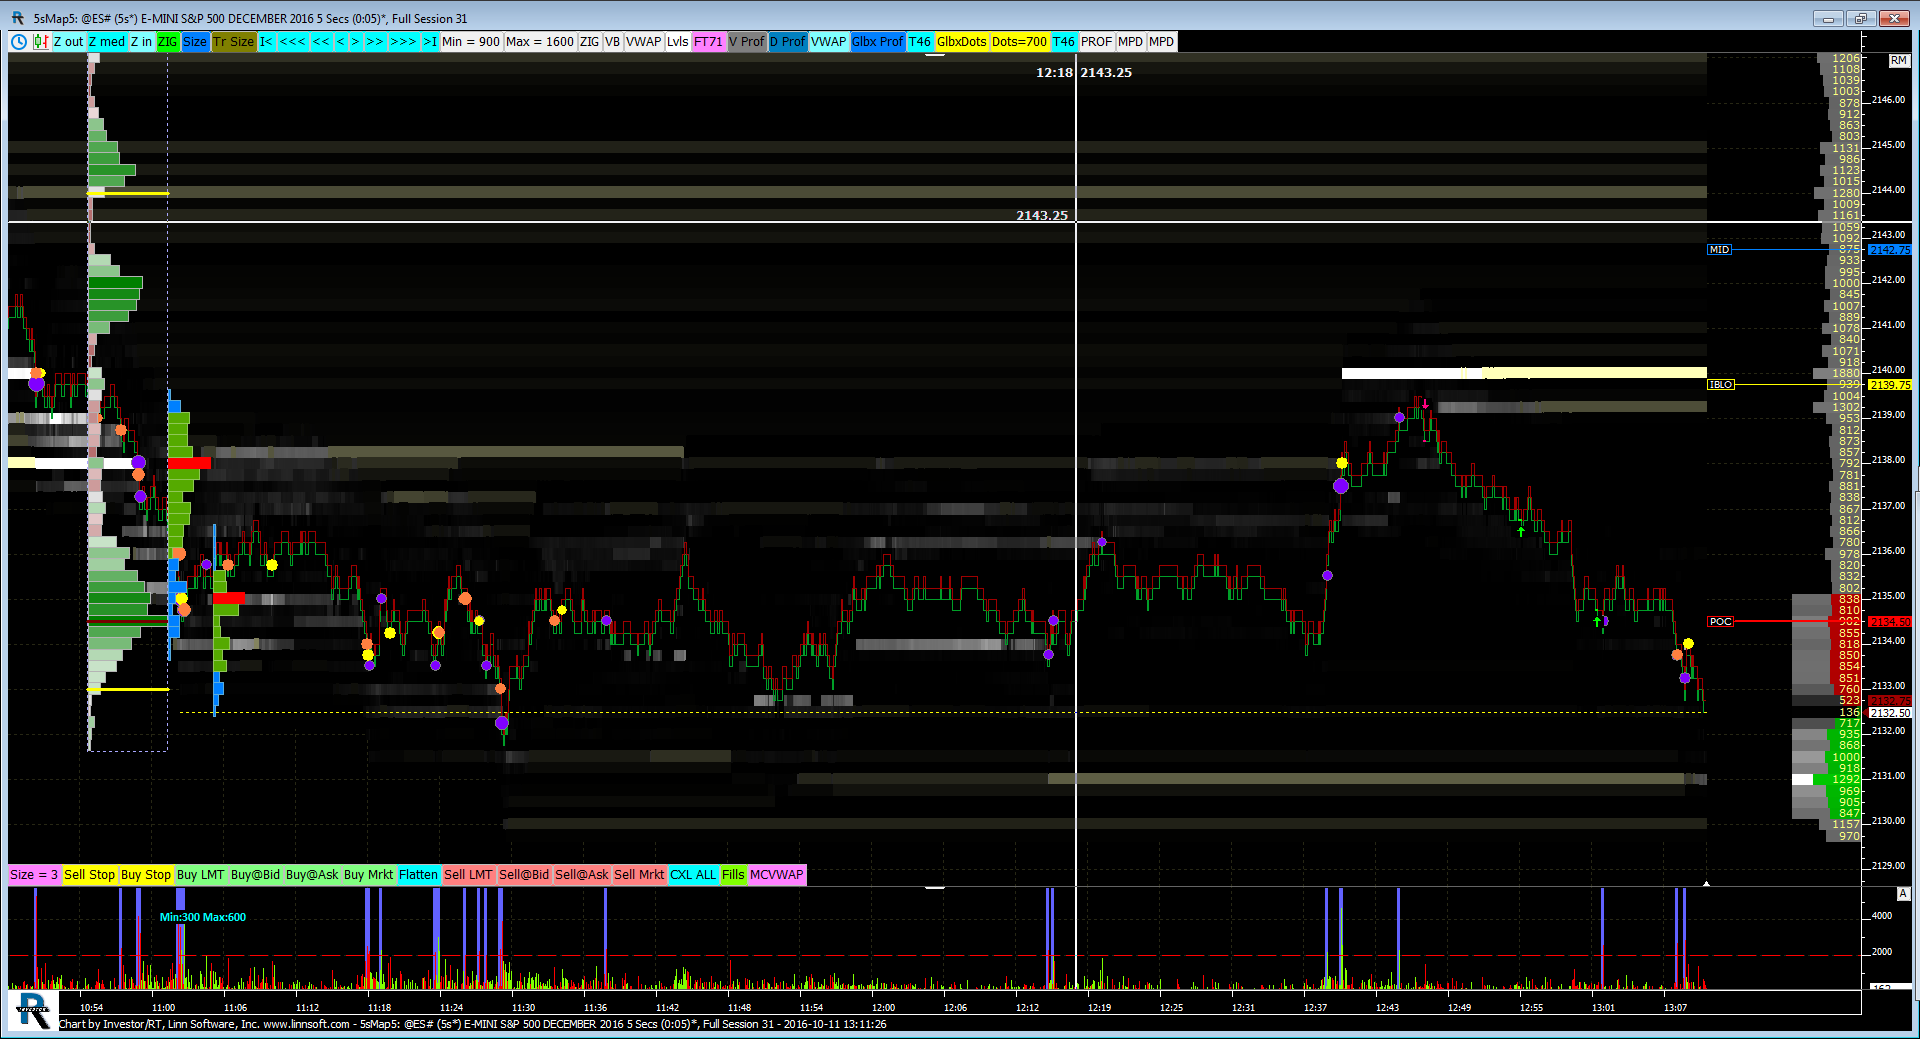
5sMap (@ES#) jayski51369 [totalcount]
9 years 2 months ago
This chart was uploaded by Investor/RT 12.6.5 showing symbol: @ES#. |
View |
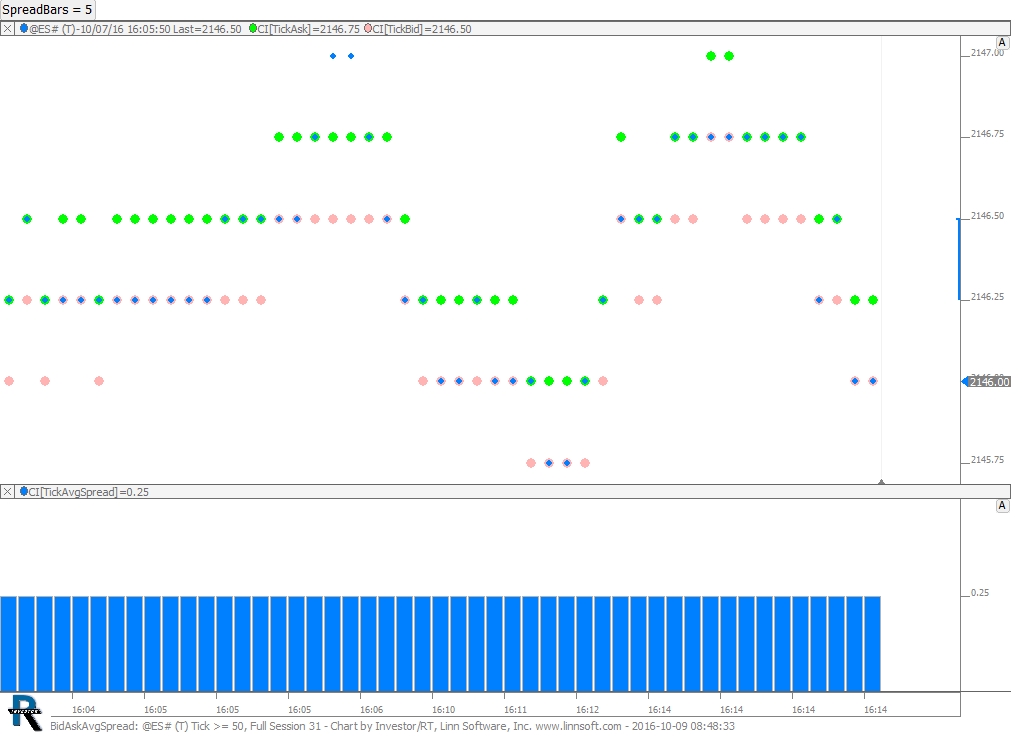 |
BidAskAvgSpread (@ES#) cpayne [totalcount]
9 years 2 months ago
Bid Ask Average Spread. This chart was uploaded by Investor/RT 12.6.5 showing symbol: @ES#. |
View |
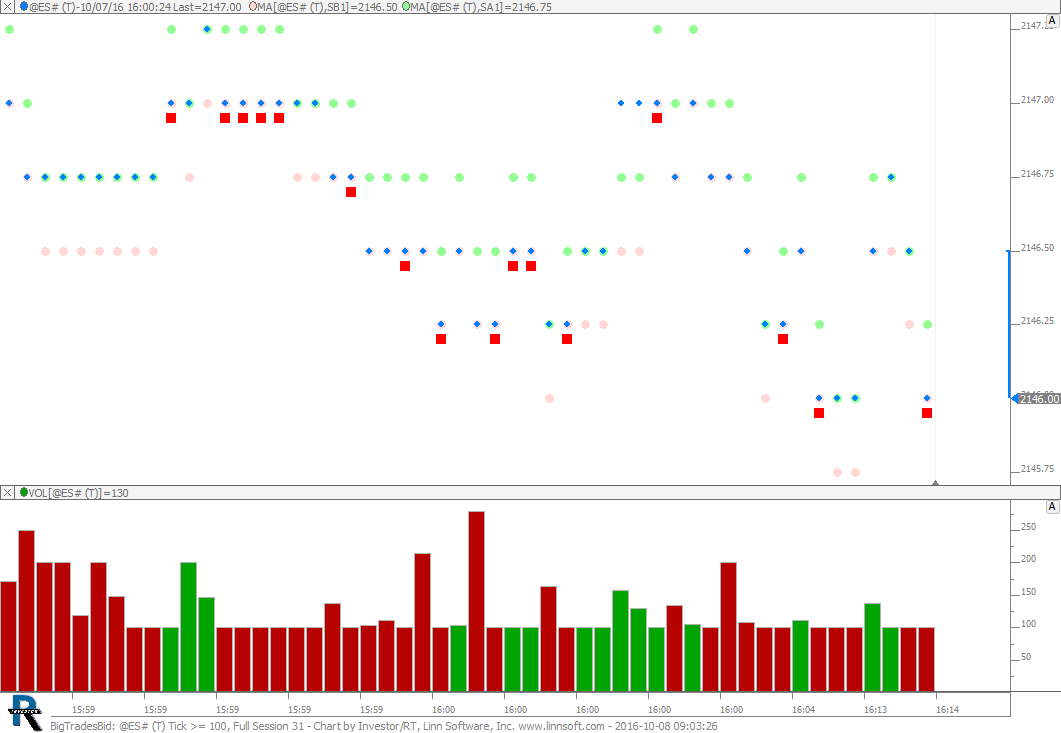 |
BigTradesBid (@ES#) cpayne [totalcount]
9 years 2 months ago
100 Lots on Bid. This chart was uploaded by Investor/RT 12.6.5 showing symbol: @ES#. |
View |
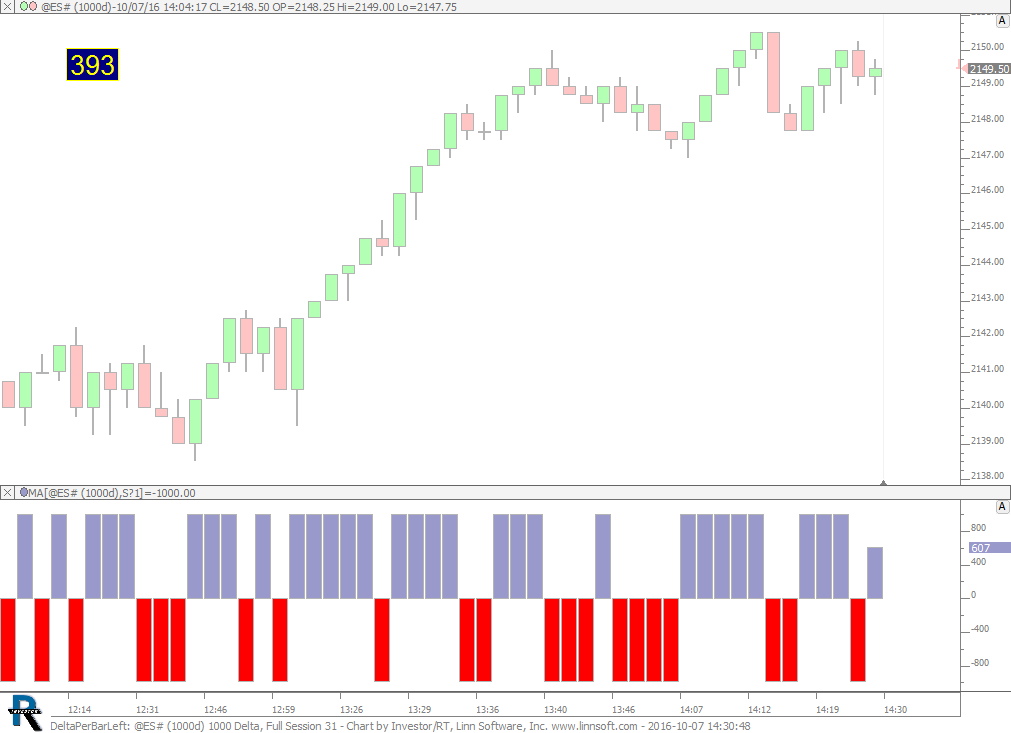 |
DeltaPerBarLeft (@ES#) cpayne [totalcount]
9 years 2 months ago
Delta Per Bar / BarLeft. This chart was uploaded by Investor/RT 12.6.5 showing symbol: @ES#. |
View |
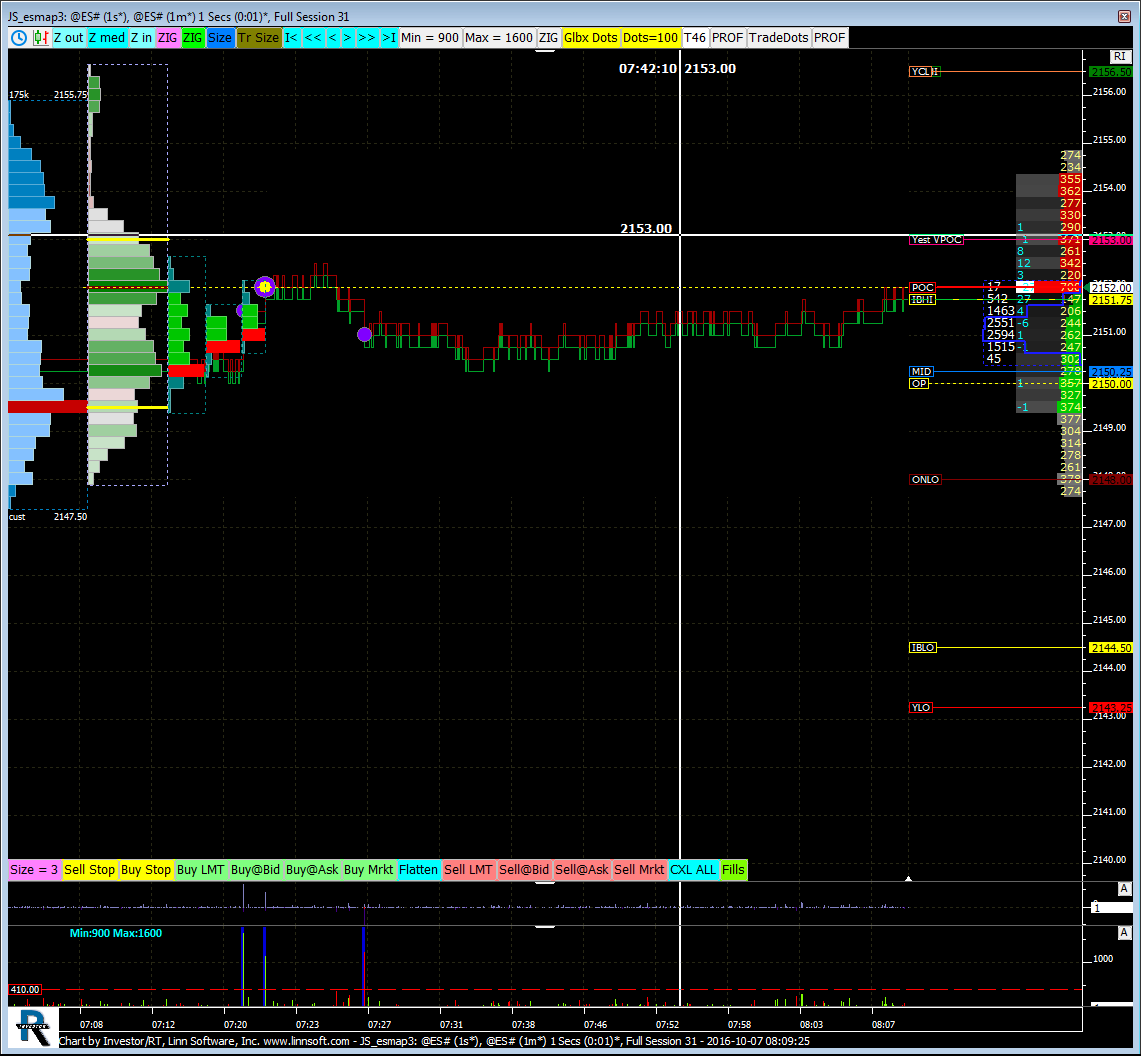 |
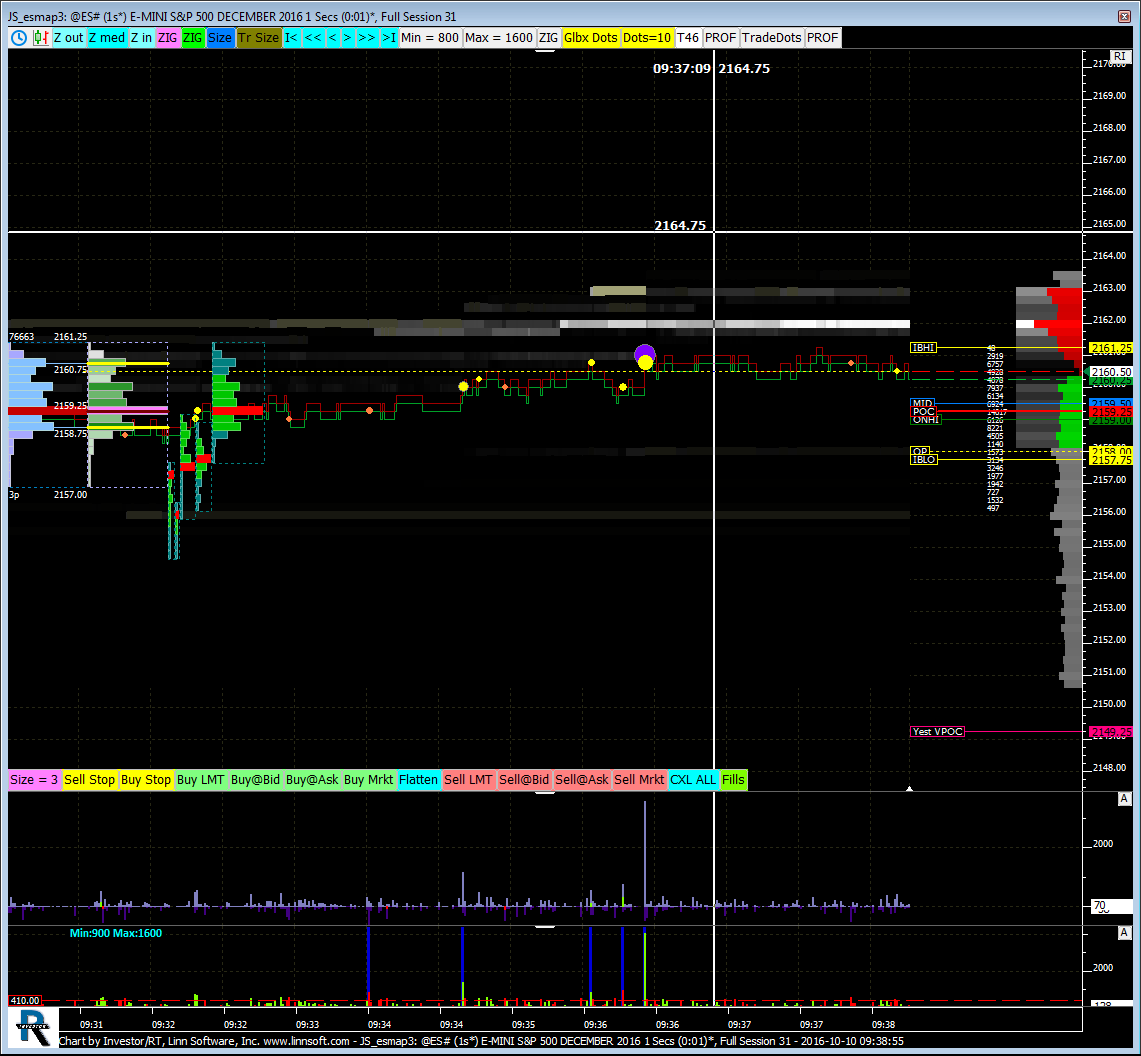
JS esmap (@ES#) jayski51369 [totalcount]
9 years 2 months ago
This chart was uploaded by Investor/RT 12.6.5 showing symbol: @ES#. |
View |
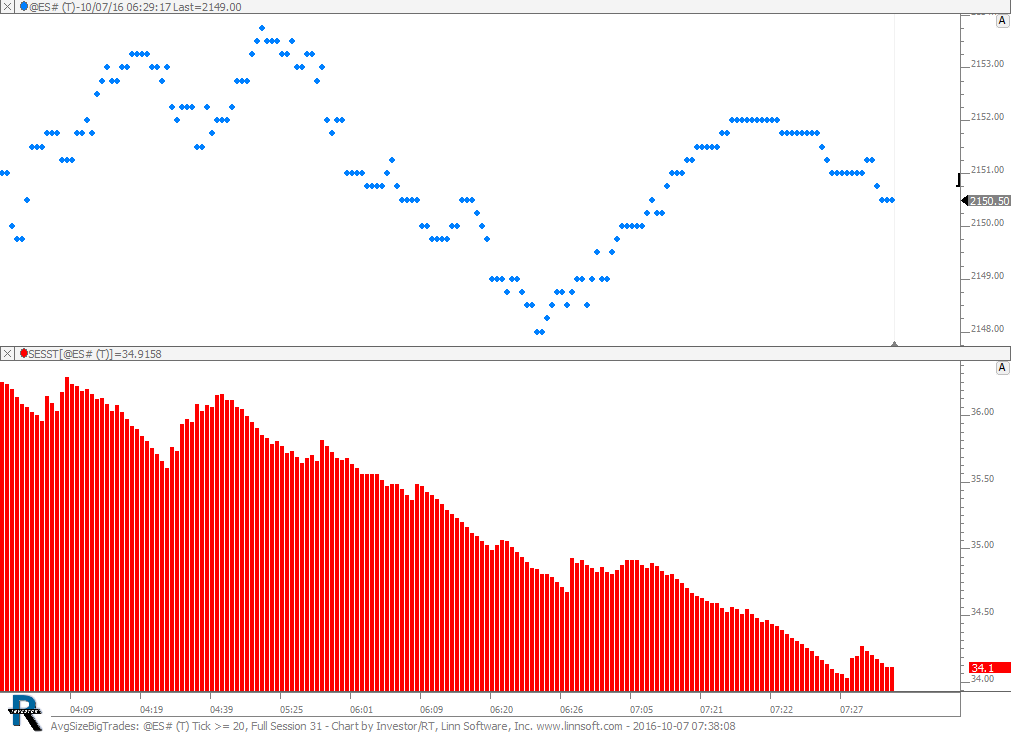 |
AvgSizeBigTrades (@ES#) cpayne [totalcount]
9 years 2 months ago
Average Size of All Big Trades in Chart. This chart was uploaded by Investor/RT 12.6.5 showing symbol: @ES#. |
View |
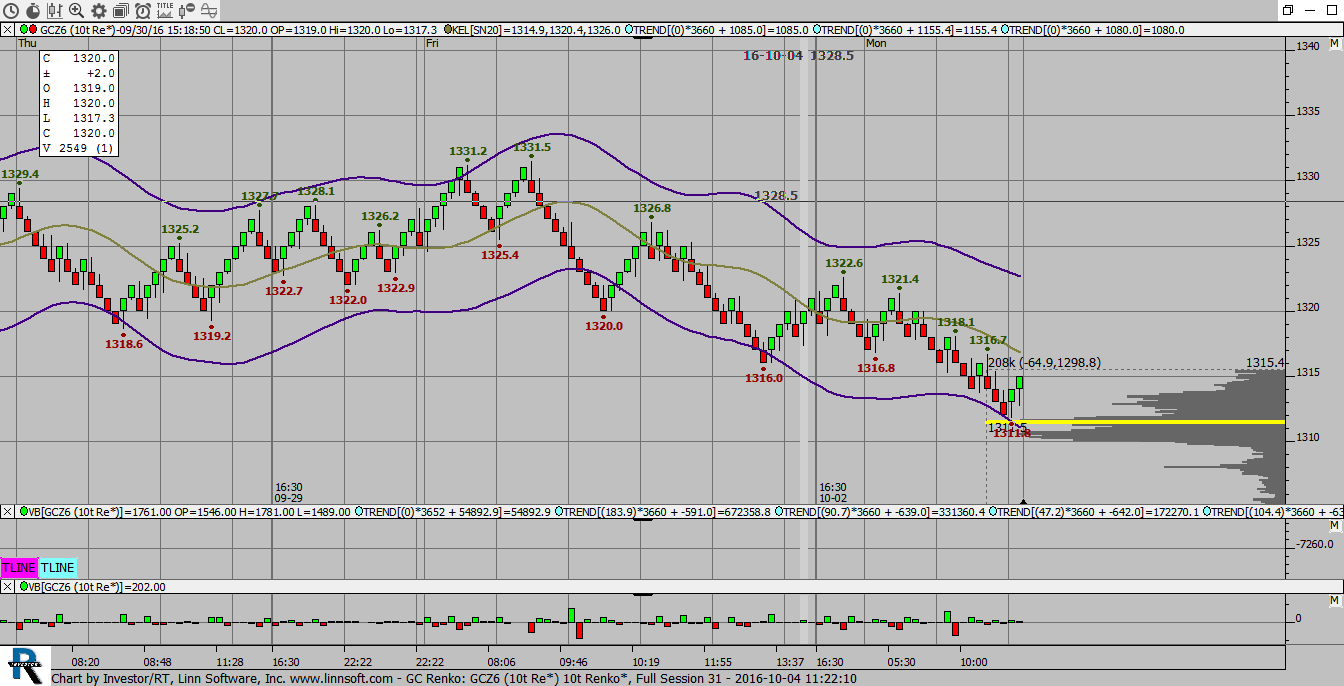 |
GC Renko (GCZ6) Quantum Leap [totalcount]
9 years 2 months ago
This chart was uploaded by Investor/RT 12.6.4 showing symbol: GCZ6. |
View |
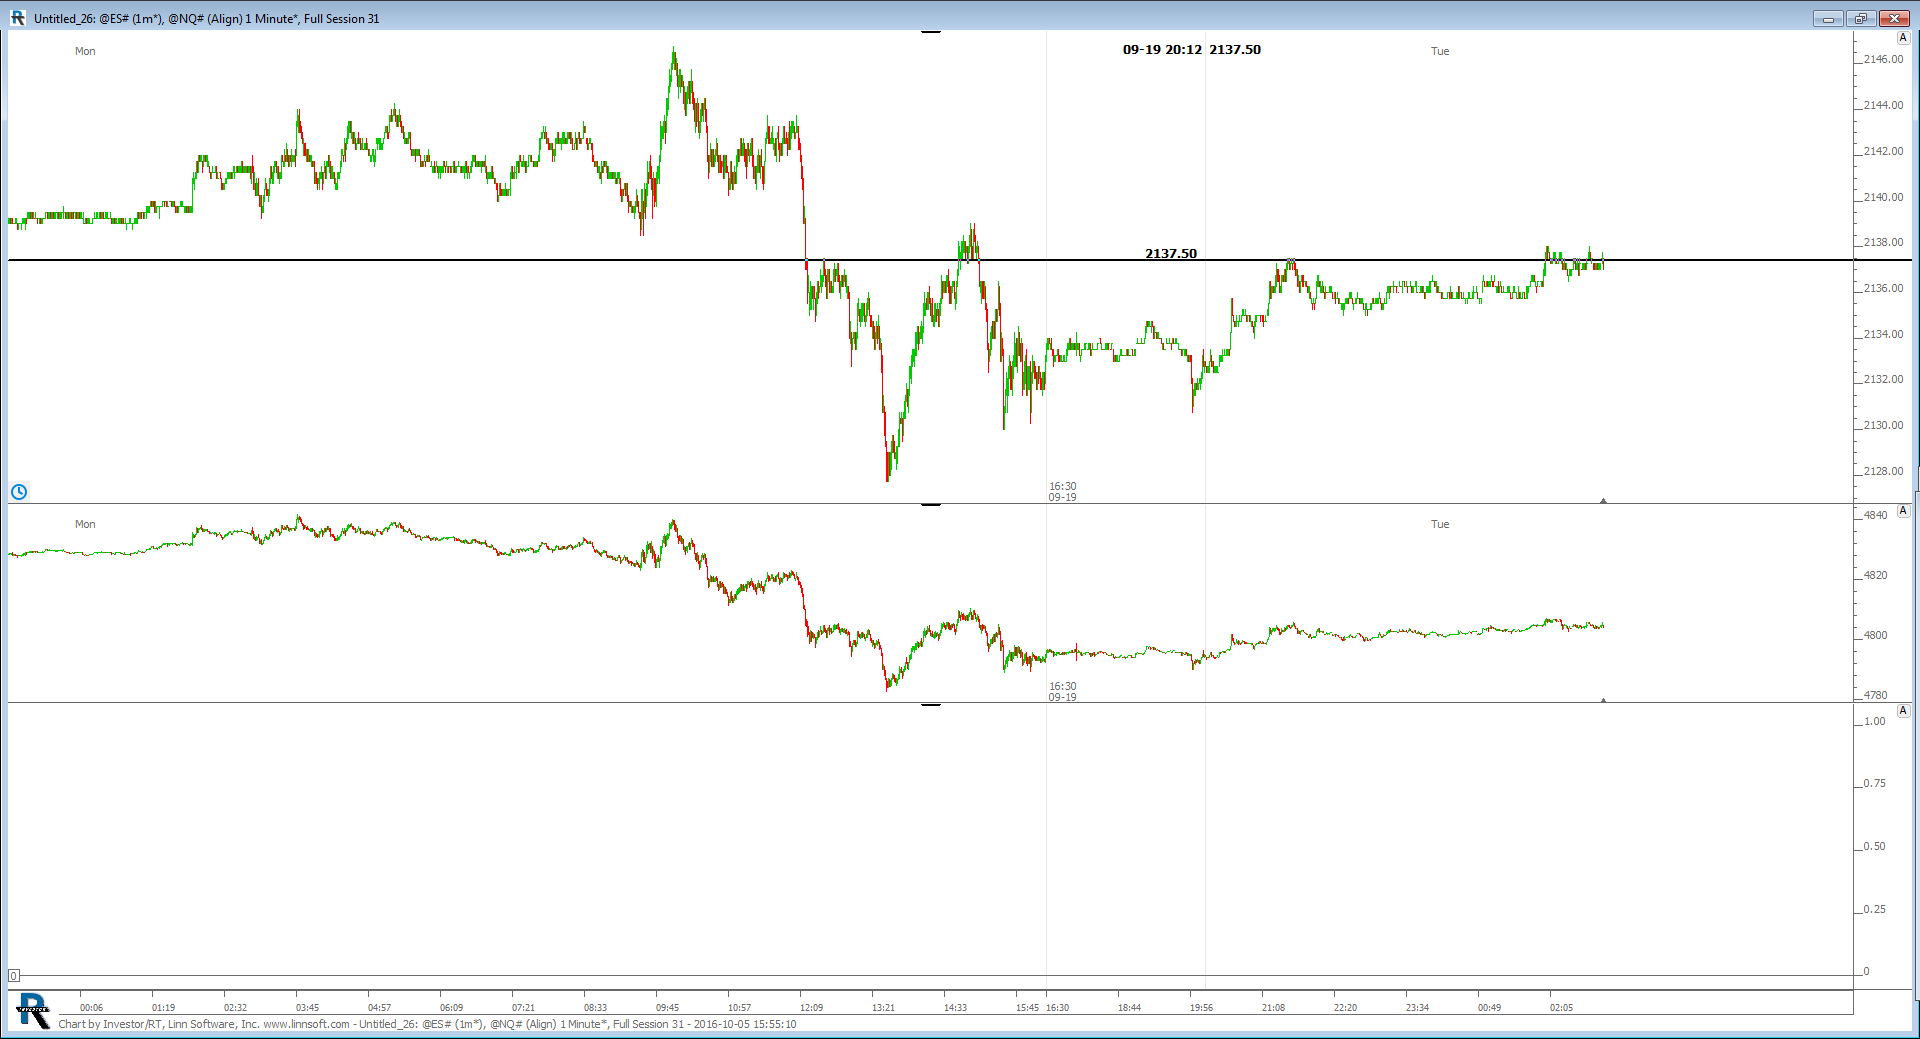 |
Untitled (@ES#) 2 jayski51369 [totalcount]
9 years 2 months ago
This chart was uploaded by Investor/RT 12.6.3 showing symbol: @ES#. |
View |
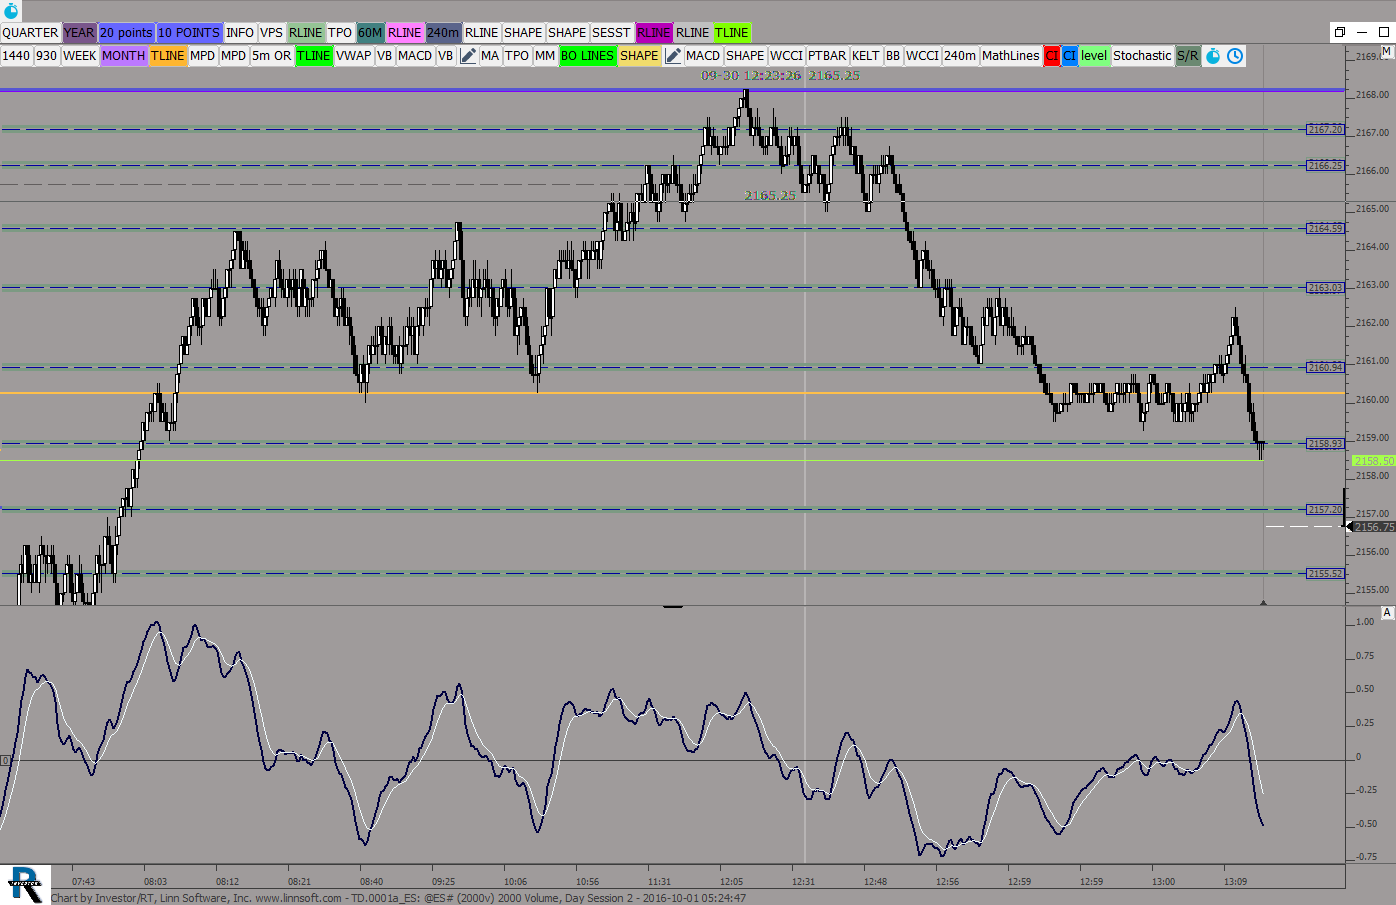 |
TD0001a ES (@ES#) ES42 [totalcount]
9 years 2 months ago
cannot draw lines on this chart. This chart was uploaded by Investor/RT 12.6.4 showing symbol: @ES#. |
View |
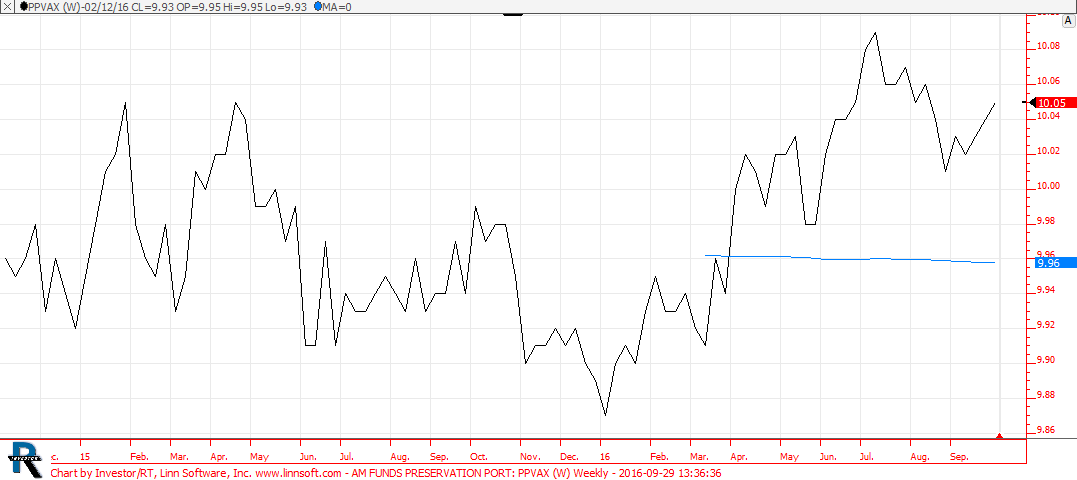 |
AM FUNDS PRESERVATION PORT (PPVAX) 2 hoga909 [totalcount]
9 years 2 months ago
PPVX. This chart was uploaded by Investor/RT 12.6.4 showing symbol: PPVAX. |
View |
 |
AM FUNDS PRESERVATION PORT (PPVAX) hoga909 [totalcount]
9 years 2 months ago
PPVX. This chart was uploaded by Investor/RT 12.6.4 showing symbol: PPVAX. |
View |
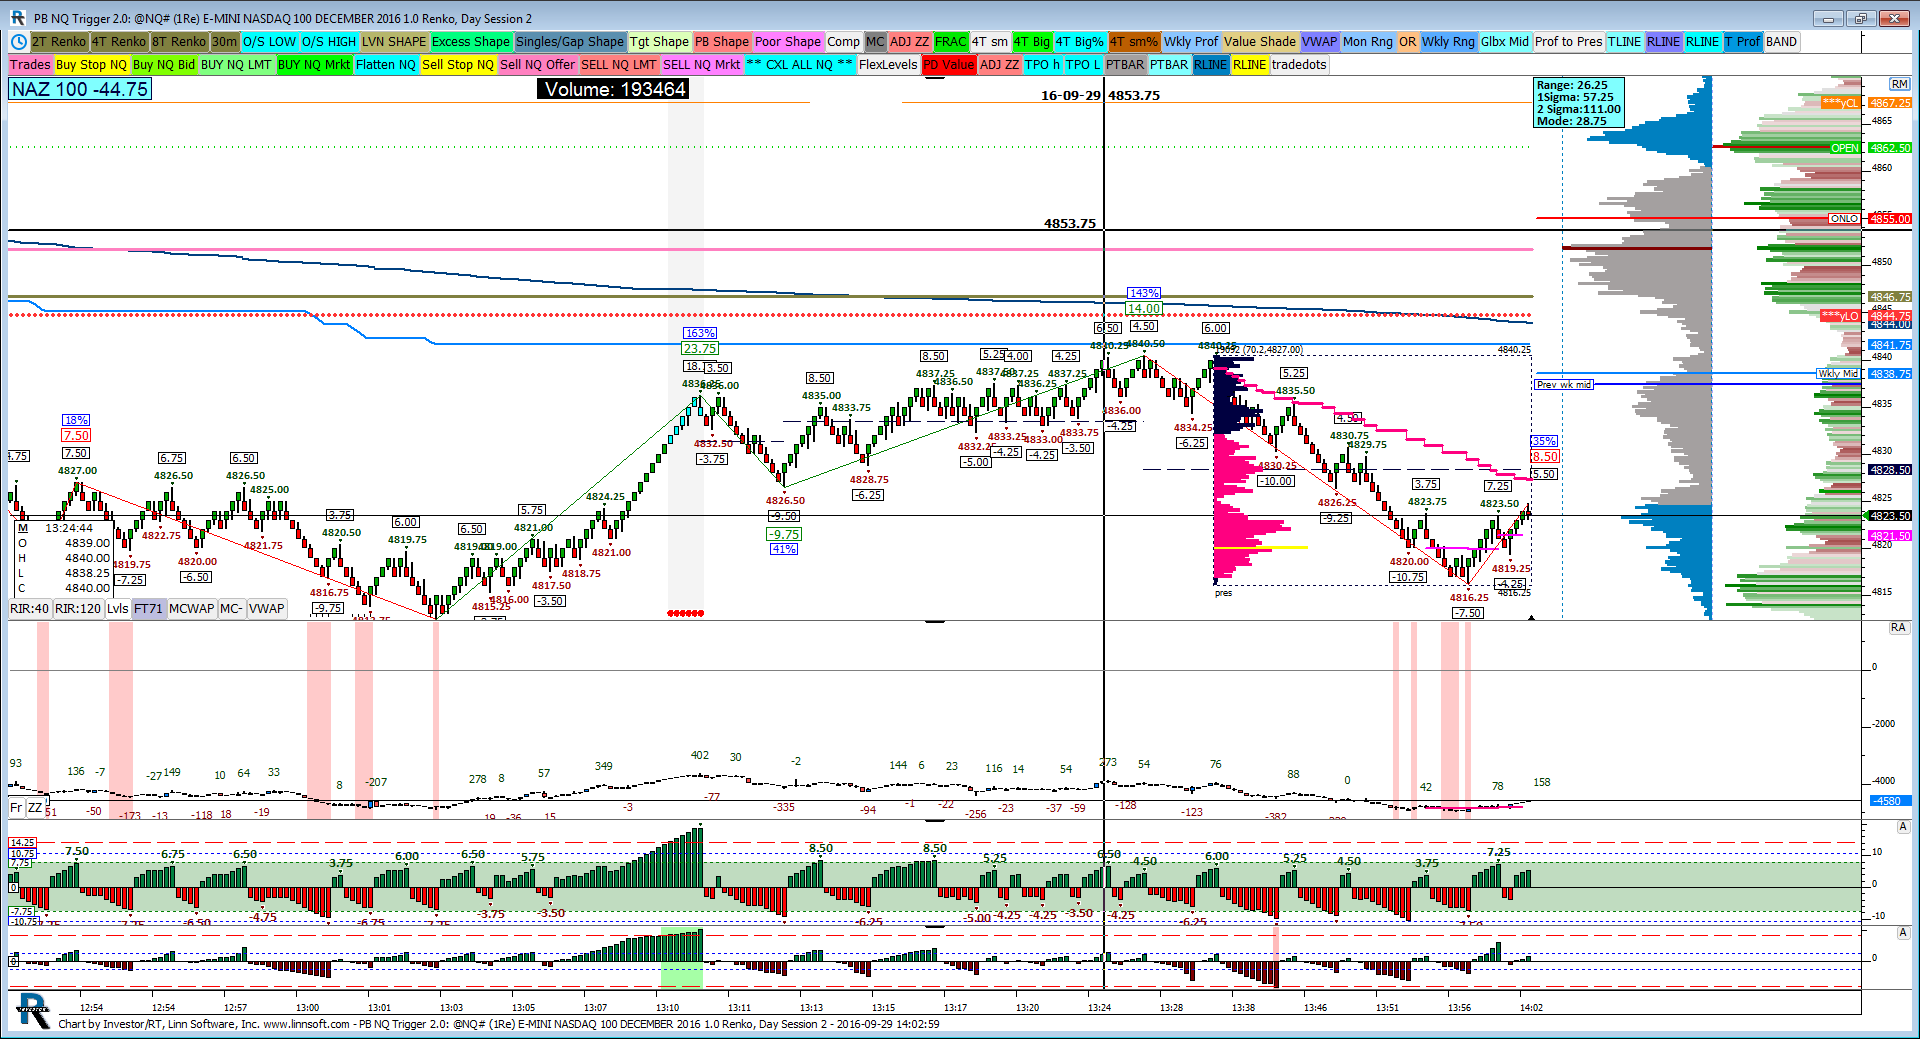 |
PB NQ Trigger (@NQ#) 3 jayski51369 [totalcount]
9 years 2 months ago
This chart was uploaded by Investor/RT 12.6.3 showing symbol: @NQ#. |
View |
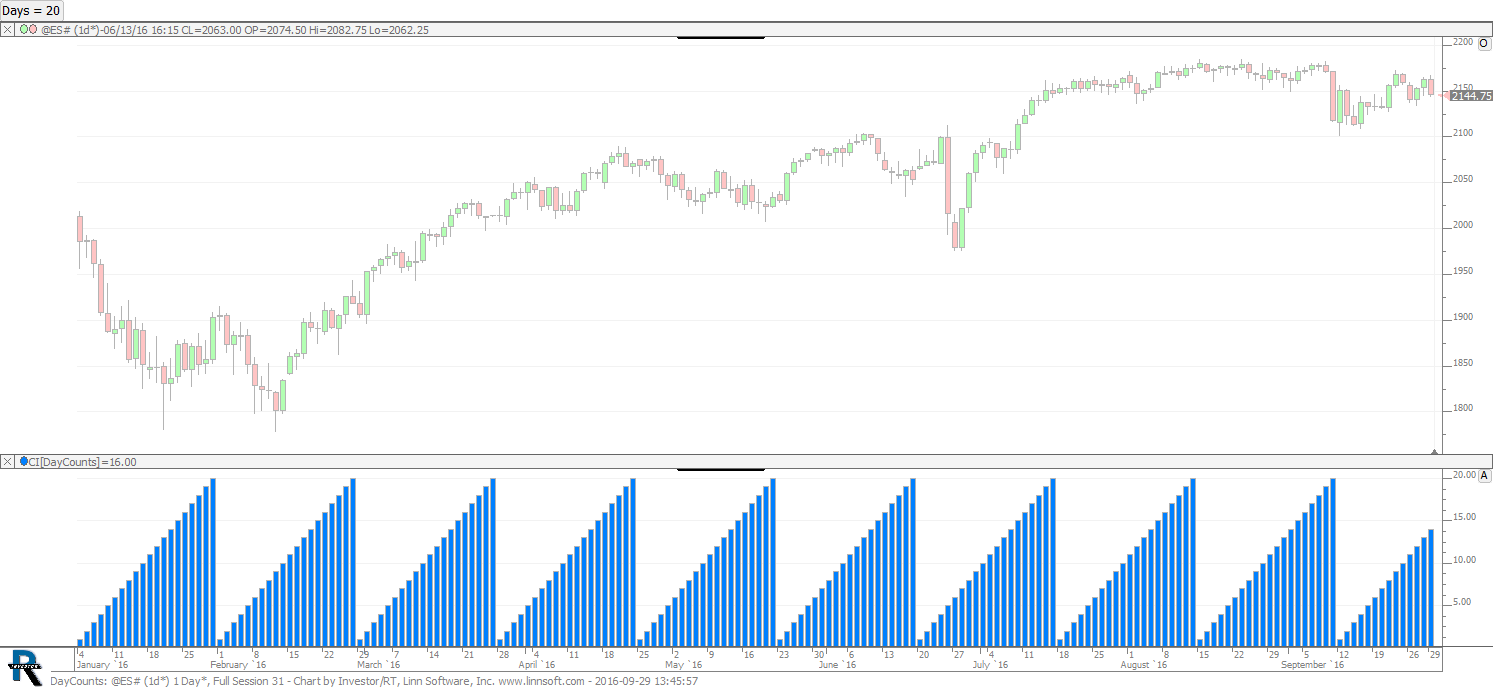 |
DayCounts (@ES#) cpayne [totalcount]
9 years 2 months ago
Day Counts. This chart was uploaded by Investor/RT 12.6.4 showing symbol: @ES#. |
View |
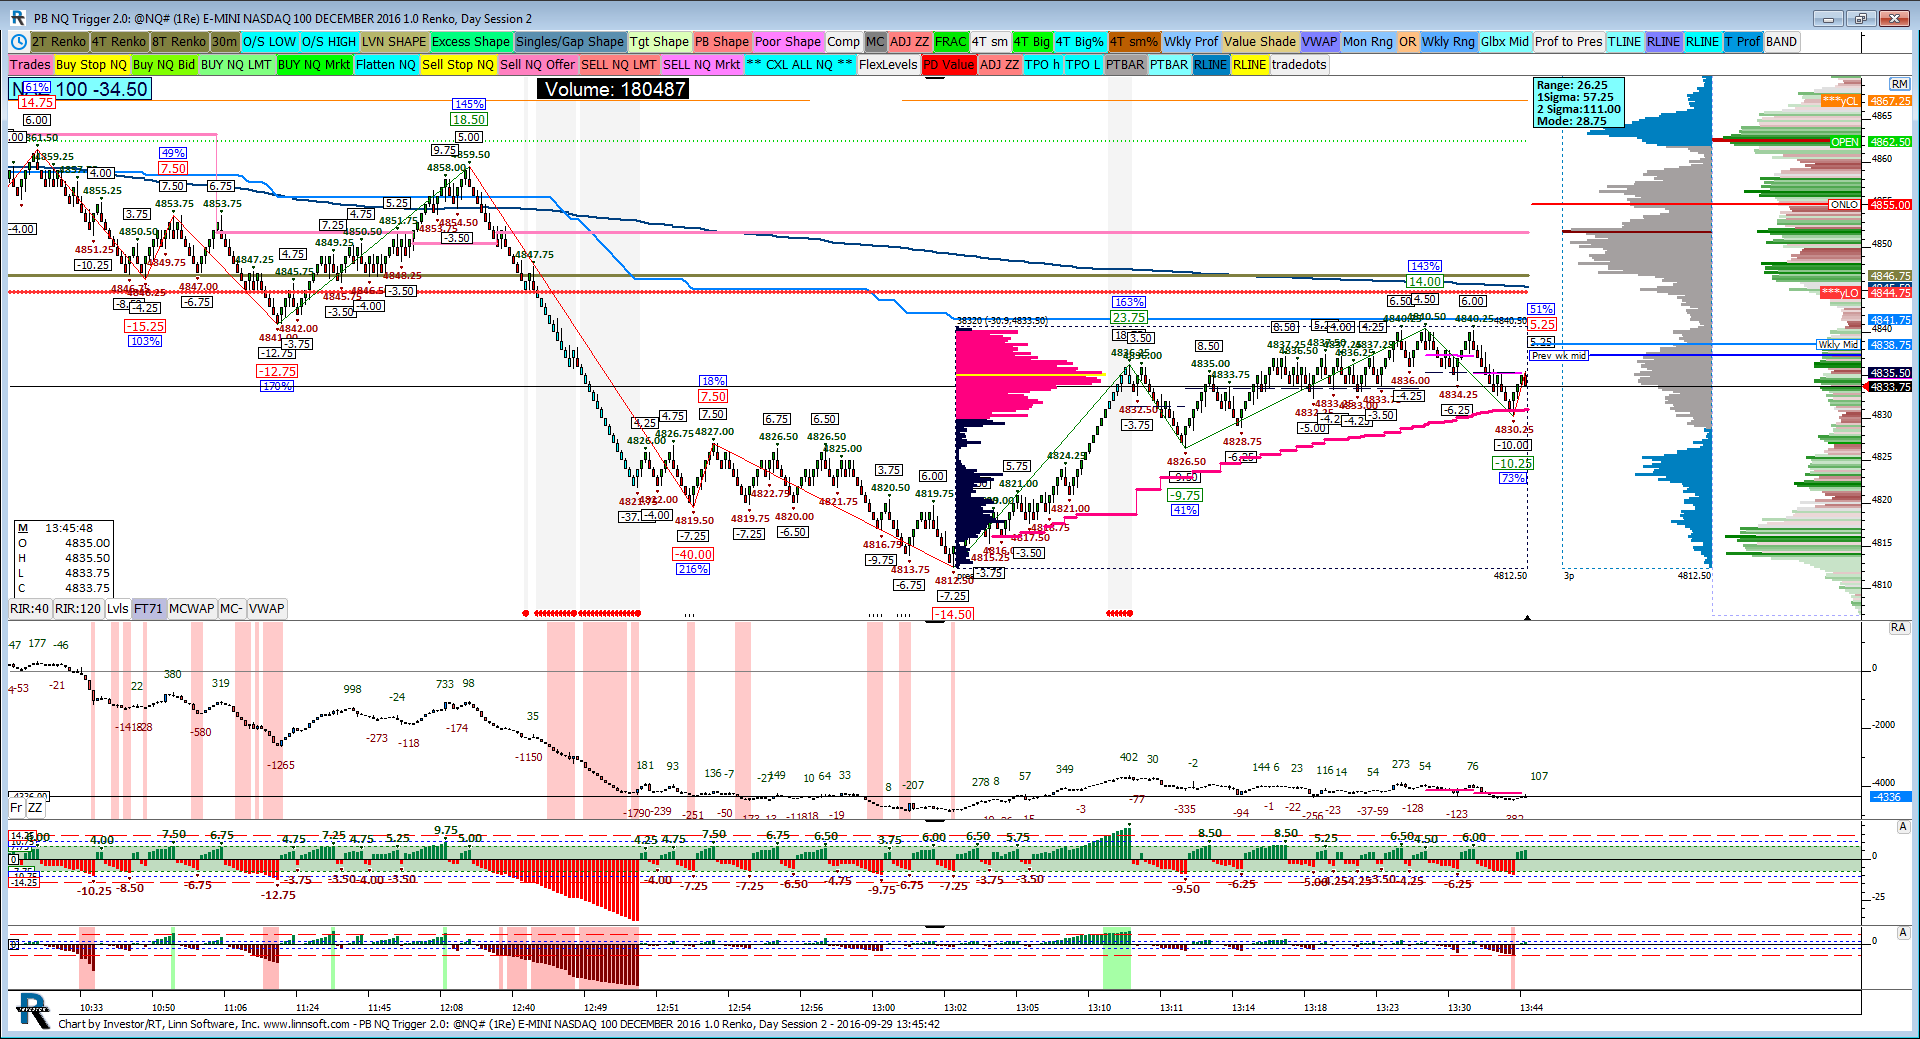 |
PB NQ Trigger (@NQ#) 2 jayski51369 [totalcount]
9 years 2 months ago
This chart was uploaded by Investor/RT 12.6.3 showing symbol: @NQ#. |
View |
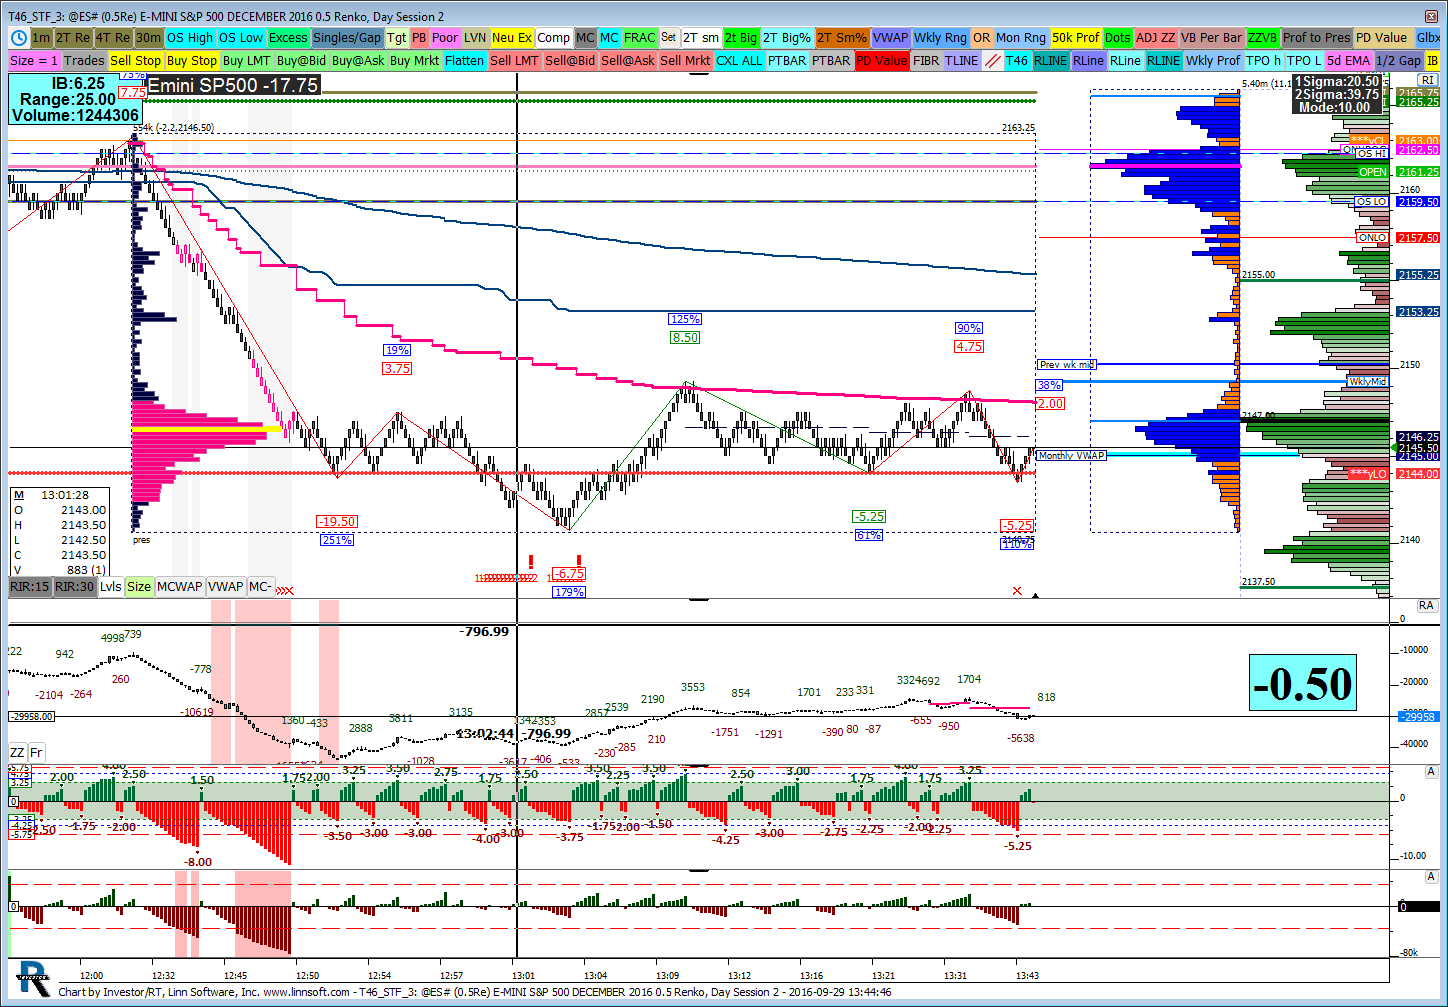 |
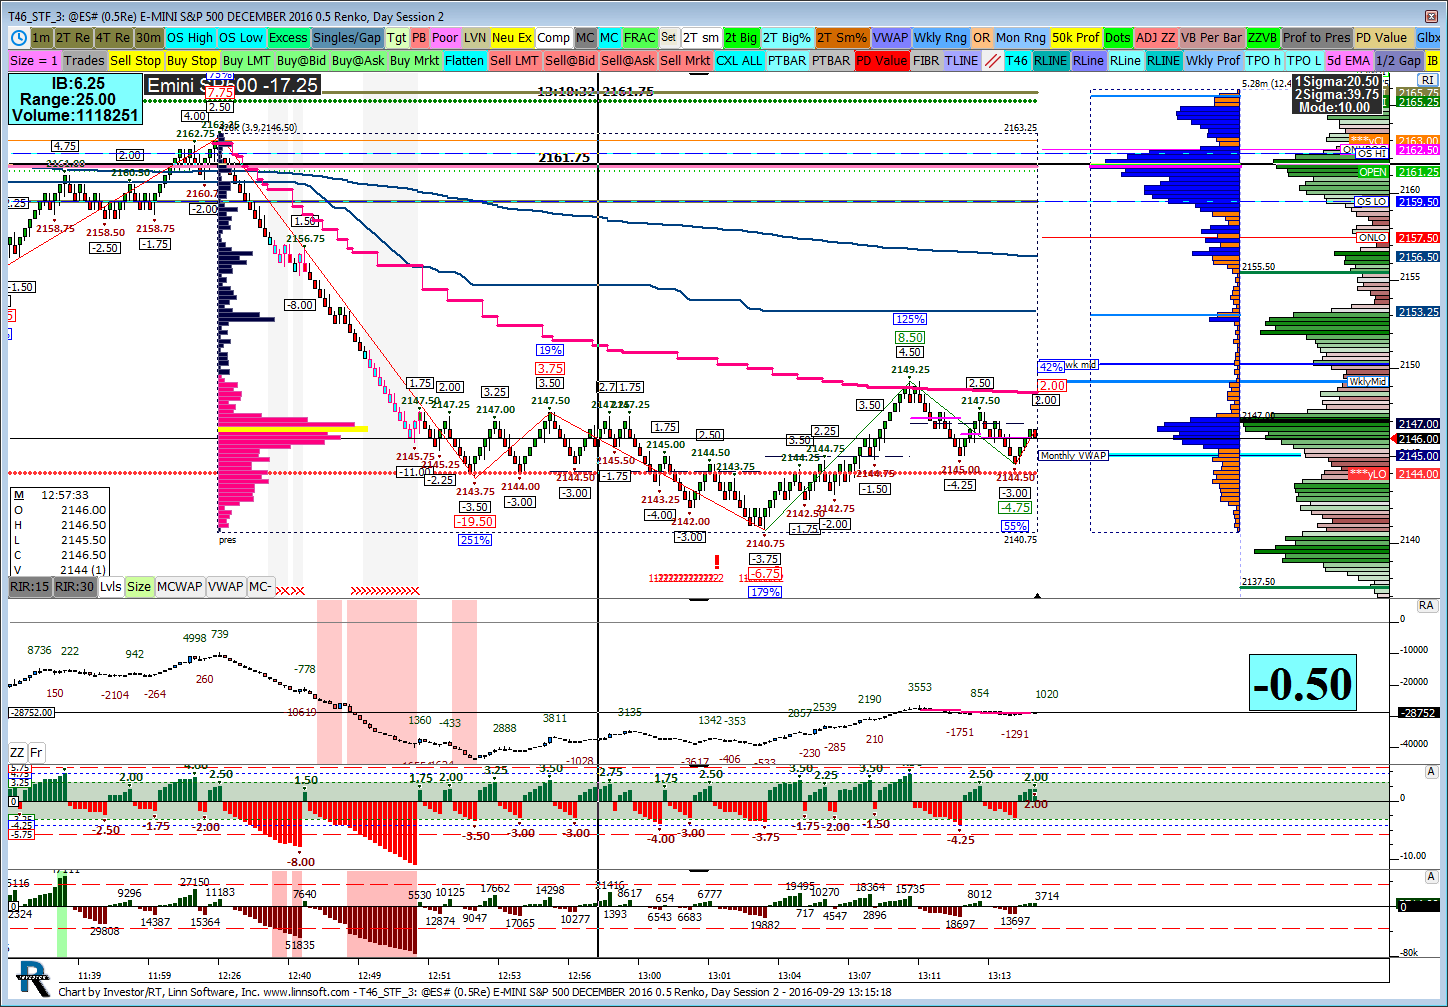
T46 STF (@ES#) 9 jayski51369 [totalcount]
9 years 2 months ago
This chart was uploaded by Investor/RT 12.6.3 showing symbol: @ES#. |
View |
 |
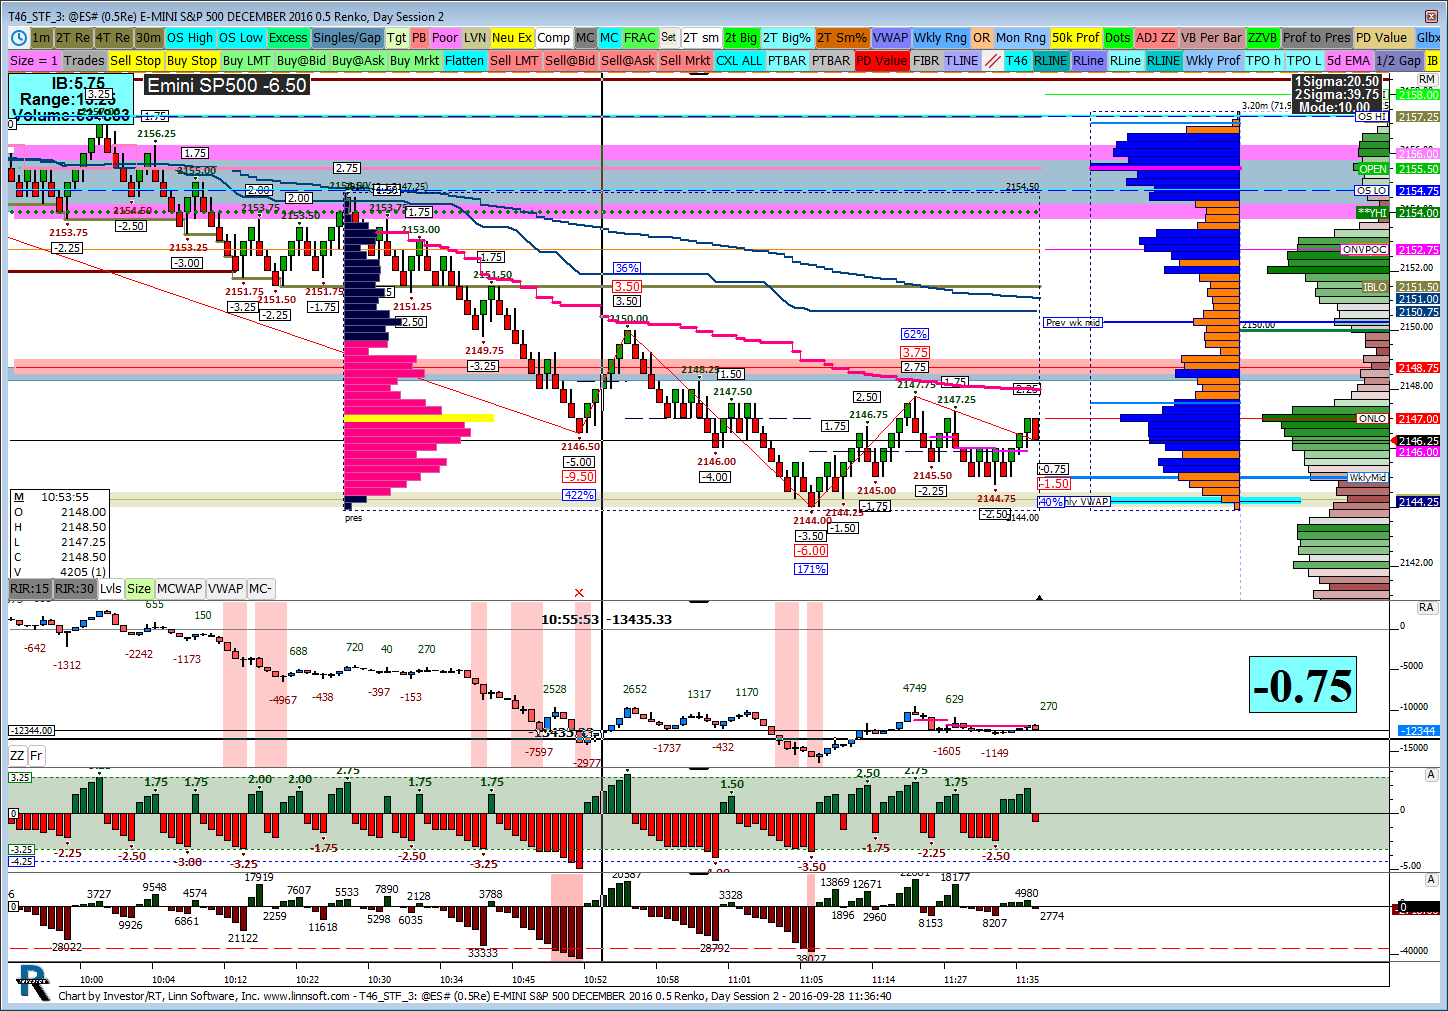
T46 STF (@ES#) 8 jayski51369 [totalcount]
9 years 2 months ago
This chart was uploaded by Investor/RT 12.6.3 showing symbol: @ES#. |
View |
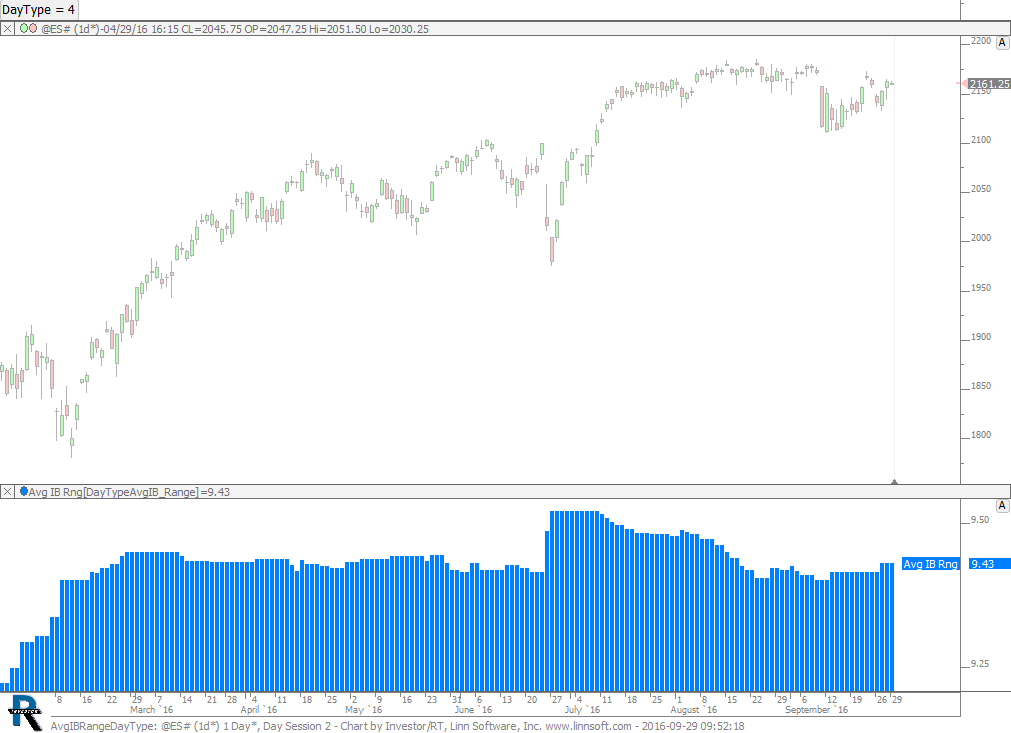 |
AvgIBRangeDayType (@ES#) cpayne [totalcount]
9 years 2 months ago
Average IB Range by Day Type. This chart was uploaded by Investor/RT 12.6.4 showing symbol: @ES#. |
View |
 |
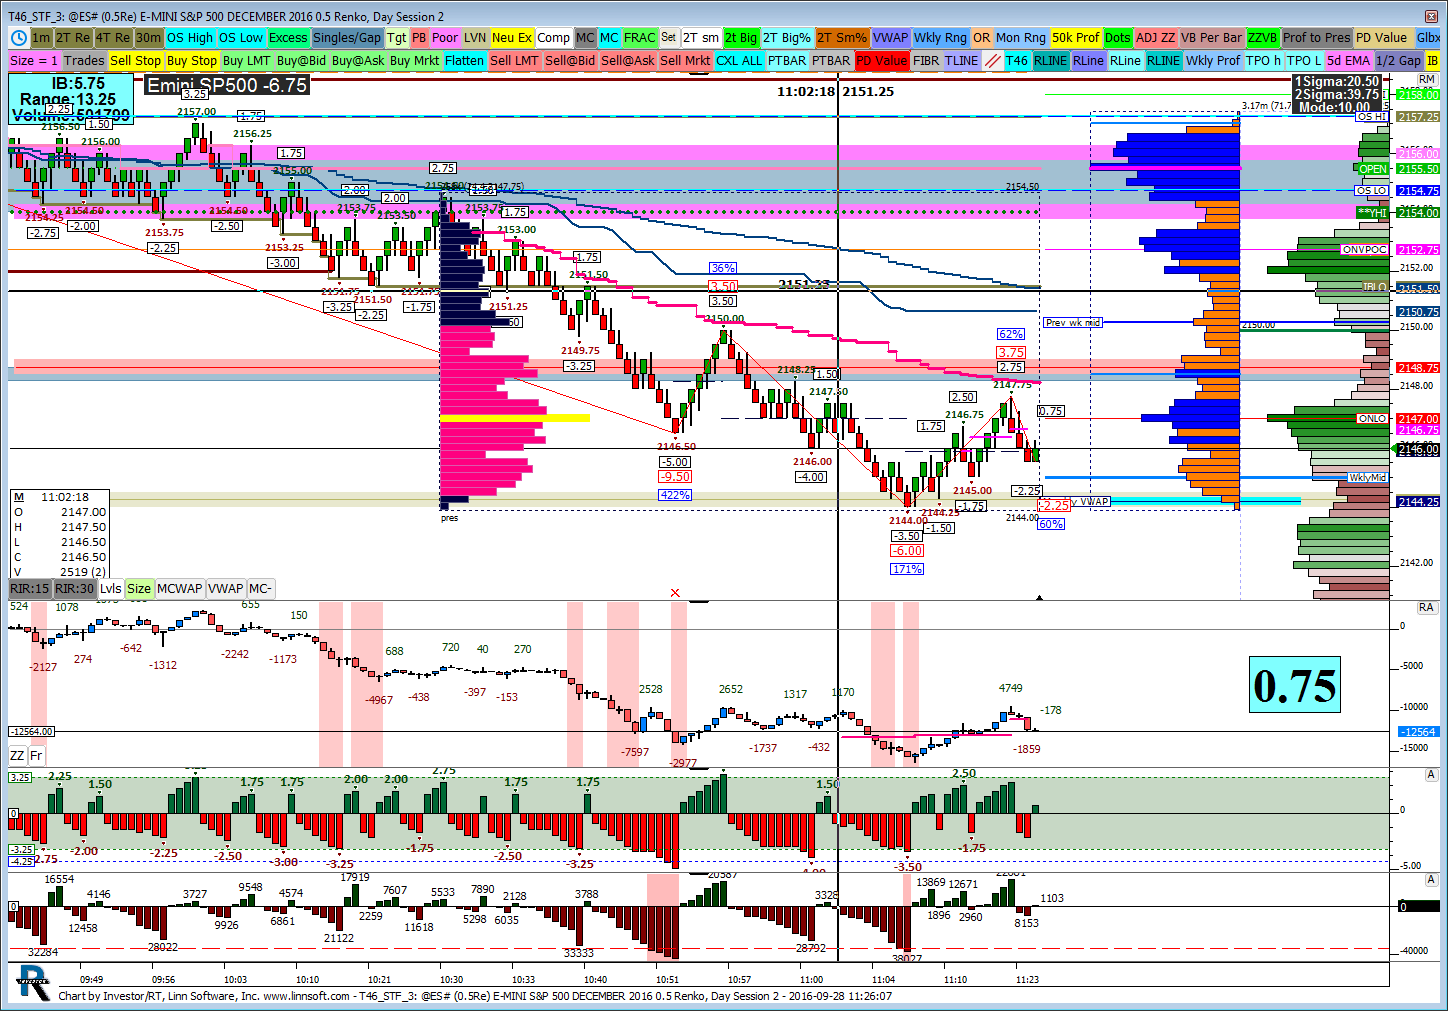
T46 STF (@ES#) 7 jayski51369 [totalcount]
9 years 2 months ago
This chart was uploaded by Investor/RT 12.6.3 showing symbol: @ES#. |
View |
 |
T46 STF (@ES#) 6 jayski51369 [totalcount]
9 years 2 months ago
This chart was uploaded by Investor/RT 12.6.3 showing symbol: @ES#. |
View |