 |
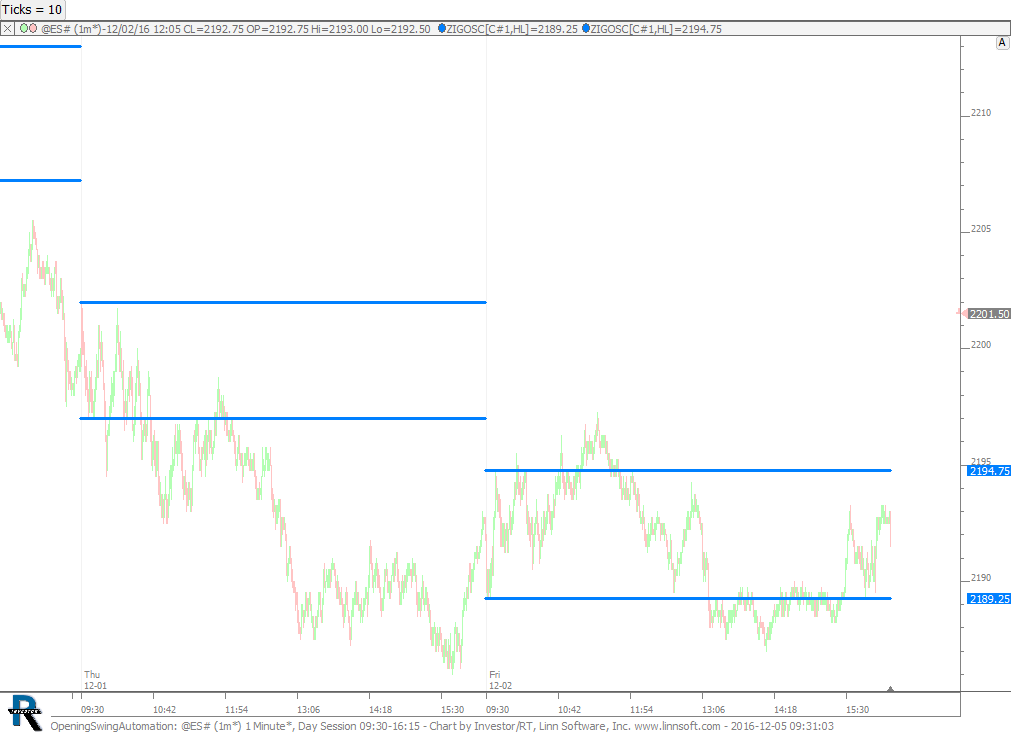
OpeningSwingAutomation (@ES#) cpayne [totalcount]
9 years 8 months ago
Opening Swing Automation. This chart was uploaded by Investor/RT 12.7.1 showing symbol: @ES#. |
View |
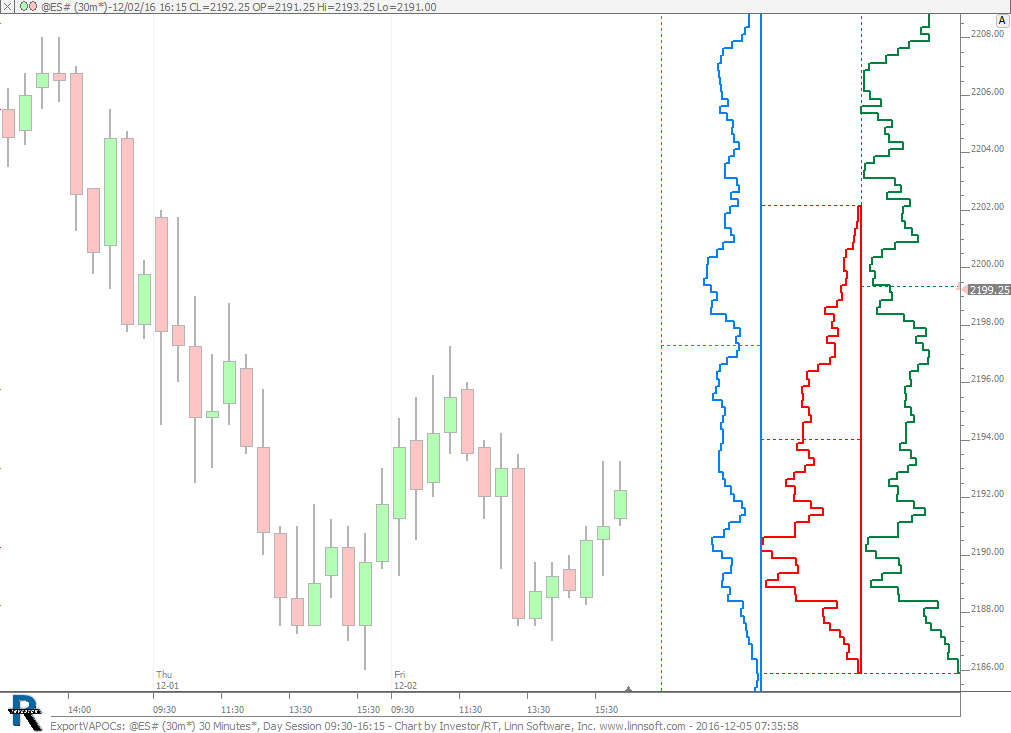 |
ExportVAPOCs (@ES#) cpayne [totalcount]
9 years 8 months ago
This chart was uploaded by Investor/RT 12.7.1 showing symbol: @ES#. |
View |
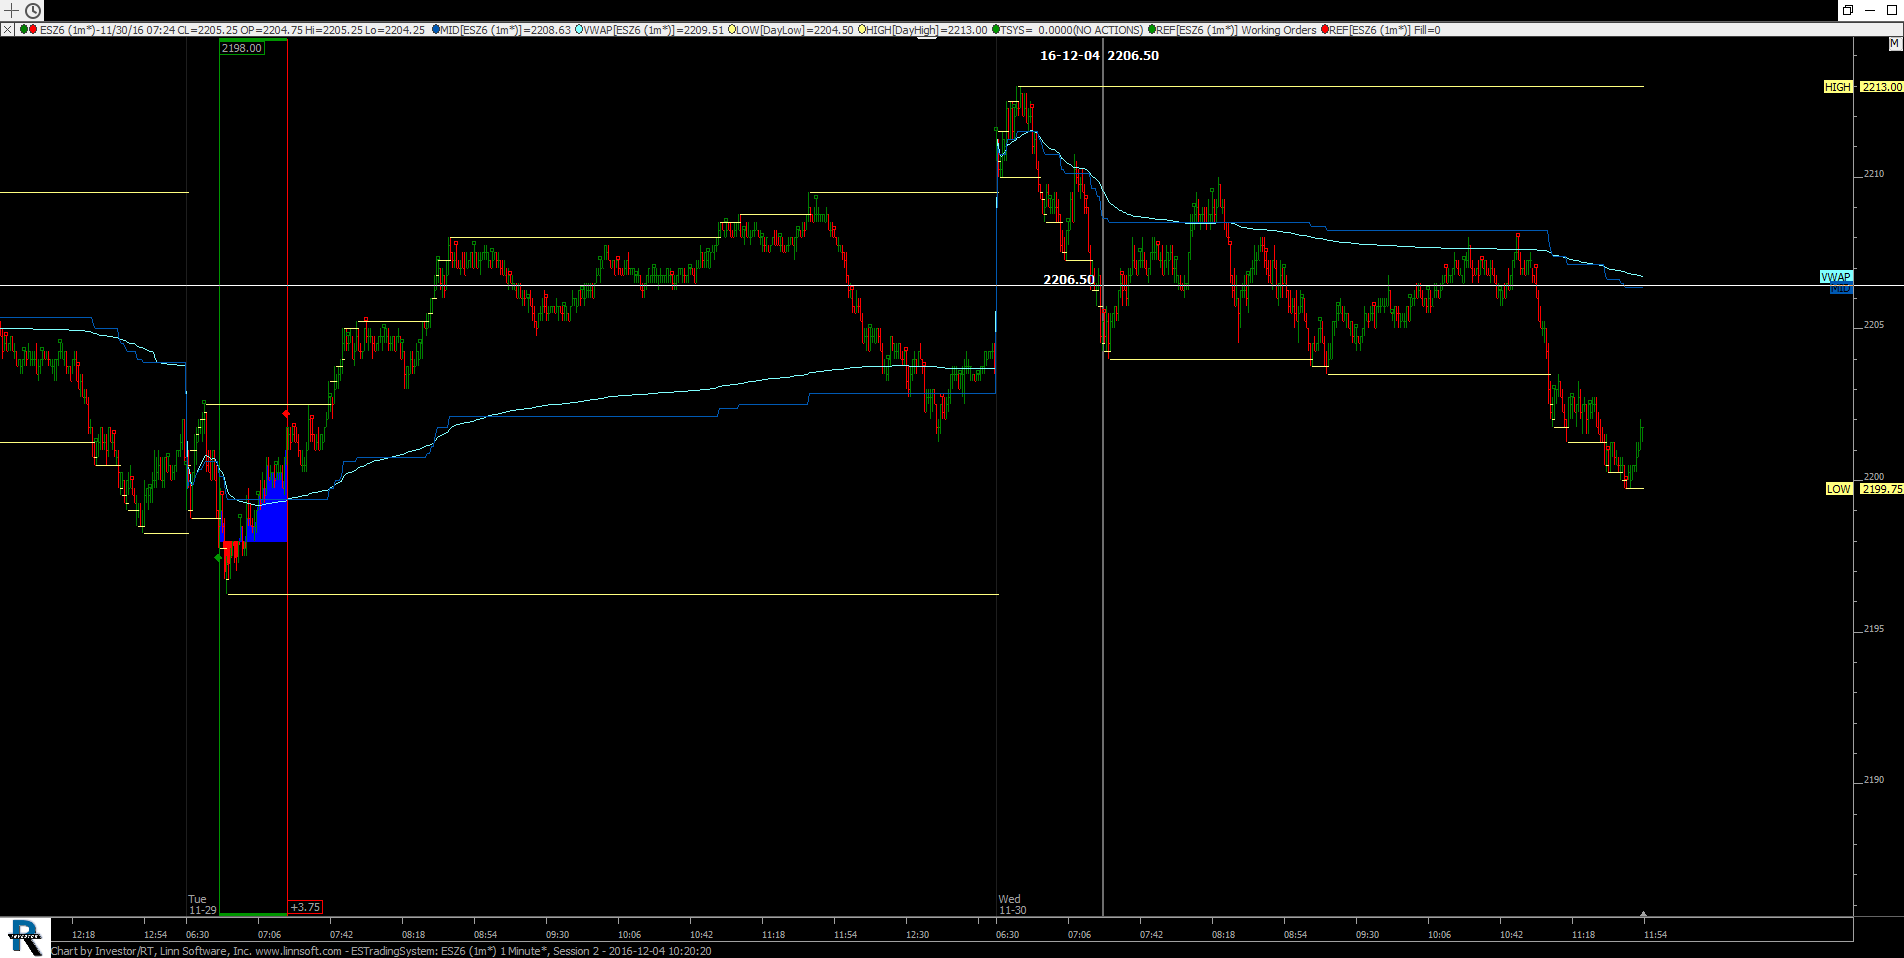 |
ESTradingSystem (ESZ6) mostafacali [totalcount]
9 years 8 months ago
This chart was uploaded by Investor/RT 12.6.8 showing symbol: ESZ6. |
View |
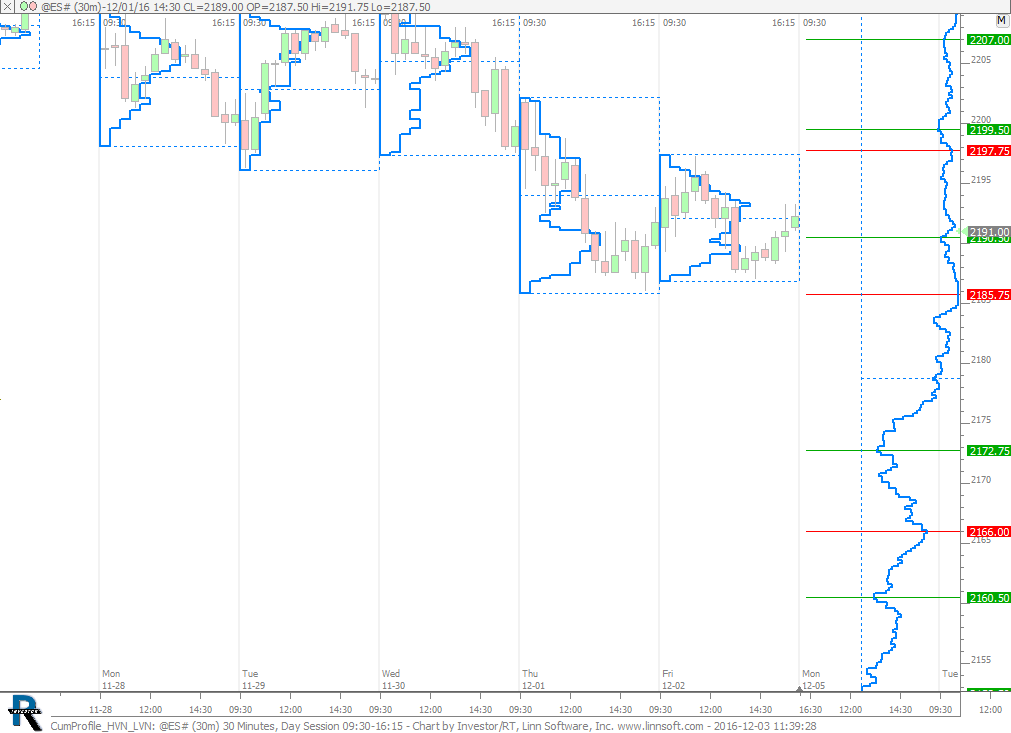 |
CumProfile HVN LVN (@ES#) cpayne [totalcount]
9 years 8 months ago
This chart was uploaded by Investor/RT 12.7.1 showing symbol: @ES#. |
View |
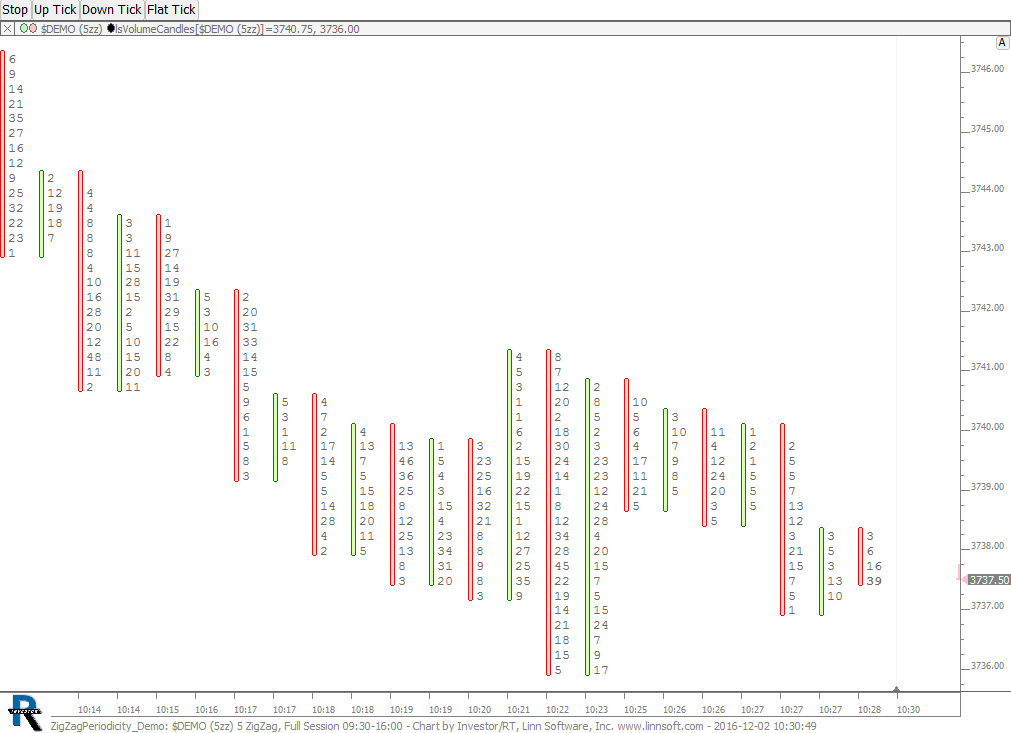 |
ZigZagPeriodicity Demo ($DEMO) cpayne [totalcount]
9 years 8 months ago
Zig Zag Periodicity with Buttons on $DEMO. This chart was uploaded by Investor/RT 12.7.1 showing symbol: $DEMO. |
View |
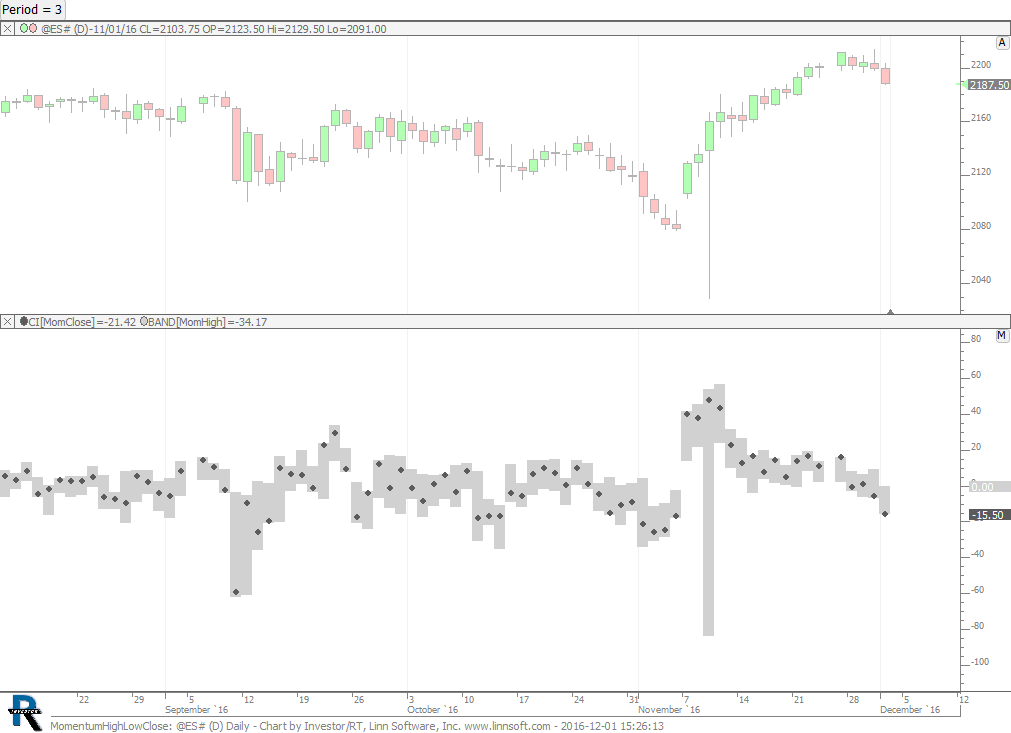 |
MomentumHighLowClose (@ES#) cpayne [totalcount]
9 years 8 months ago
Momentum High, Low, and Close. This chart was uploaded by Investor/RT 12.7.1 showing symbol: @ES#. |
View |
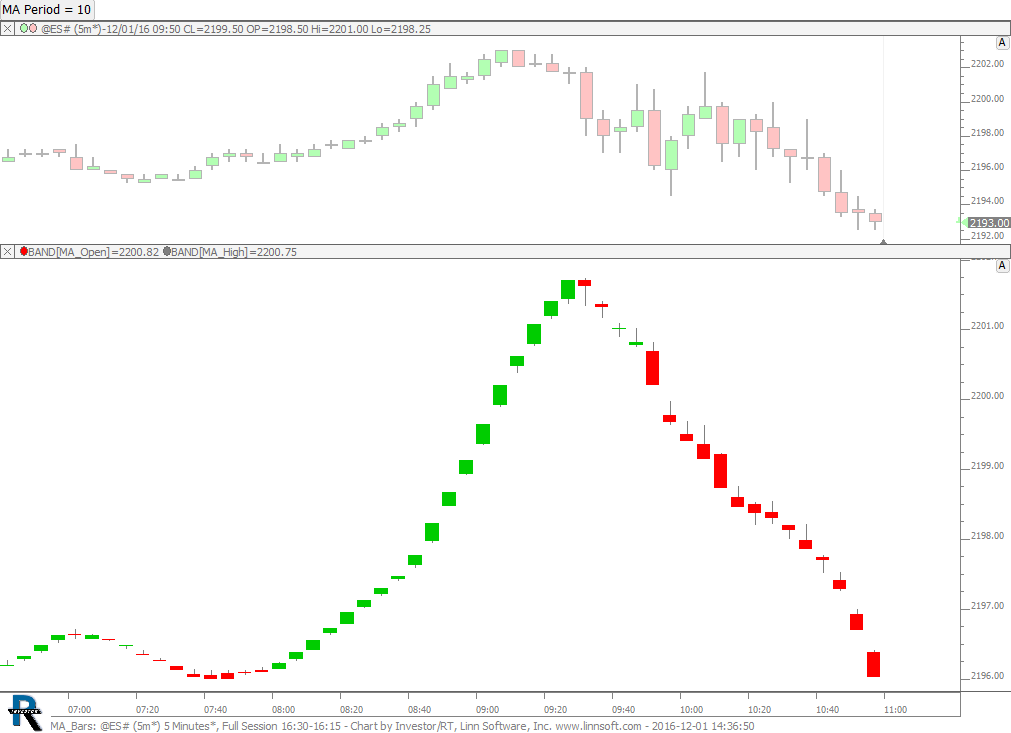 |
MA Bars (@ES#) cpayne [totalcount]
9 years 8 months ago
This chart was uploaded by Investor/RT 12.7.1 showing symbol: @ES#. |
View |
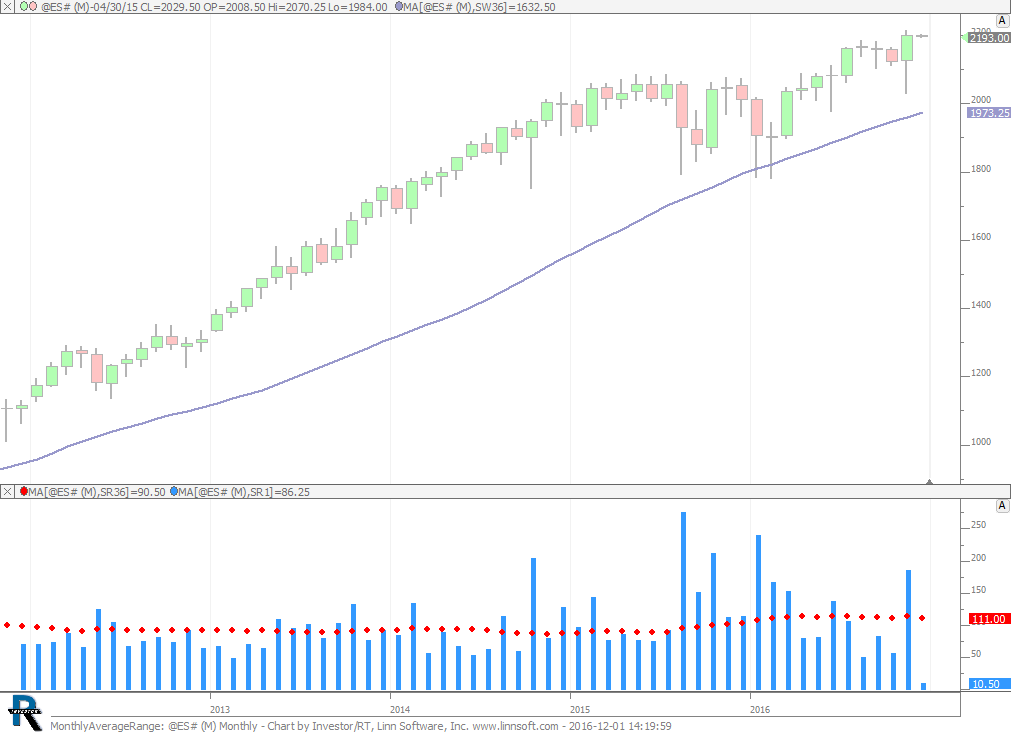 |
MonthlyAverageRange (@ES#) cpayne [totalcount]
9 years 8 months ago
This chart was uploaded by Investor/RT 12.7.1 showing symbol: @ES#. |
View |
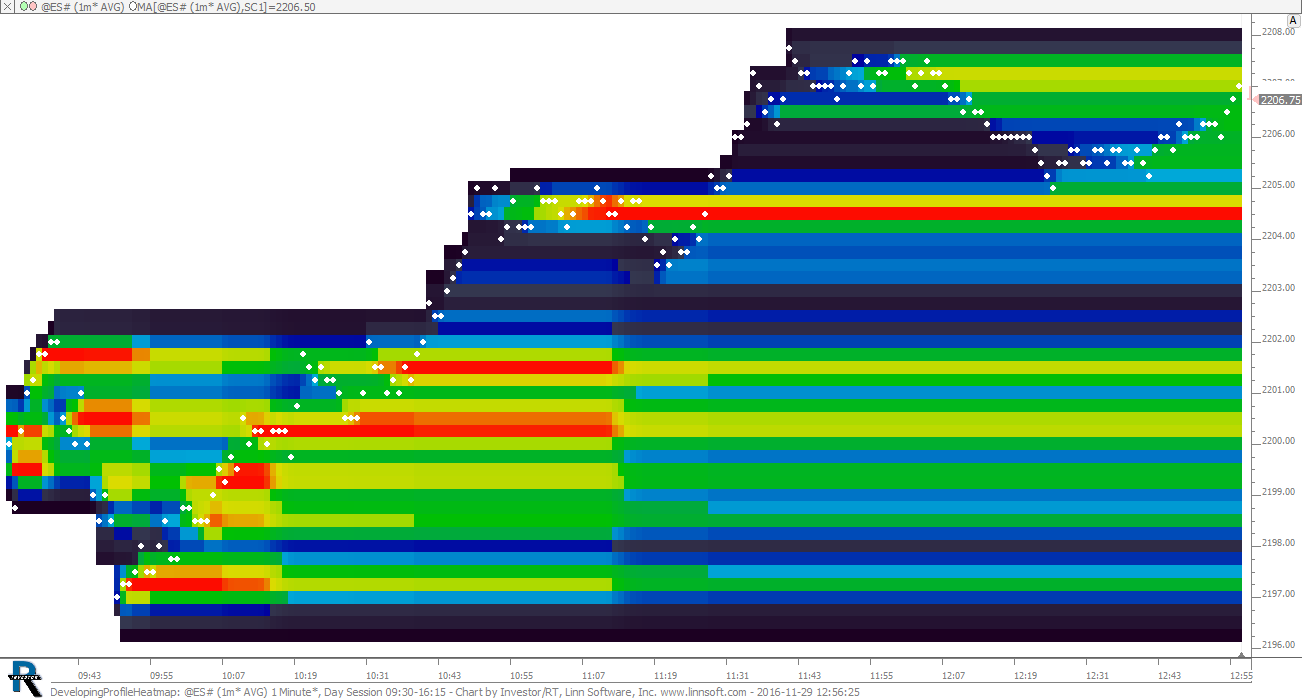 |
DevelopingProfileHeatmap (@ES#) cpayne [totalcount]
9 years 8 months ago
Developing Profile with Heatmap. This chart was uploaded by Investor/RT 12.7.1 showing symbol: @ES#. |
View |
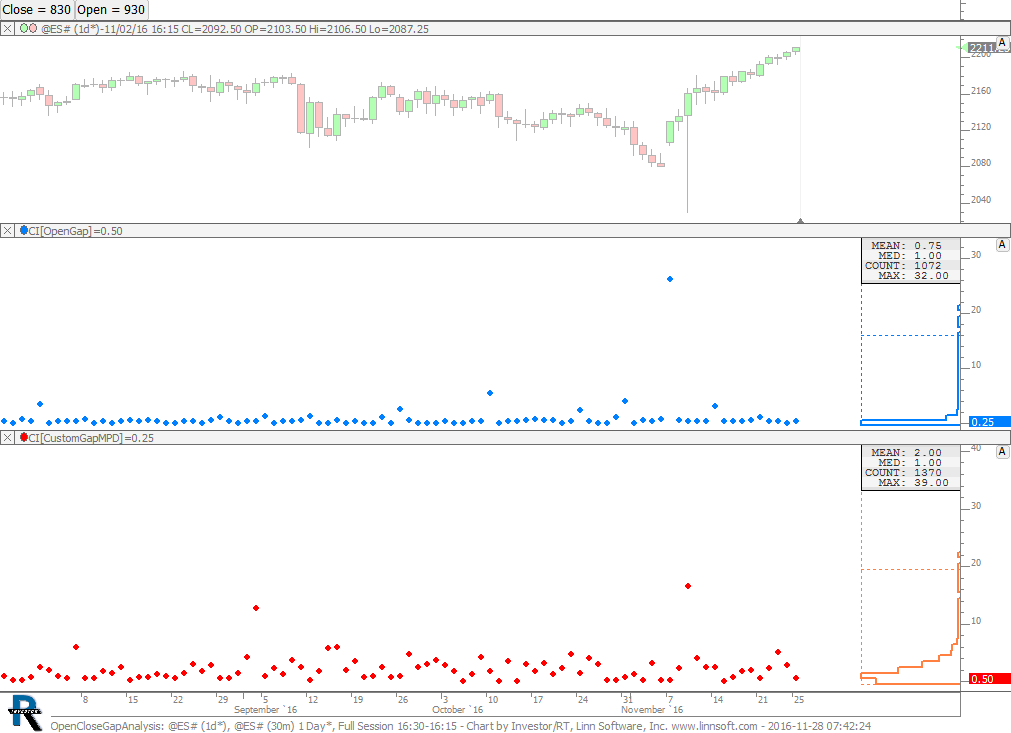 |
OpenCloseGapAnalysis (@ES#) cpayne [totalcount]
9 years 8 months ago
Analysis of gap between day close and open. This chart was uploaded by Investor/RT 12.7.1 showing symbol: @ES#. |
View |
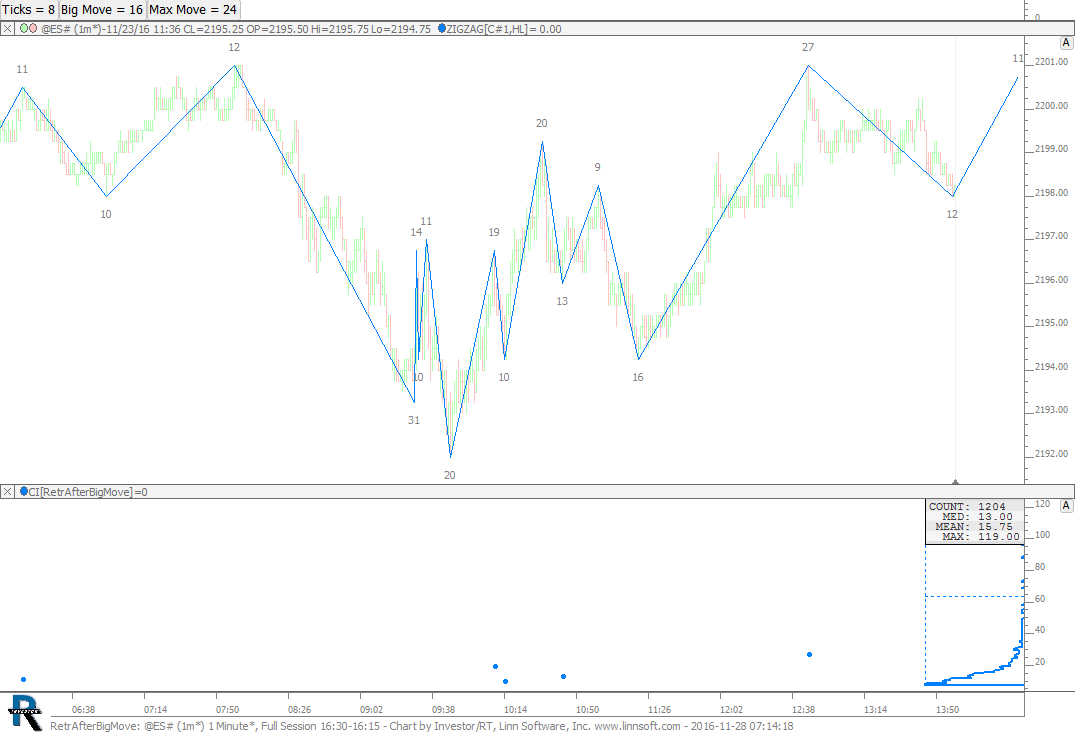 |
RetrAfterBigMove (@ES#) cpayne [totalcount]
9 years 8 months ago
Retracement Average and Median after Big Moves. This chart was uploaded by Investor/RT 12.7.1 showing symbol: @ES#. |
View |
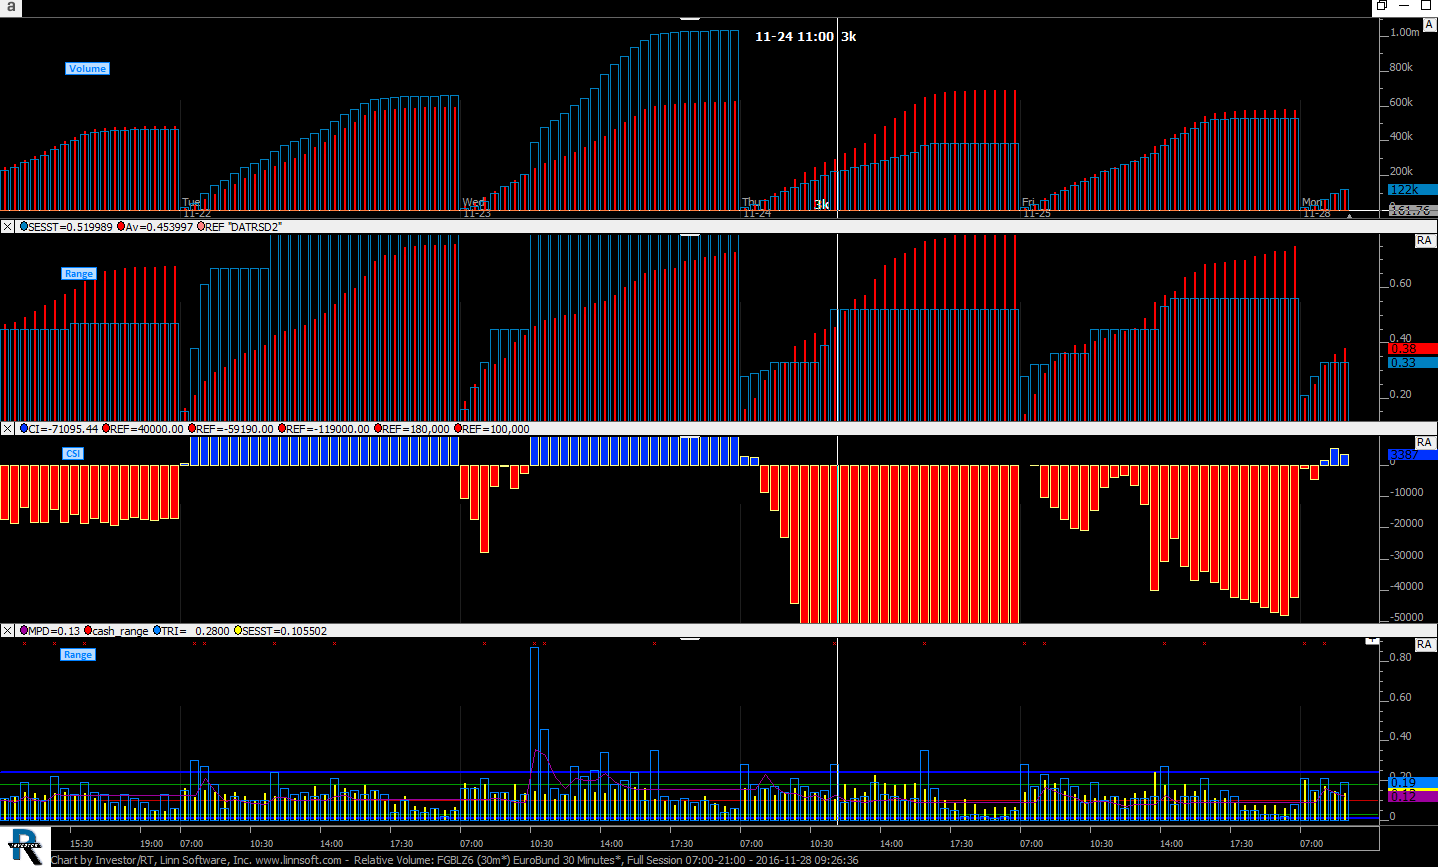 |
Relative Volume (FGBLZ6) adrianfaiers [totalcount]
9 years 8 months ago
adeyf. This chart was uploaded by Investor/RT 12.7.1 showing symbol: FGBLZ6. |
View |
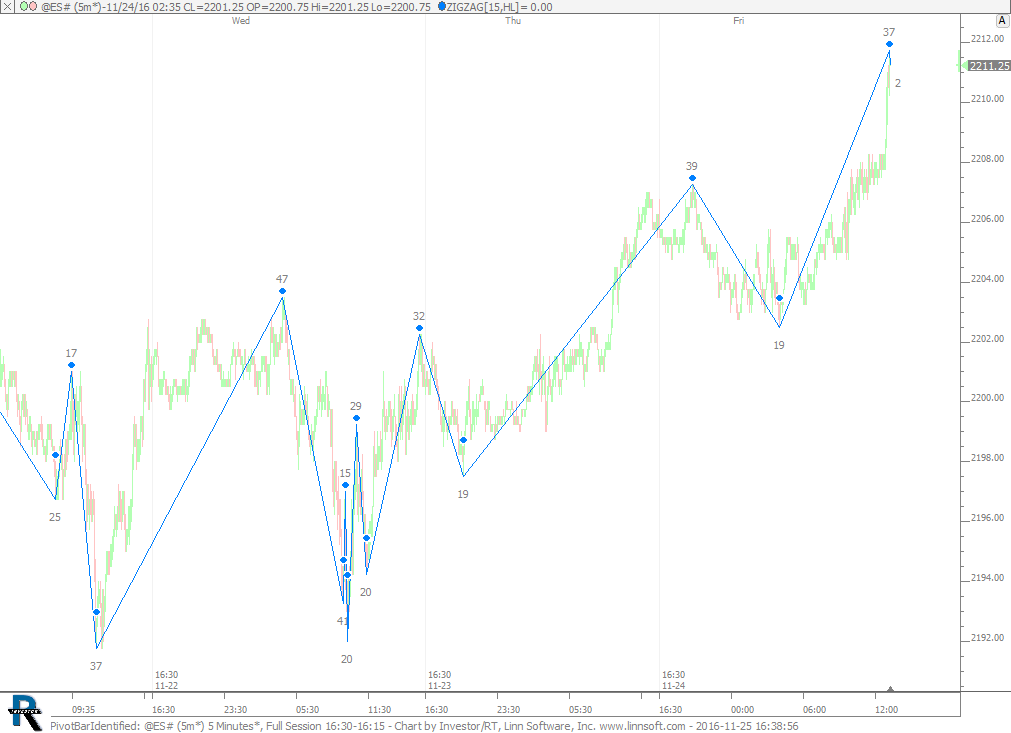 |
PivotBarIdentified (@ES#) cpayne [totalcount]
9 years 8 months ago
Pivot Bar Identified. This chart was uploaded by Investor/RT 12.7.1 showing symbol: @ES#. |
View |
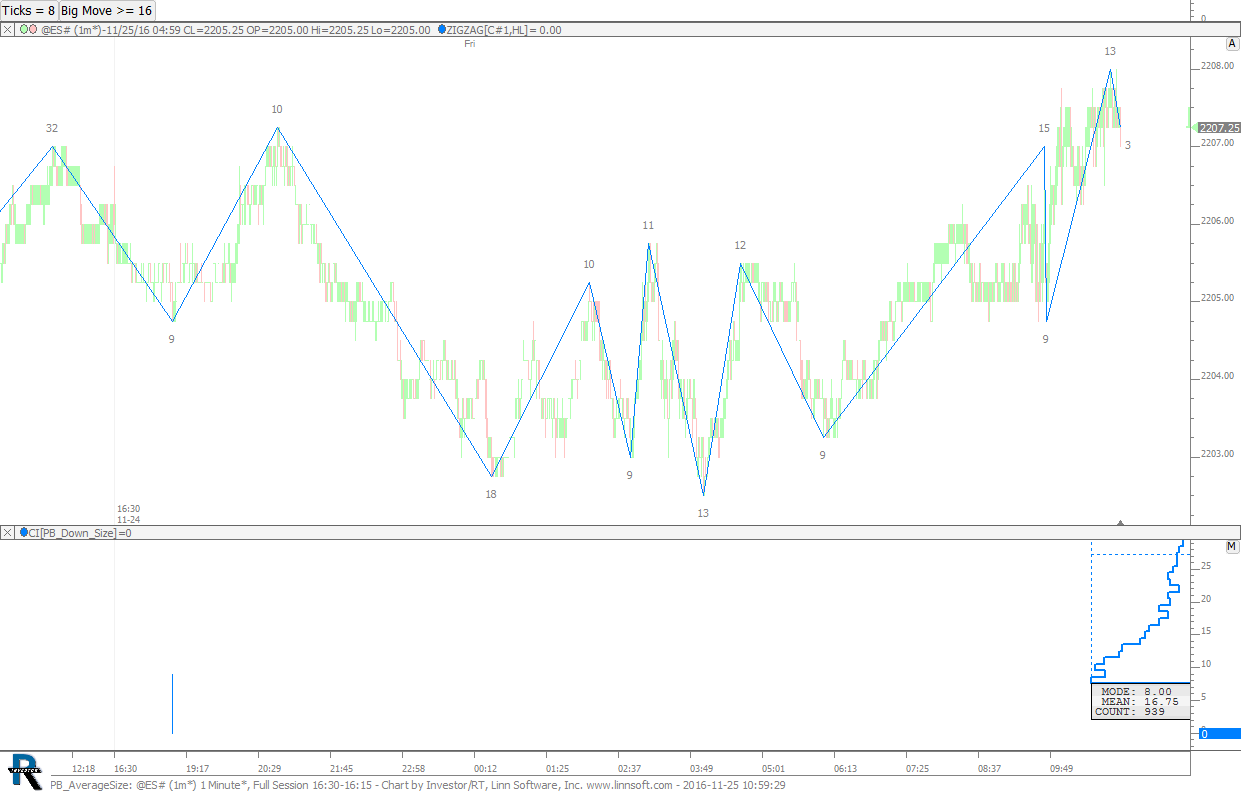 |
PB AverageSize (@ES#) cpayne [totalcount]
9 years 8 months ago
This chart was uploaded by Investor/RT 12.7.1 showing symbol: @ES#. |
View |
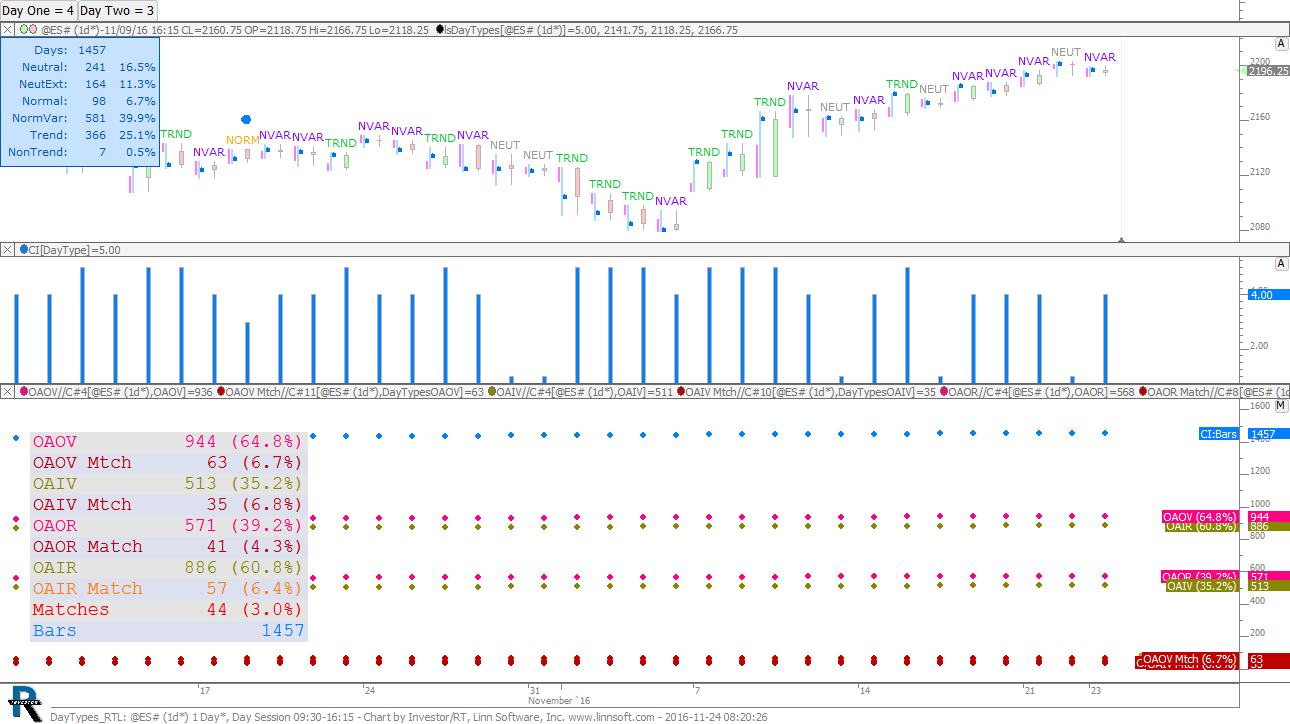 |
DayTypes RTL (@ES#) cpayne [totalcount]
9 years 8 months ago
Day Types RTL. This chart was uploaded by Investor/RT 12.7.1 showing symbol: @ES#. |
View |
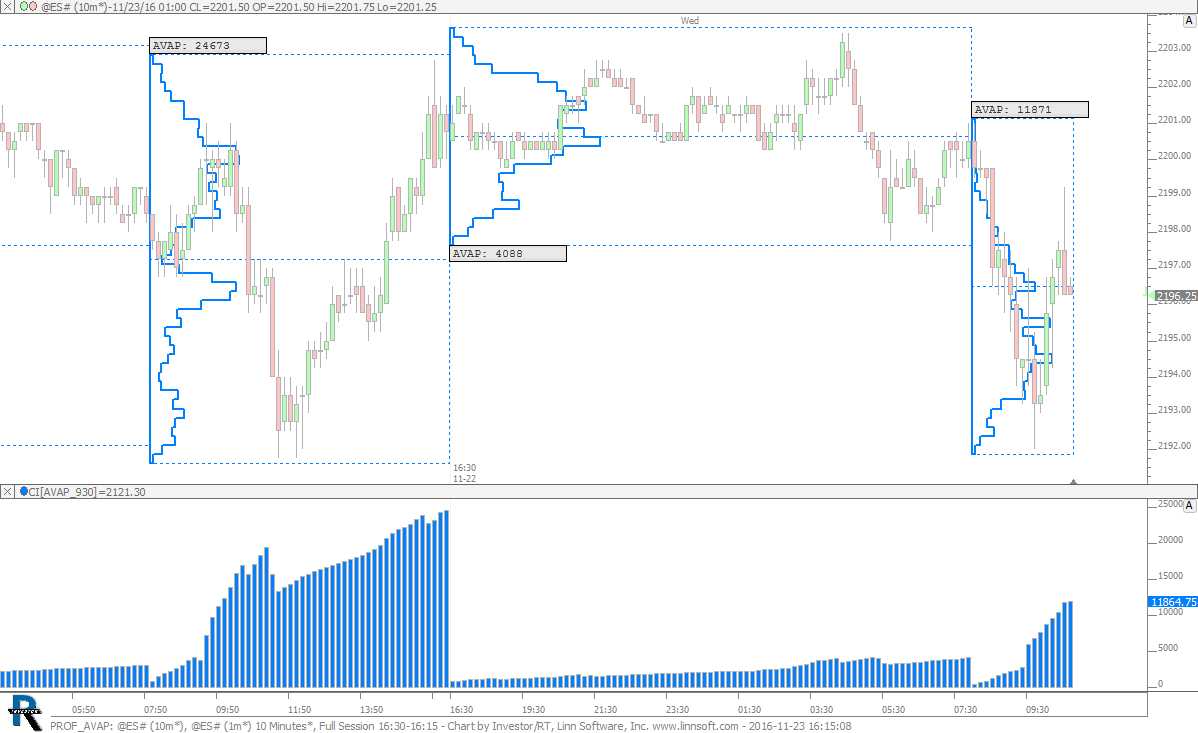 |
PROF AVAP (@ES#) cpayne [totalcount]
9 years 8 months ago
Profile Average Volume at Price. This chart was uploaded by Investor/RT 12.7.1 showing symbol: @ES#. |
View |
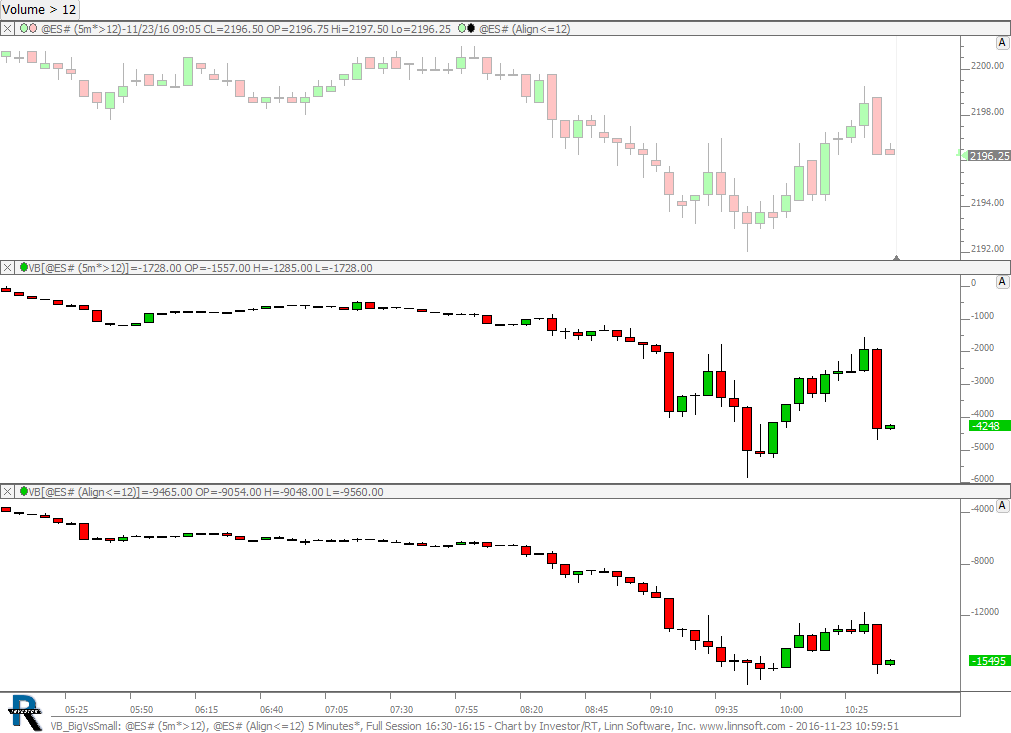 |
VB BigVsSmall (@ES#) cpayne [totalcount]
9 years 8 months ago
VB on Big vs Small. This chart was uploaded by Investor/RT 12.7.1 showing symbol: @ES#. |
View |
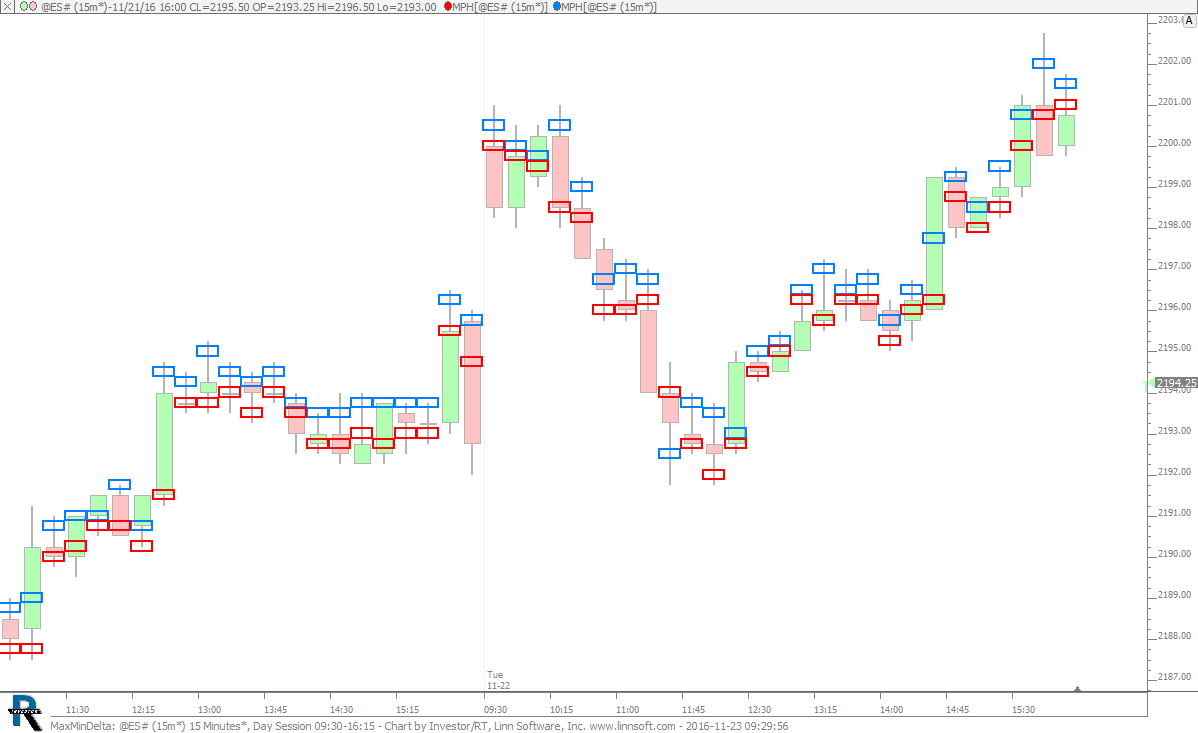 |
MaxMinDelta (@ES#) cpayne [totalcount]
9 years 8 months ago
Max And Min Delta Within Bar. This chart was uploaded by Investor/RT 12.7.1 showing symbol: @ES#. |
View |
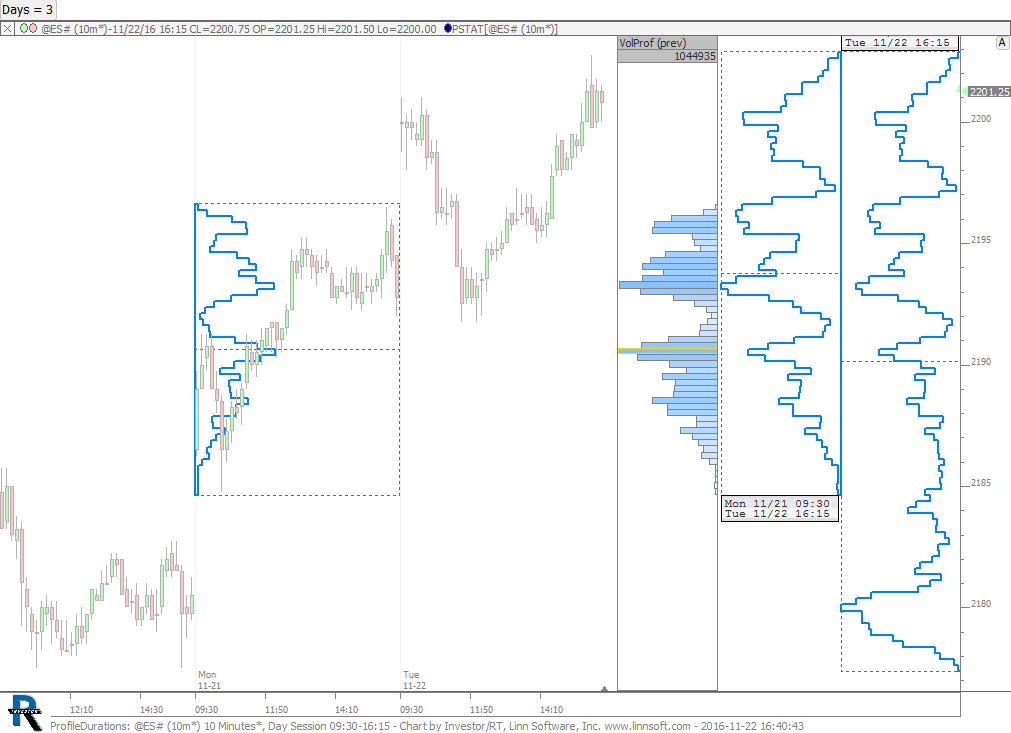 |
ProfileDurations (@ES#) cpayne [totalcount]
9 years 8 months ago
Profiles of Varying Durations. This chart was uploaded by Investor/RT 12.7.1 showing symbol: @ES#. |
View |
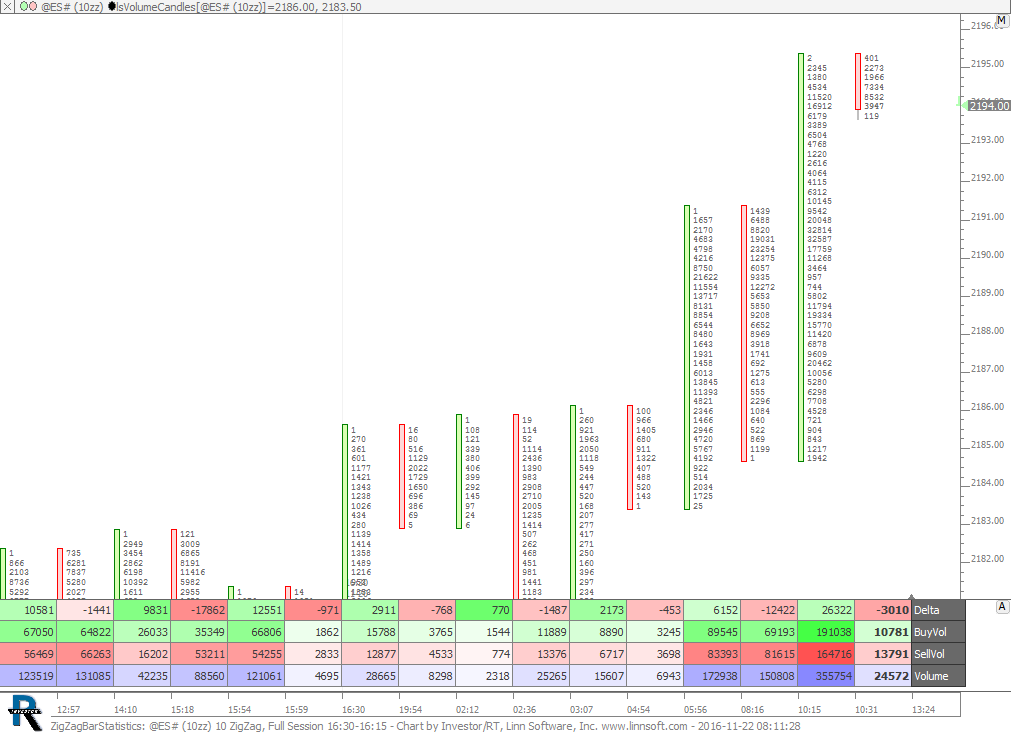 |
ZigZagBarStatistics (@ES#) cpayne [totalcount]
9 years 8 months ago
Zig Zag Periodicity with Bar Statistics. This chart was uploaded by Investor/RT 12.7.1 showing symbol: @ES#. |
View |
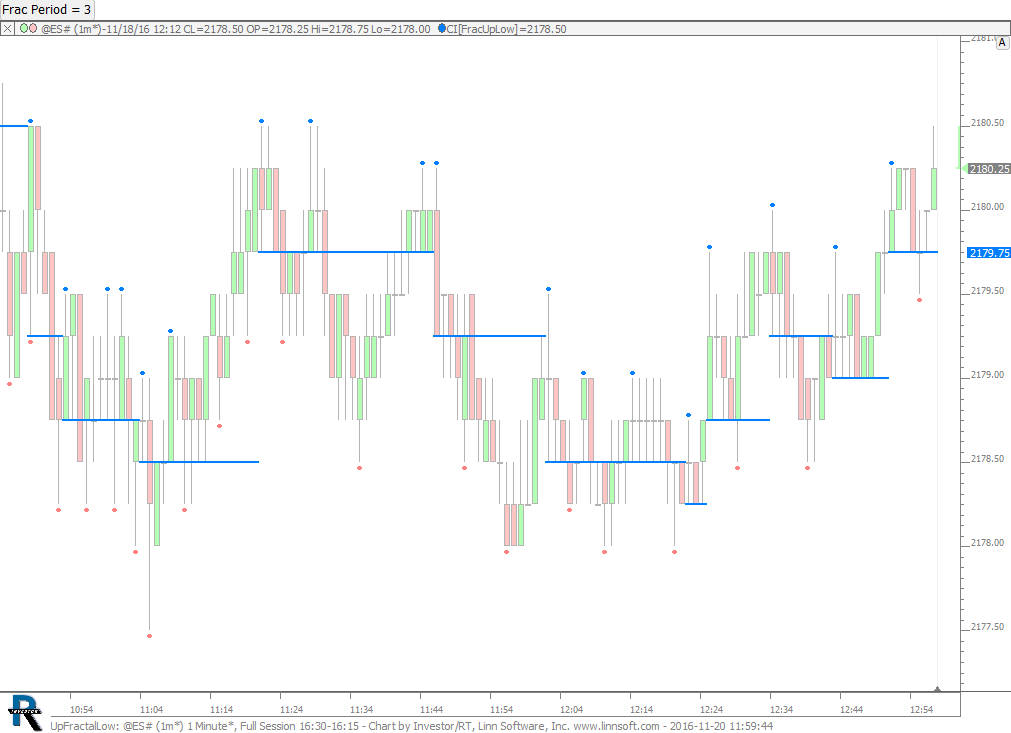 |
UpFractalLow (@ES#) cpayne [totalcount]
9 years 8 months ago
Line presents the low of the bar that created the last up fractal. This chart was uploaded by Investor/RT 12.7.1 showing symbol: @ES#. |
View |
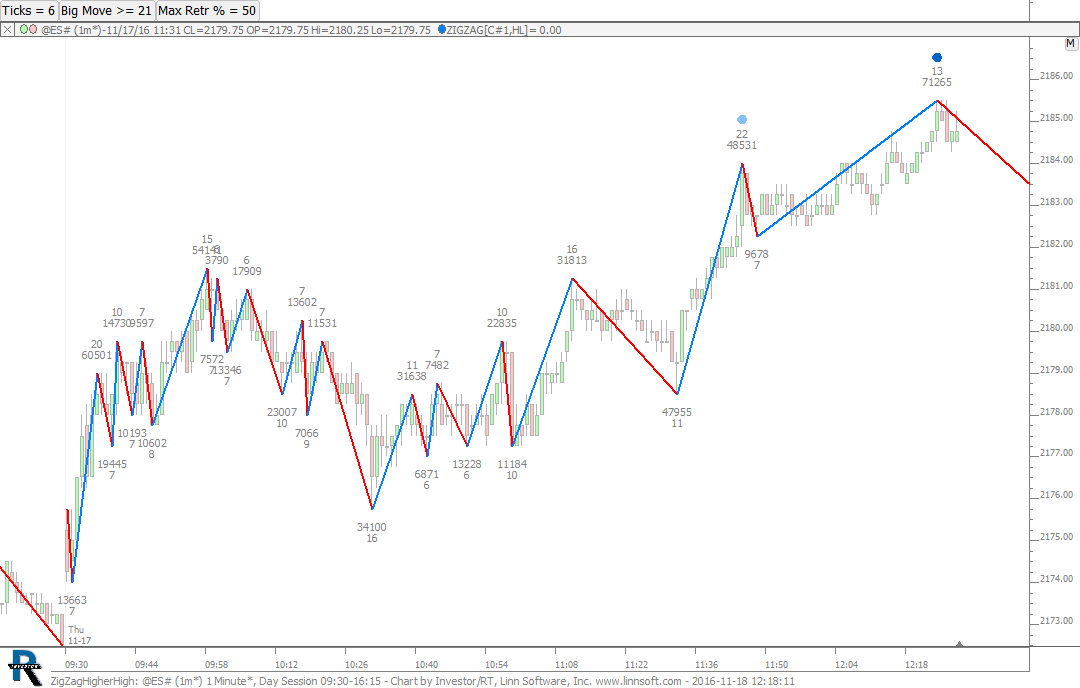 |
ZigZagHigherHigh (@ES#) cpayne [totalcount]
9 years 8 months ago
Zig Zag Higher High after Minimum Retracement. This chart was uploaded by Investor/RT 12.7.1 showing symbol: @ES#. |
View |
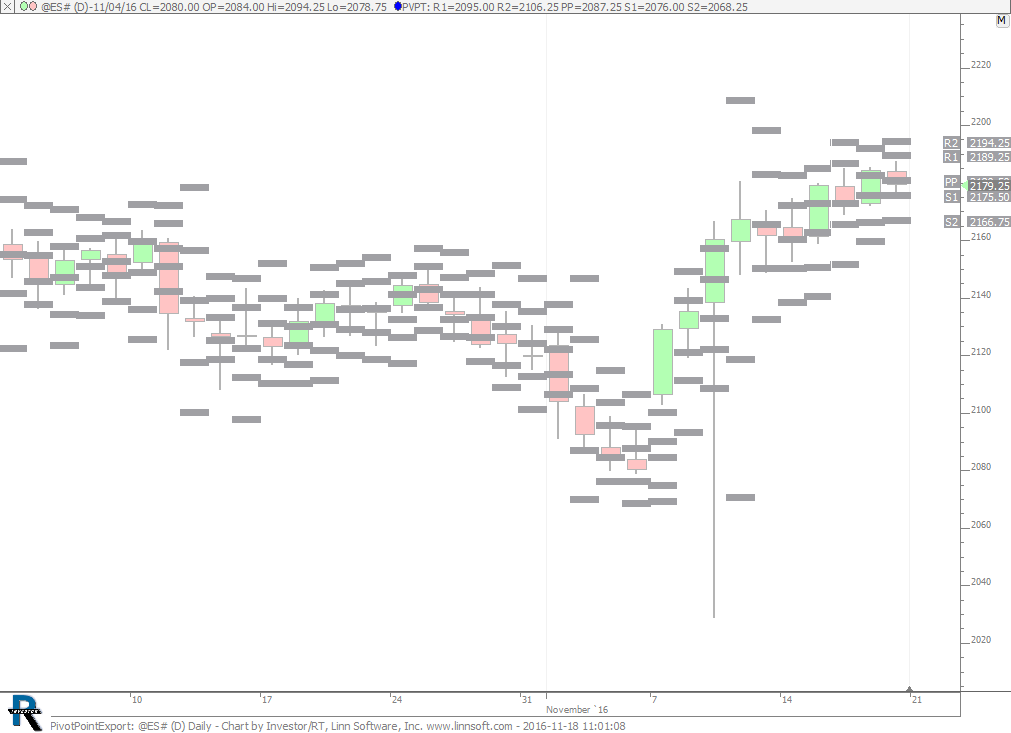 |
PivotPointExport (@ES#) cpayne [totalcount]
9 years 8 months ago
Pivot Point Export. This chart was uploaded by Investor/RT 12.7.1 showing symbol: @ES#. |
View |
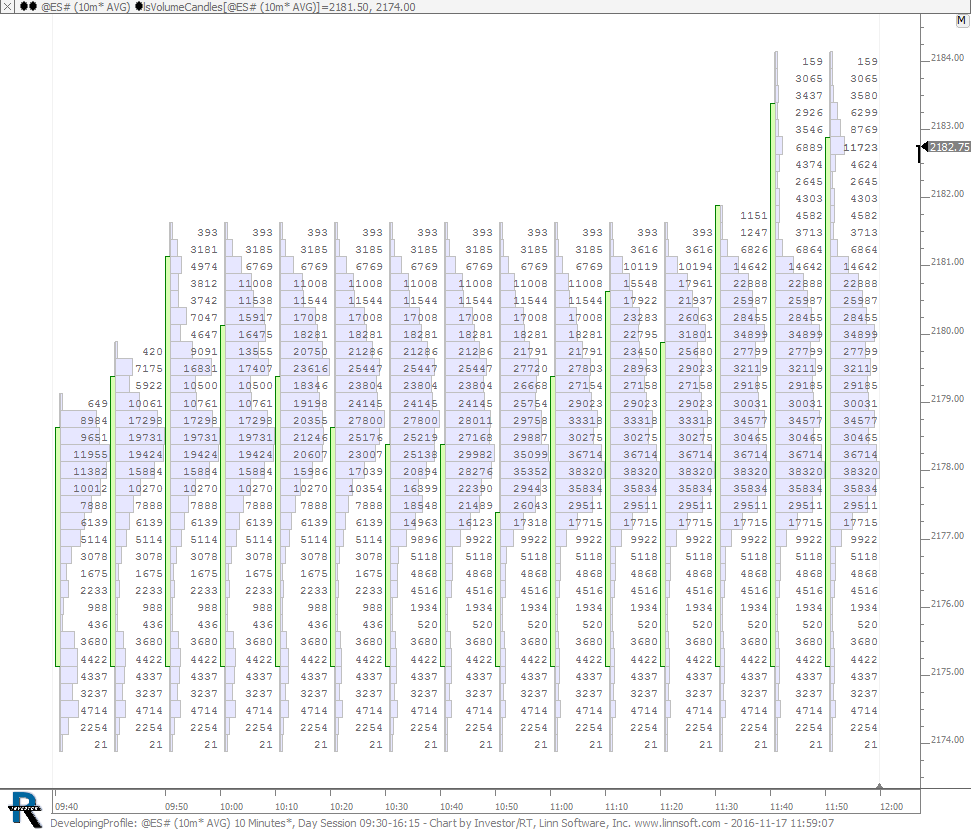 |
DevelopingProfile (@ES#) cpayne [totalcount]
9 years 8 months ago
Developing Profile using Volume Candles and Average Bars. This chart was uploaded by Investor/RT 12.7.1 showing symbol: @ES#. |
View |
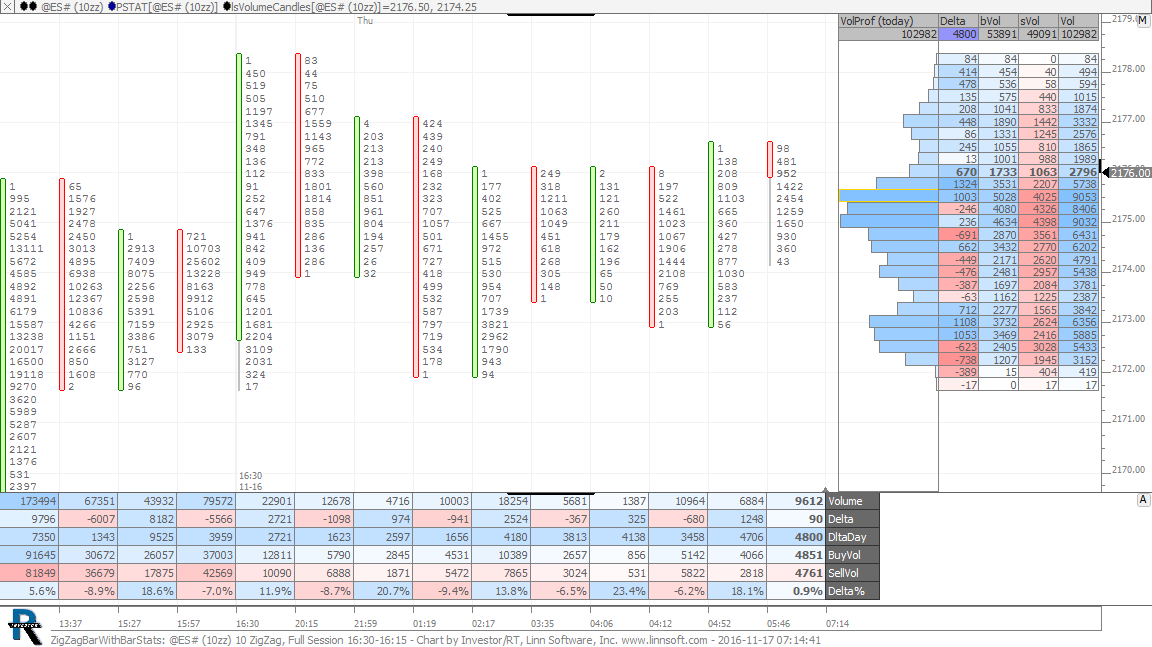 |
ZigZagBarWithBarStats (@ES#) cpayne [totalcount]
9 years 8 months ago
Zig Zag Periodicity with Bar Stats and Price Stats. This chart was uploaded by Investor/RT 12.7.1 showing symbol: @ES#. |
View |