 |
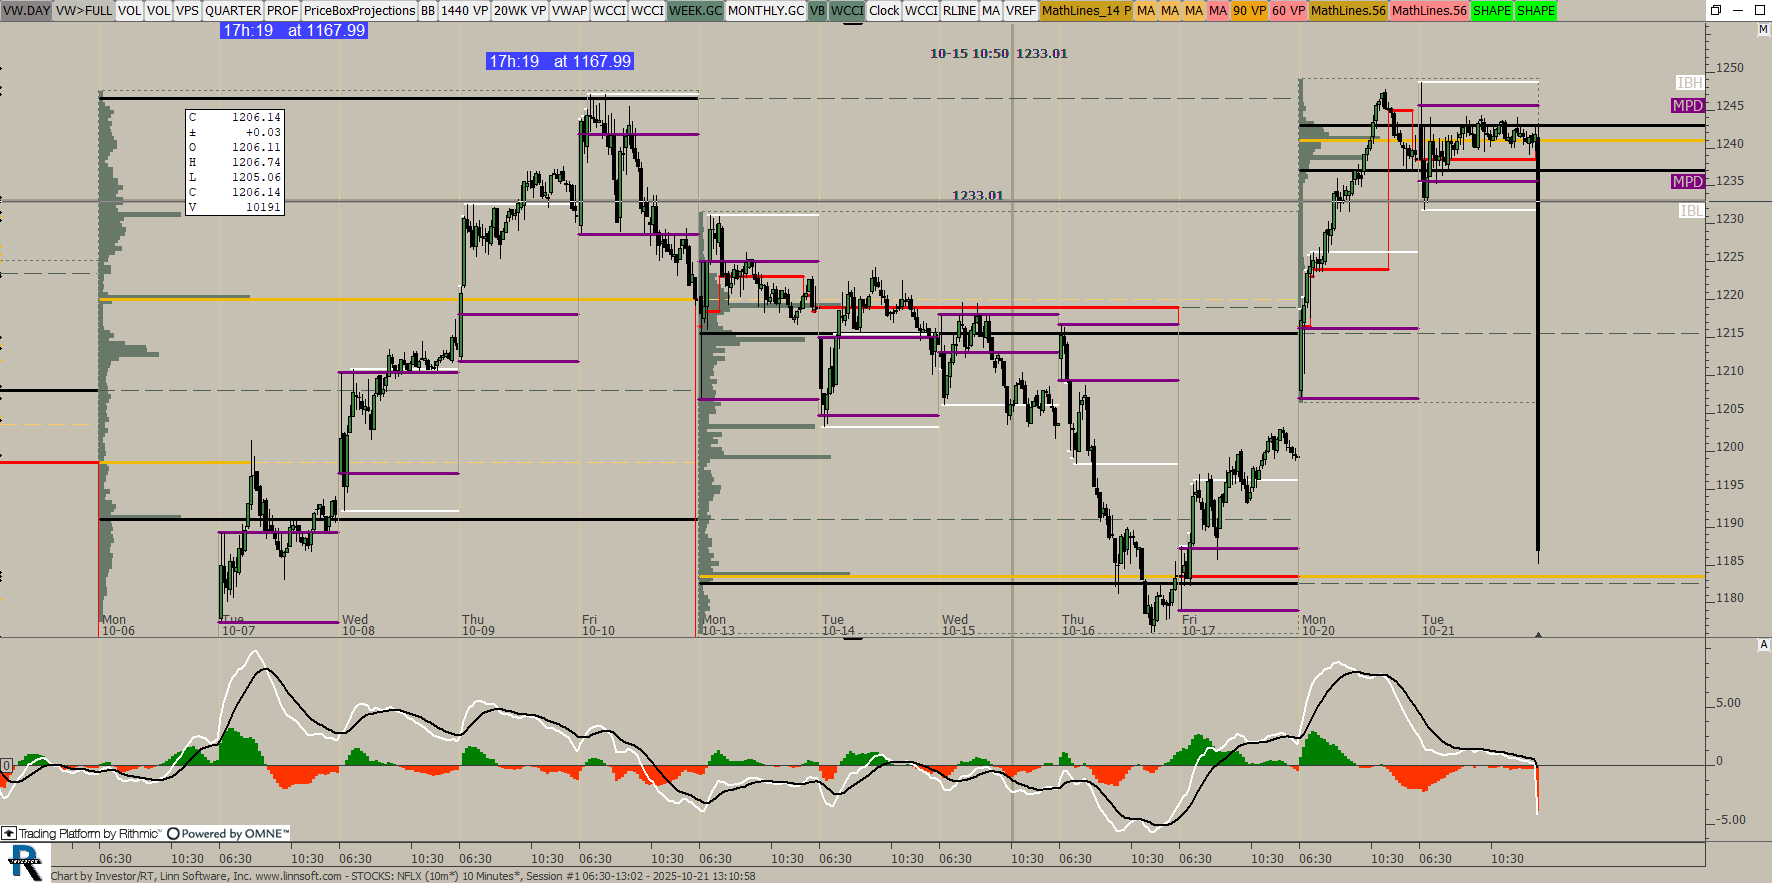
sTOCKS (NFLX) ES42 [totalcount]
1 month 4 weeks ago
This chart was uploaded by Investor/RT 15.1.16 showing symbol: NFLX. |
View |
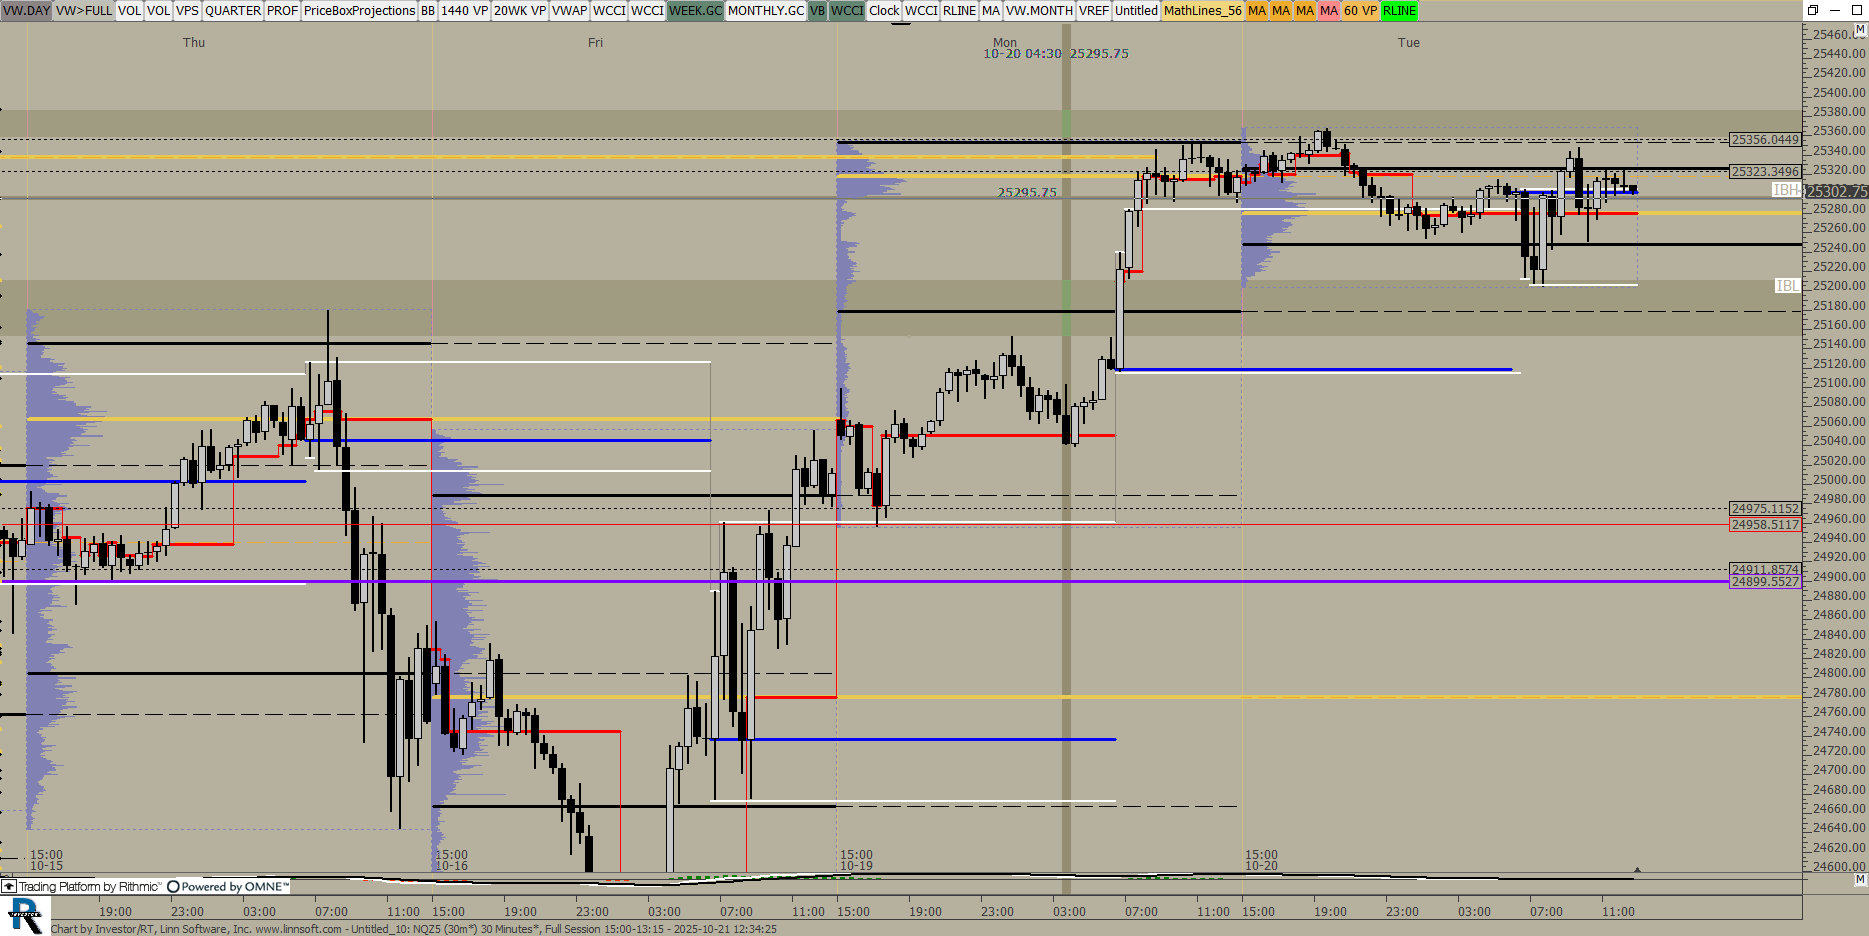 |
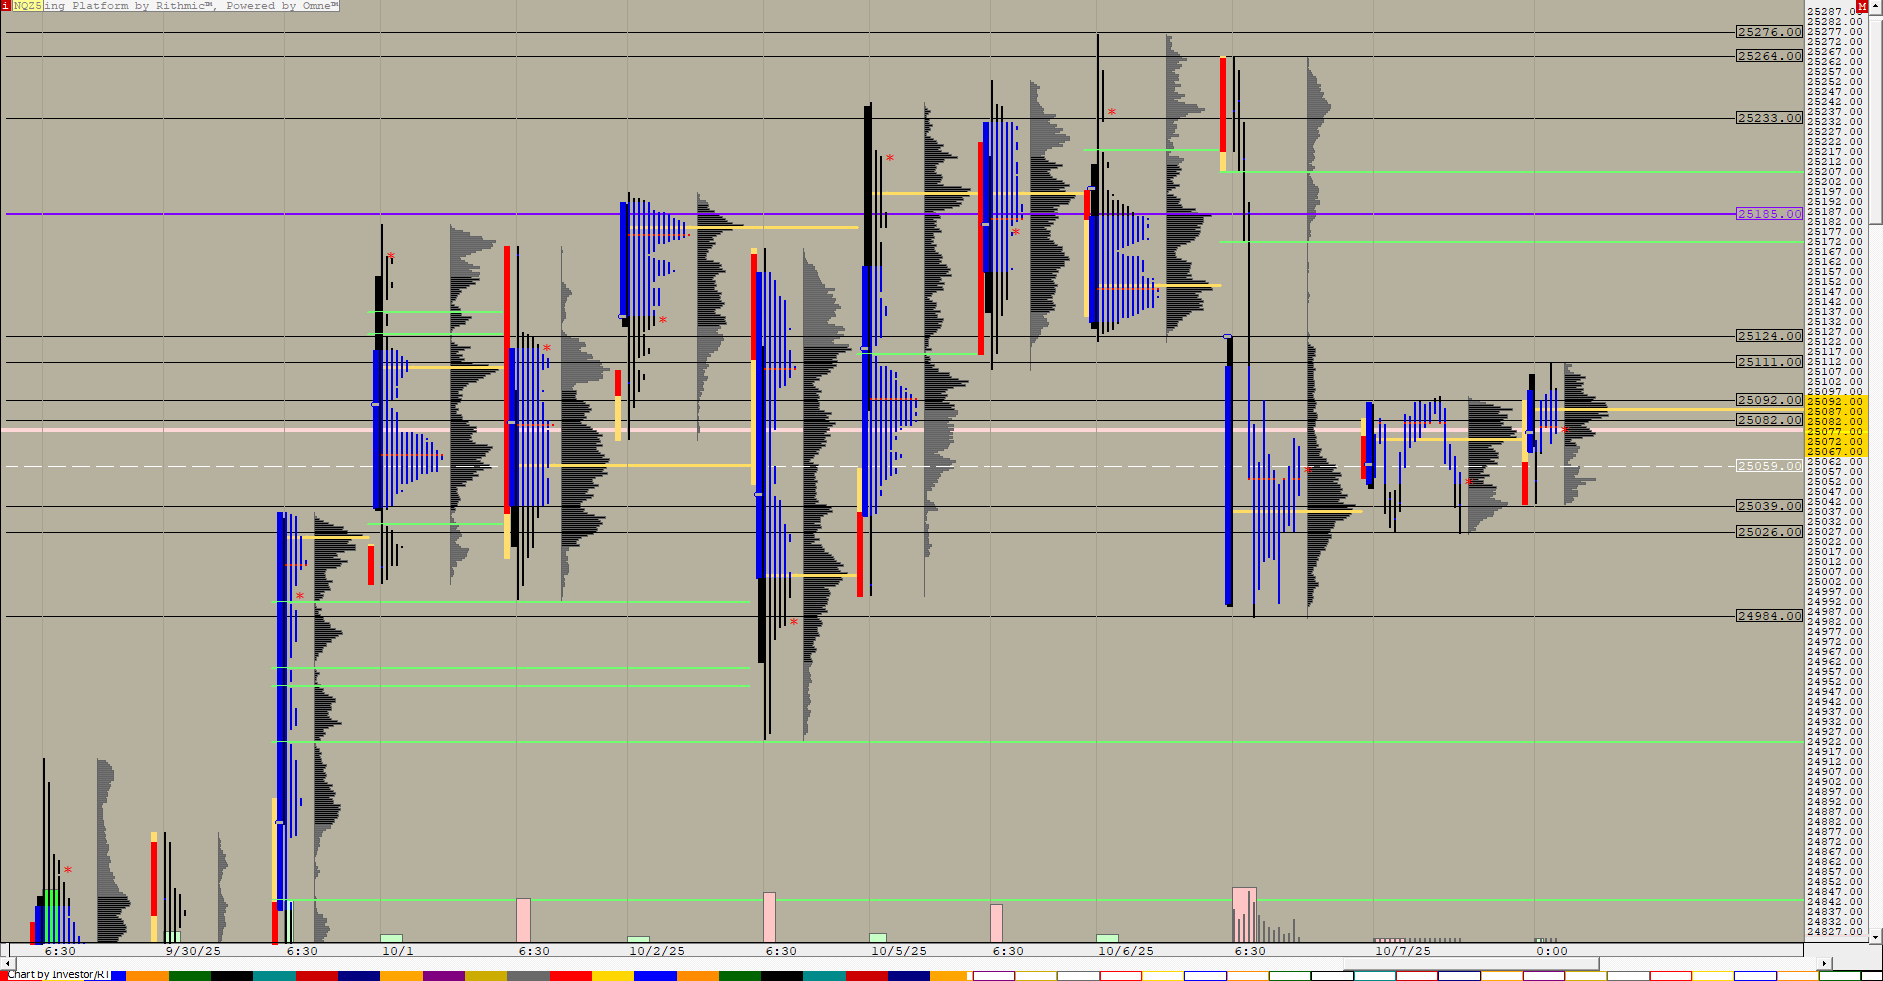
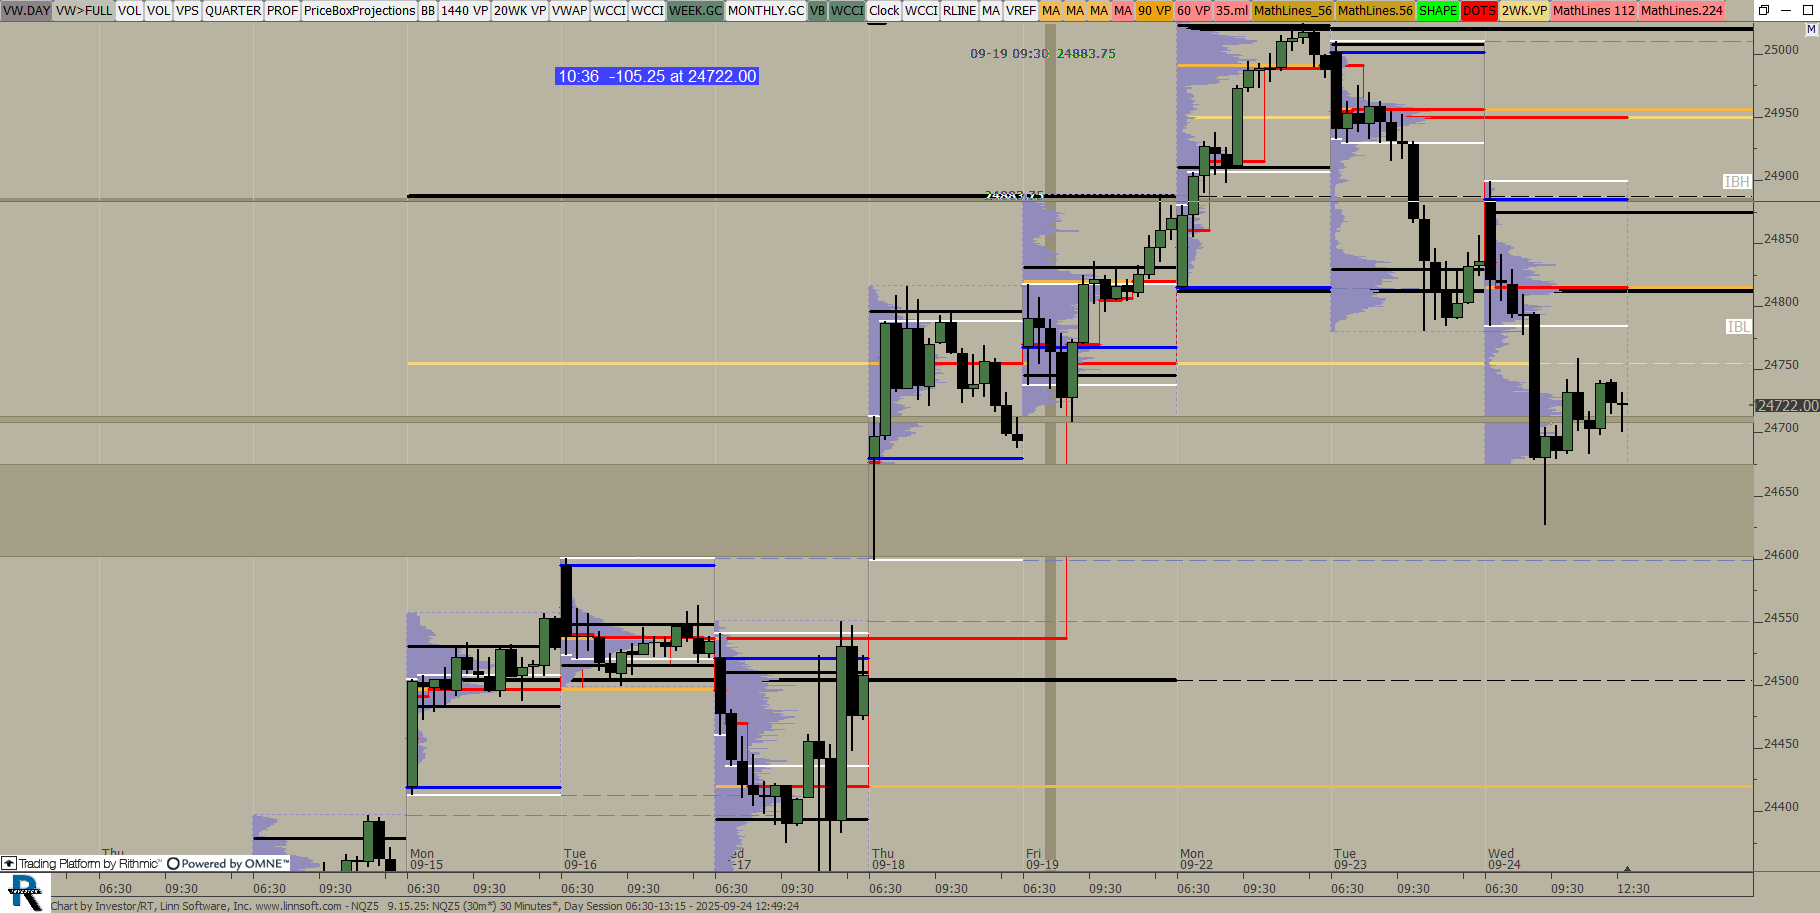
Untitled 10 (NQZ5) ES42 [totalcount]
1 month 4 weeks ago
This chart was uploaded by Investor/RT 15.1.25 showing symbol: NQZ5. |
View |
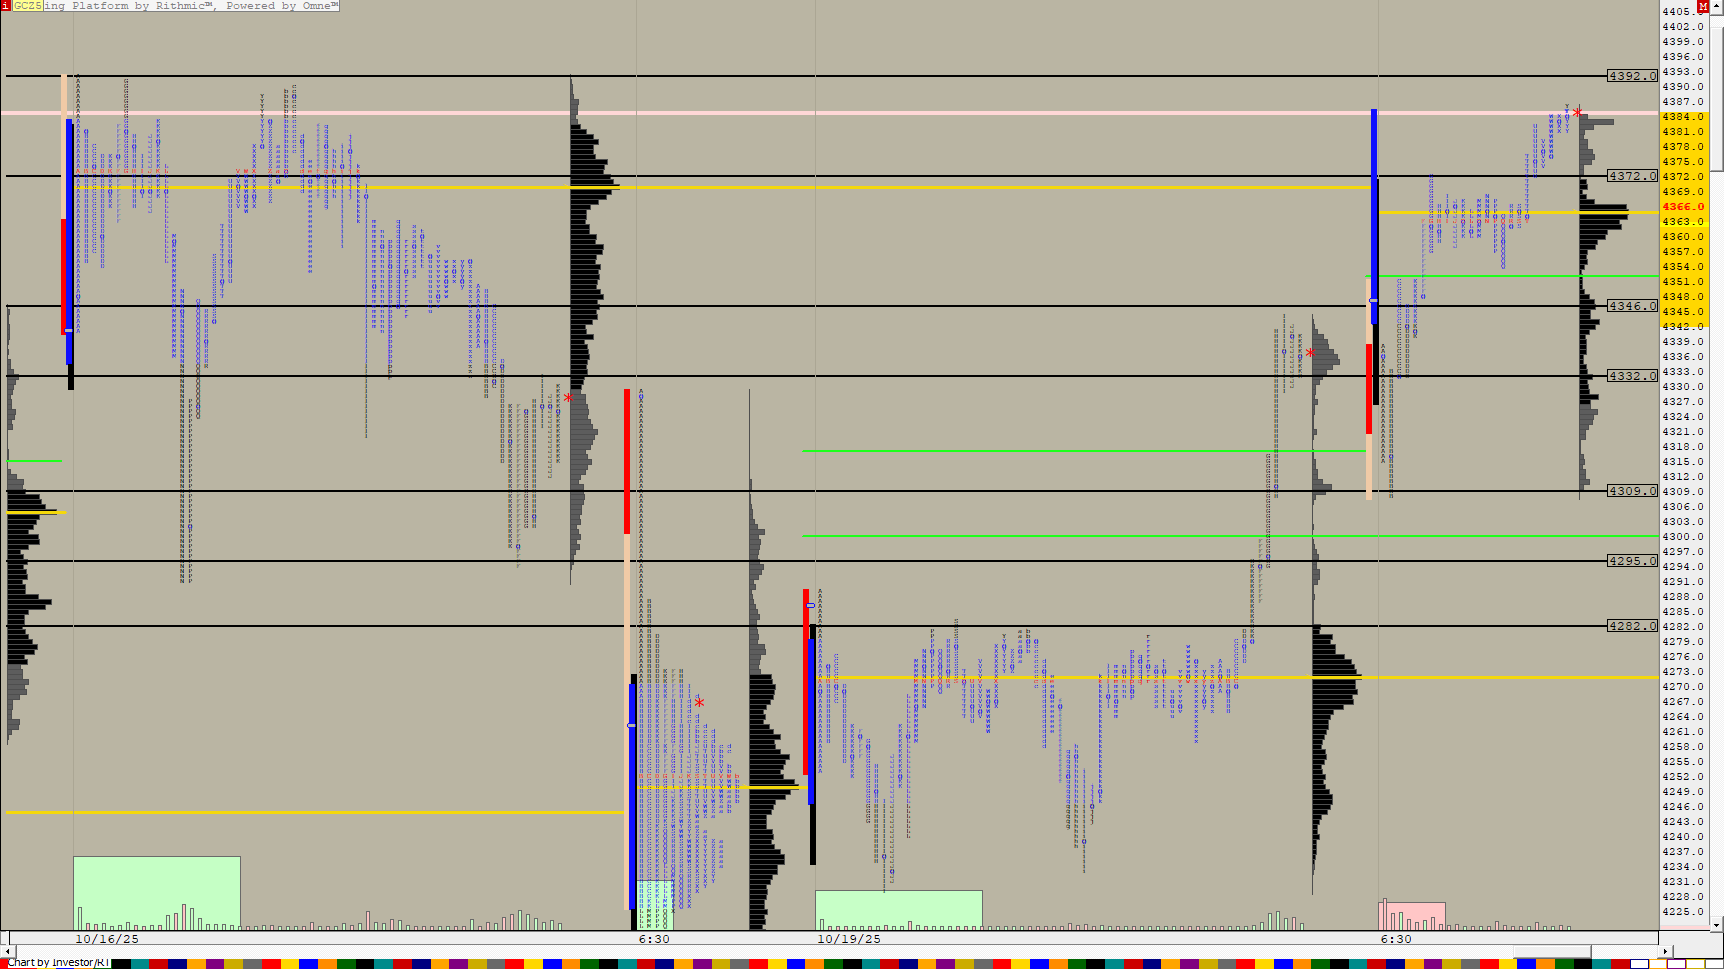 |
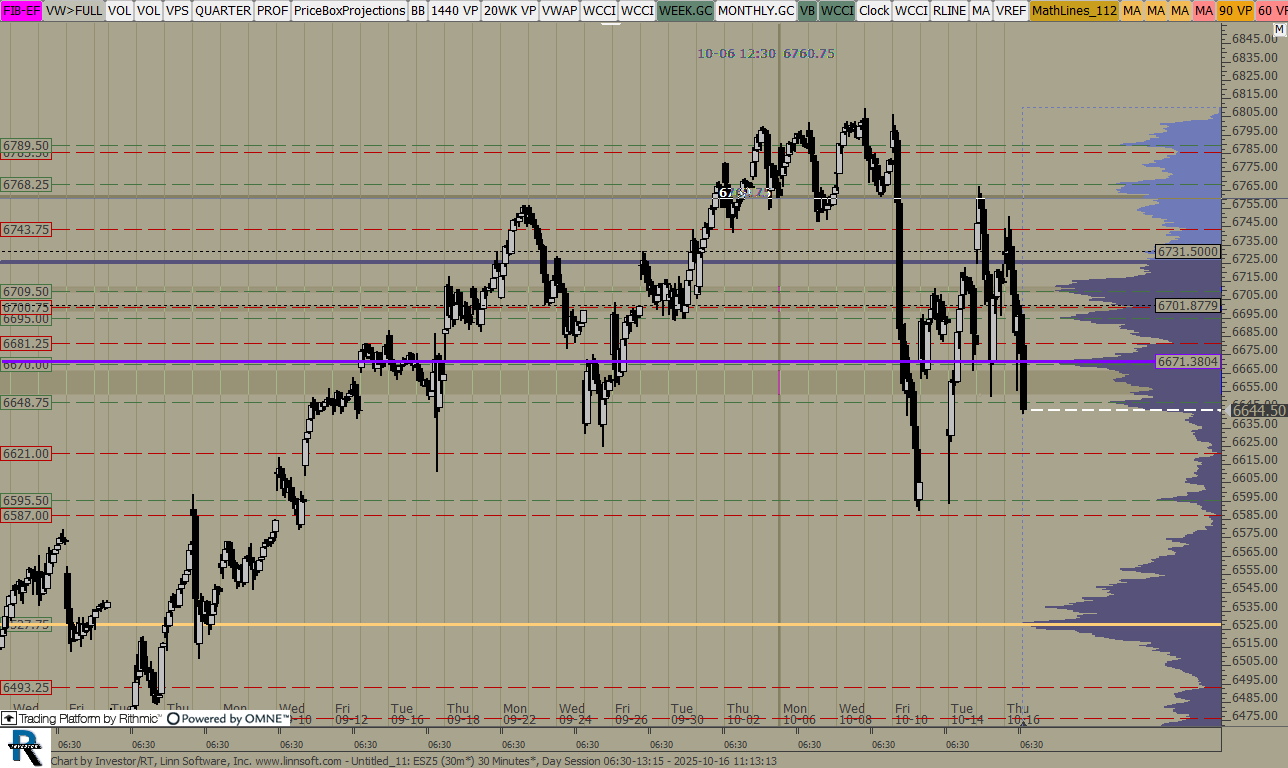
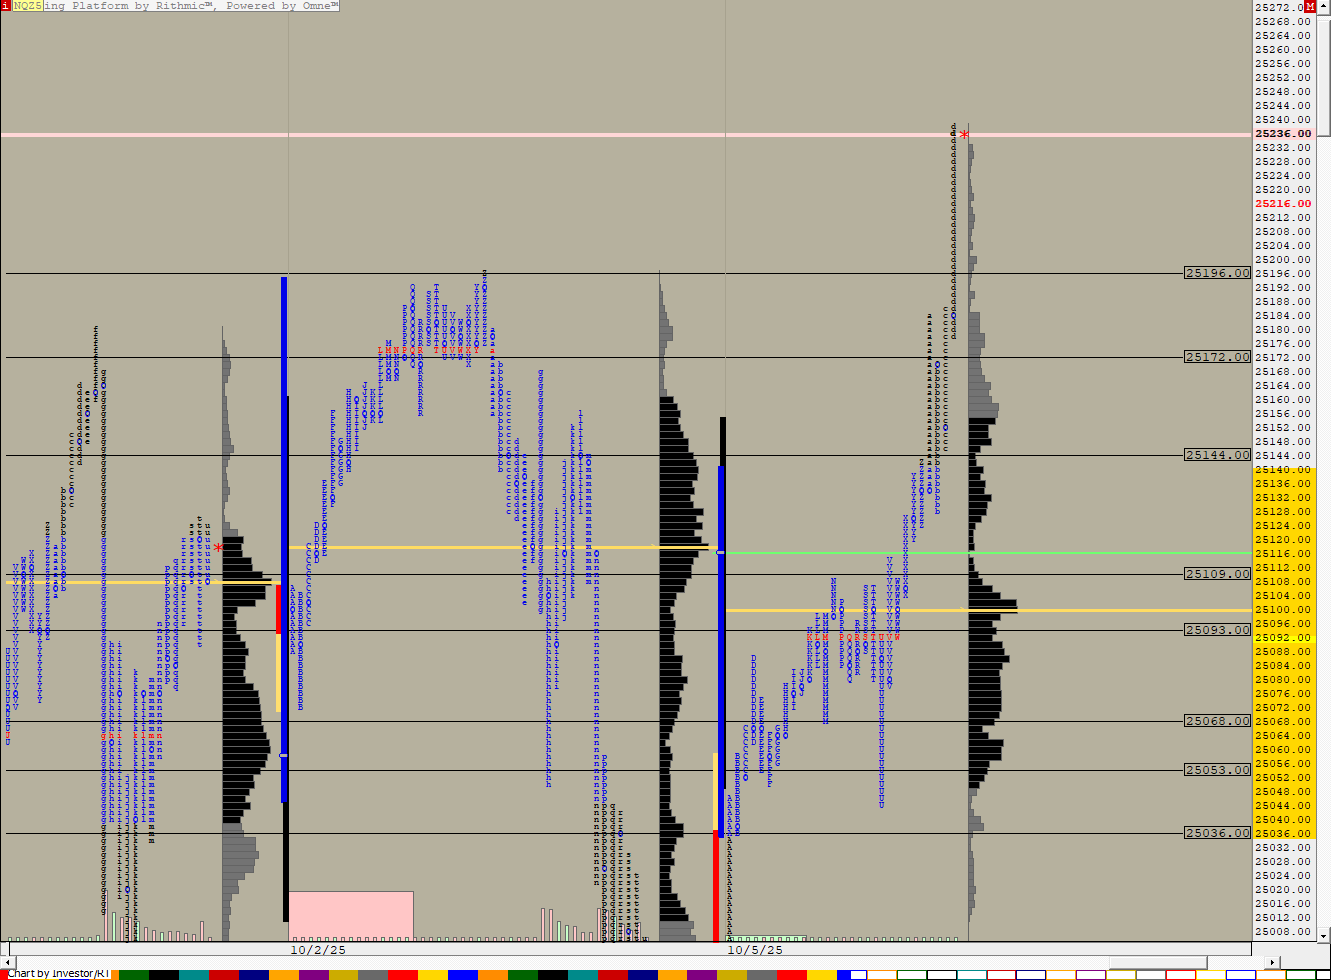
NQ15 TPO101825 (GCZ5) ES42 [totalcount]
1 month 4 weeks ago
This chart was uploaded by Investor/RT 15.1.25 showing symbol: GCZ5. |
View |
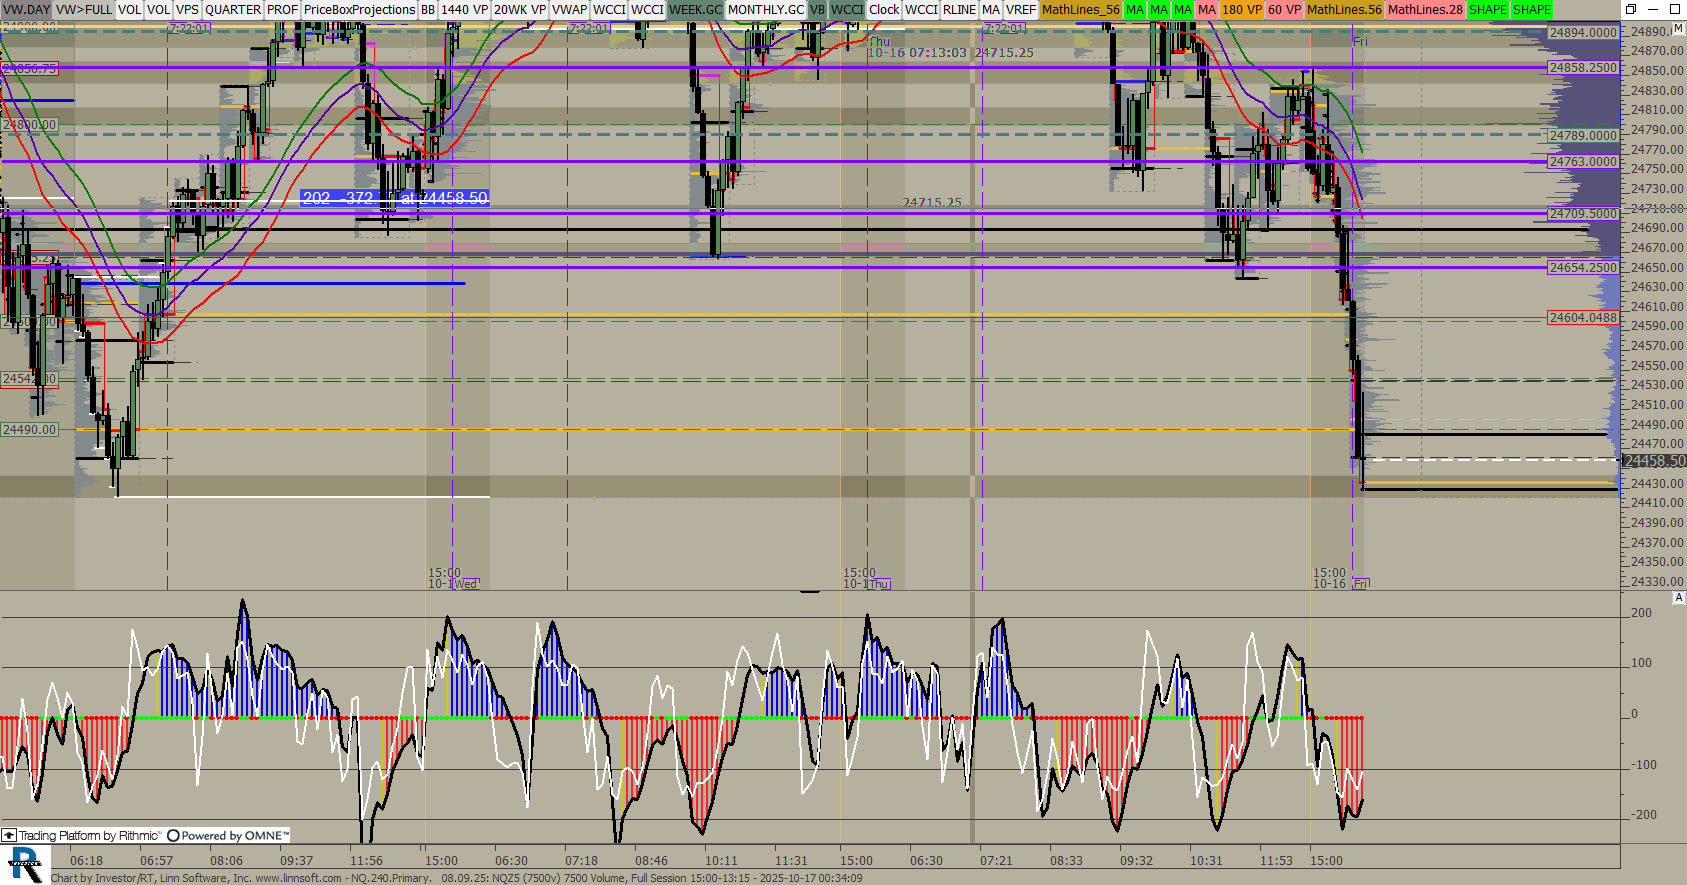 |
NQ240Primary 080925 (NQZ5) ES42 [totalcount]
2 months 2 days ago
This chart was uploaded by Investor/RT 15.1.25 showing symbol: NQZ5. |
View |
 |
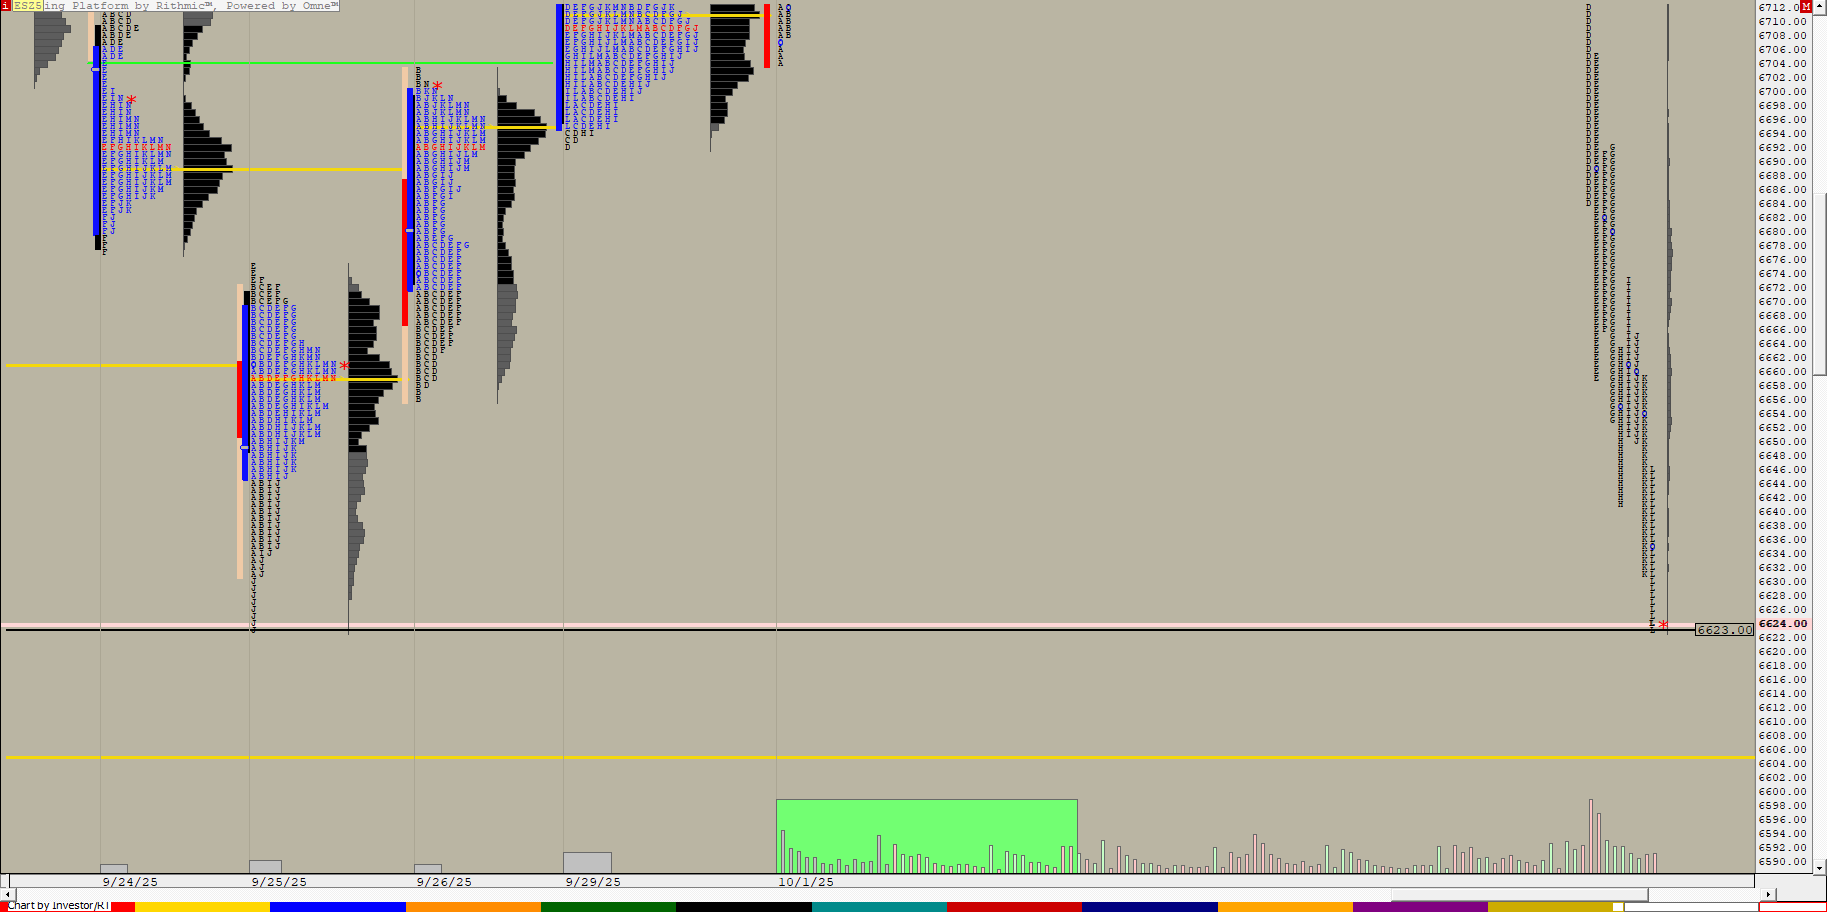
ESDaily TPO 101125 (ESZ5) ES42 [totalcount]
2 months 2 days ago
This chart was uploaded by Investor/RT 15.1.25 showing symbol: ESZ5. |
View |
 |
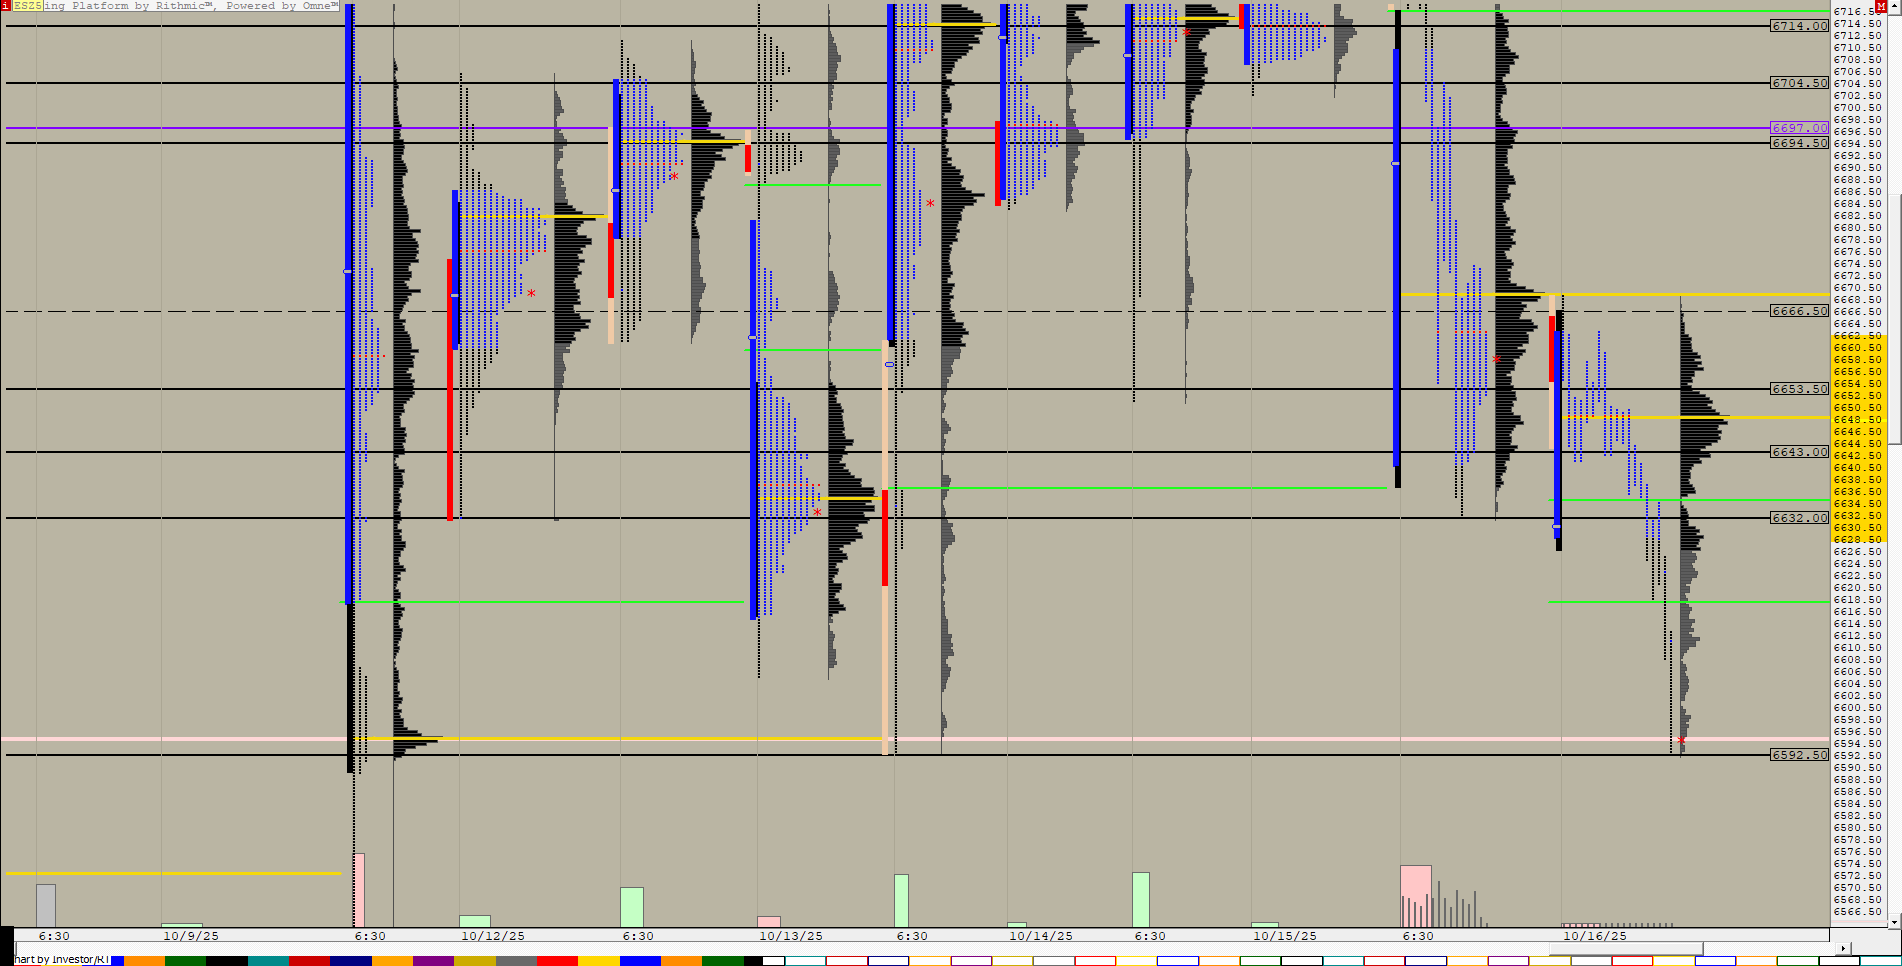
Untitled 11 (ESZ5) ES42 [totalcount]
2 months 3 days ago
This chart was uploaded by Investor/RT 15.1.25 showing symbol: ESZ5. |
View |
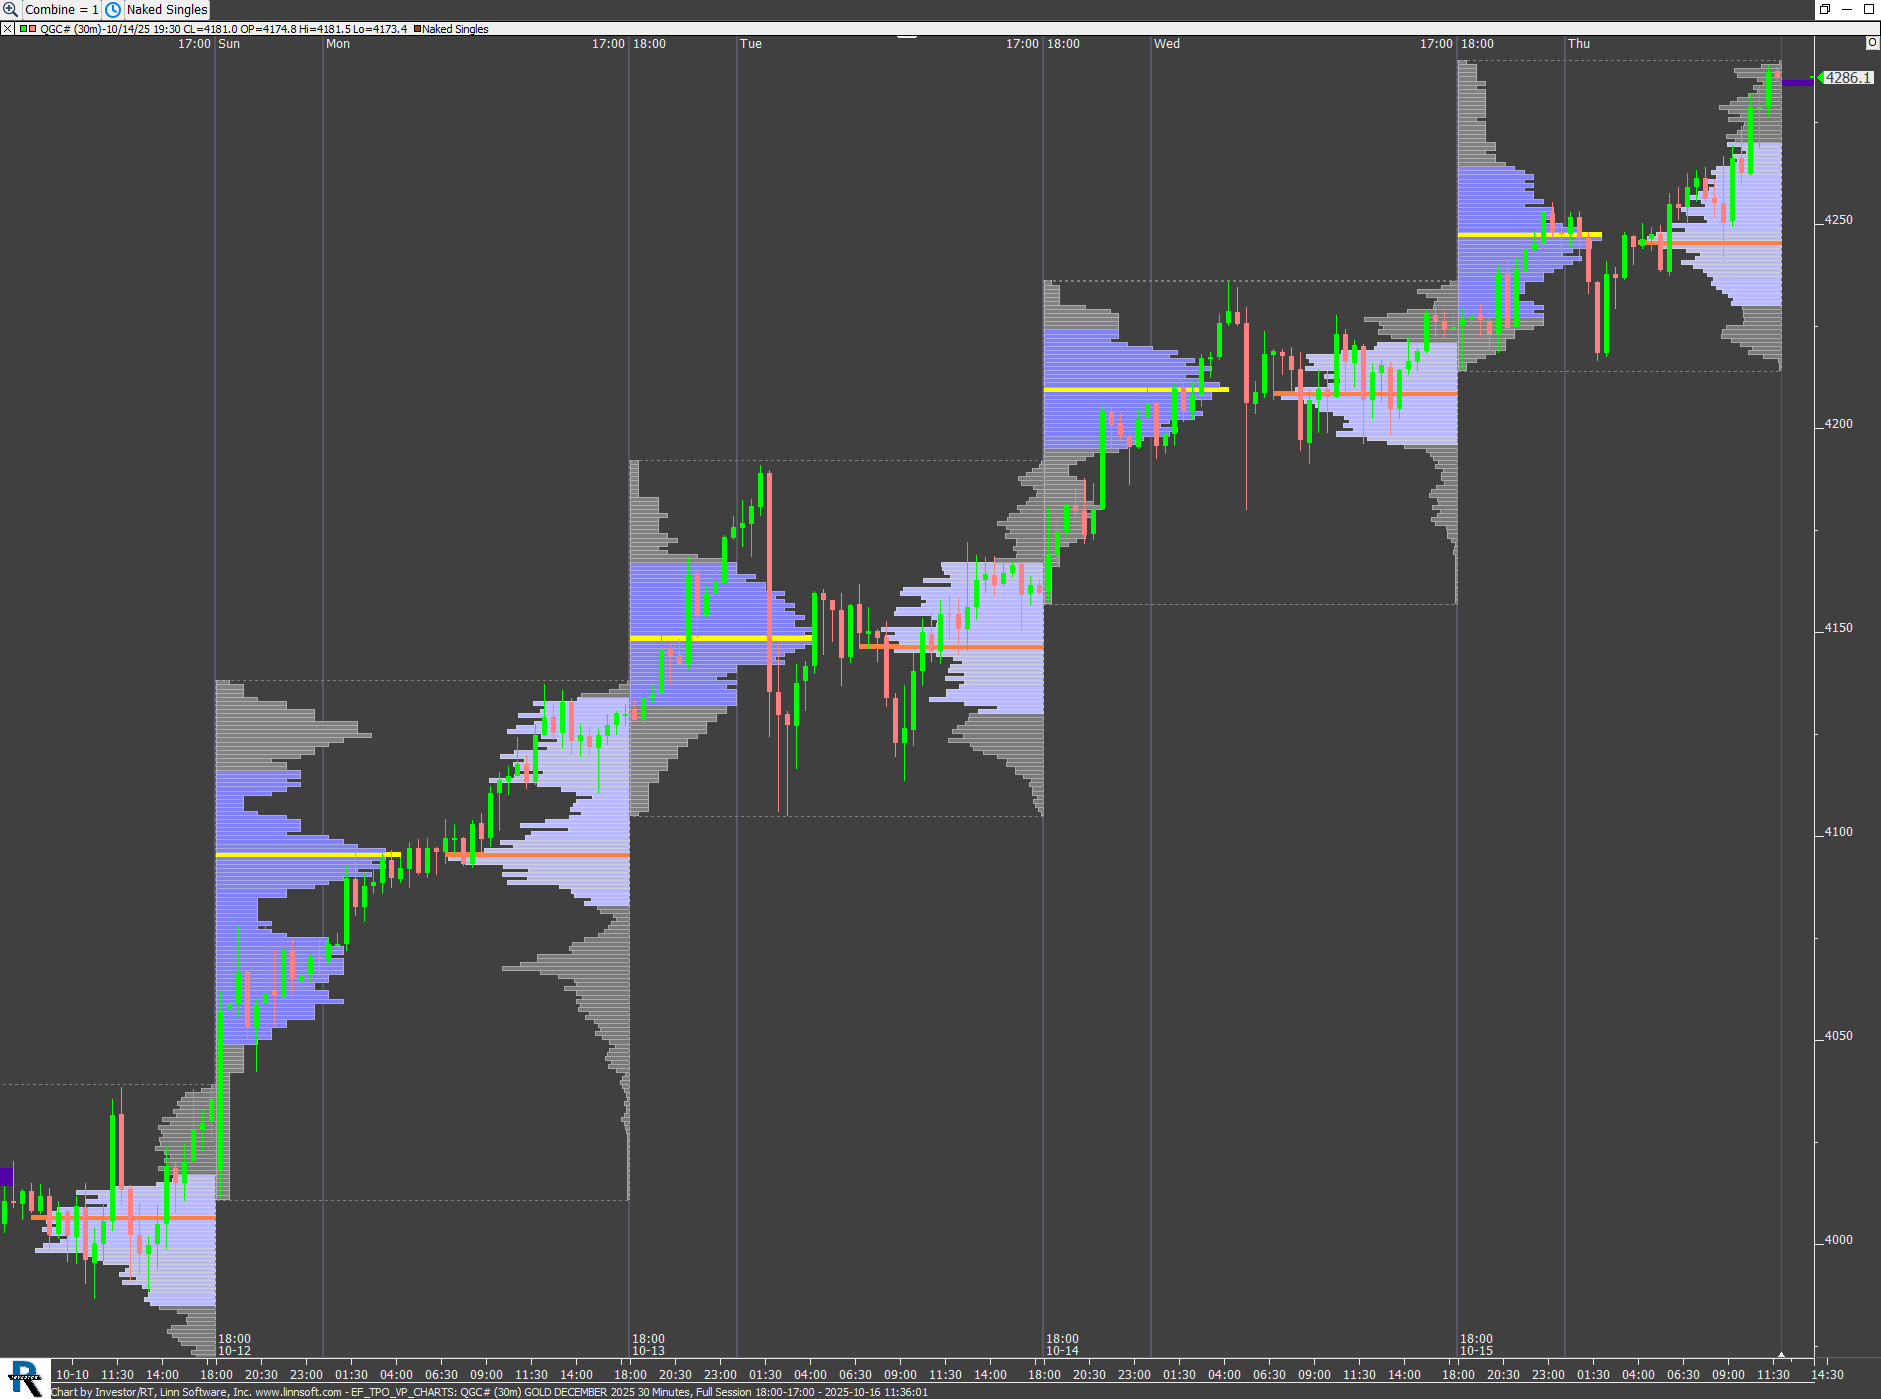 |
EF TPO VP CHARTS (QGC#) Eddy [totalcount]
2 months 3 days ago
TPO and Volume Profile on the same 30 minute charts - A Combine (set C#1) button controls the price per row input and another button adds naked singles. |
View |
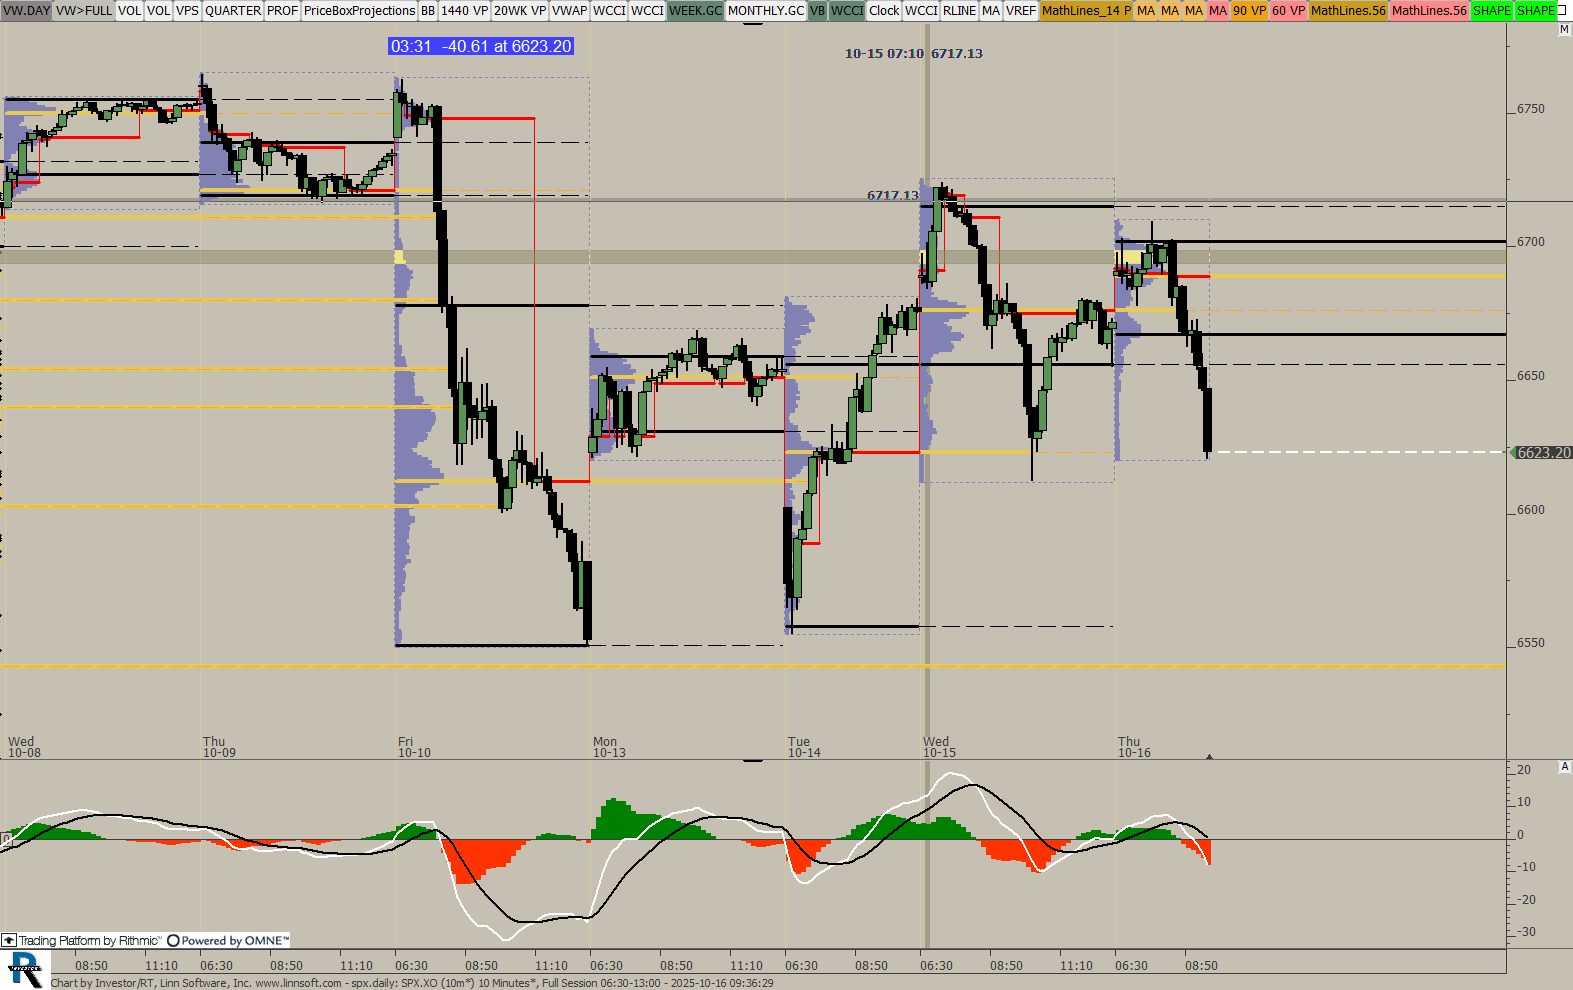 |
SPXDaily (SPX.XO) ES42 [totalcount]
2 months 3 days ago
This chart was uploaded by Investor/RT 15.1.16 showing symbol: SPX.XO. |
View |
 |
Untitled TPO 6 (ESZ5) ES42 [totalcount]
2 months 1 week ago
This chart was uploaded by Investor/RT 15.1.25 showing symbol: ESZ5. |
View |
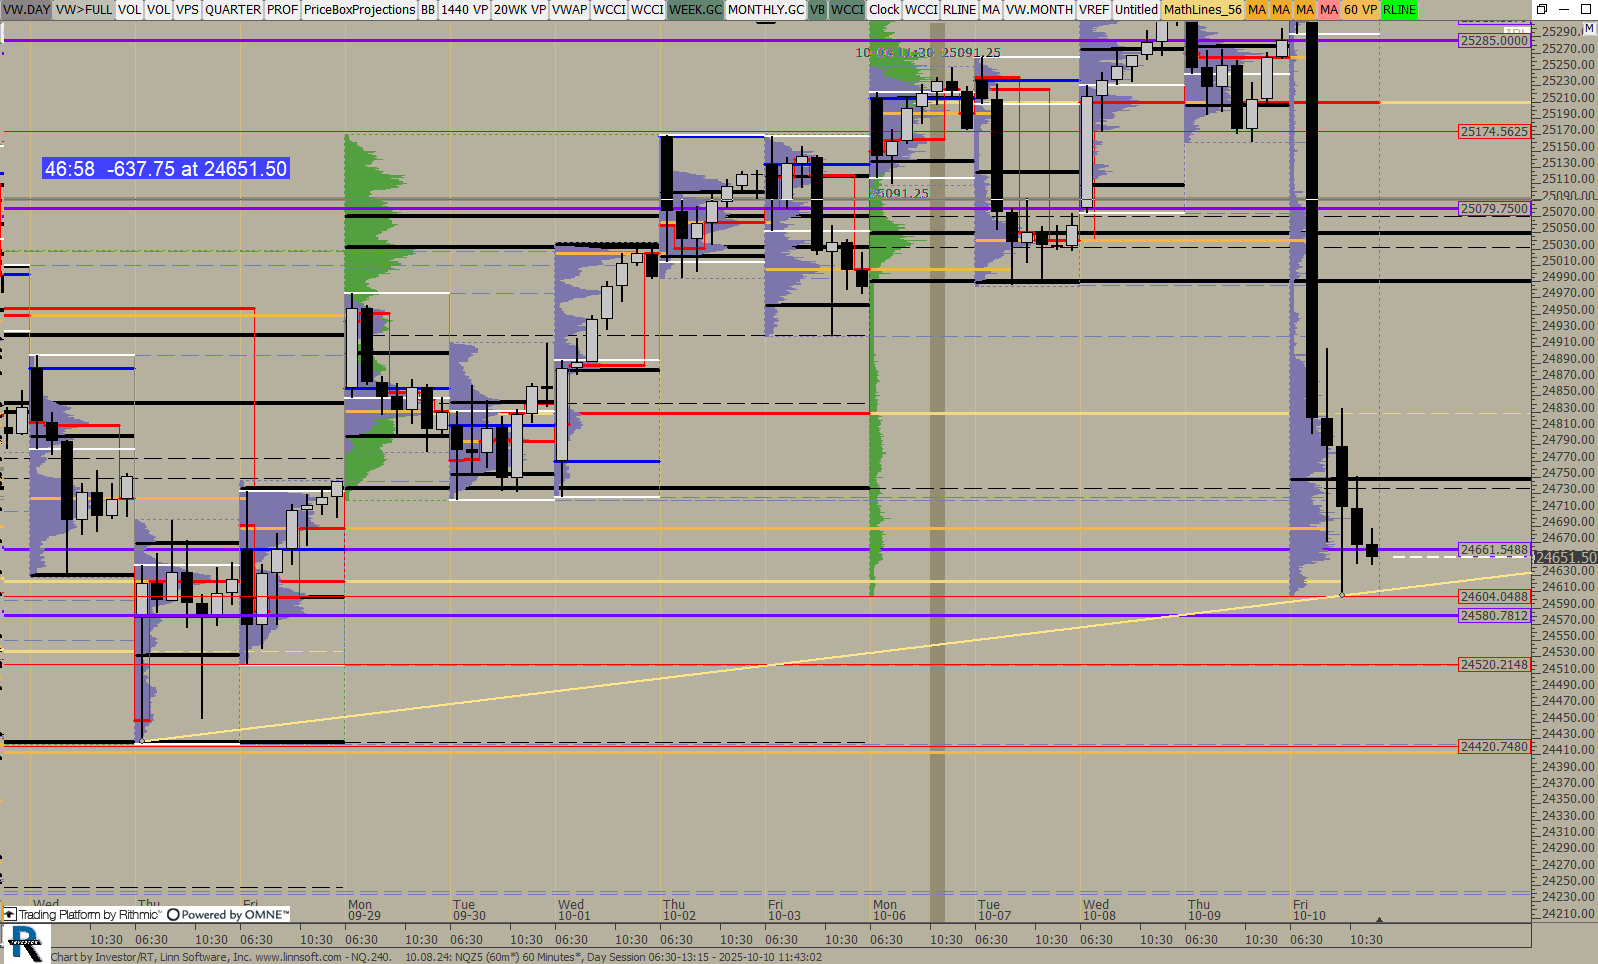 |
NQ240 100824 (NQZ5) ES42 [totalcount]
2 months 1 week ago
This chart was uploaded by Investor/RT 15.1.25 showing symbol: NQZ5. |
View |
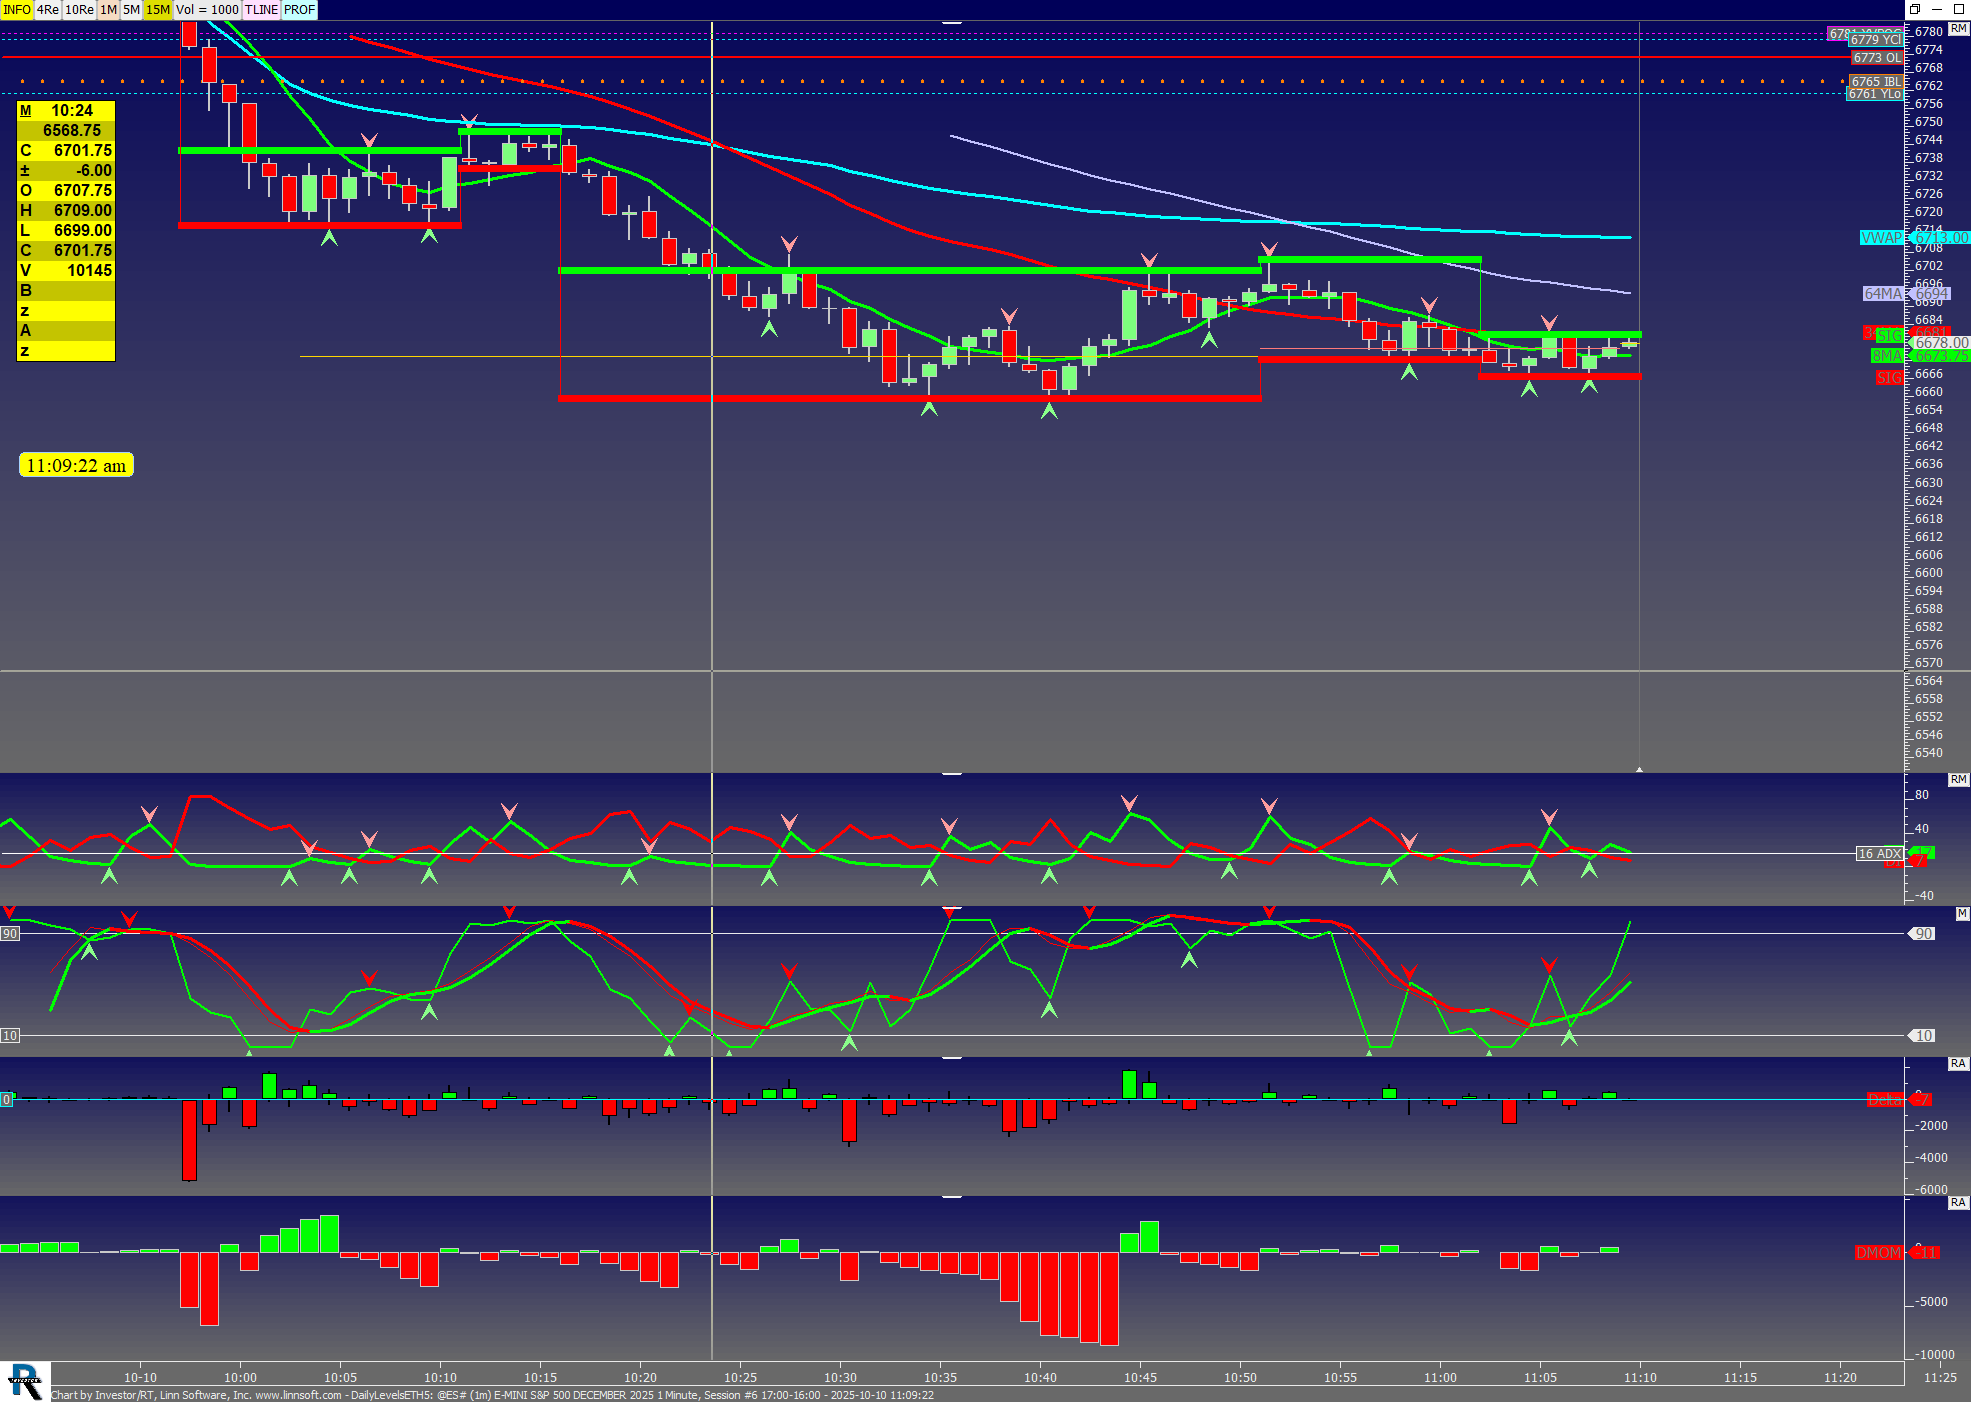 |
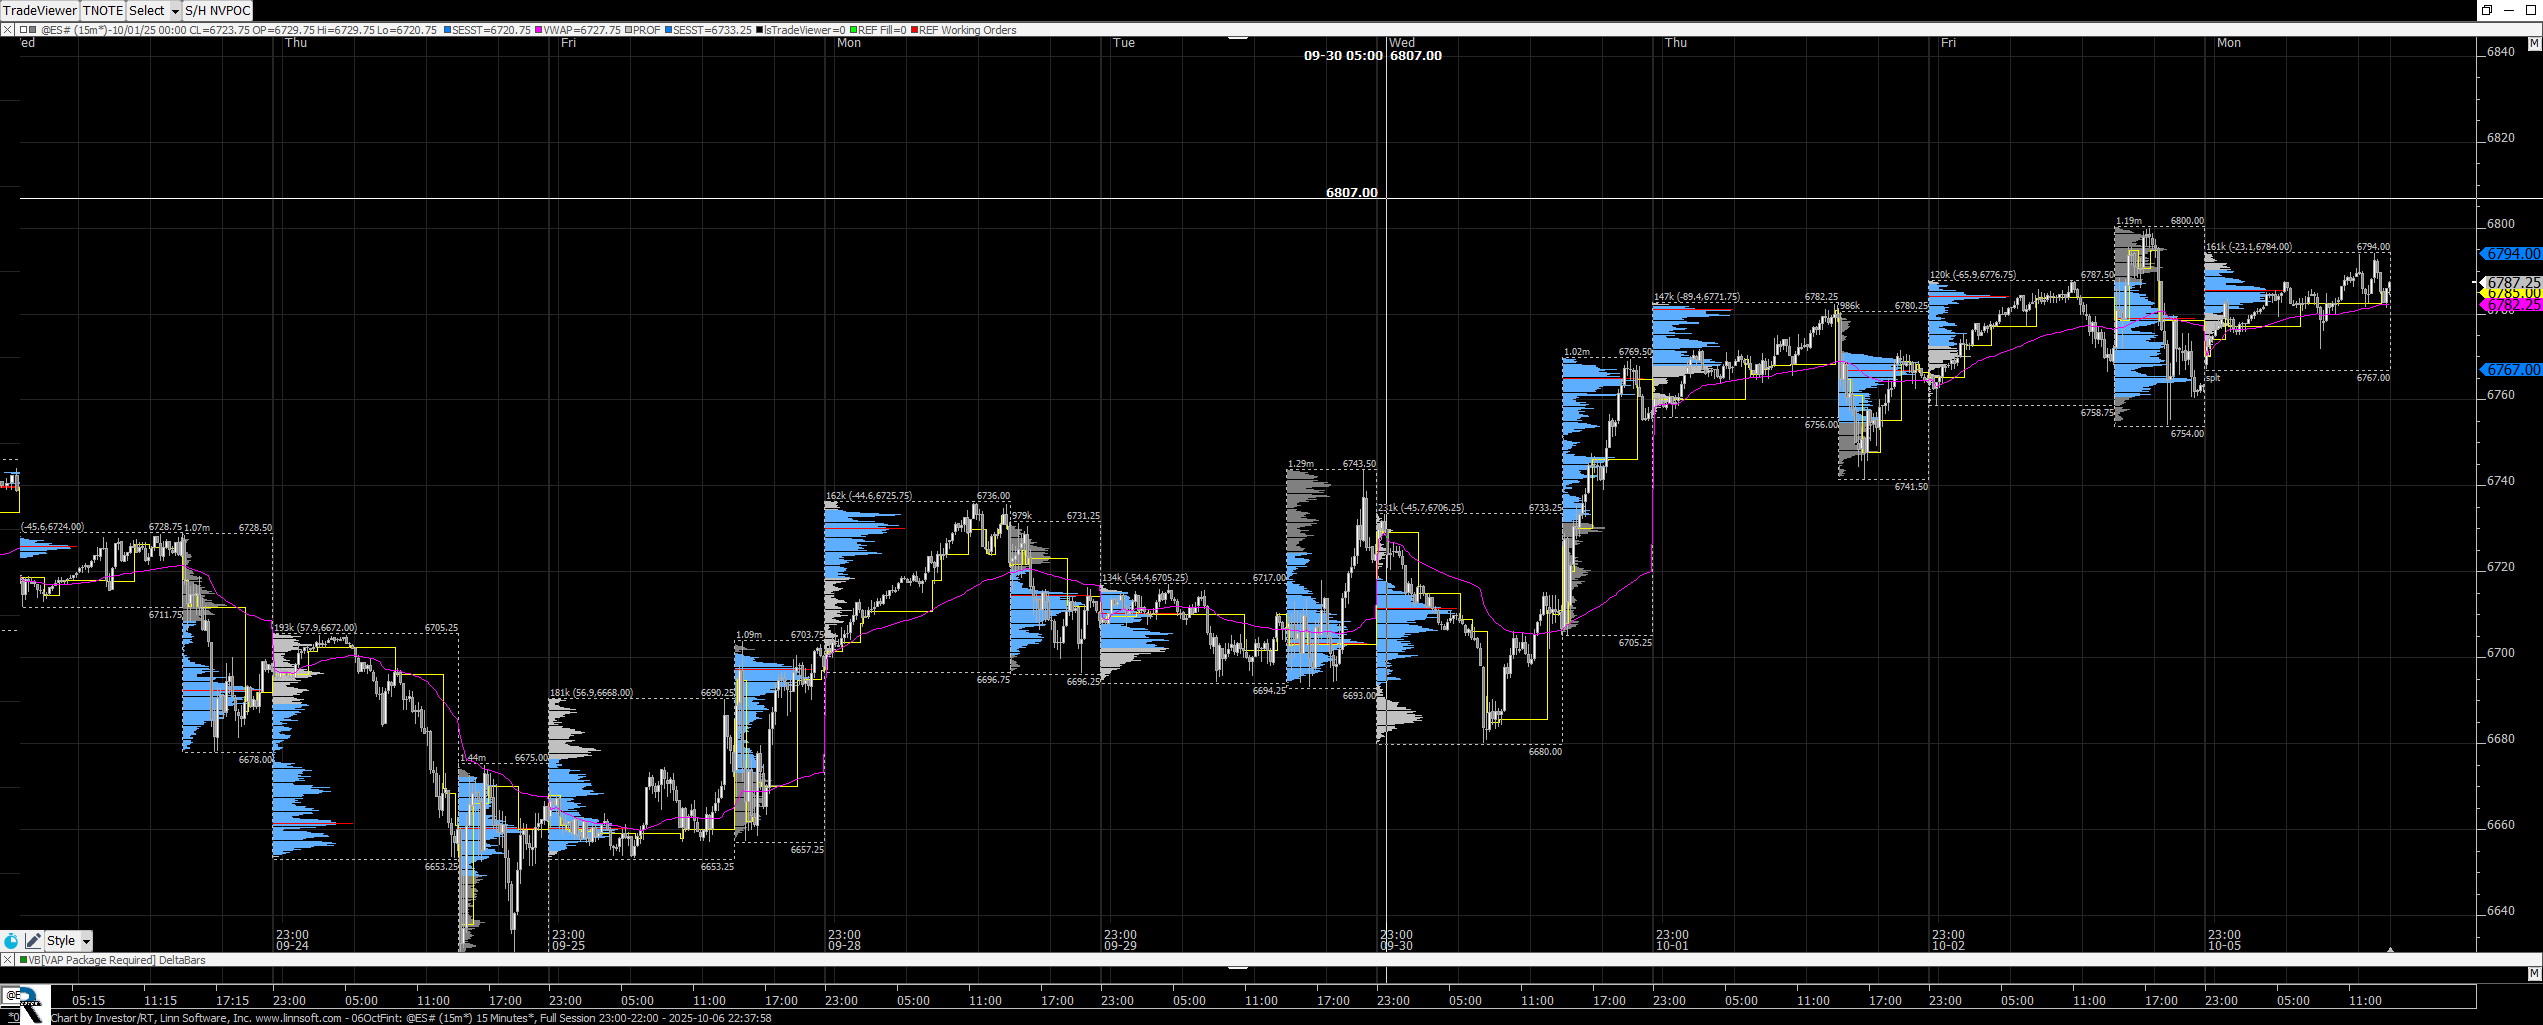
DailyLevelsETH5 (@ES#) Gerald J Gottus [totalcount]
2 months 1 week ago
This chart was uploaded by Investor/RT 15.1.16 showing symbol: @ES#. |
View |
 |
ESDAILY TPO 110424 (ESZ5) ES42 [totalcount]
2 months 1 week ago
This chart was uploaded by Investor/RT 15.1.25 showing symbol: ESZ5. |
View |
 |
NQ Daily TPO alt 01 (NQZ5) ES42 [totalcount]
2 months 1 week ago
This chart was uploaded by Investor/RT 15.1.25 showing symbol: NQZ5. |
View |
 |
06OctFint (@ES#) fintan sealy [totalcount]
2 months 1 week ago
This chart was uploaded by Investor/RT 16.1.10 showing symbol: @ES#. |
View |
 |
NQZ5 TPO Daily (NQZ5) ES42 [totalcount]
2 months 1 week ago
This chart was uploaded by Investor/RT 15.1.25 showing symbol: NQZ5. |
View |
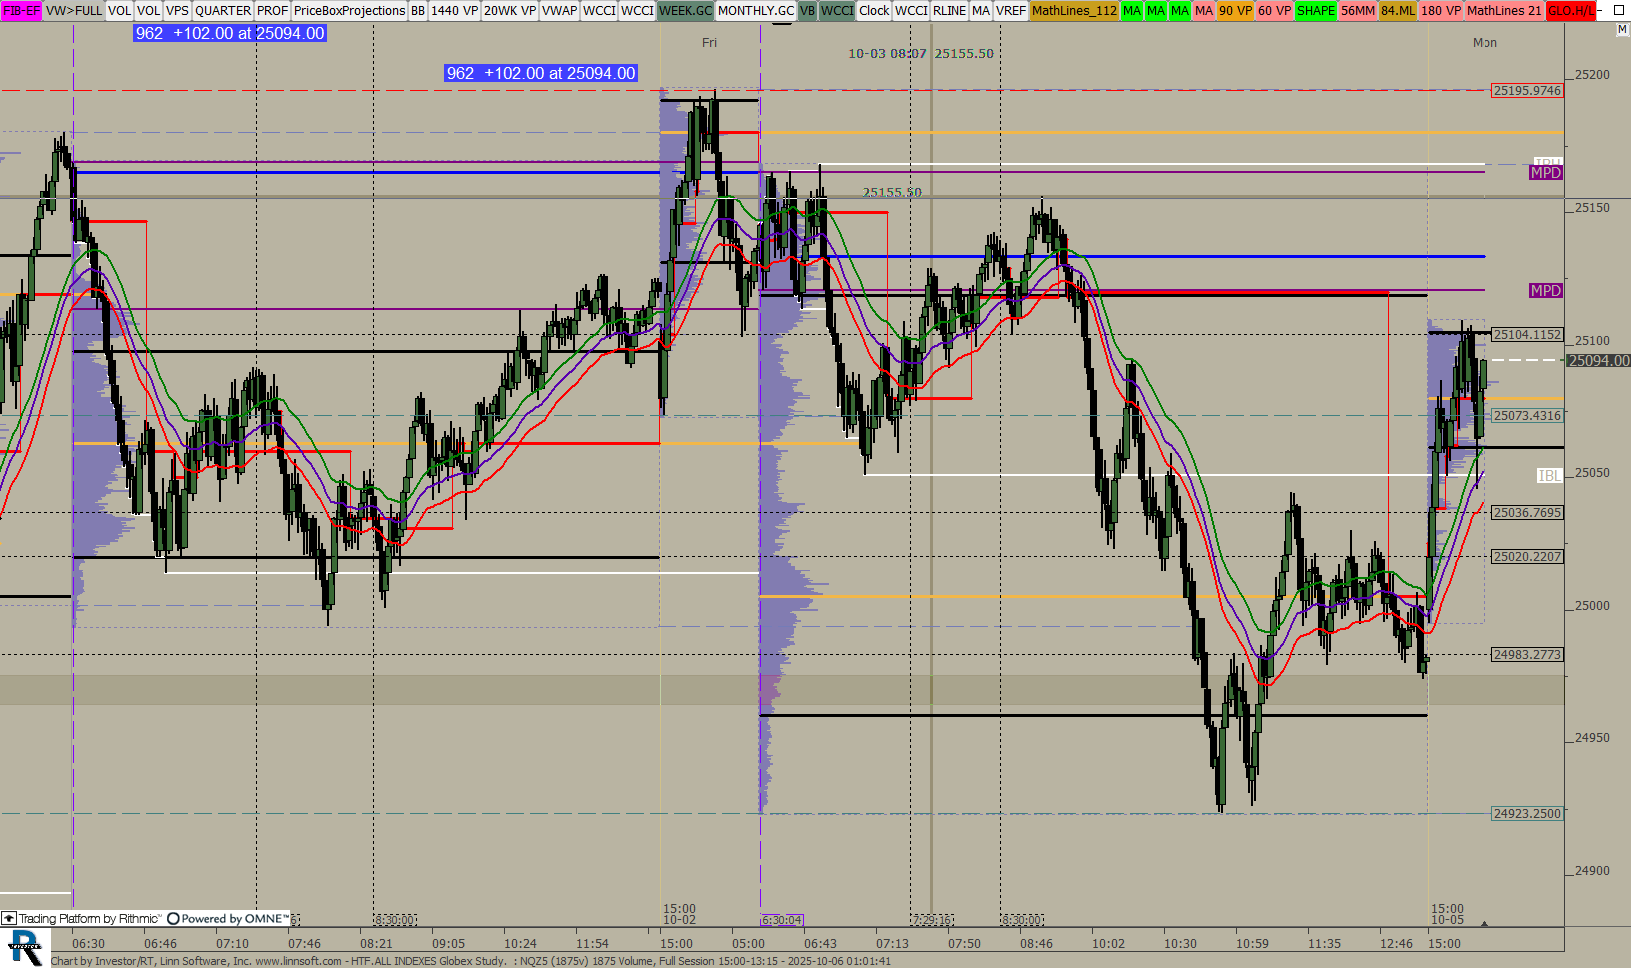 |
HTFALL INDEXES Globex Study (NQZ5) ES42 [totalcount]
2 months 1 week ago
This chart was uploaded by Investor/RT 15.1.25 showing symbol: NQZ5. |
View |
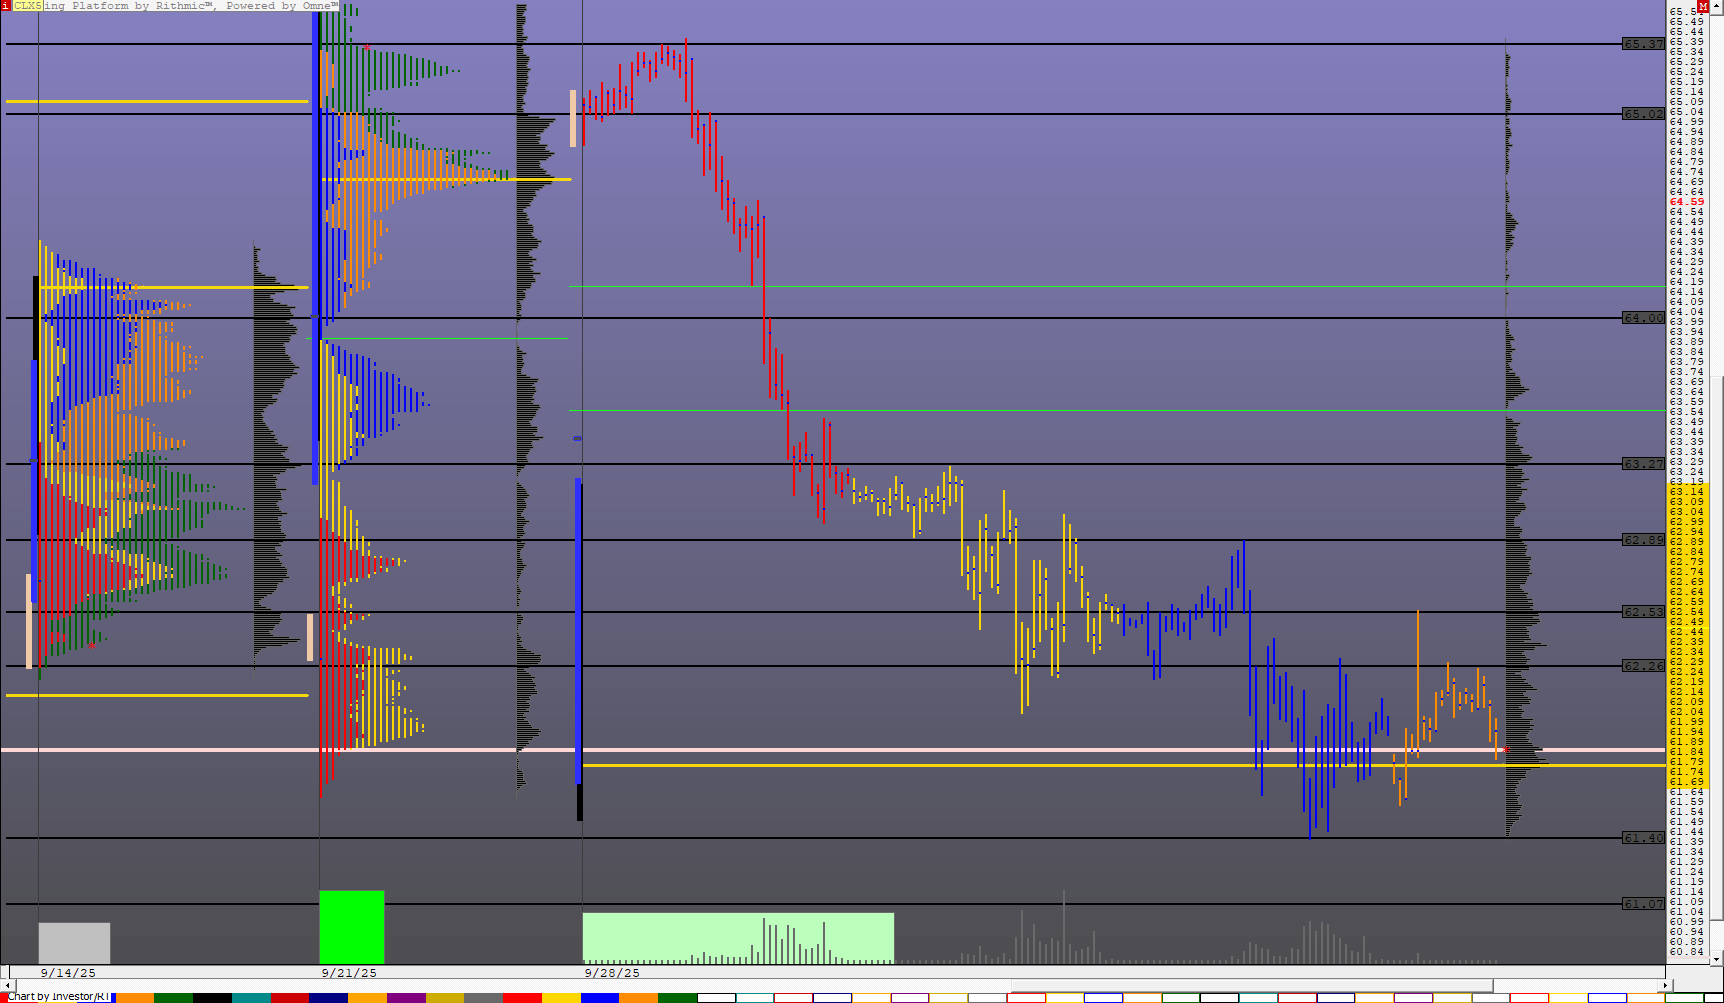 |
CLX5 (CLX5) ES42 [totalcount]
2 months 2 weeks ago
This chart was uploaded by Investor/RT 15.1.25 showing symbol: CLX5. |
View |
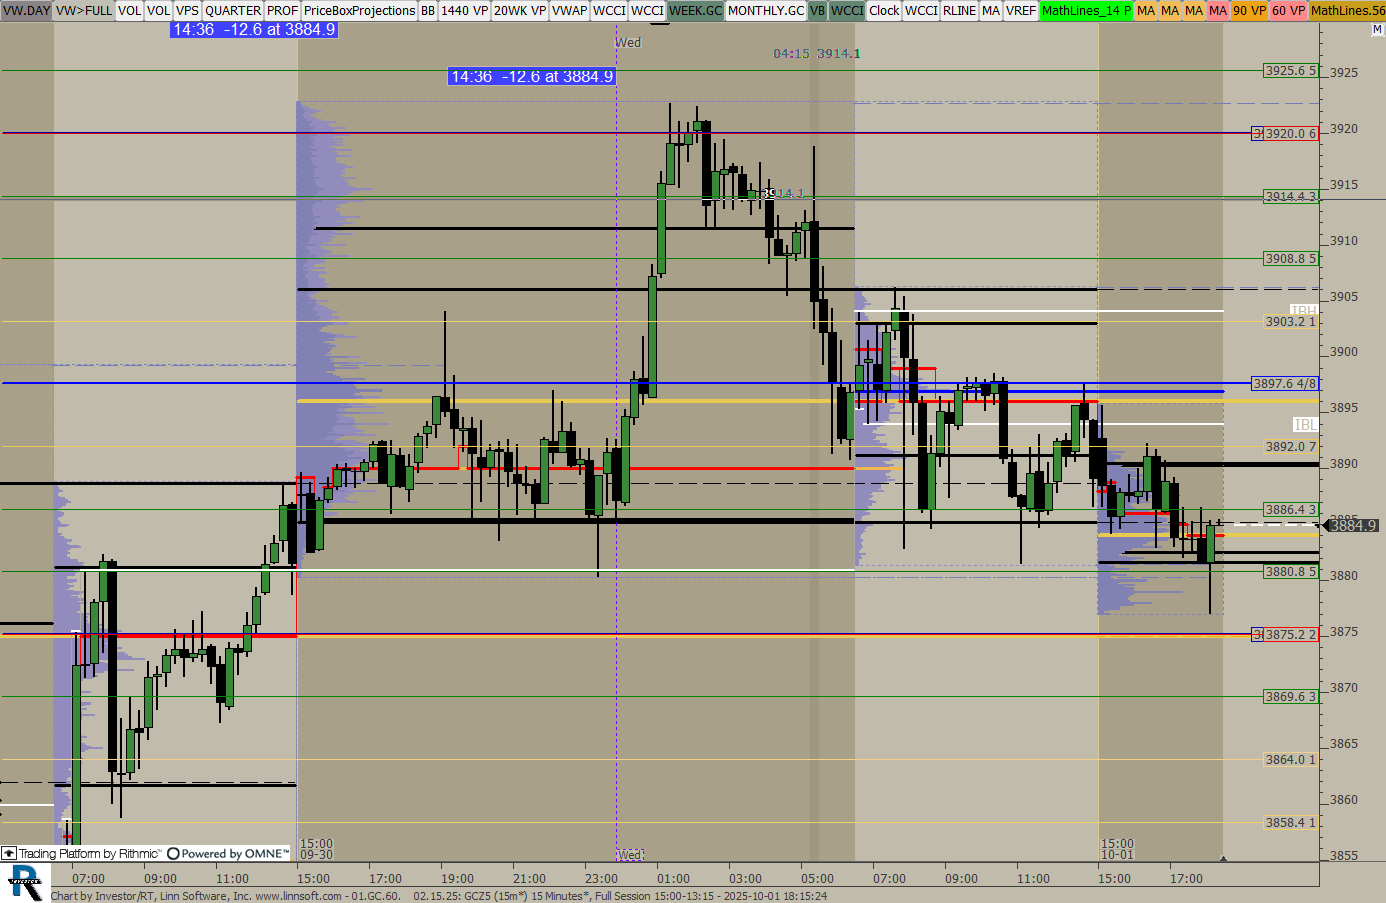 |
01GC60 021525 (GCZ5) ES42 [totalcount]
2 months 2 weeks ago
This chart was uploaded by Investor/RT 15.1.25 showing symbol: GCZ5. |
View |
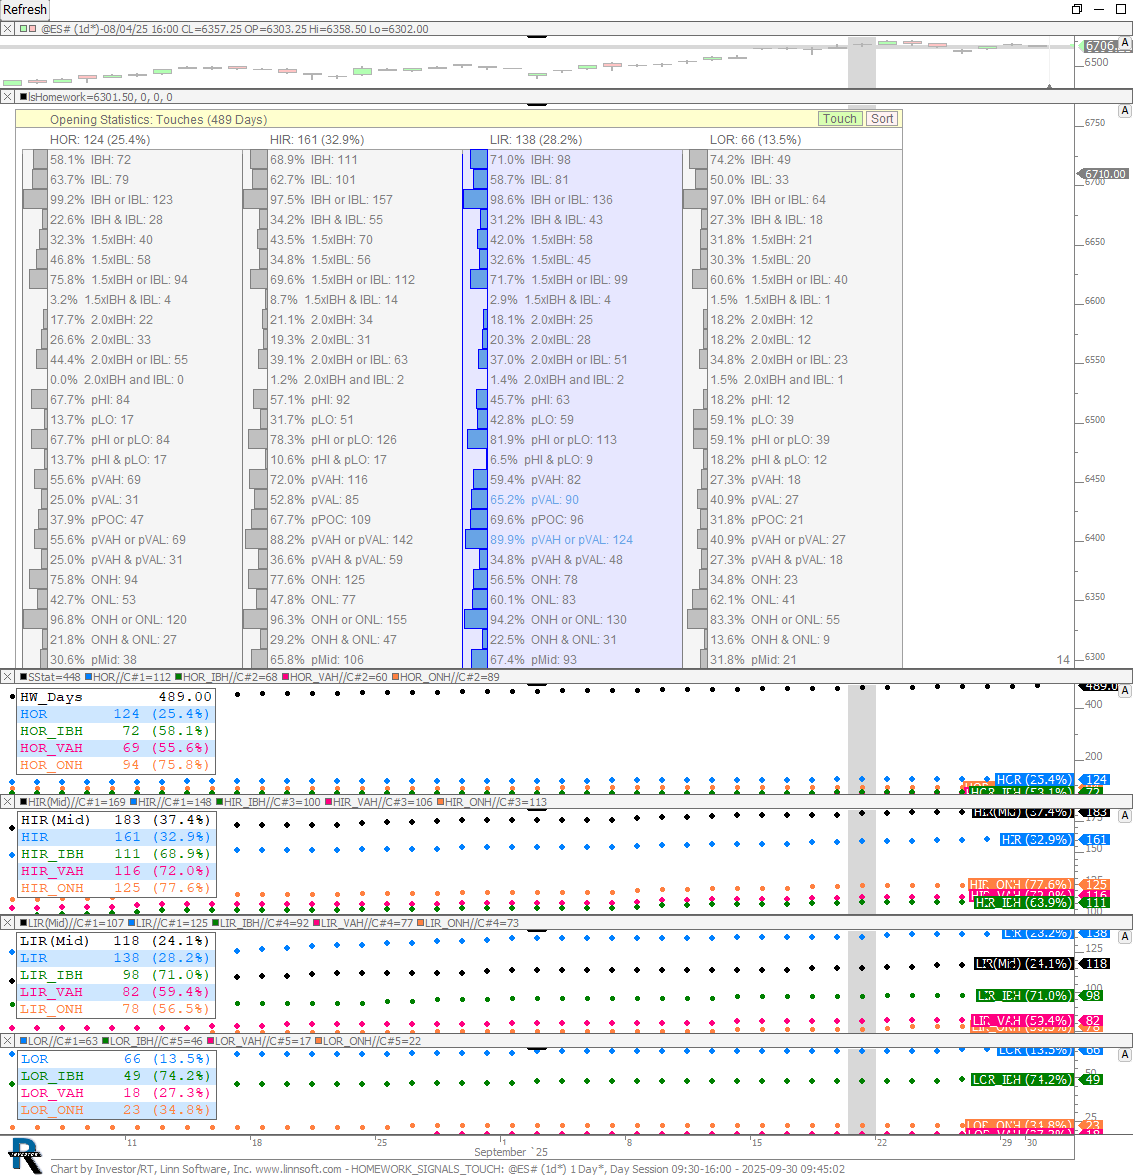 |
HOMEWORK SIGNALS TOUCH (@ES#) Eddy [totalcount]
2 months 2 weeks ago
Example of the Signal Statistics indicators used to generate some of the Homework statistics: HOR/HIR/LIR/LOR breakdown and the subsequent IBH / VAH and ONH statistics (in the "TOUCH"... |
View |
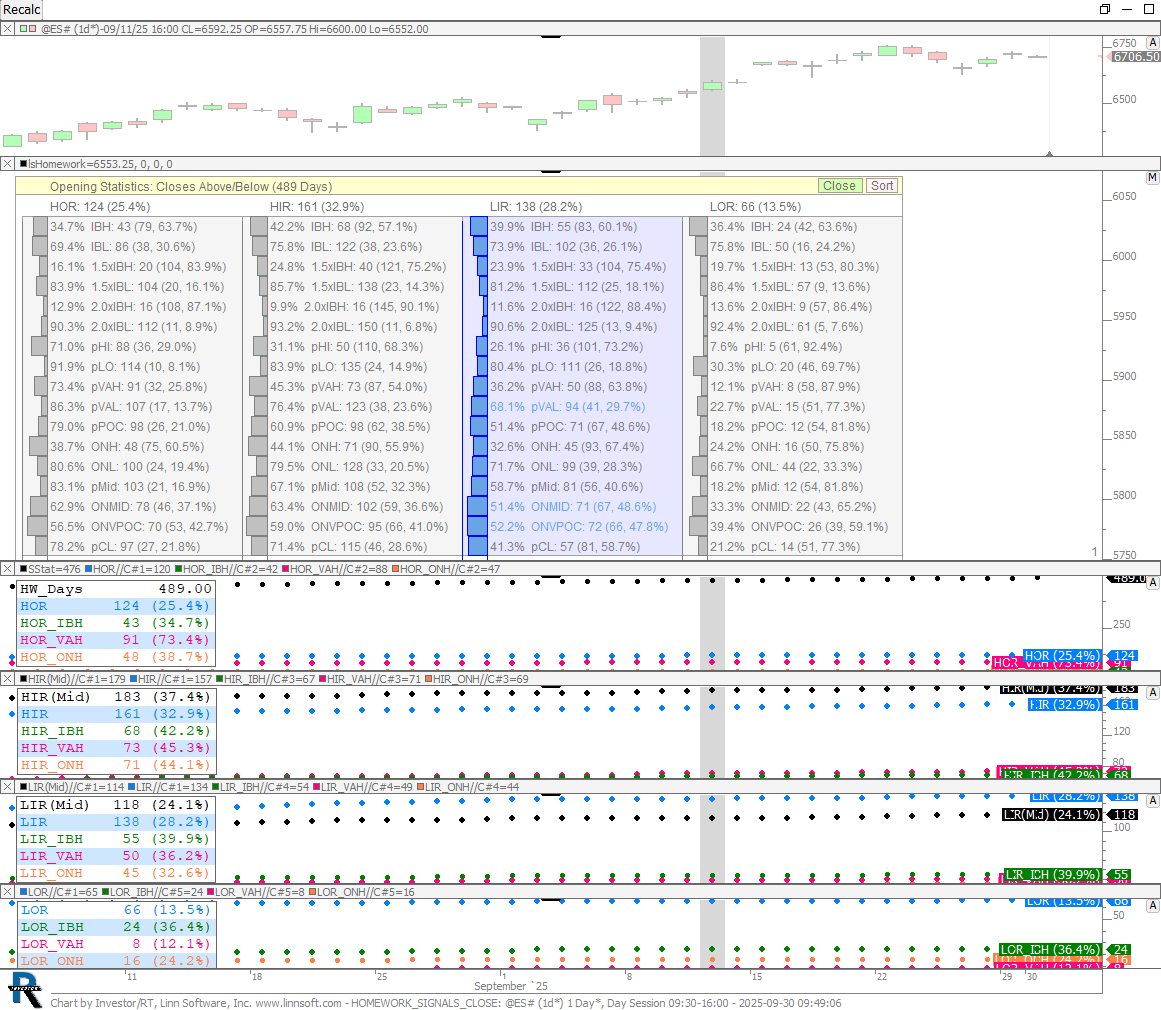 |
HOMEWORK SIGNALS CLOSE (@ES#) Eddy [totalcount]
2 months 2 weeks ago
Example of the Signals Statistics indicators used to generate some of the Homework statistics: HOR/HIR/LIR and LOR breakdown and the subsequent IBH / VAH and ONH statistics (in the "CLOSE"... |
View |
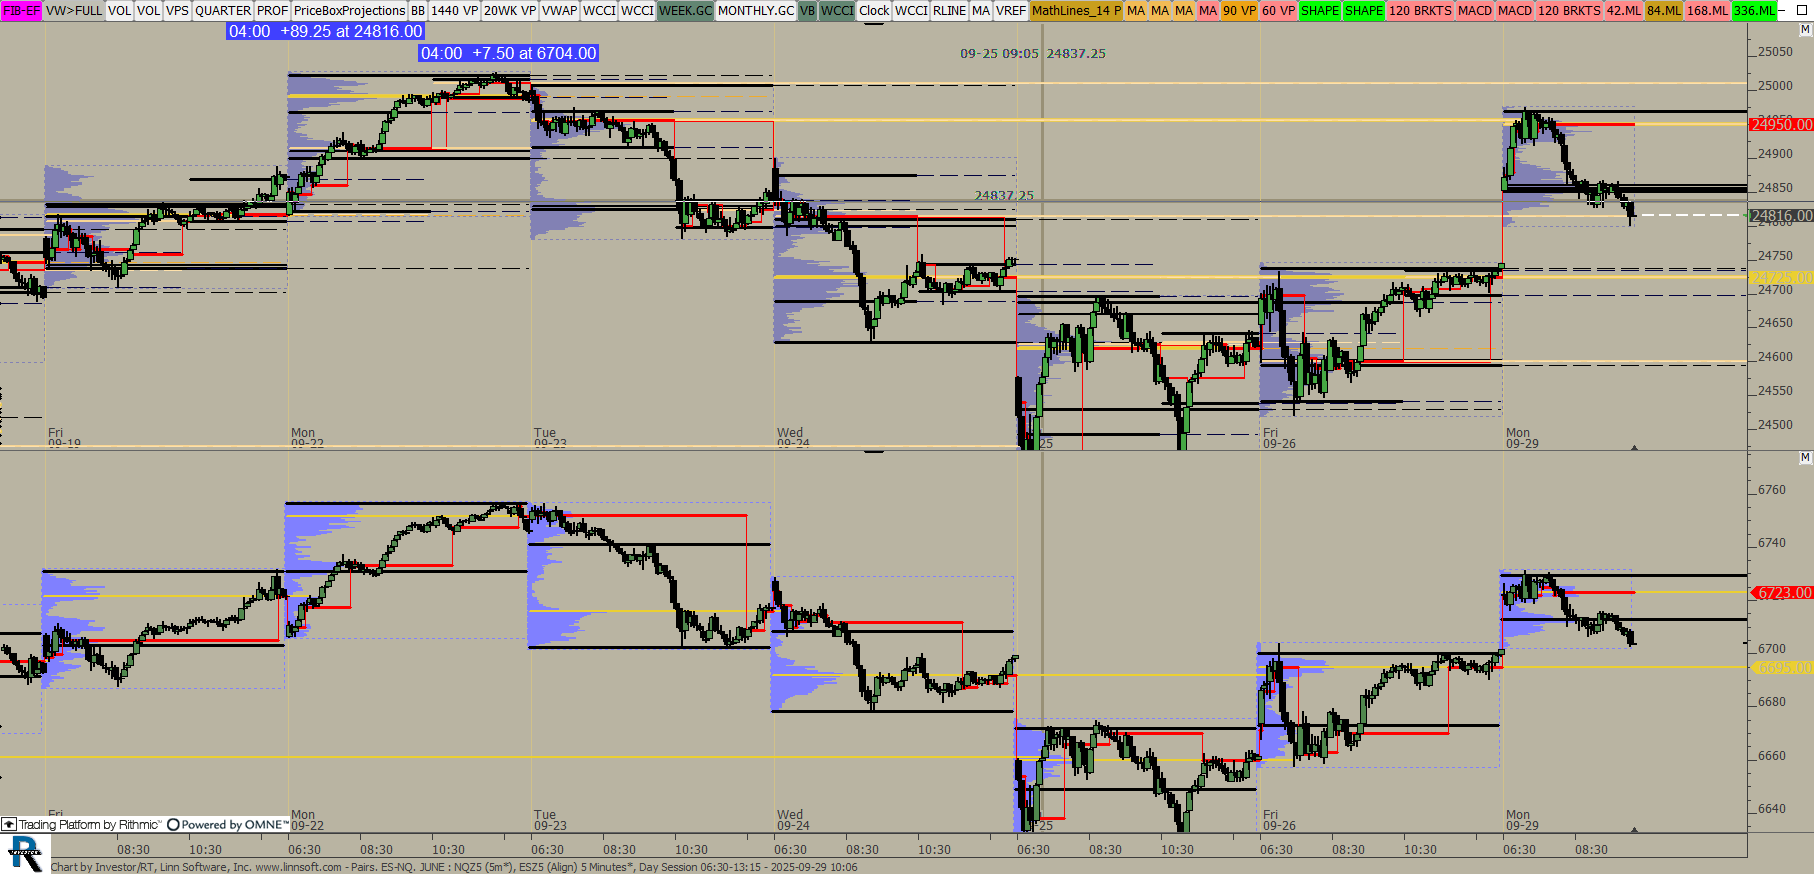 |
Pairs ES NQ JUNE (NQZ5) ES42 [totalcount]
2 months 2 weeks ago
This chart was uploaded by Investor/RT 15.1.25 showing symbol: NQZ5. |
View |
 |
NQ WEEKLY TPO (ESZ5) ES42 [totalcount]
2 months 3 weeks ago
This chart was uploaded by Investor/RT 15.1.25 showing symbol: ESZ5. |
View |
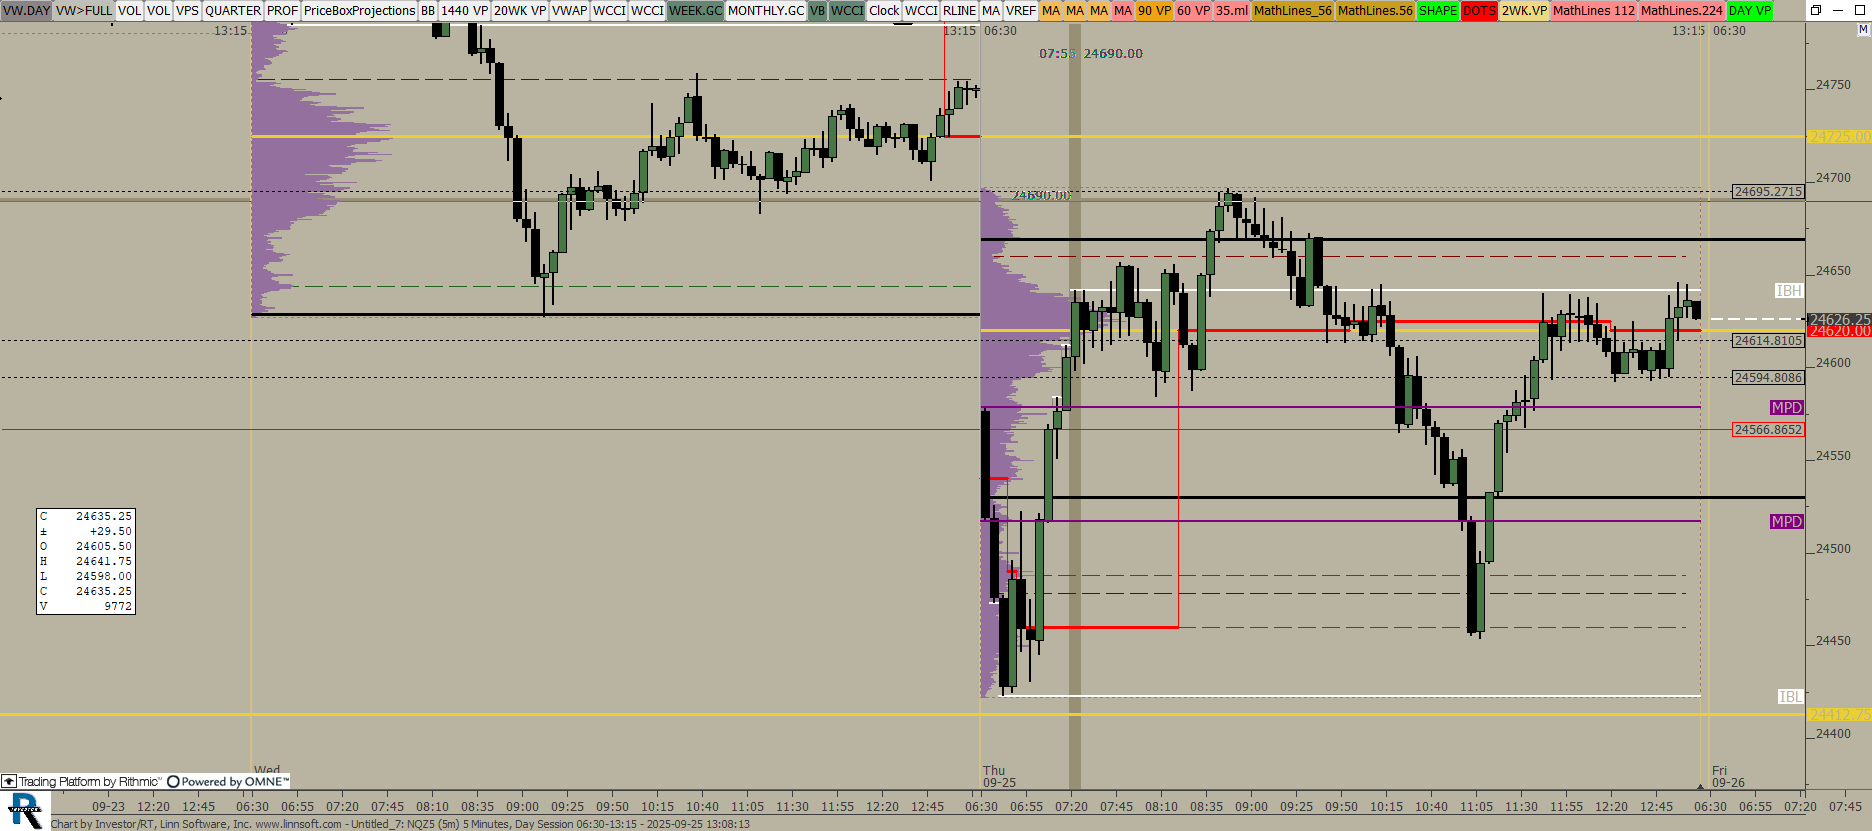 |
Untitled 7 (NQZ5) ES42 [totalcount]
2 months 3 weeks ago
This chart was uploaded by Investor/RT 15.1.25 showing symbol: NQZ5. |
View |
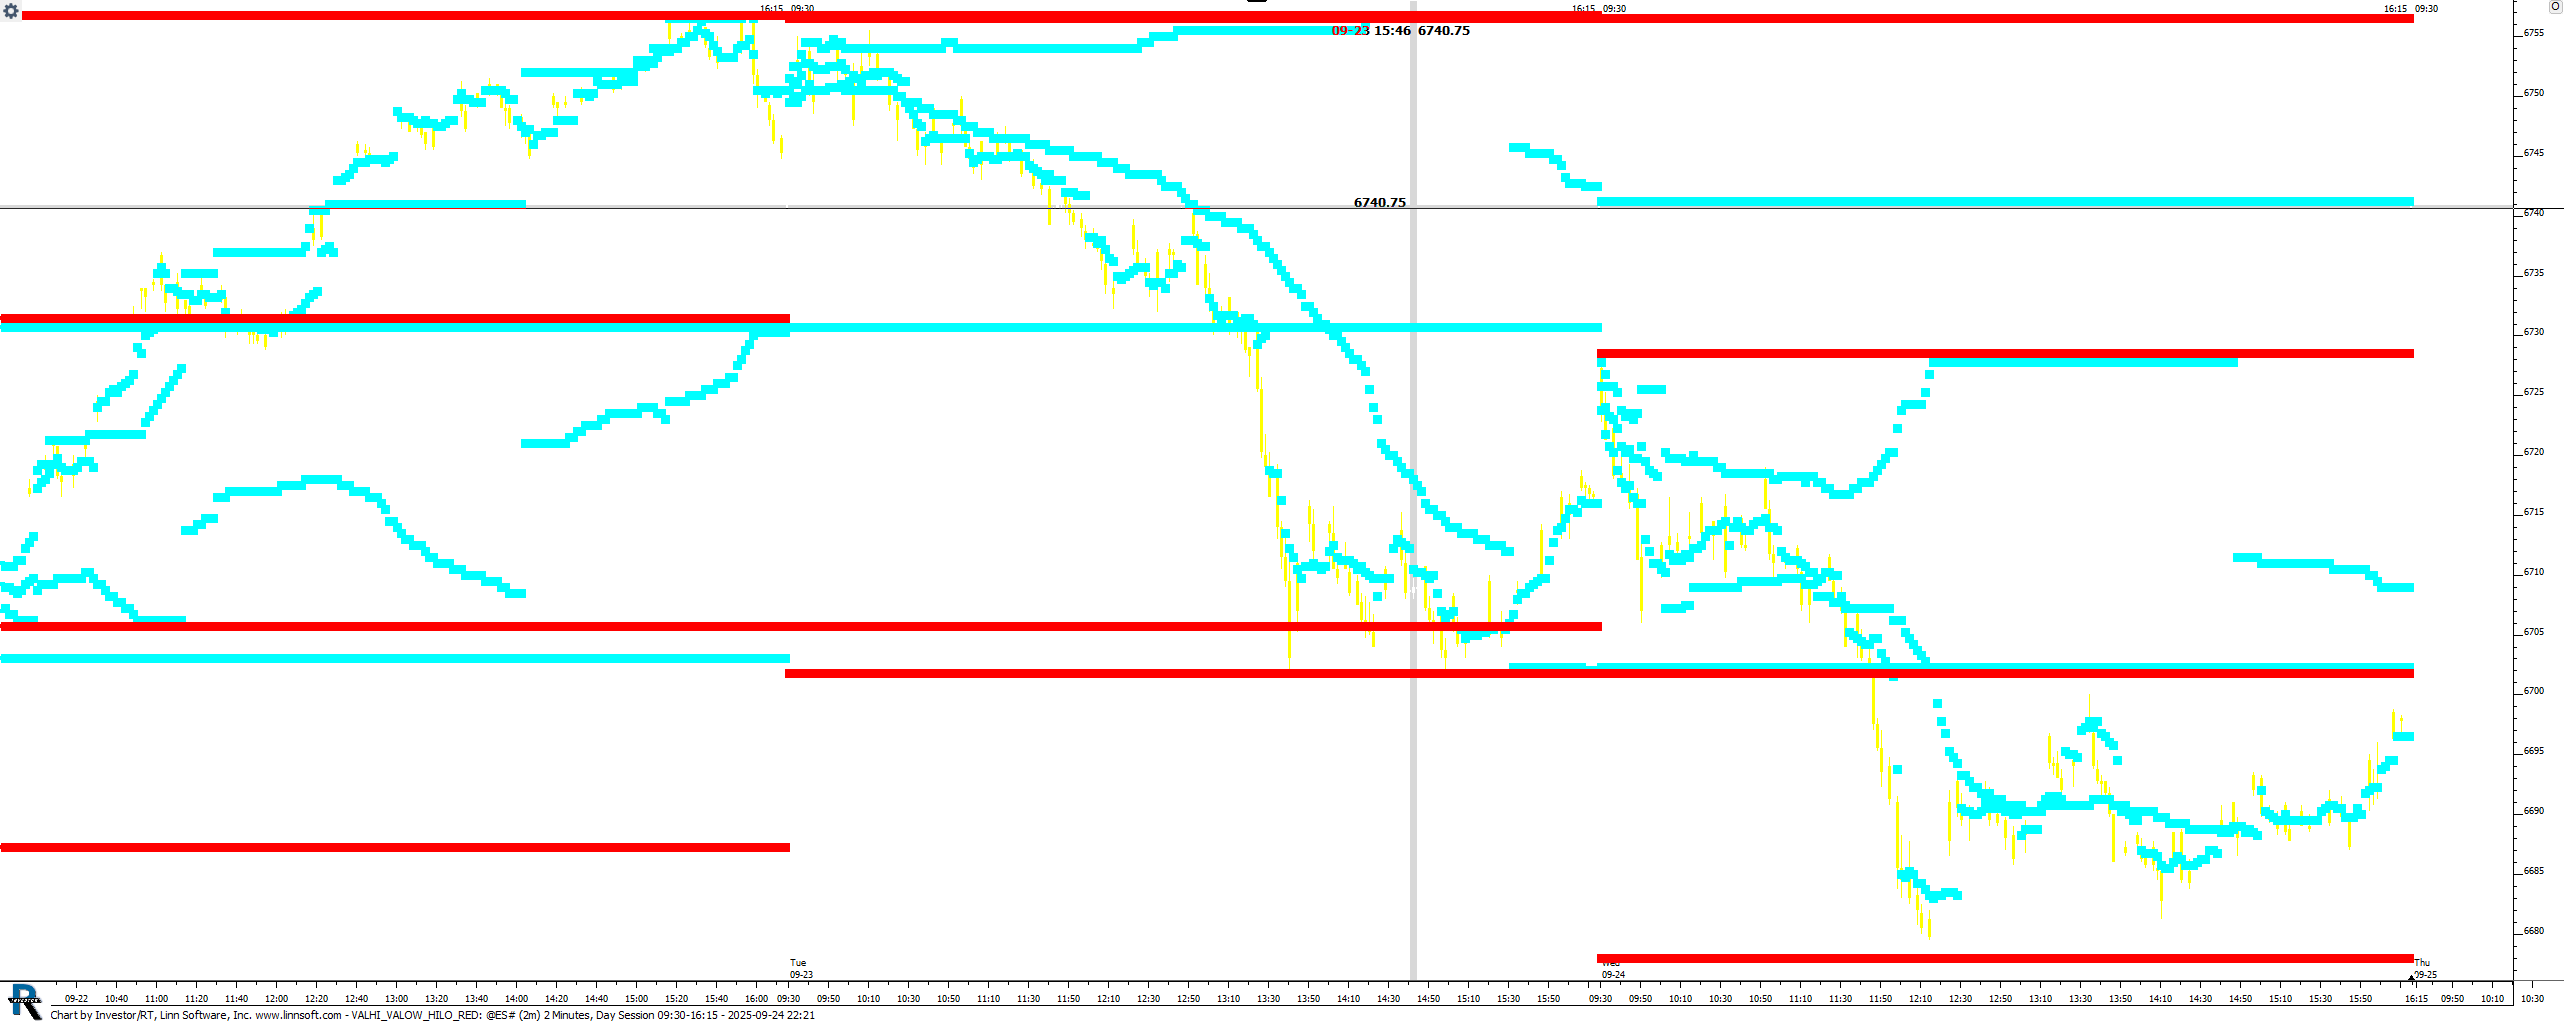 |
VALHI VALOW HILO RED (@ES#) hsams1 [totalcount]
2 months 3 weeks ago
This chart was uploaded by Investor/RT 15.1.25 showing symbol: @ES#. |
View |
 |
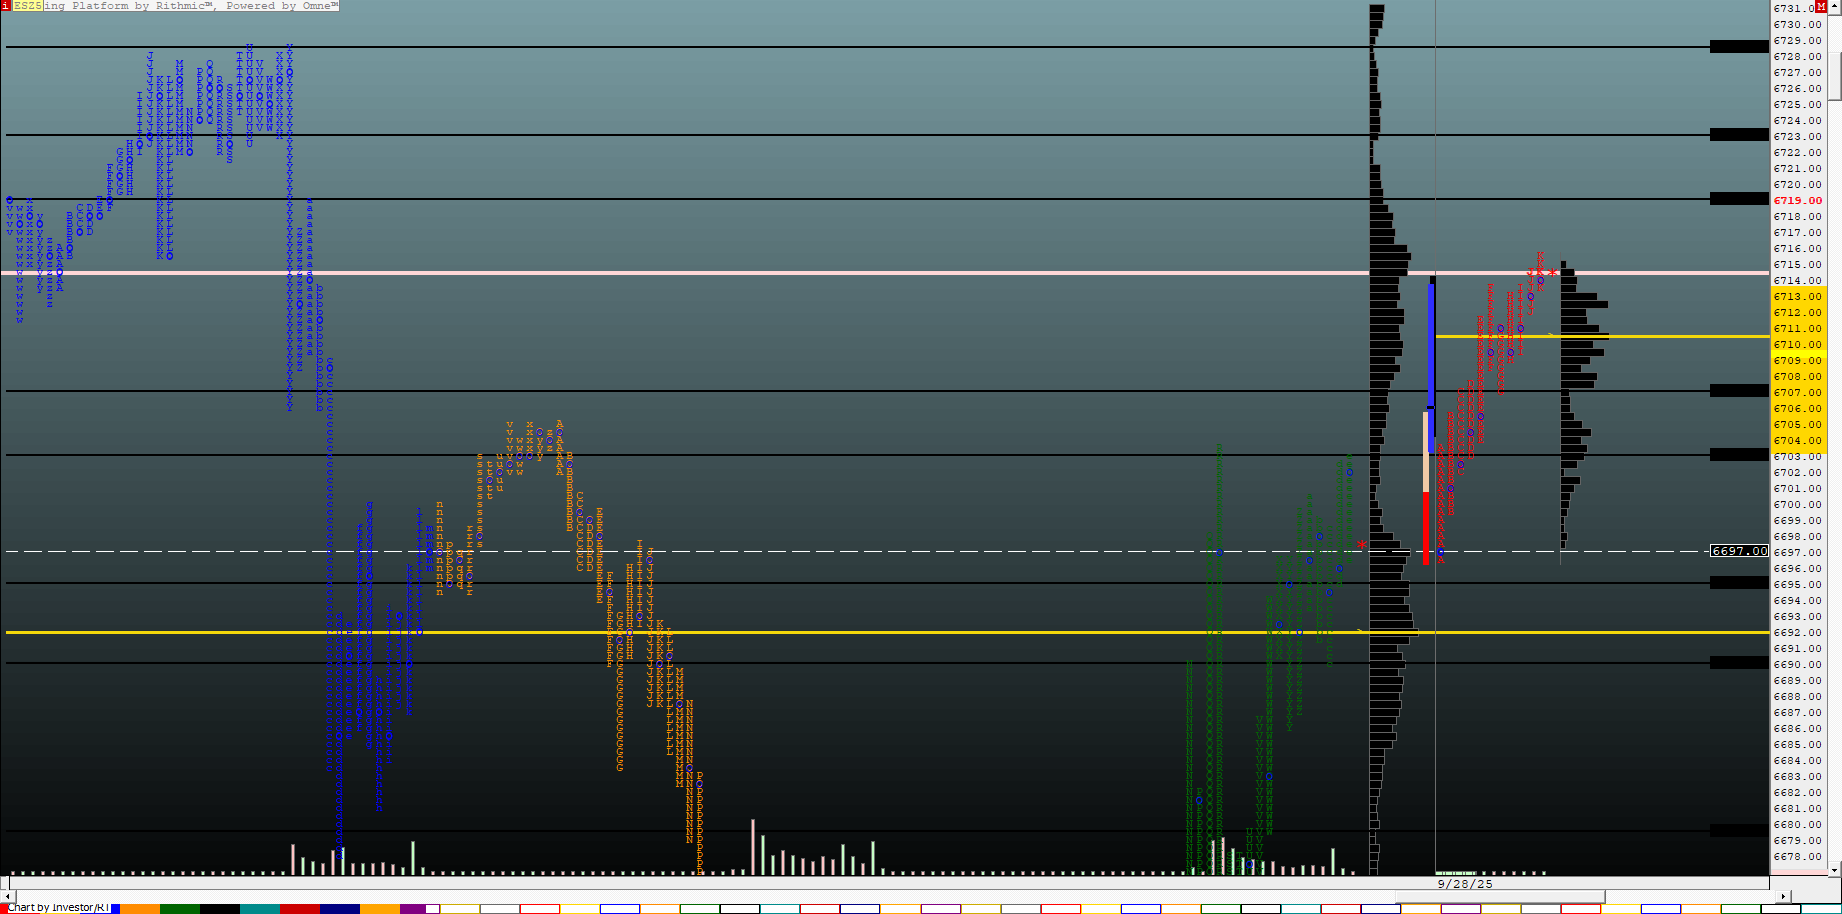
NQZ5 91525 (NQZ5) ES42 [totalcount]
2 months 3 weeks ago
This chart was uploaded by Investor/RT 15.1.25 showing symbol: NQZ5. |
View |