 |
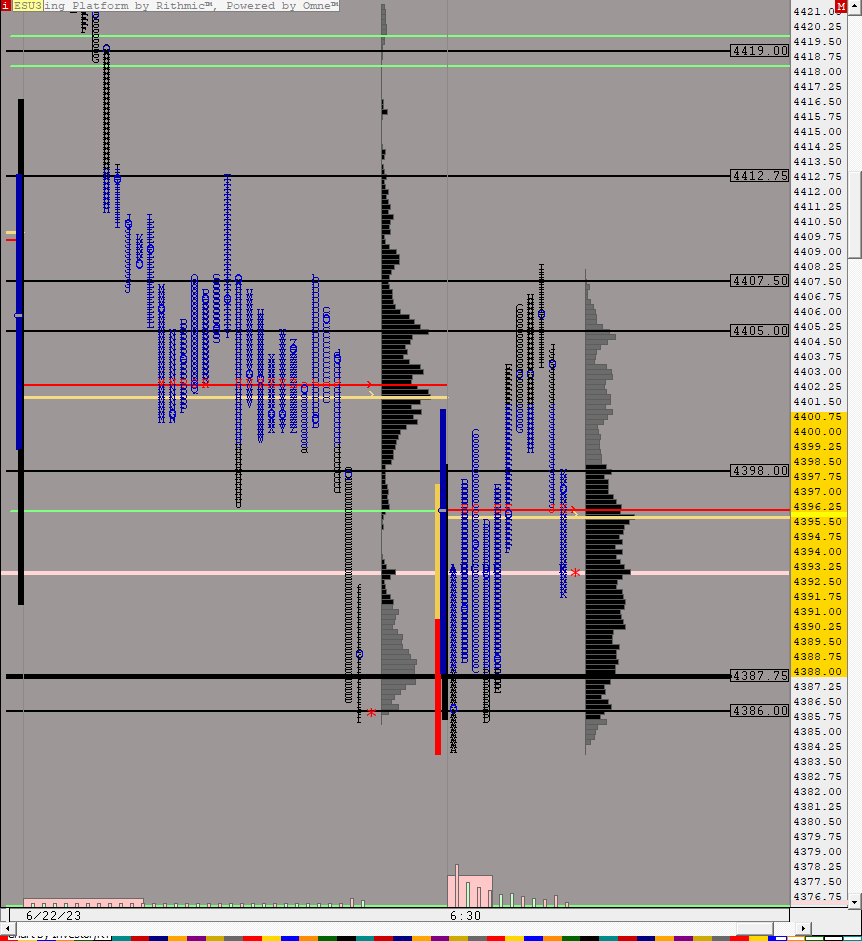
DAY ES (ESU3) ES42 [totalcount]
3 years 1 month ago
This chart was uploaded by Investor/RT 15.1.16 showing symbol: ESU3. |
View |
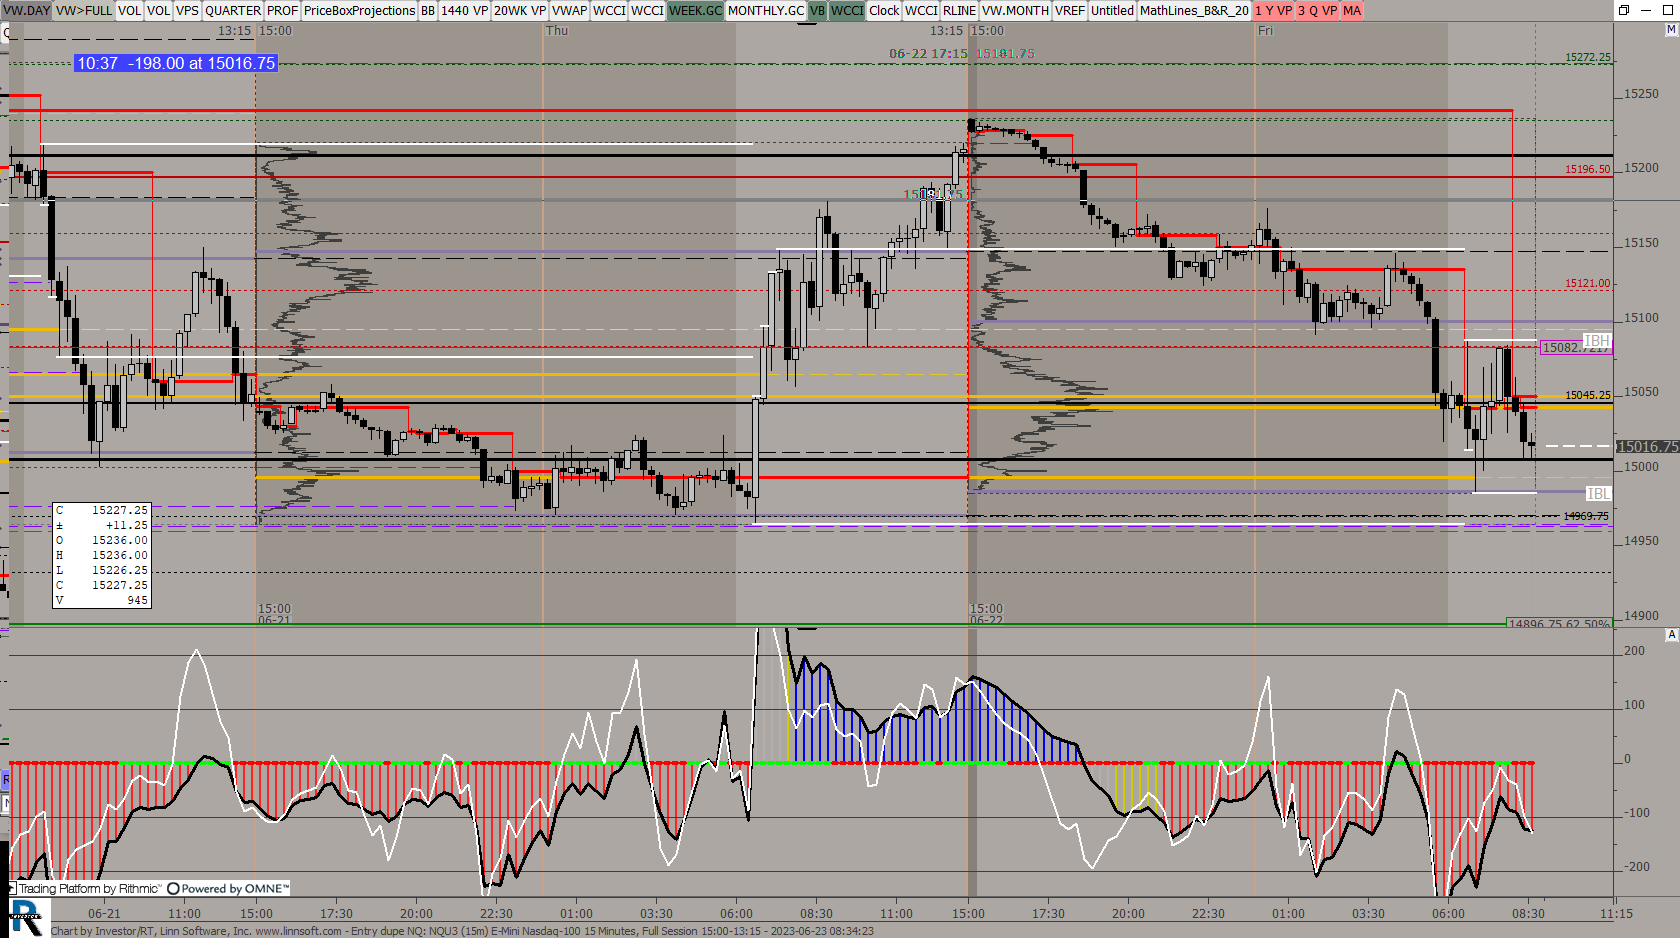 |
Entry dupe NQ (NQU3) ES42 [totalcount]
3 years 1 month ago
This chart was uploaded by Investor/RT 15.1.16 showing symbol: NQU3. |
View |
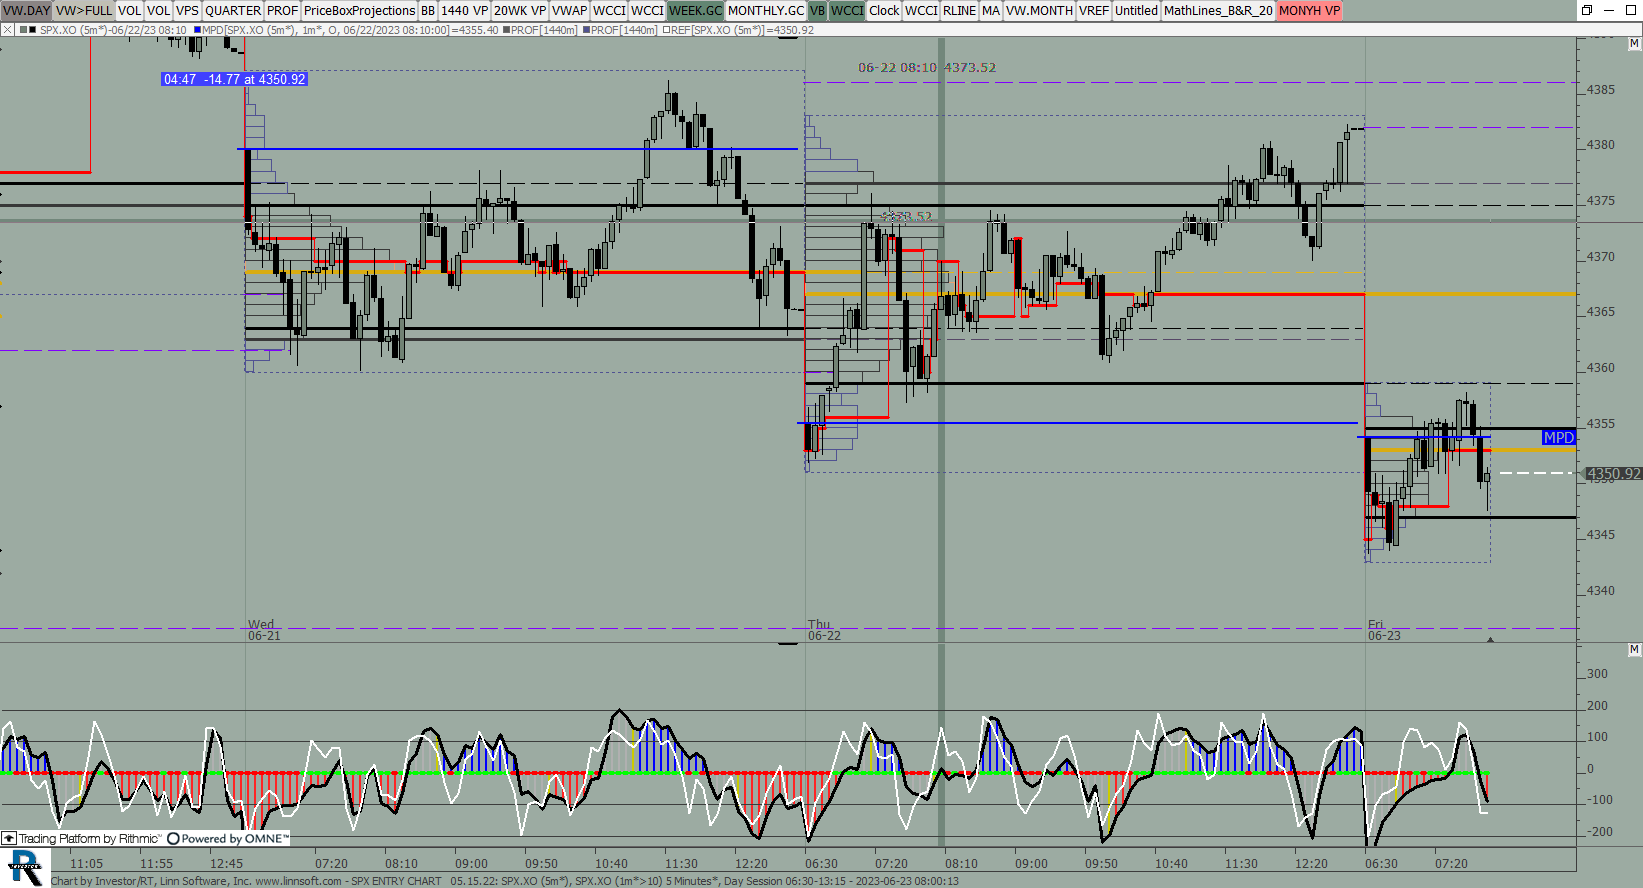 |
SPX ENTRY CHART (SPX.XO) ES42 [totalcount]
3 years 1 month ago
This chart was uploaded by Investor/RT 14.5.6 showing symbol: SPX.XO. |
View |
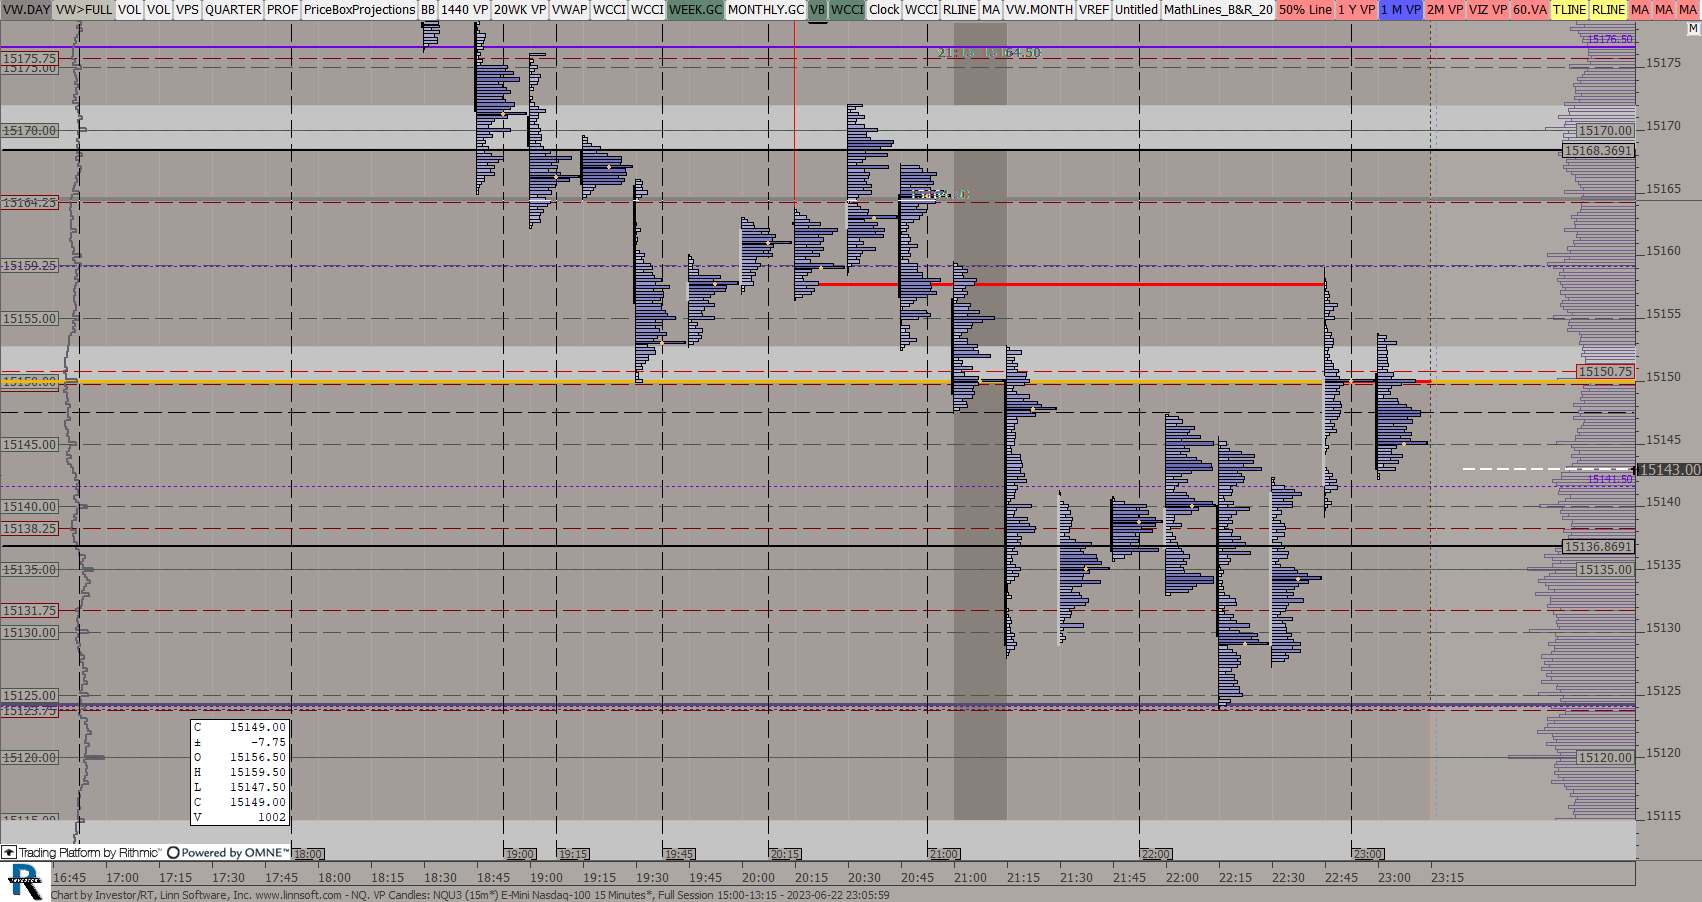 |
NQ VP Candles (NQU3) ES42 [totalcount]
3 years 1 month ago
This chart was uploaded by Investor/RT 15.1.16 showing symbol: NQU3. |
View |
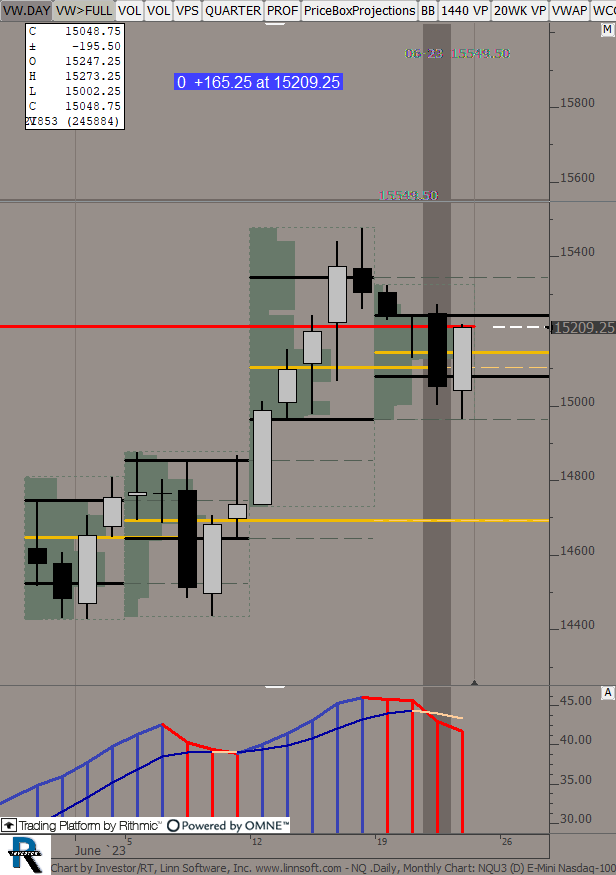 |
NQ Daily Monthly Chart (NQU3) ES42 [totalcount]
3 years 1 month ago
This chart was uploaded by Investor/RT 15.1.16 showing symbol: NQU3. |
View |
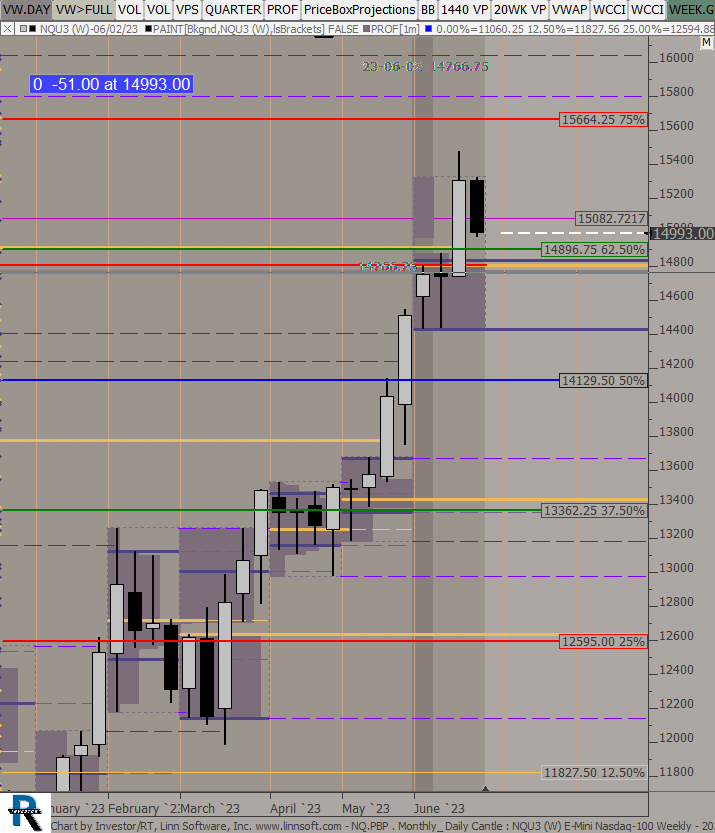 |
NQPBP Monthly Daily Cantle (NQU3) ES42 [totalcount]
3 years 1 month ago
This chart was uploaded by Investor/RT 15.1.16 showing symbol: NQU3. |
View |
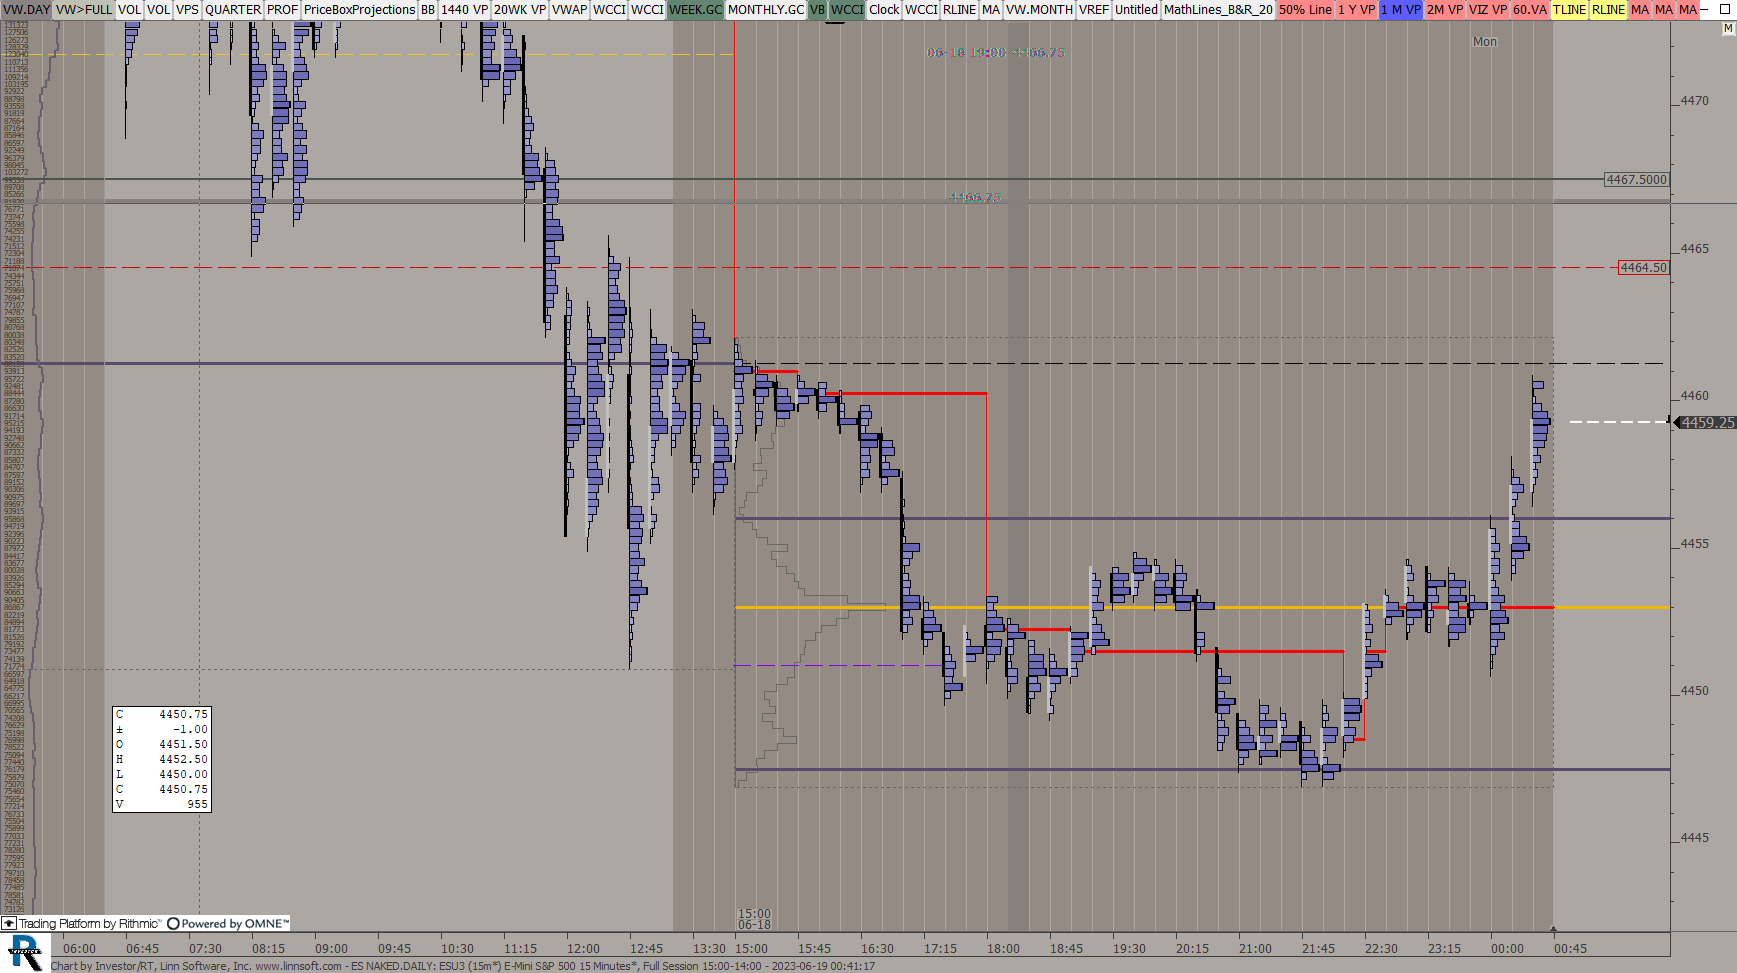 |
ES NAKEDDAILY (ESU3) ES42 [totalcount]
3 years 1 month ago
This chart was uploaded by Investor/RT 15.1.16 showing symbol: ESU3. |
View |
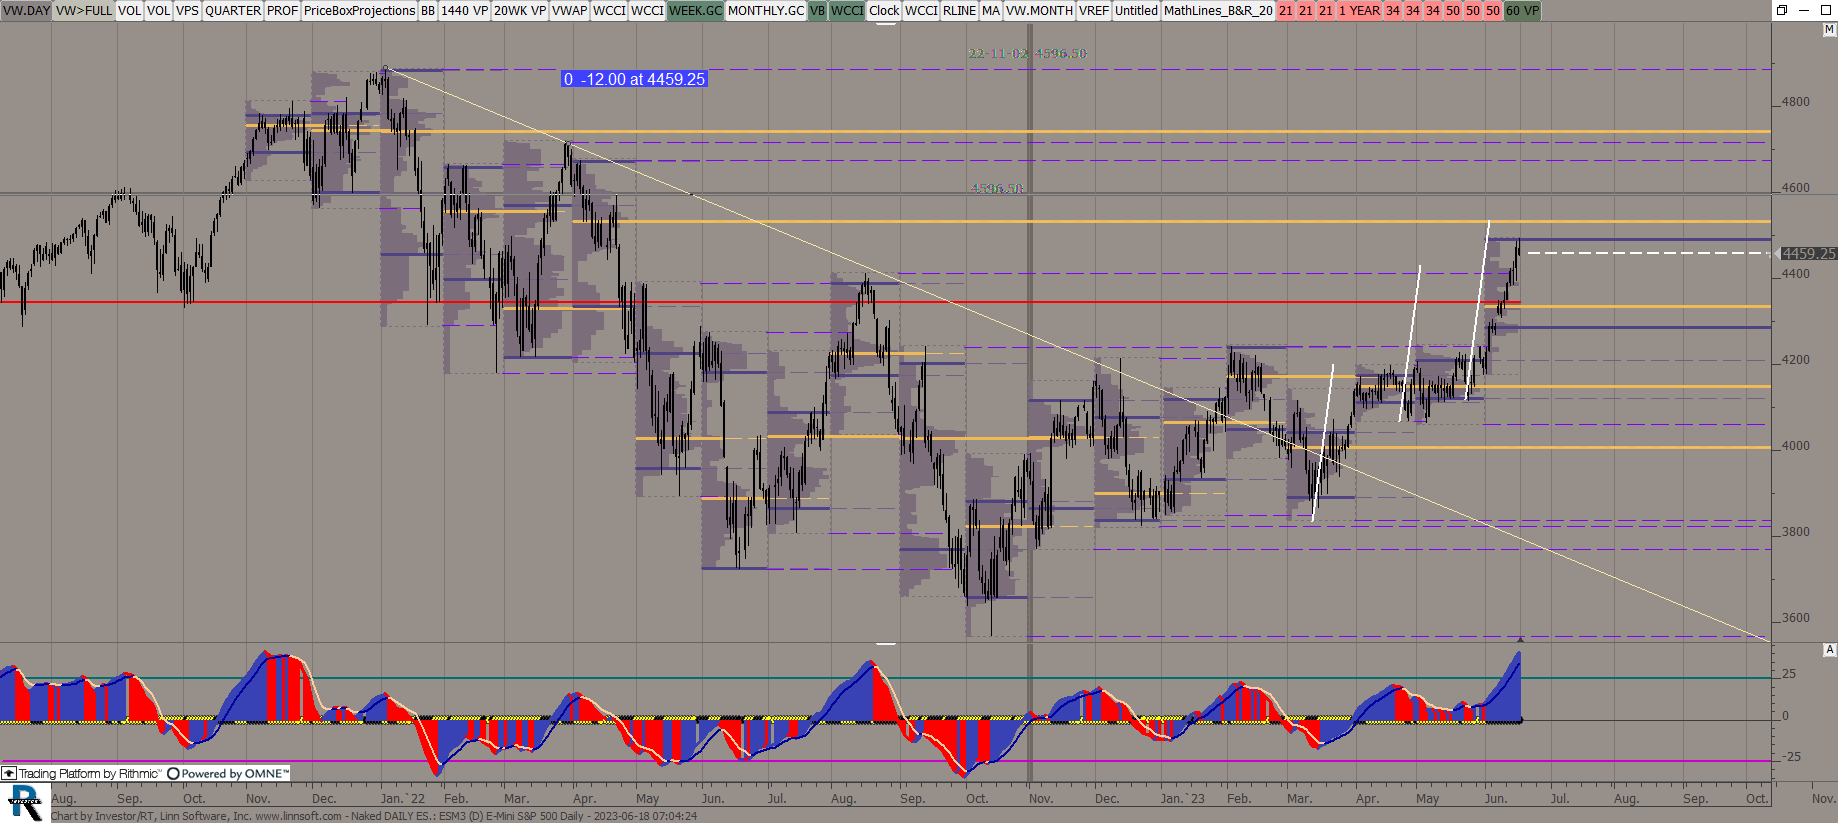 |
Naked DAILY ES (ESM3) ES42 [totalcount]
3 years 1 month ago
This chart was uploaded by Investor/RT 15.1.16 showing symbol: ESM3. |
View |
 |
NQWEEKLY TPORainbow Days (NQM3) ES42 [totalcount]
3 years 1 month ago
This chart was uploaded by Investor/RT 14.5.4 showing symbol: NQM3. |
View |
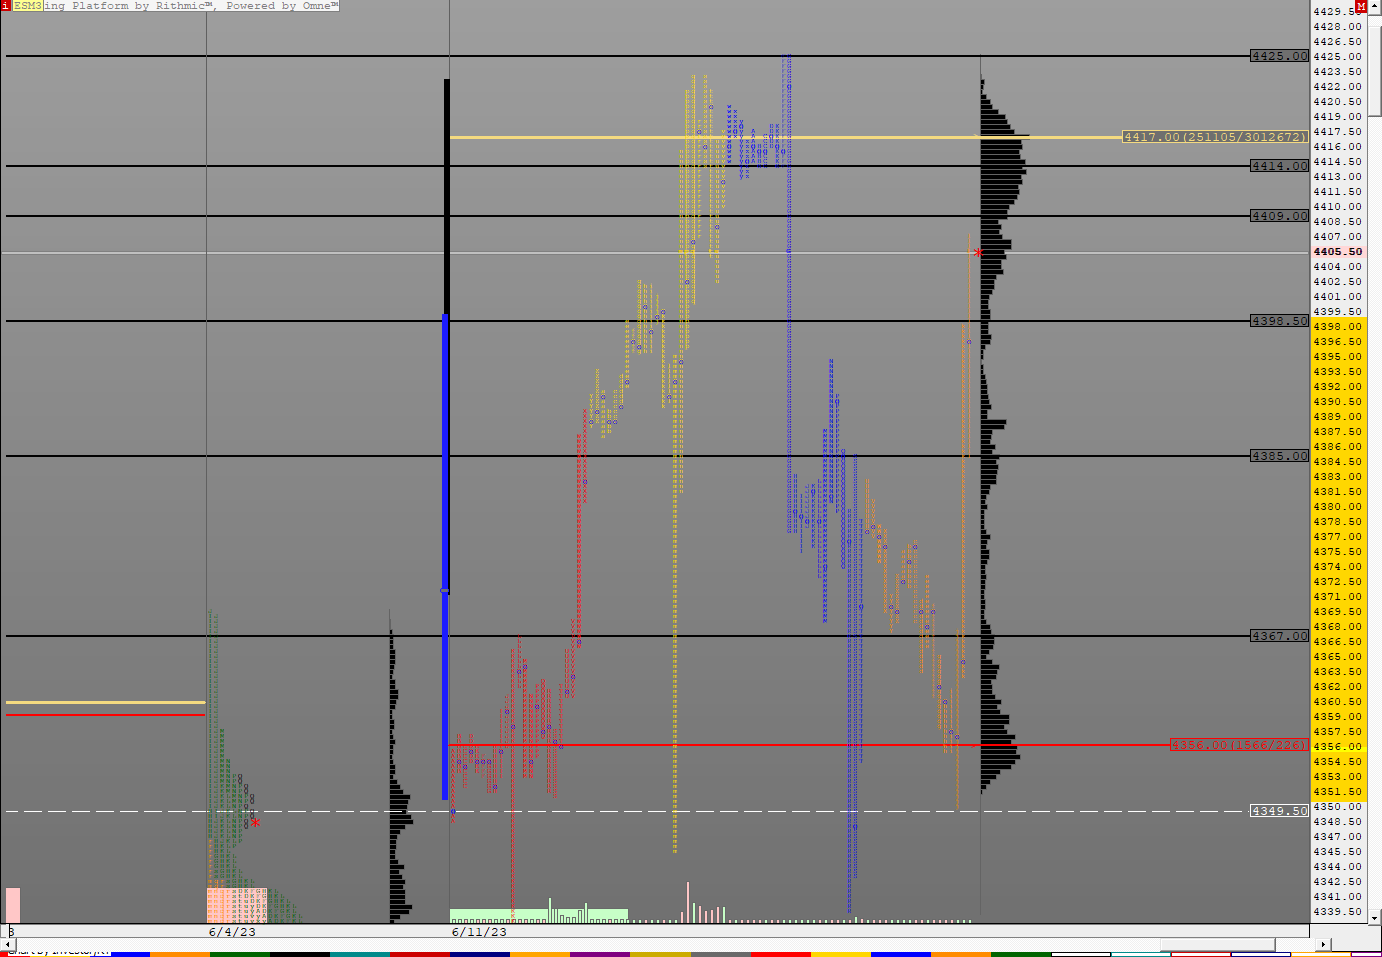 |
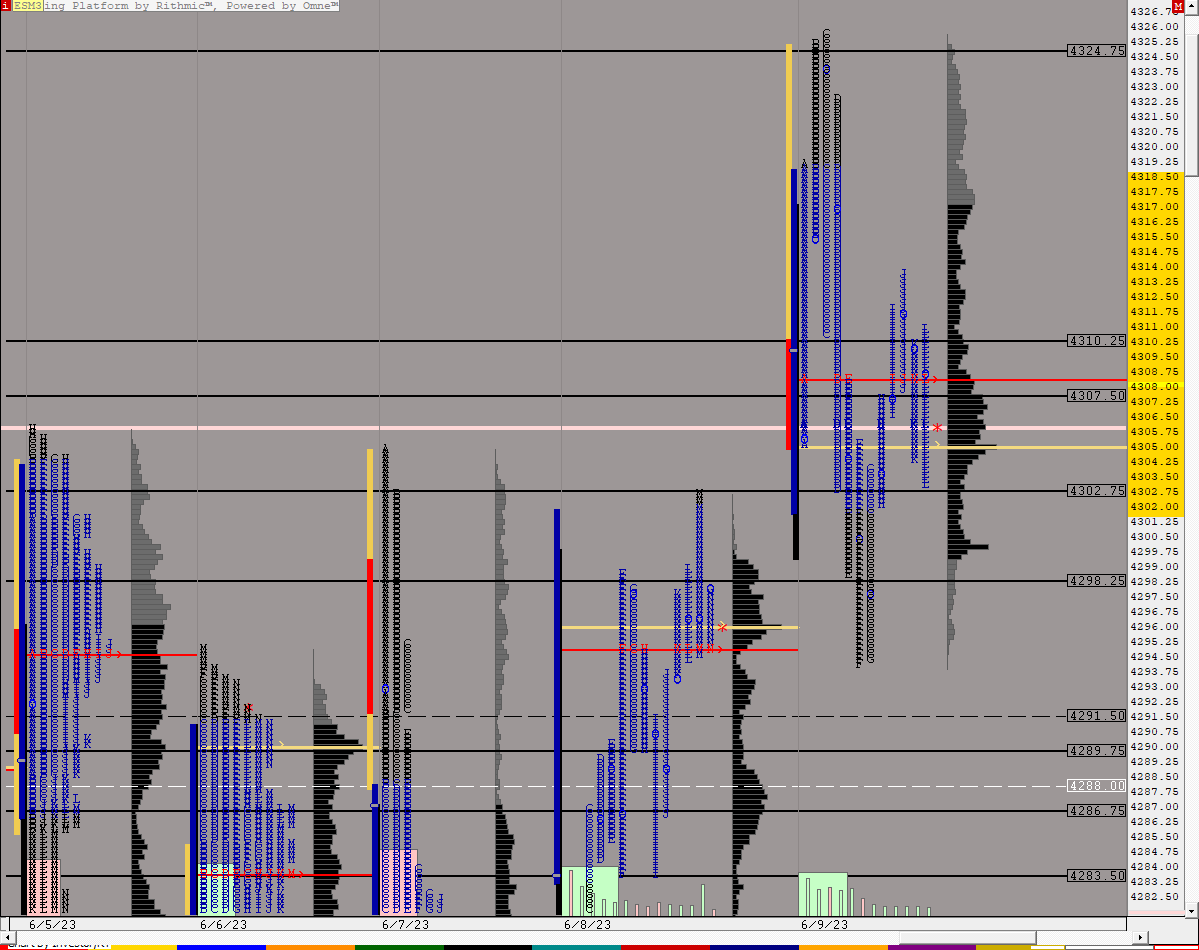
ES WEEKLY TPO VALUE (ESM3) ES42 [totalcount]
3 years 1 month ago
This chart was uploaded by Investor/RT 14.5.6 showing symbol: ESM3. |
View |
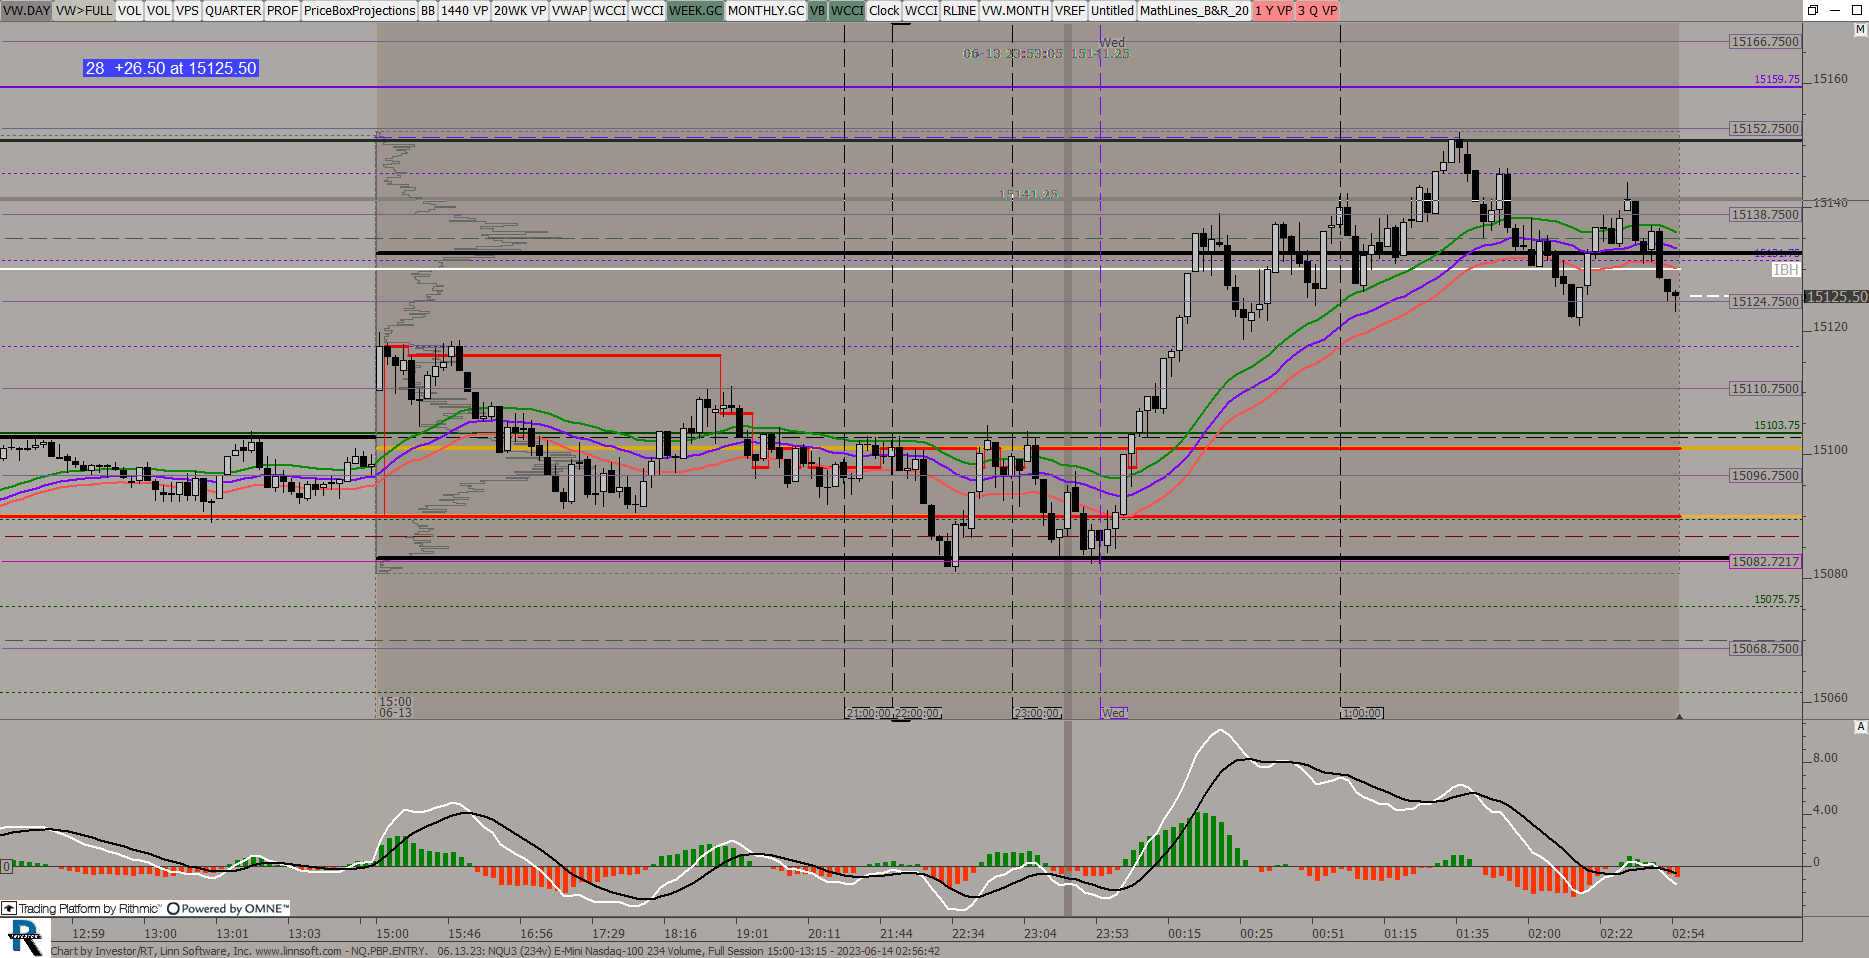 |
NQPBPENTRY (NQU3) ES42 [totalcount]
3 years 1 month ago
This chart was uploaded by Investor/RT 15.1.16 showing symbol: NQU3. |
View |
 |
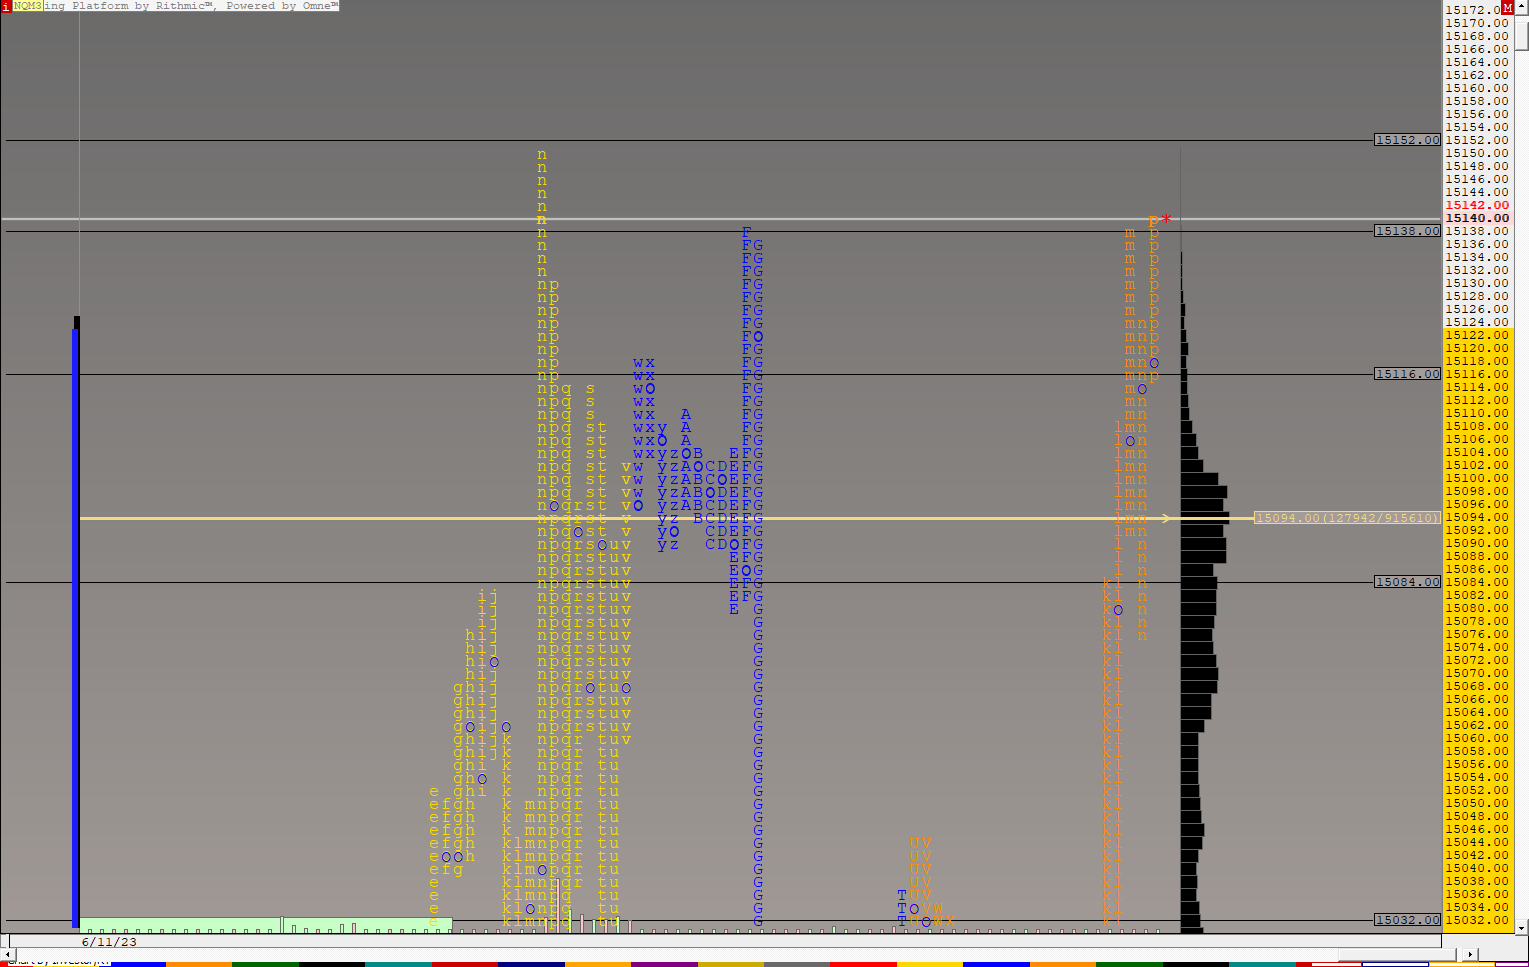
NQTPODAILY (NQM3) ES42 [totalcount]
3 years 1 month ago
This chart was uploaded by Investor/RT 14.5.6 showing symbol: NQM3. |
View |
 |
DAYNQ (NQU3) ES42 [totalcount]
3 years 1 month ago
This chart was uploaded by Investor/RT 15.1.16 showing symbol: NQU3. |
View |
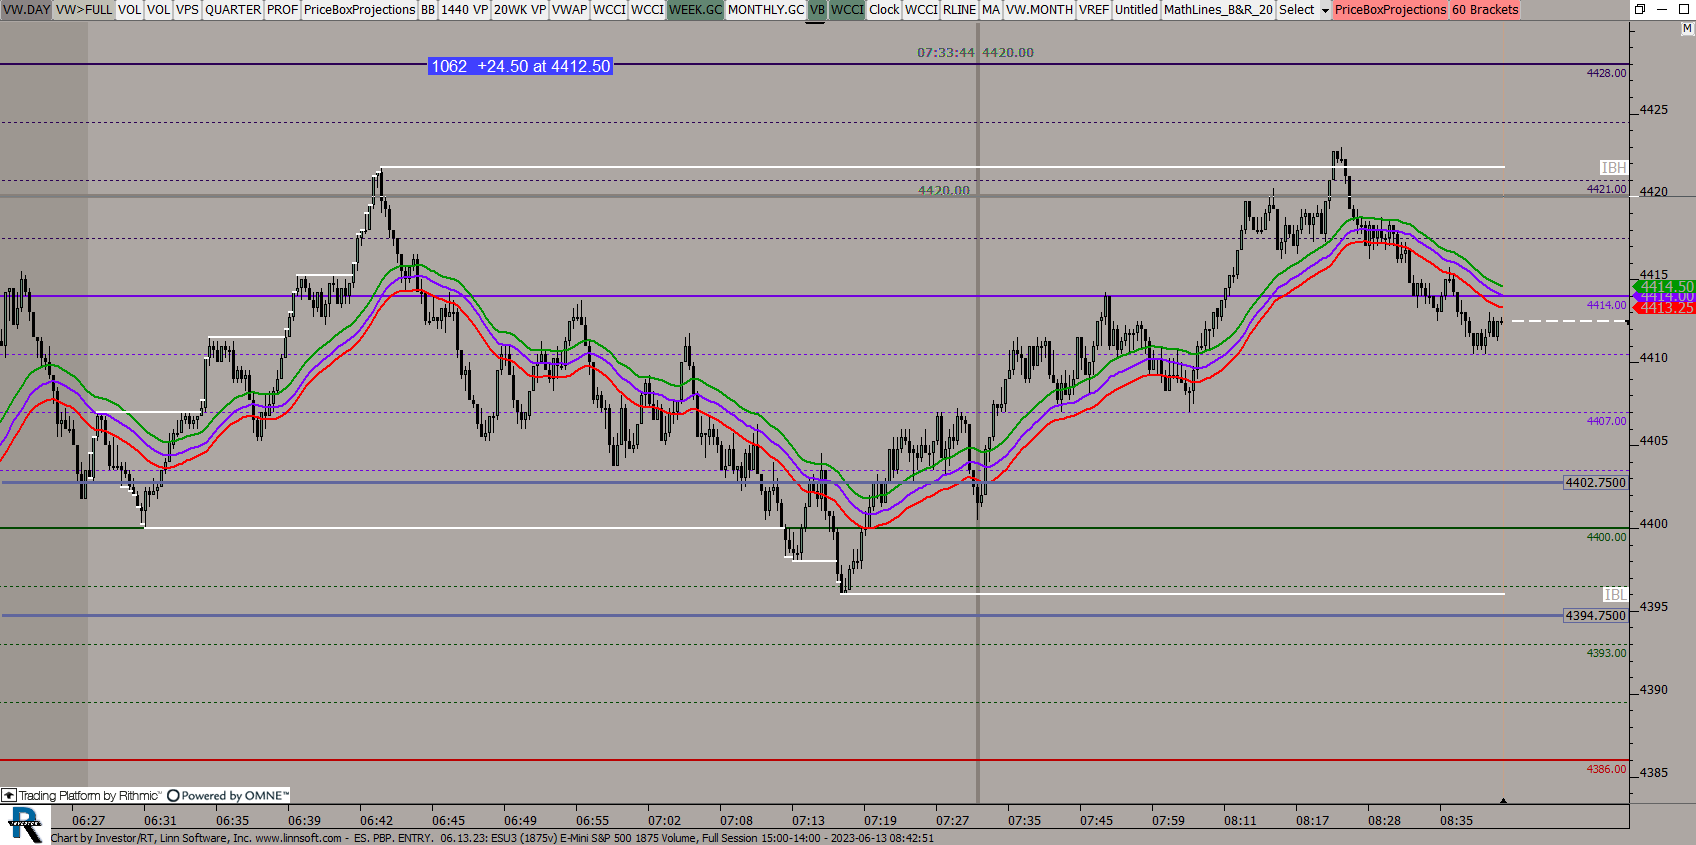 |
ES PBP ENTRY (ESU3) ES42 [totalcount]
3 years 1 month ago
This chart was uploaded by Investor/RT 15.1.16 showing symbol: ESU3. |
View |
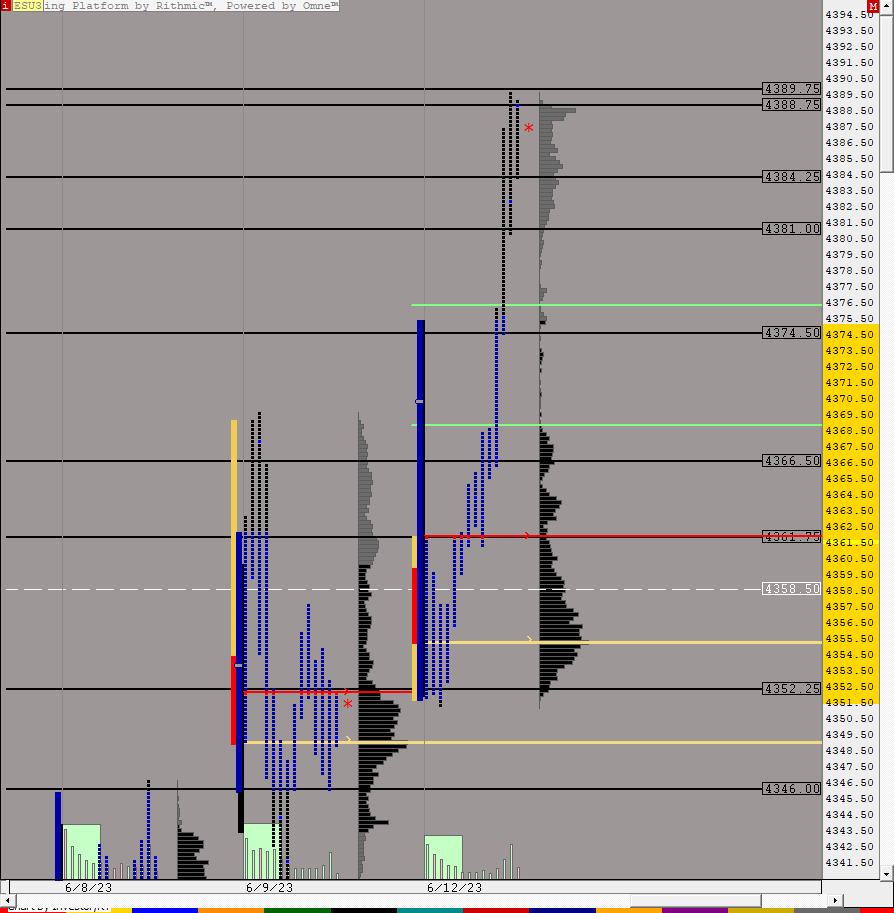 |
ESU contract (ESU3) ES42 [totalcount]
3 years 1 month ago
This chart was uploaded by Investor/RT 15.1.16 showing symbol: ESU3. |
View |
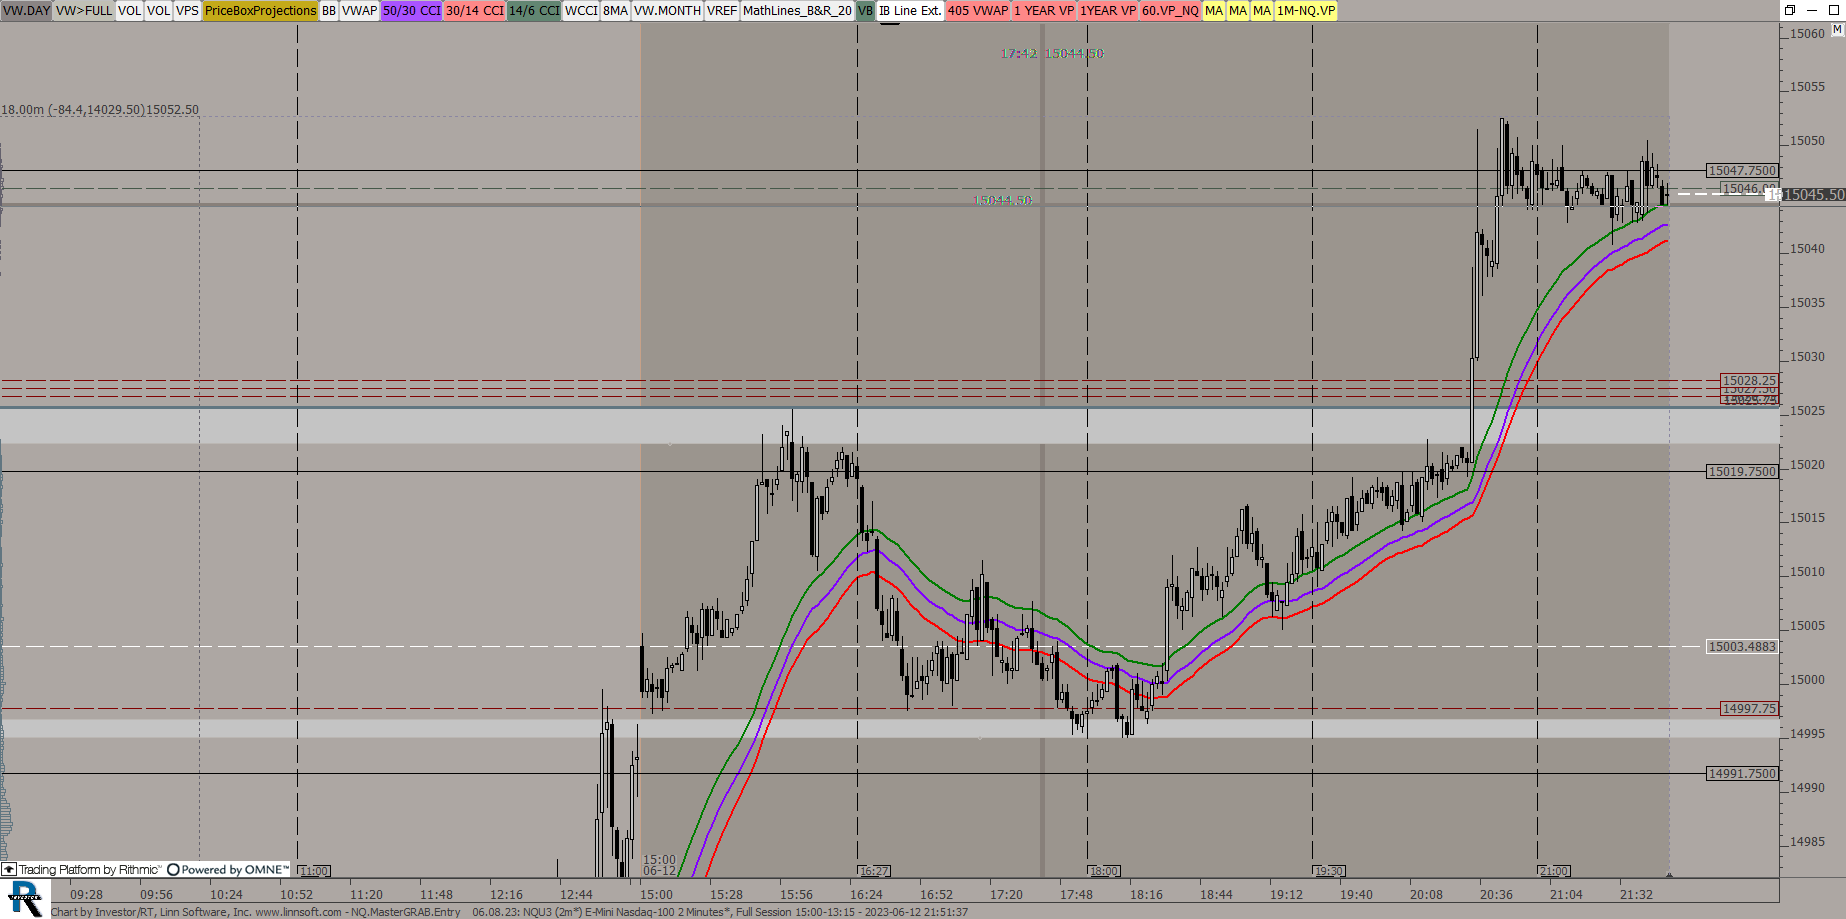 |
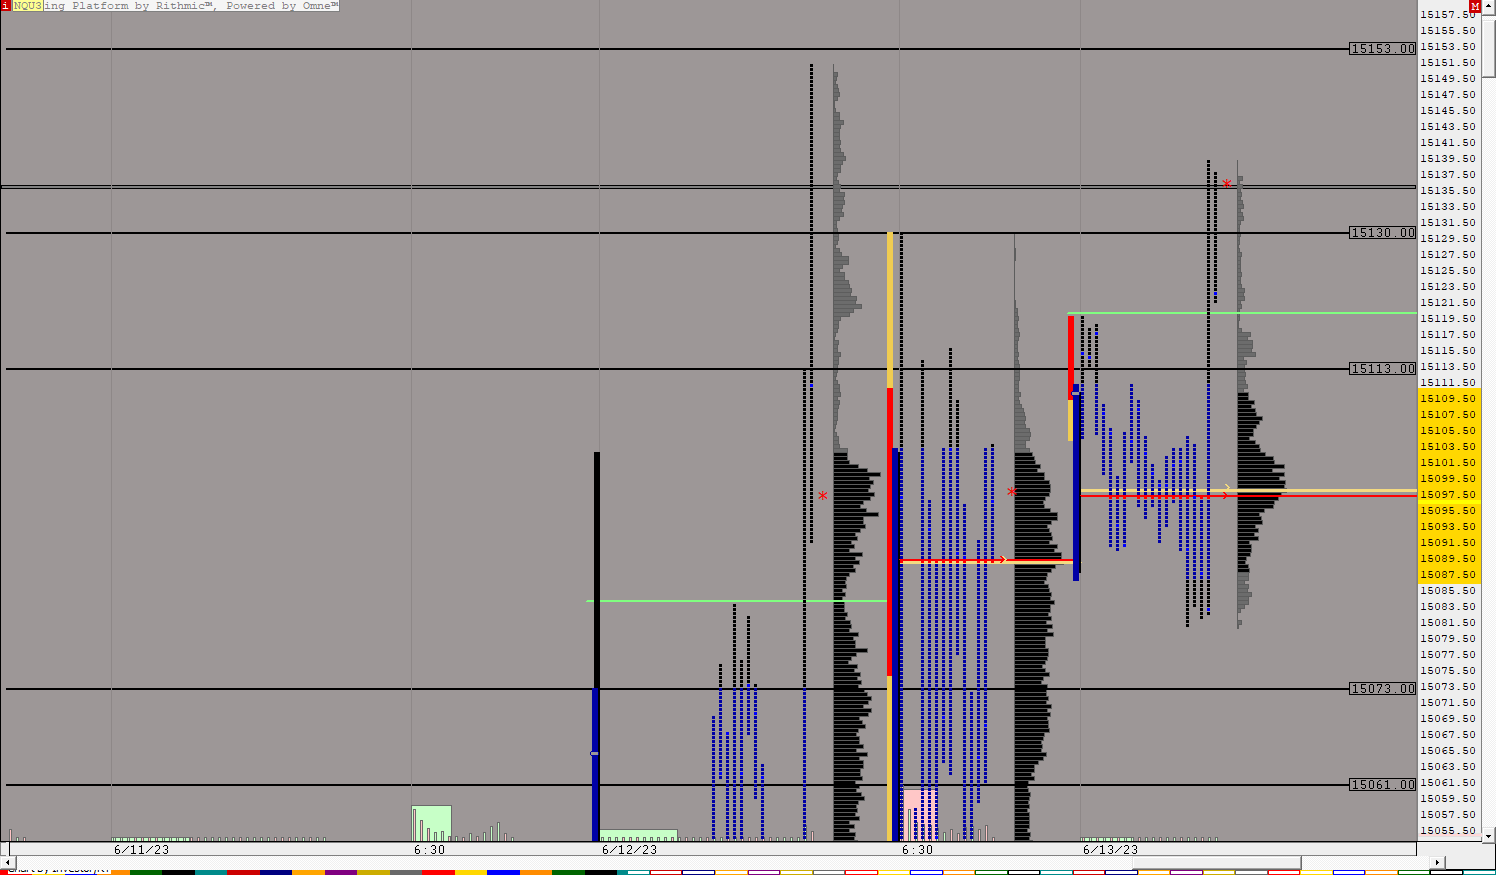
NQMasterGRABEntry (NQU3) ES42 [totalcount]
3 years 1 month ago
This chart was uploaded by Investor/RT 15.1.16 showing symbol: NQU3. |
View |
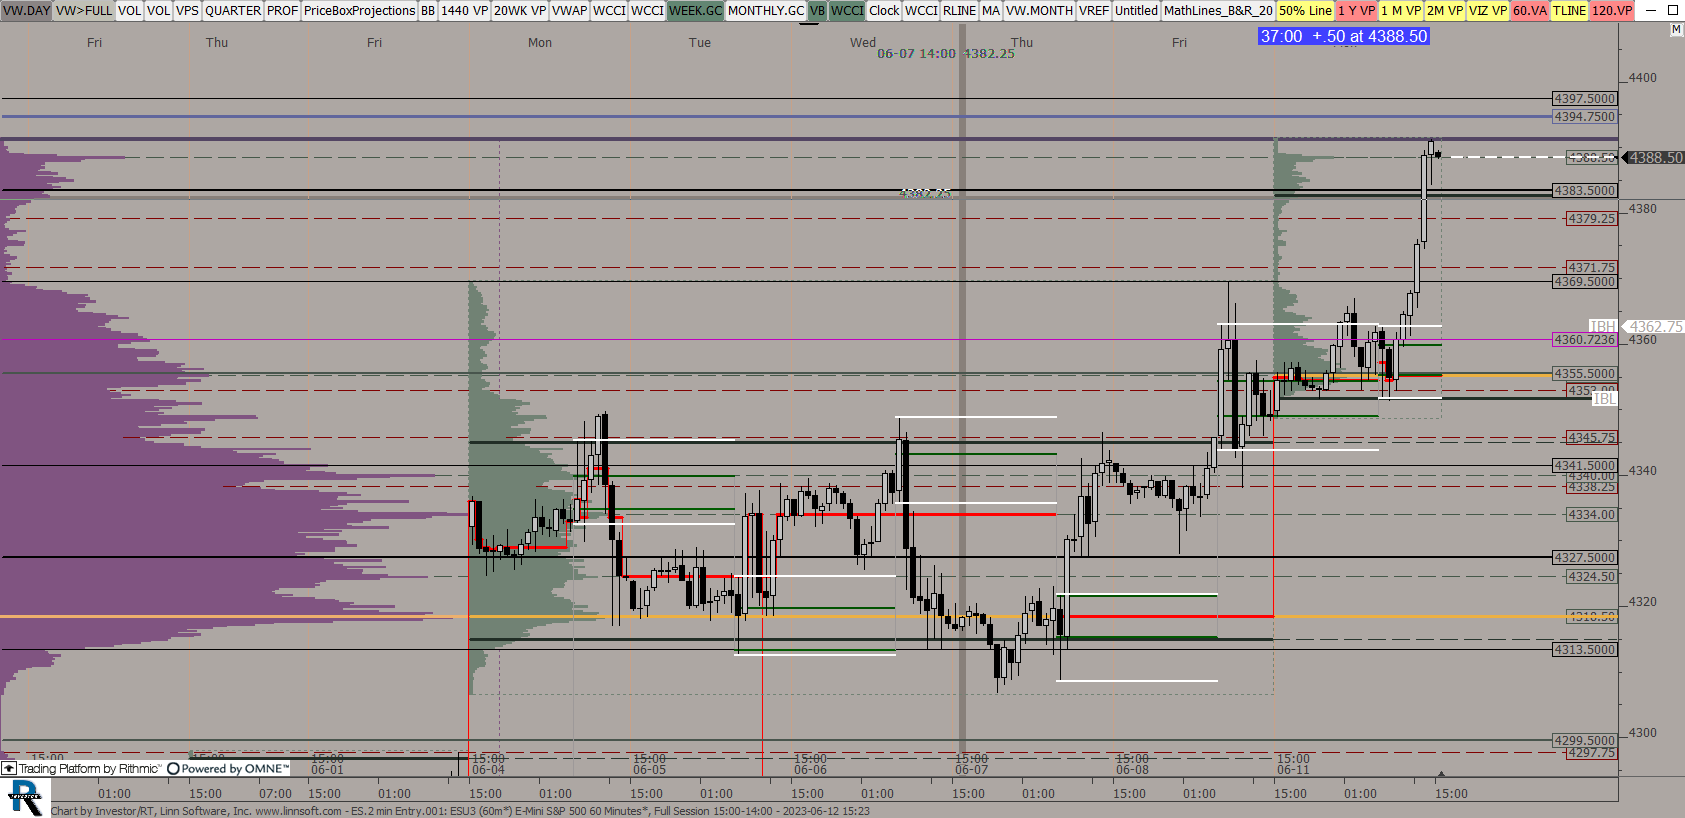 |
ES2 min Entry (ESU3) ES42 [totalcount]
3 years 1 month ago
This chart was uploaded by Investor/RT 15.1.16 showing symbol: ESU3. |
View |
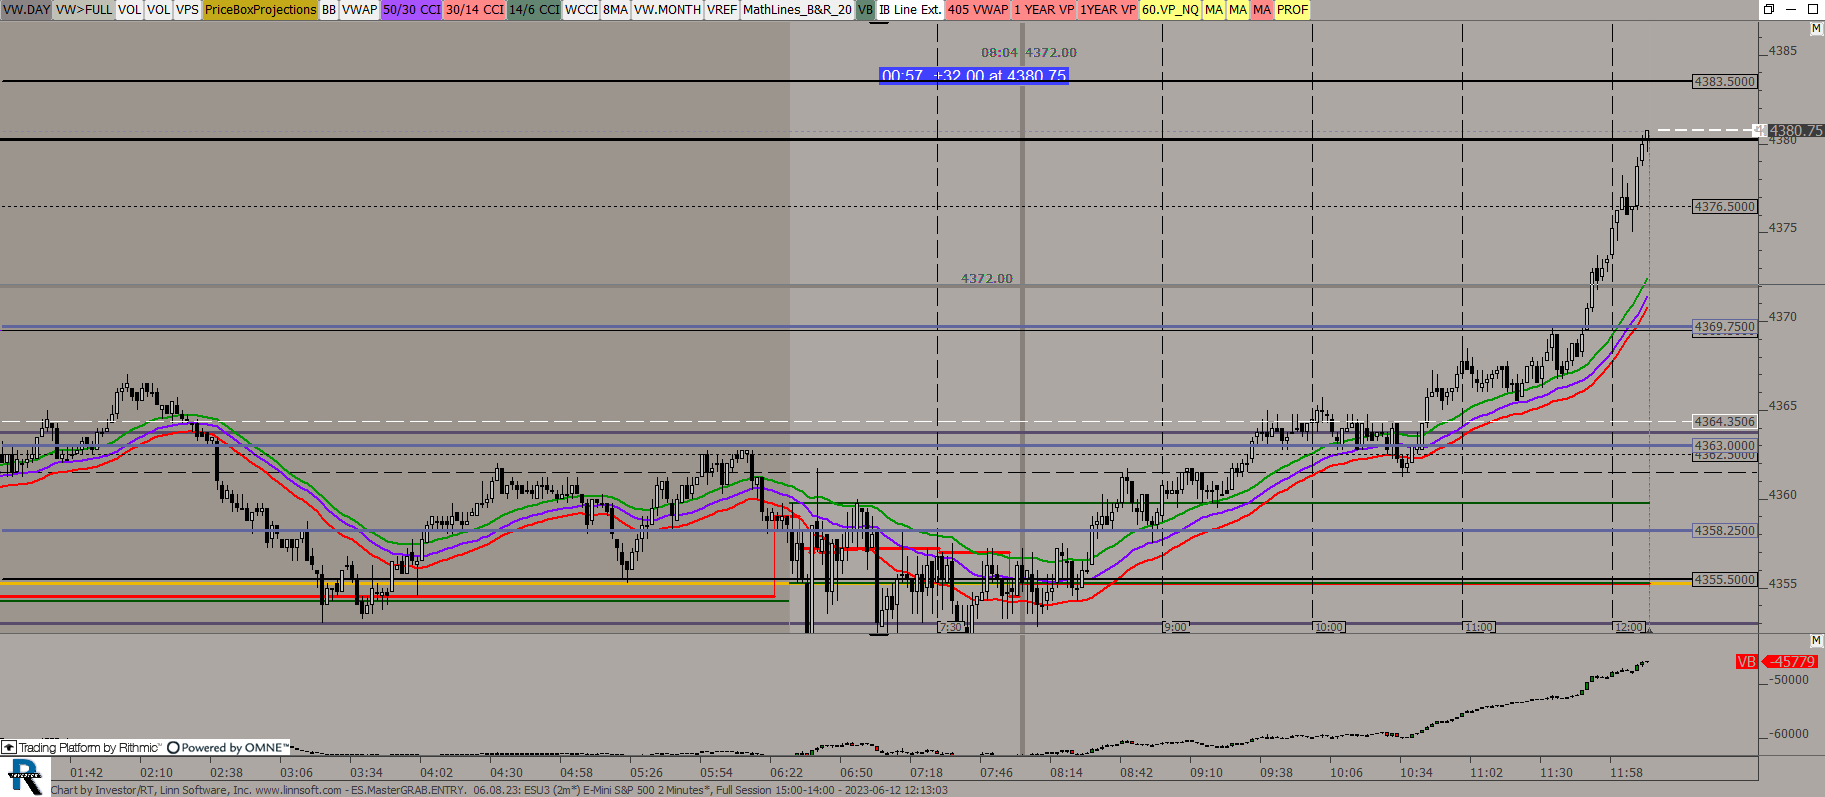 |
ESMasterGRABENTRY (ESU3) ES42 [totalcount]
3 years 1 month ago
This chart was uploaded by Investor/RT 15.1.16 showing symbol: ESU3. |
View |
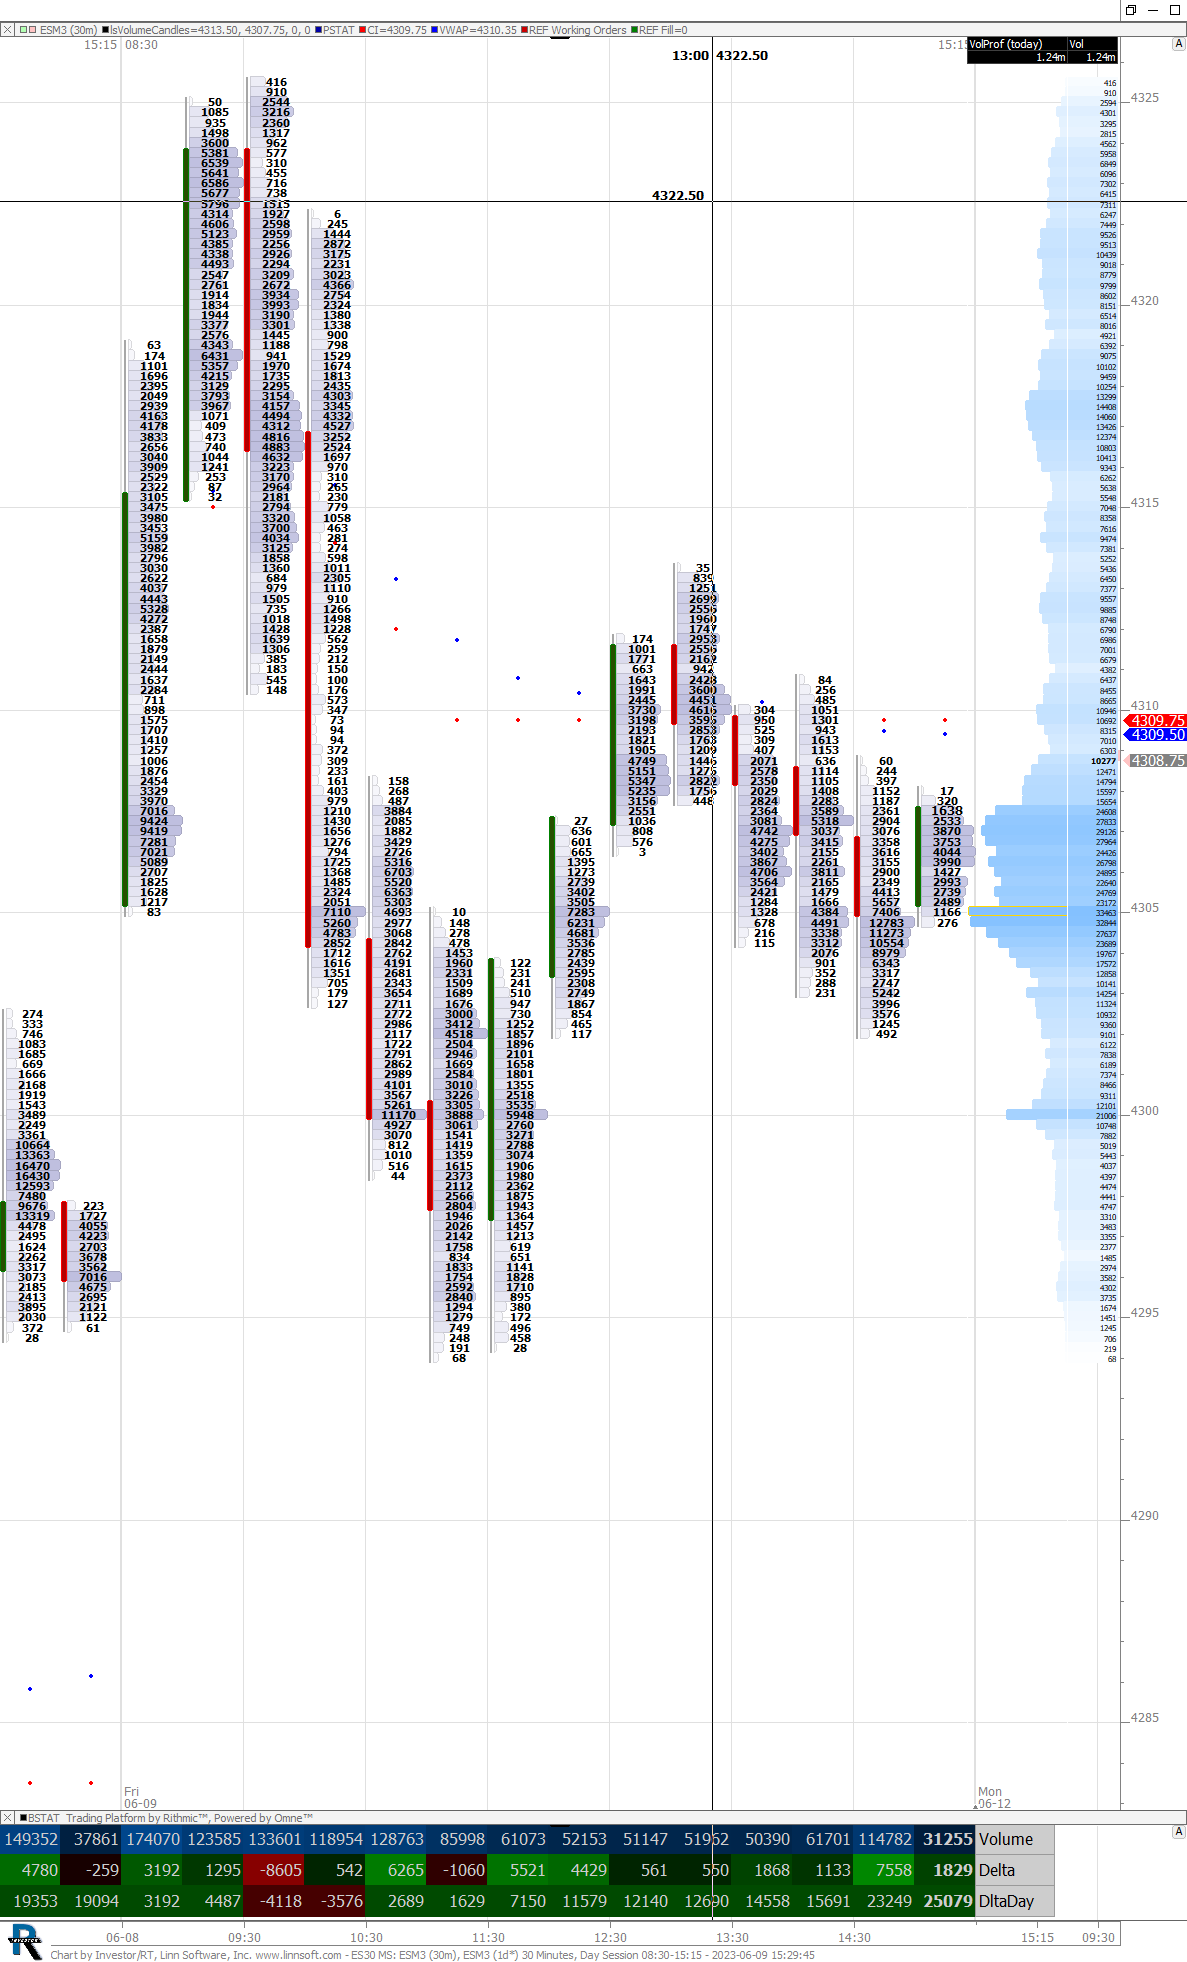 |
ES30 MS (ESM3) sp500trader [totalcount]
3 years 1 month ago
This chart was uploaded by Investor/RT 15.1.16 showing symbol: ESM3. |
View |
 |
DAY ES (ESM3) ES42 [totalcount]
3 years 1 month ago
This chart was uploaded by Investor/RT 14.5.6 showing symbol: ESM3. |
View |
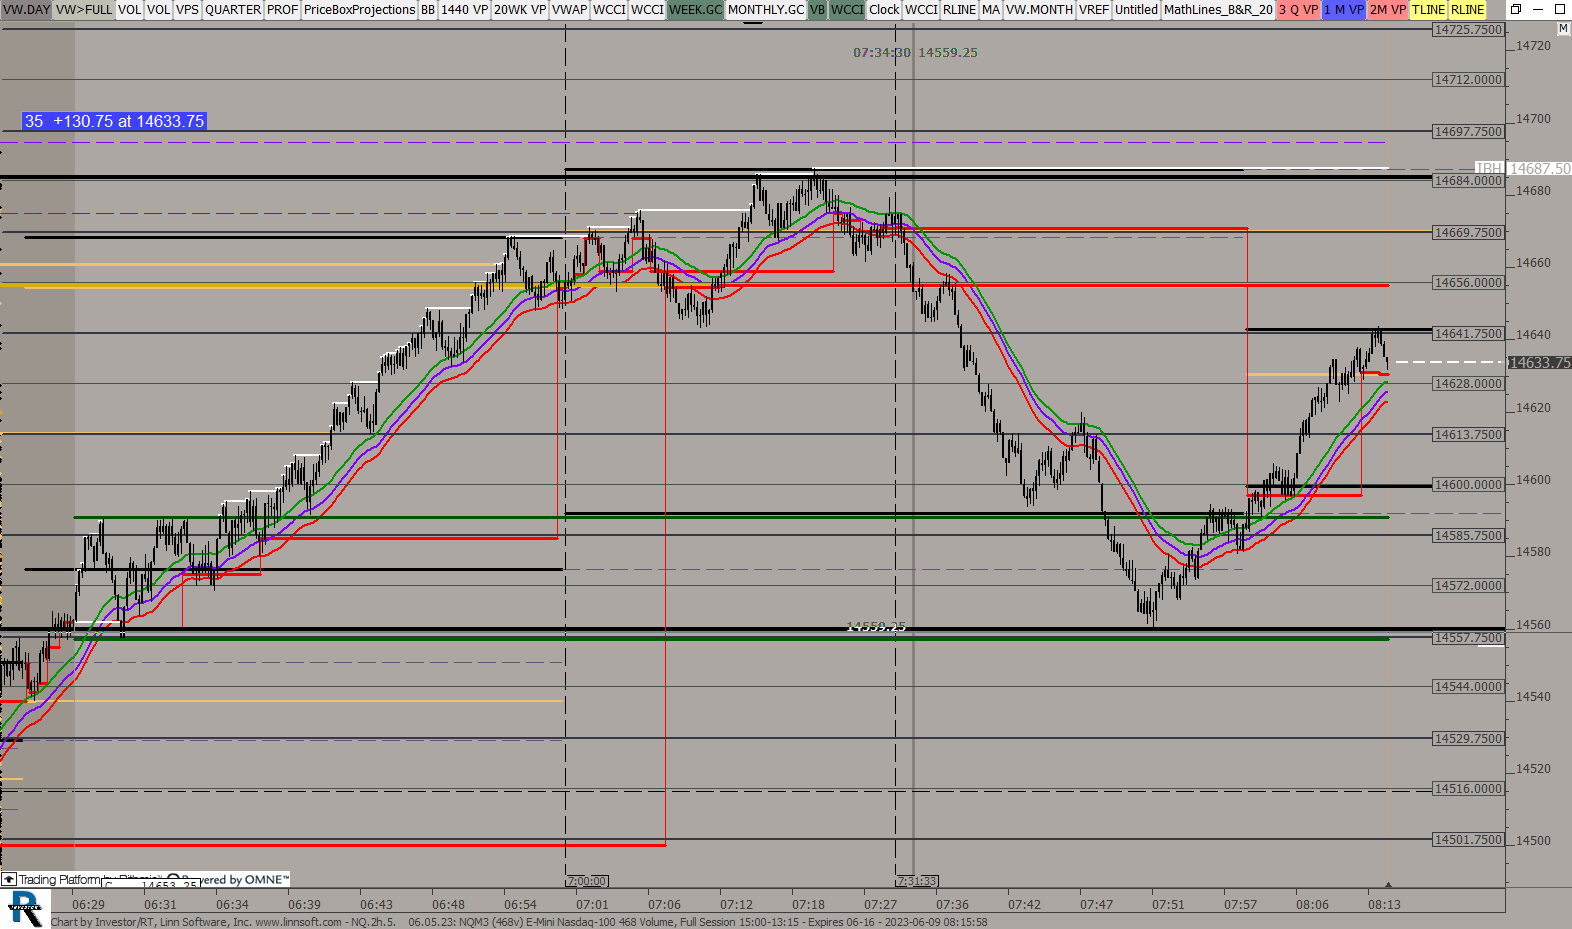 |
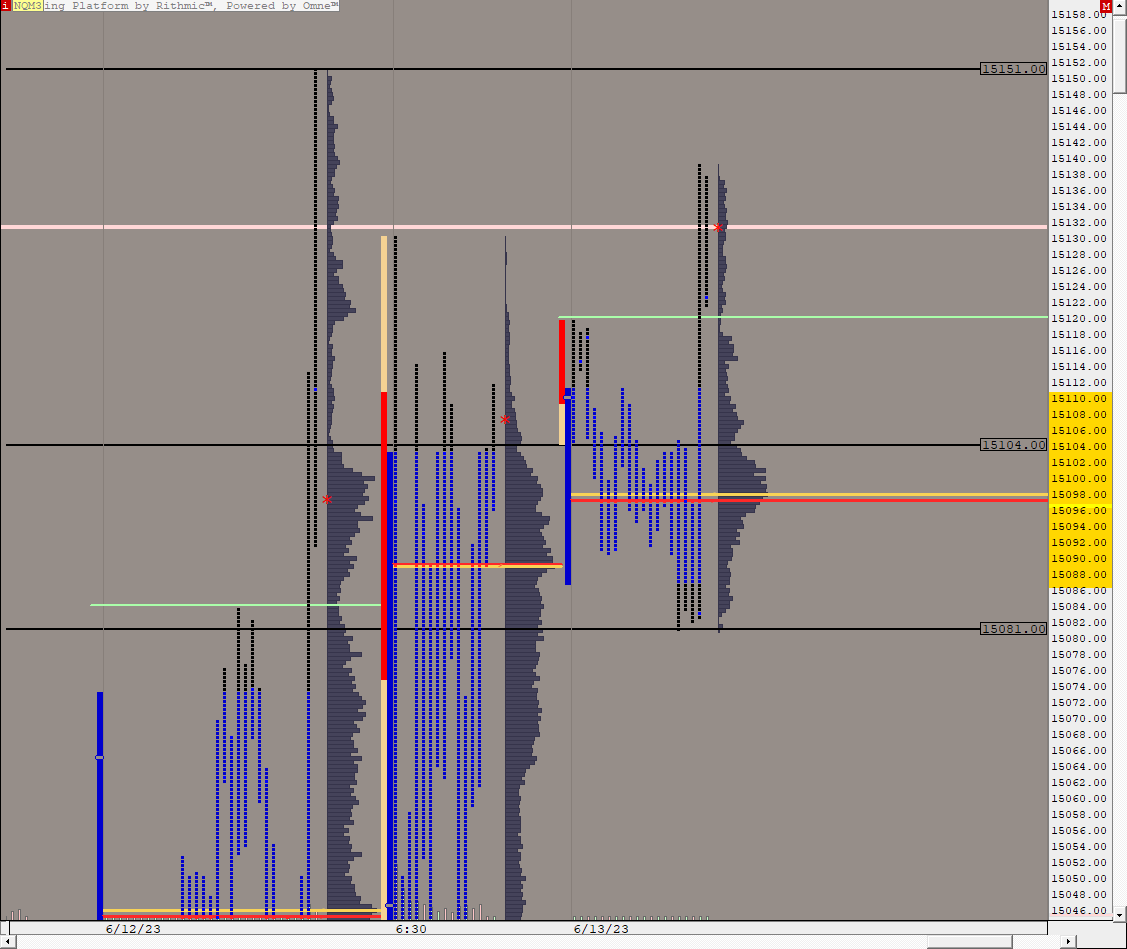
NQ2h5 (NQM3) ES42 [totalcount]
3 years 1 month ago
This chart was uploaded by Investor/RT 15.1.16 showing symbol: NQM3. |
View |
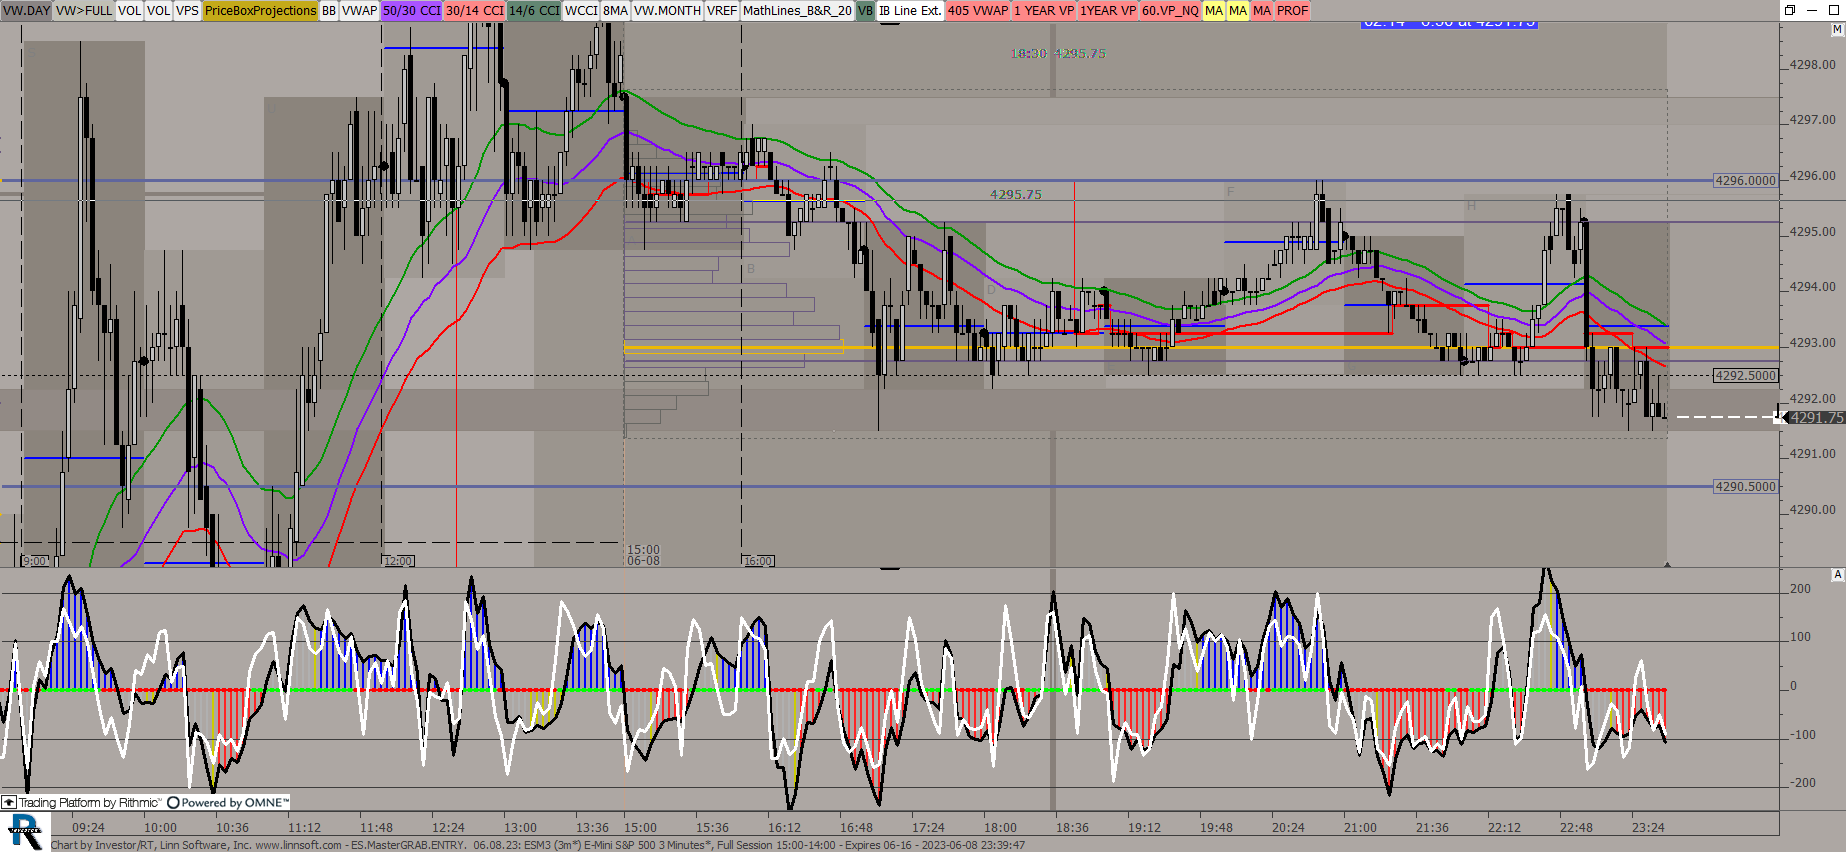 |
ESMasterGRABENTRY (ESM3) ES42 [totalcount]
3 years 1 month ago
This chart was uploaded by Investor/RT 15.1.16 showing symbol: ESM3. |
View |
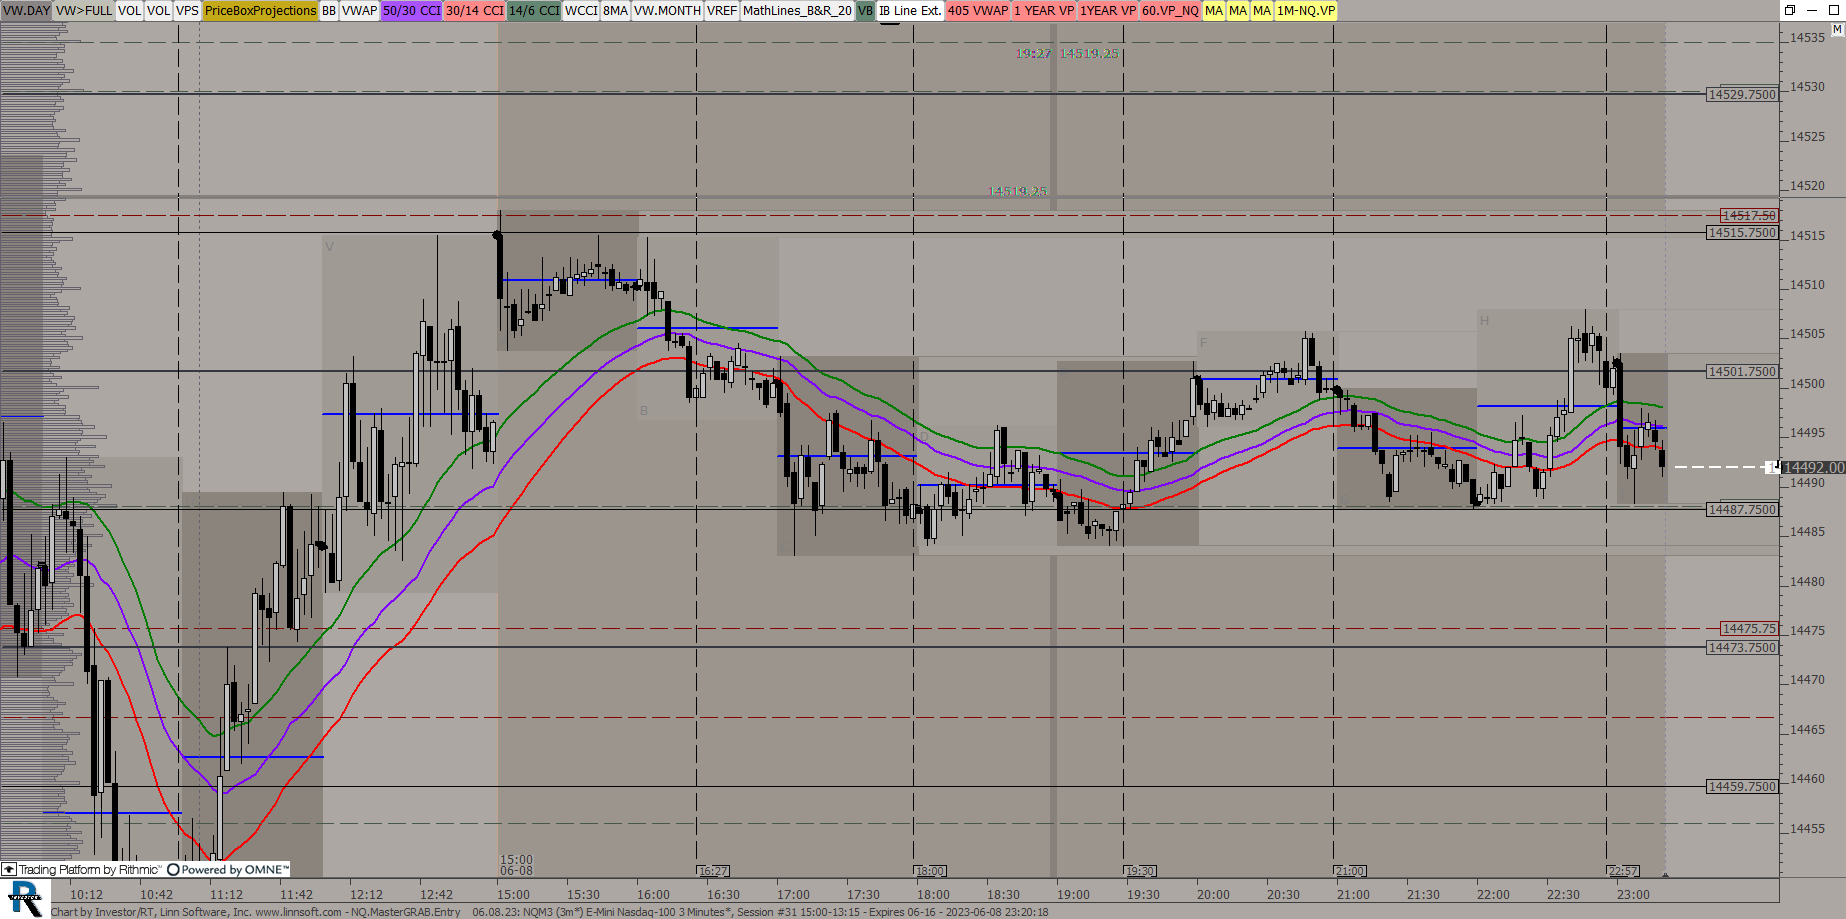 |
NQMasterGRABEntry (NQM3) ES42 [totalcount]
3 years 1 month ago
This chart was uploaded by Investor/RT 15.1.16 showing symbol: NQM3. |
View |
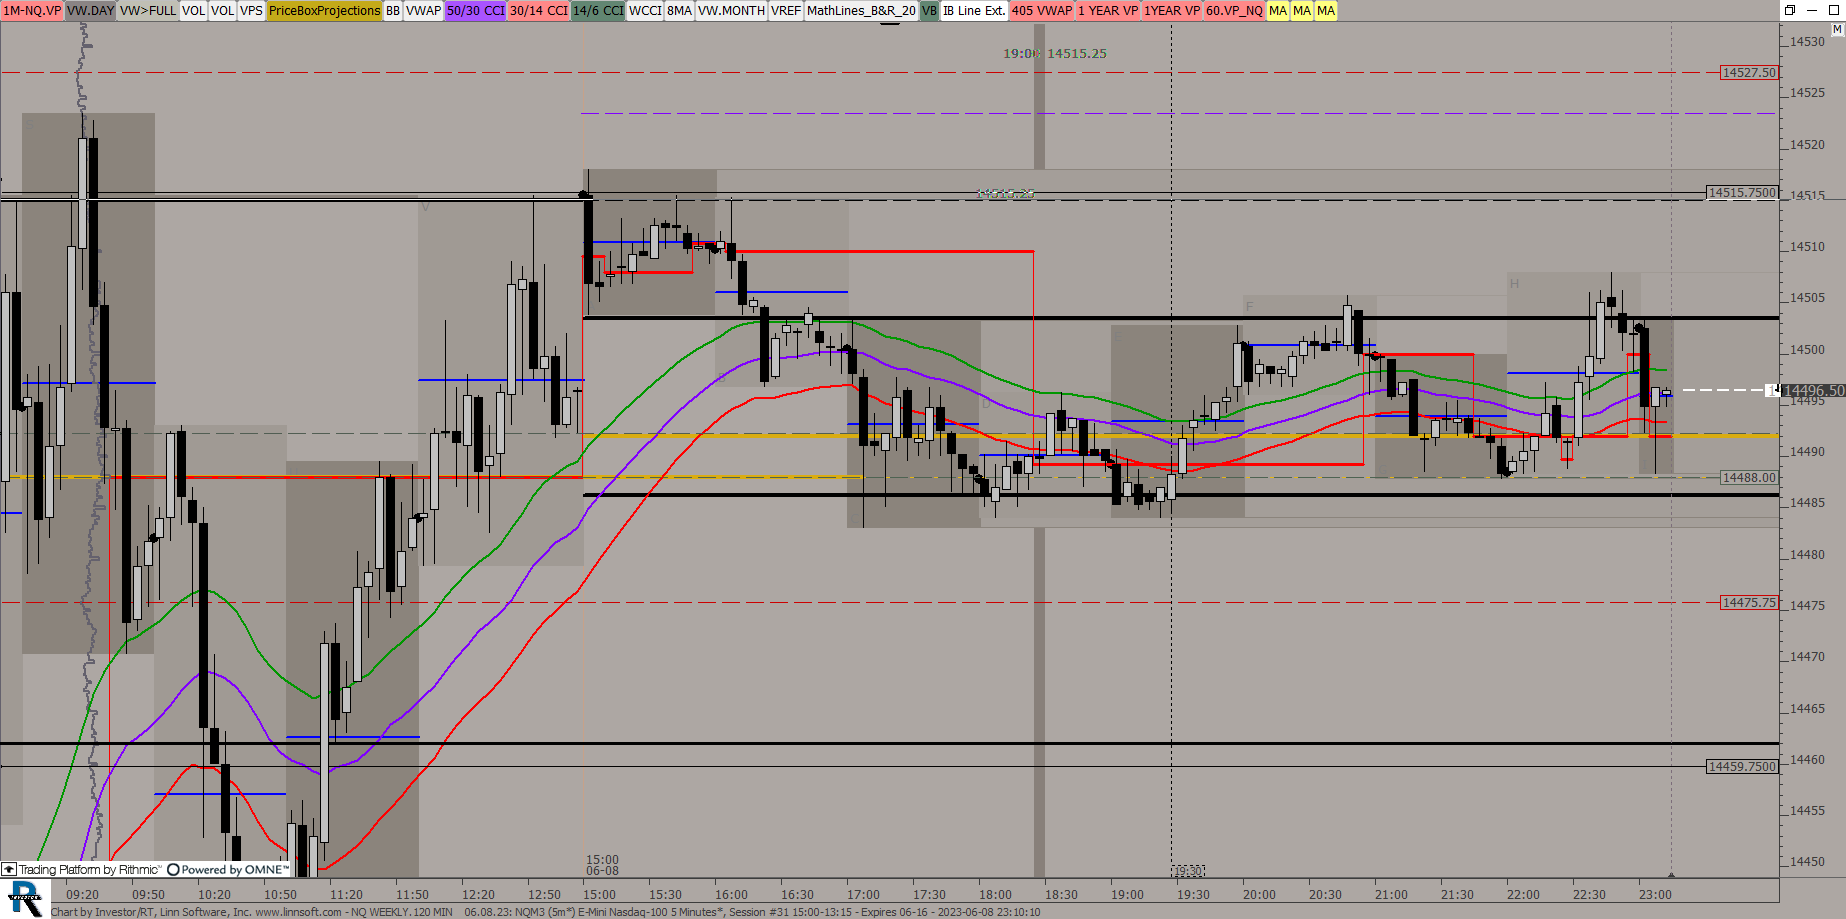 |
NQ WEEKLY120 MIN (NQM3) ES42 [totalcount]
3 years 1 month ago
This chart was uploaded by Investor/RT 15.1.16 showing symbol: NQM3. |
View |
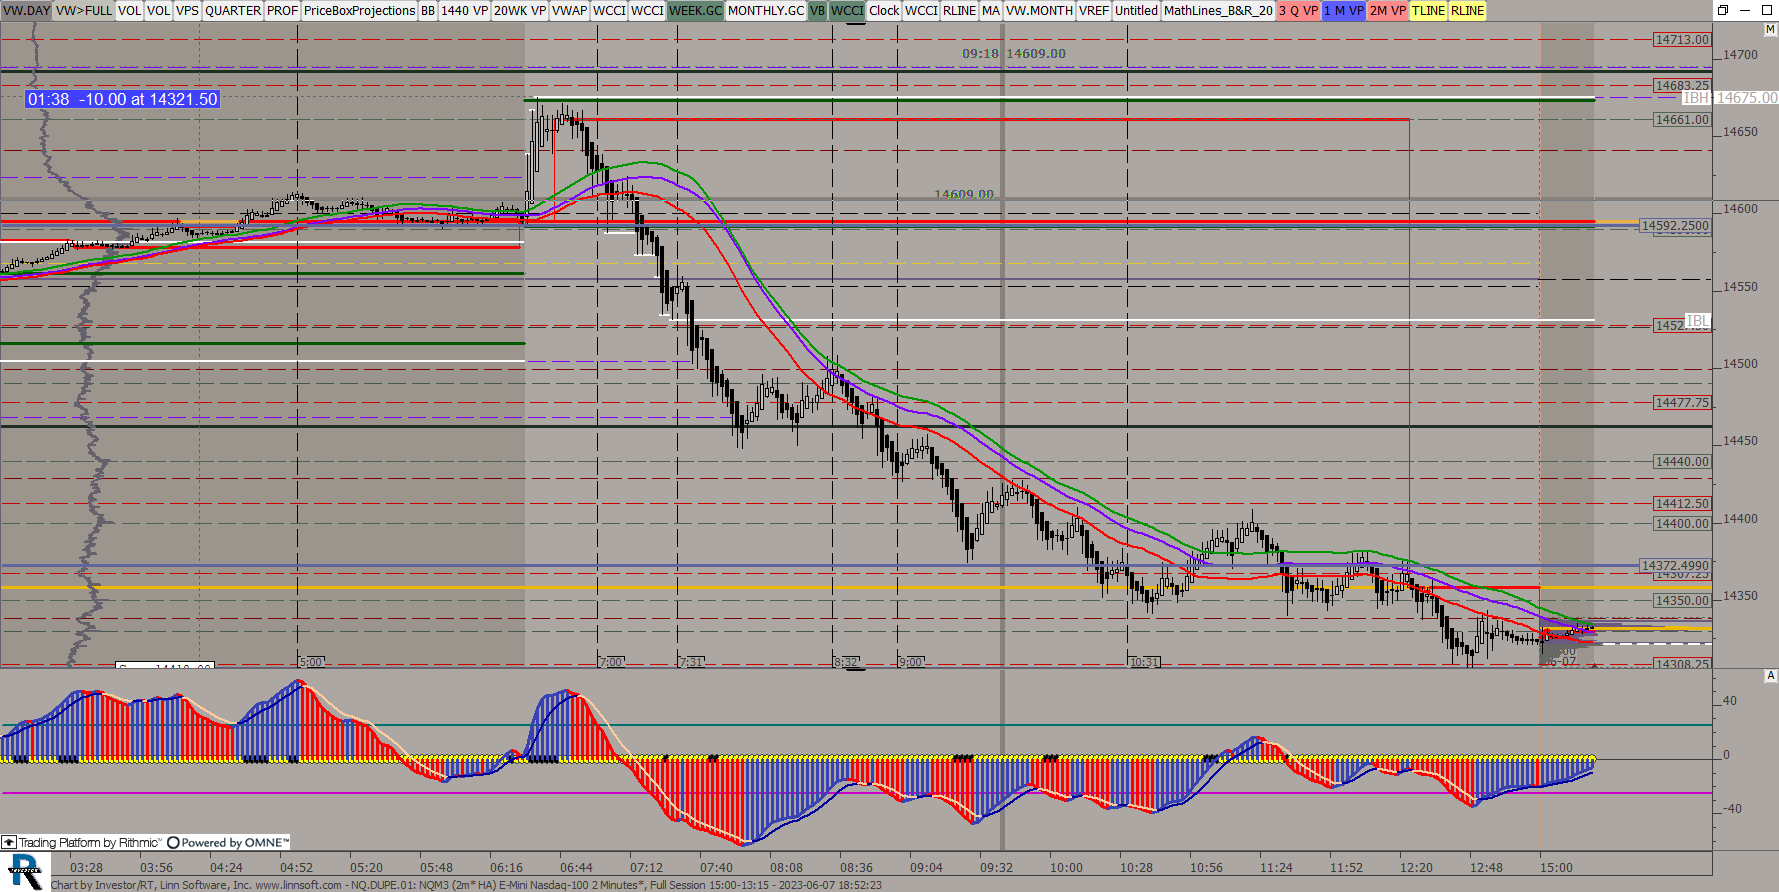 |
NQDUPE (NQM3) ES42 [totalcount]
3 years 1 month ago
This chart was uploaded by Investor/RT 15.1.16 showing symbol: NQM3. |
View |